CHAPTER 20 Process Cost Systems
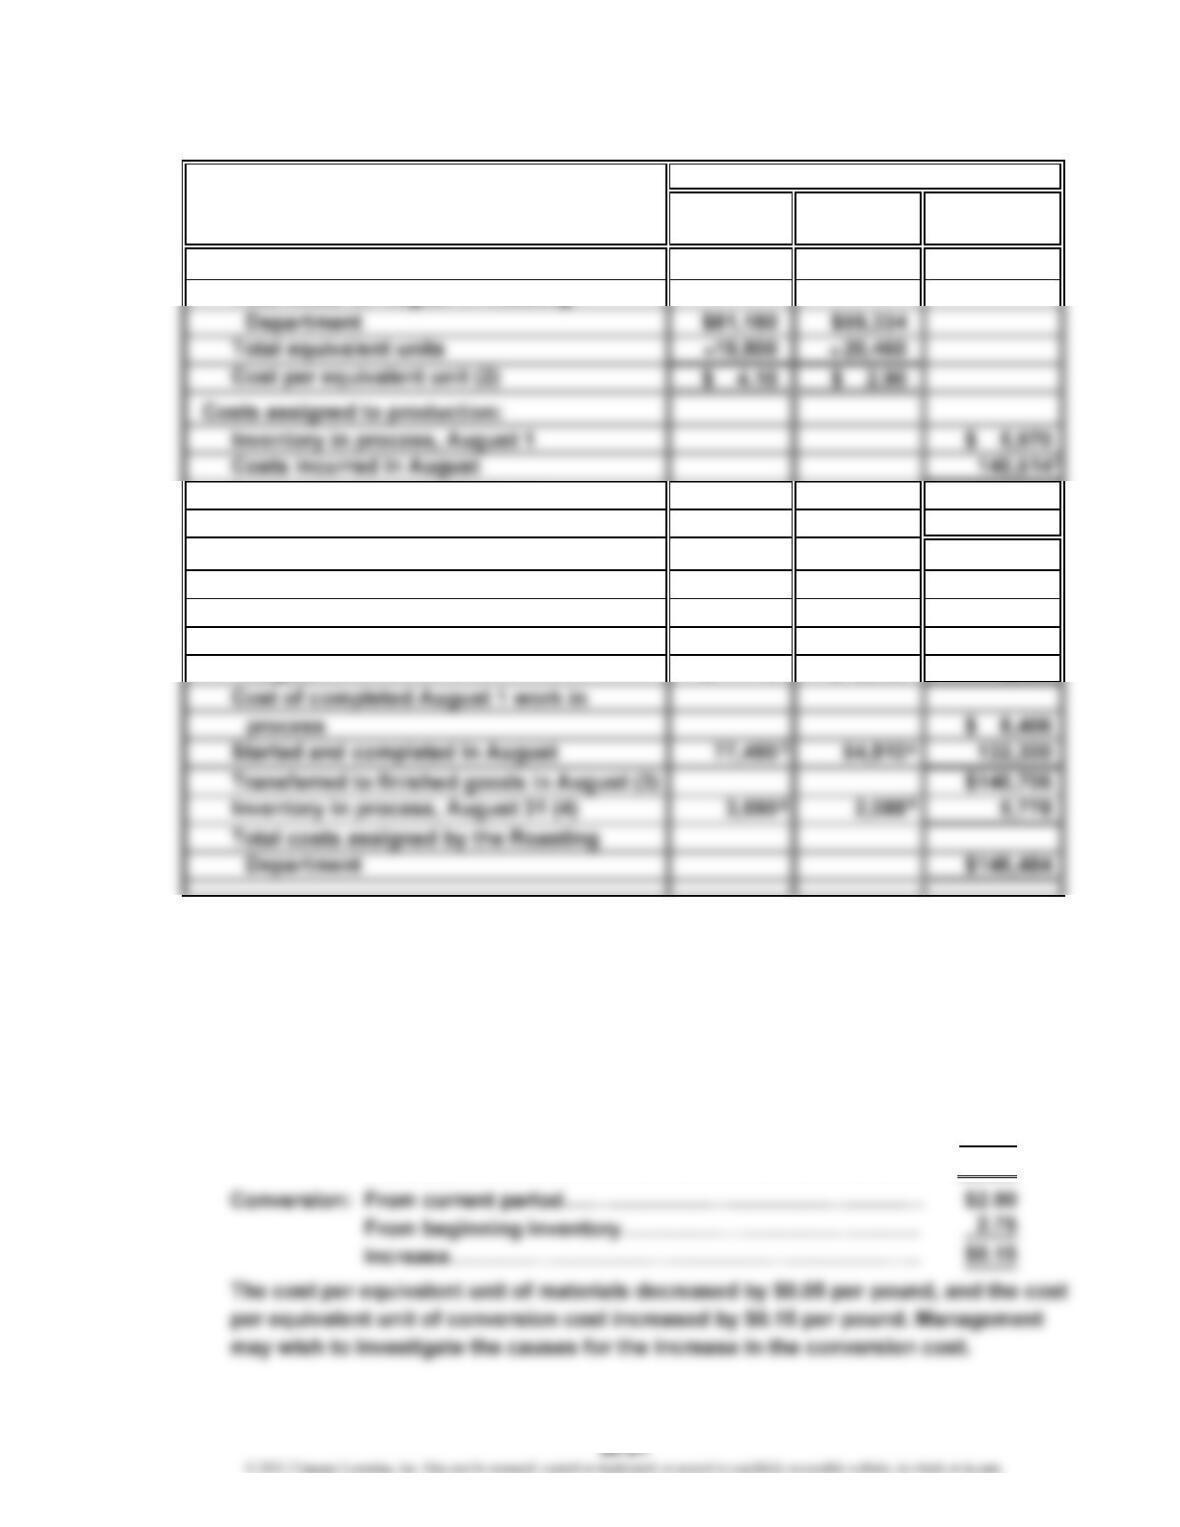
Ex. 20-16 (Concluded)
Direct
COSTS Materials Conversion Total
Costs per equivalent unit:
Total costs for August in Roasting
Total costs accounted for by the
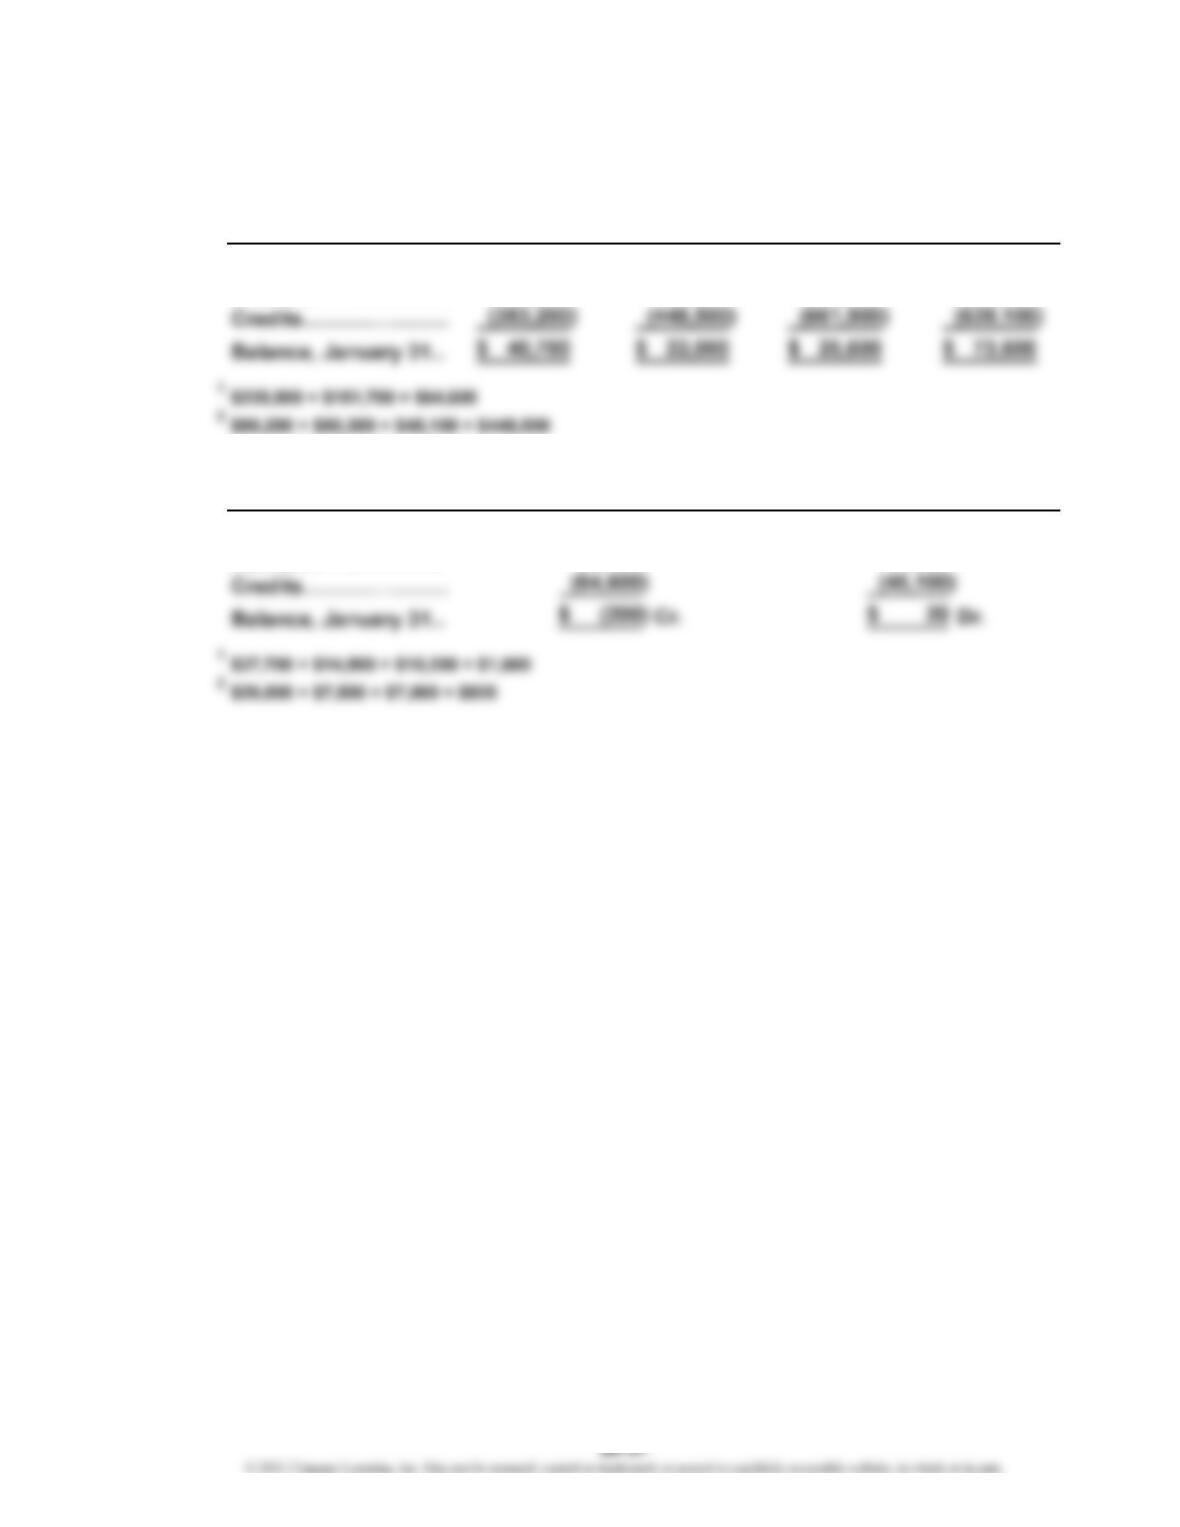
Roasting Department $146,484
Costs allocated to completed and
partially completed units:
Inventory in process, August 1 balance $ 5,970
To complete inventory in process,
August 1 $ 0 $ 2,436 2,436
1
$81,180 + $59,334
2
840 units × $2.90
3
18,900 units × $4.10
4
18,900 units × $2.90
5
900 units × $4.10
6
720 units × $2.90
b. Materials: From current period……………………………………………
…
From beginning inventory……………………………………
…
Decrease…………………………………………………………
…
…
…
Costs
$ 4.10
4.15
$(0.05)
2
CHAPTER 20 Process Cost Systems
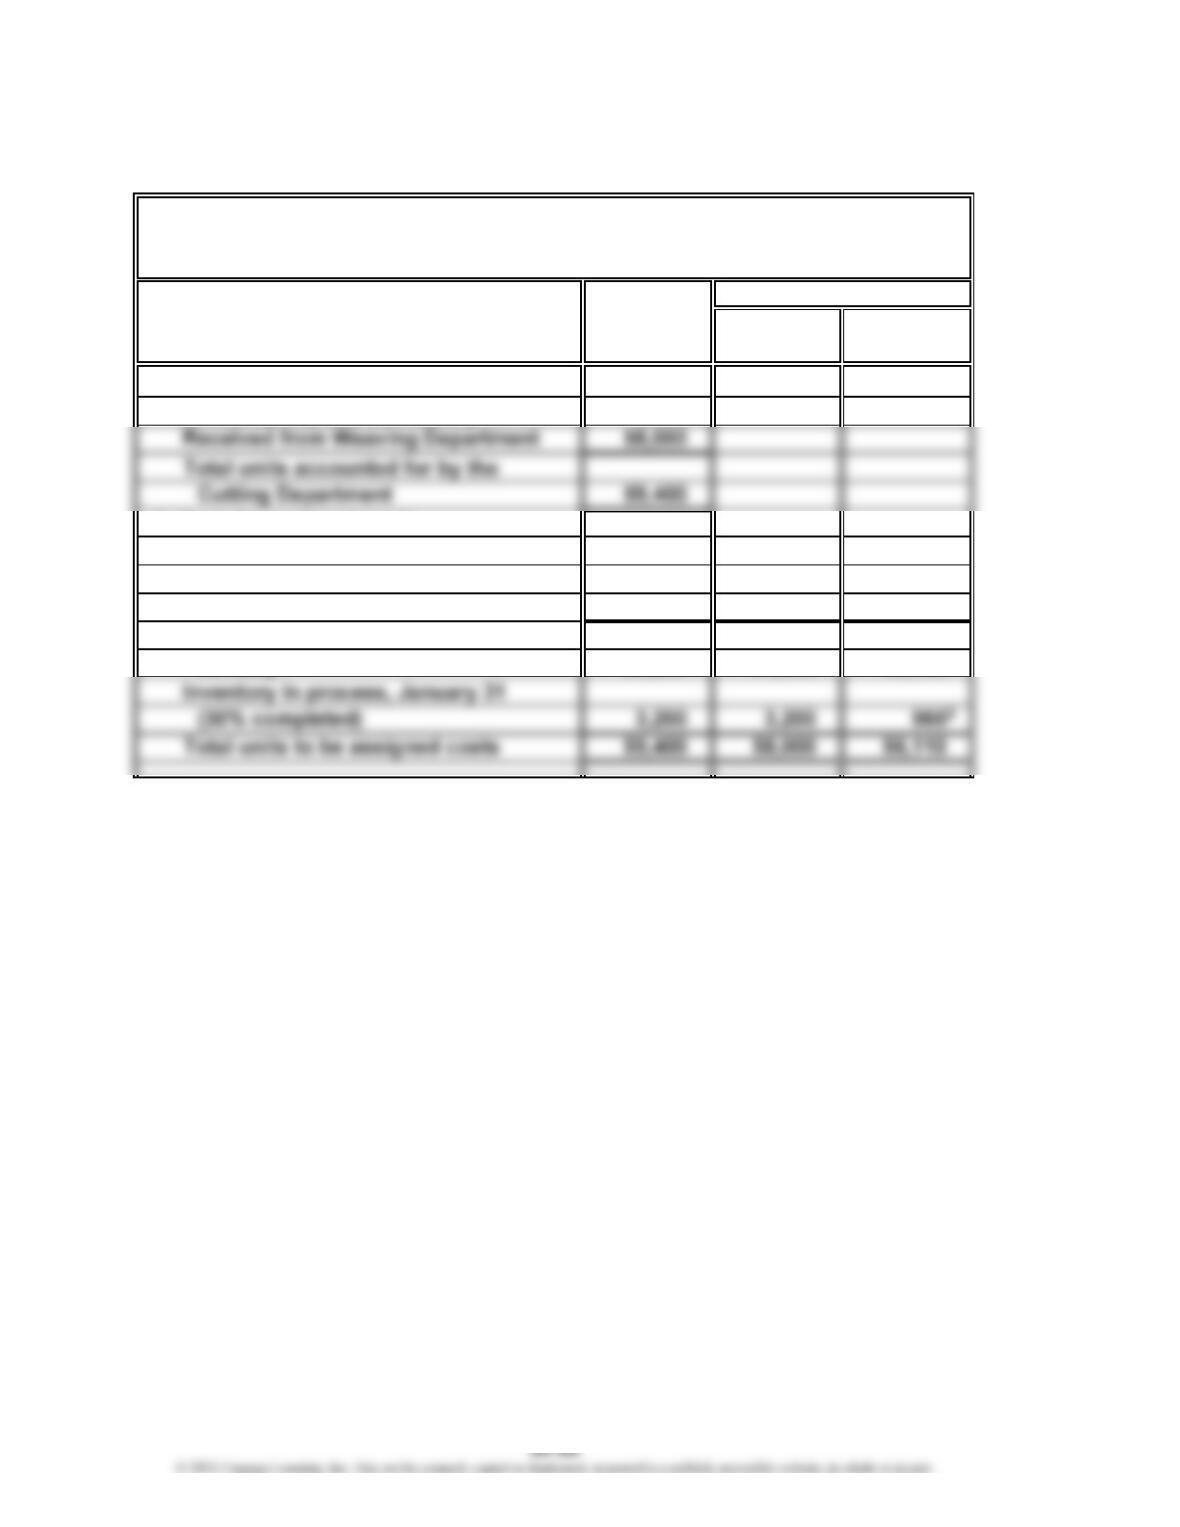
Ex. 20-17
a.
Whole Direct
UNITS
Units Materials Conversion
Units charged to production:
Inventory in process, January 1 1,400
Units to be assigned costs:
Inventory in process, January 1
(75% completed) 1,400 0350
Started and completed in January 54,800 54,800 54,800
Transferred to finished goods in
January 56,200 54,800 55,150
1
1,400 units × (100% – 75%)
2
58,000 units – 3,200 units
3
3,200 units × 30%
Karachi Carpet Company
Cost of Production Report—Cutting Department
For the Month Ended January 31
Equivalent Units
1
2
CHAPTER 20 Process Cost Systems
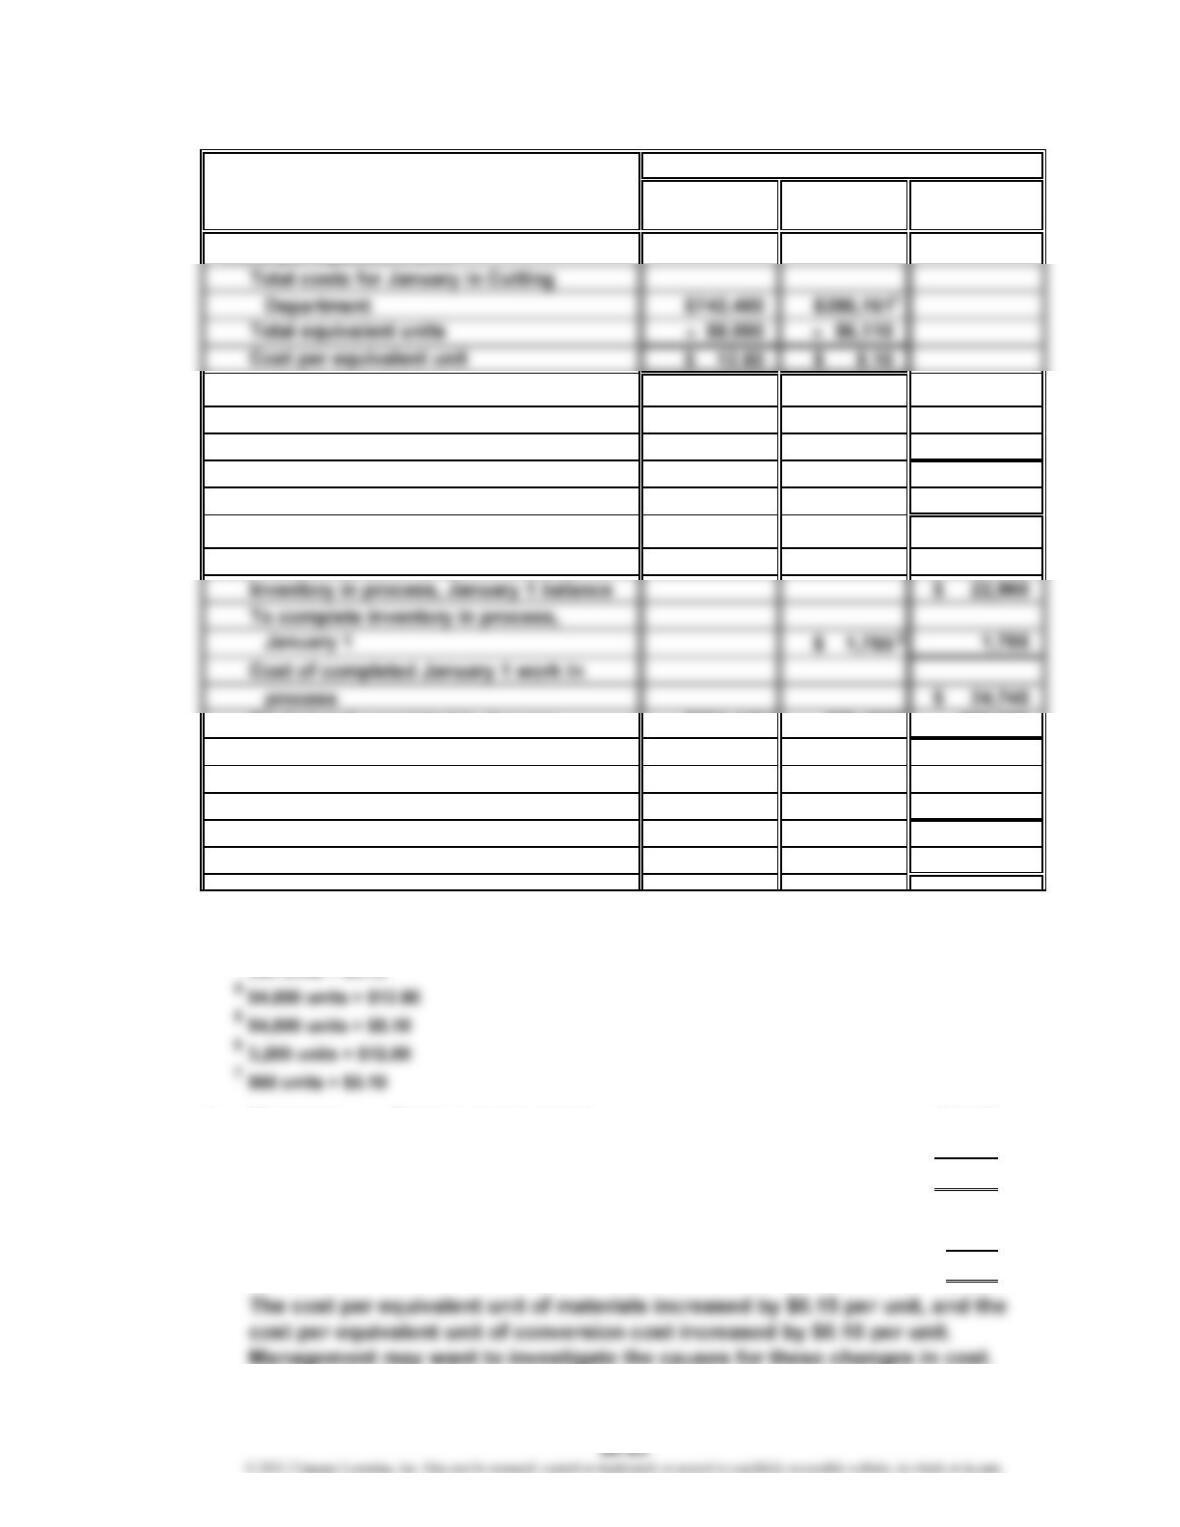
Ex. 20-17 (Concluded)
Direct
COSTS Materials Conversion Total
Costs per equivalent unit:
Costs assigned to production:
Inventory in process, January 1 $ 22,960
Costs incurred in January 1,028,561
Total costs accounted for by the
Cutting Department $1,051,521
Cost allocated to completed and
partially completed units:
Started and completed in January $701,440 279,480 980,920
Transferred to finished goods in
January $1,005,665
Inventory in process, January 31 40,960 4,896 45,856
Total costs assigned by the Cutting
Department $1,051,521
1
$134,550 + $151,611
2
$742,400 + $134,550 + $151,611
3
b. Materials: From current period………………………………………
…
From beginning inventory………………………………
…
Increase……………………………………………………
…
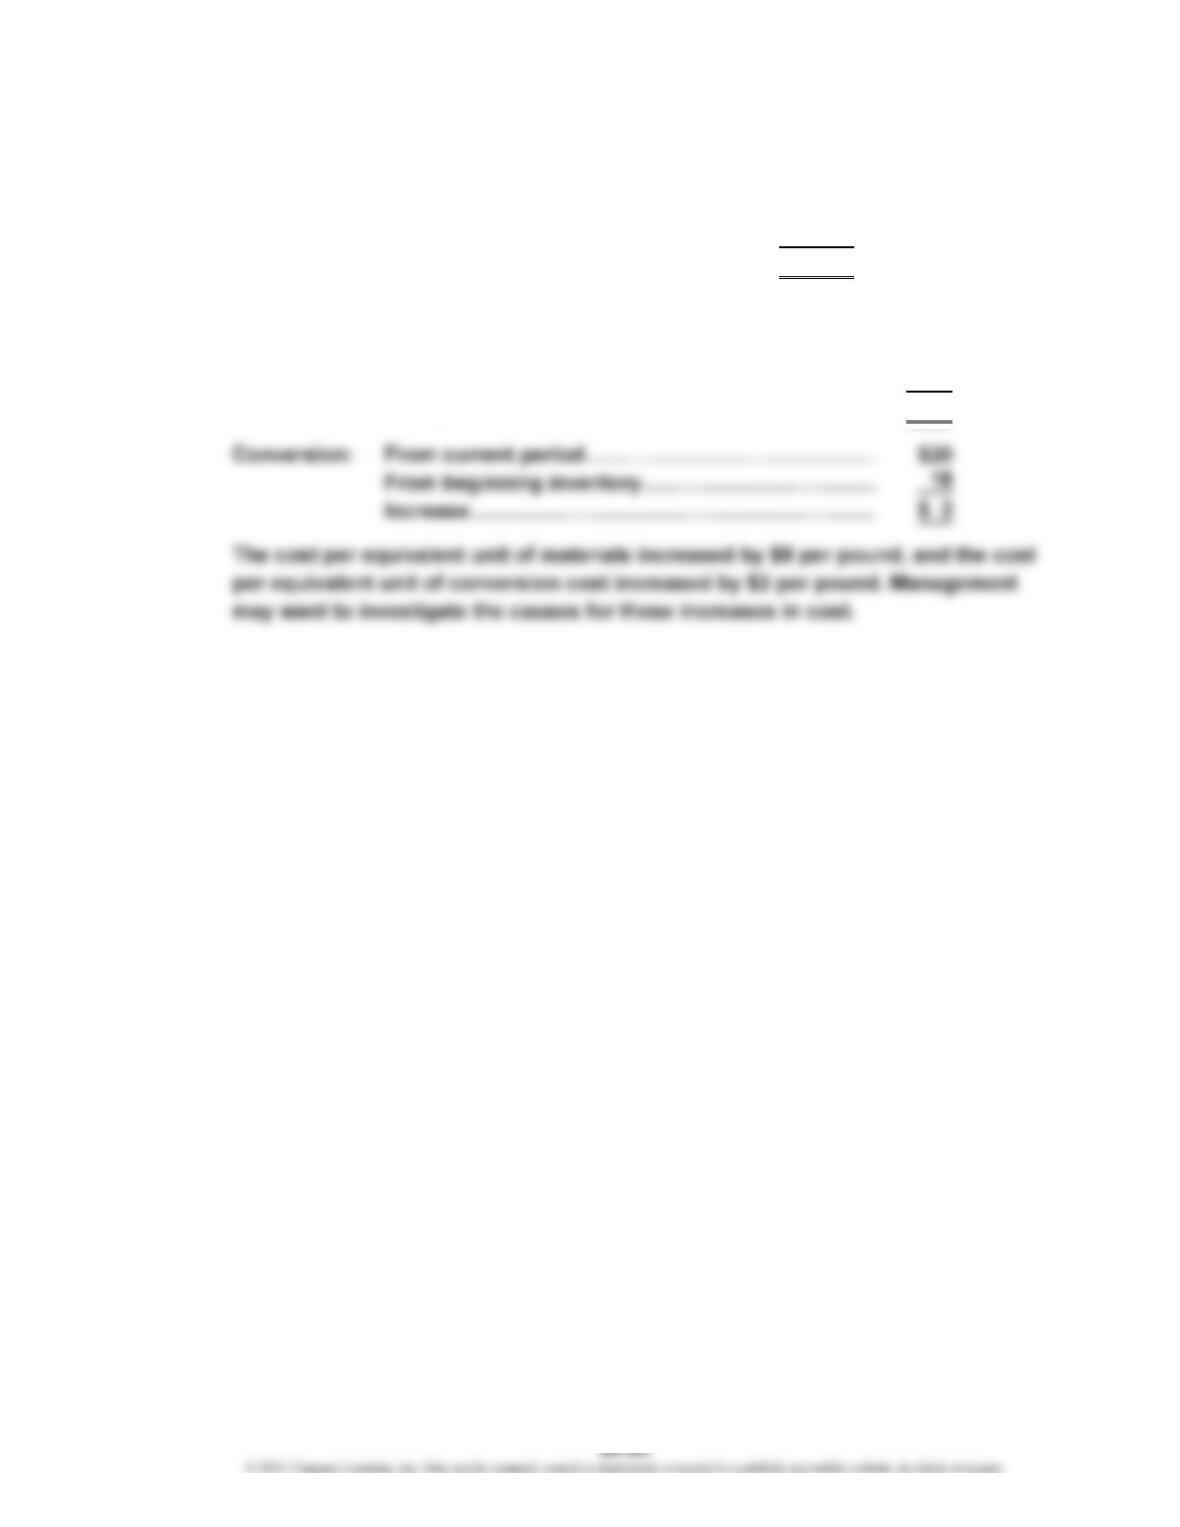
Conversion: From current period………………………………………
…
From beginning inventory………………………………
…
Increase……………………………………………………
…
$5.10
5.00
$0.10
Costs
$12.80
12.65
$ 0.15
4
5
67
2
CHAPTER 20 Process Cost Systems
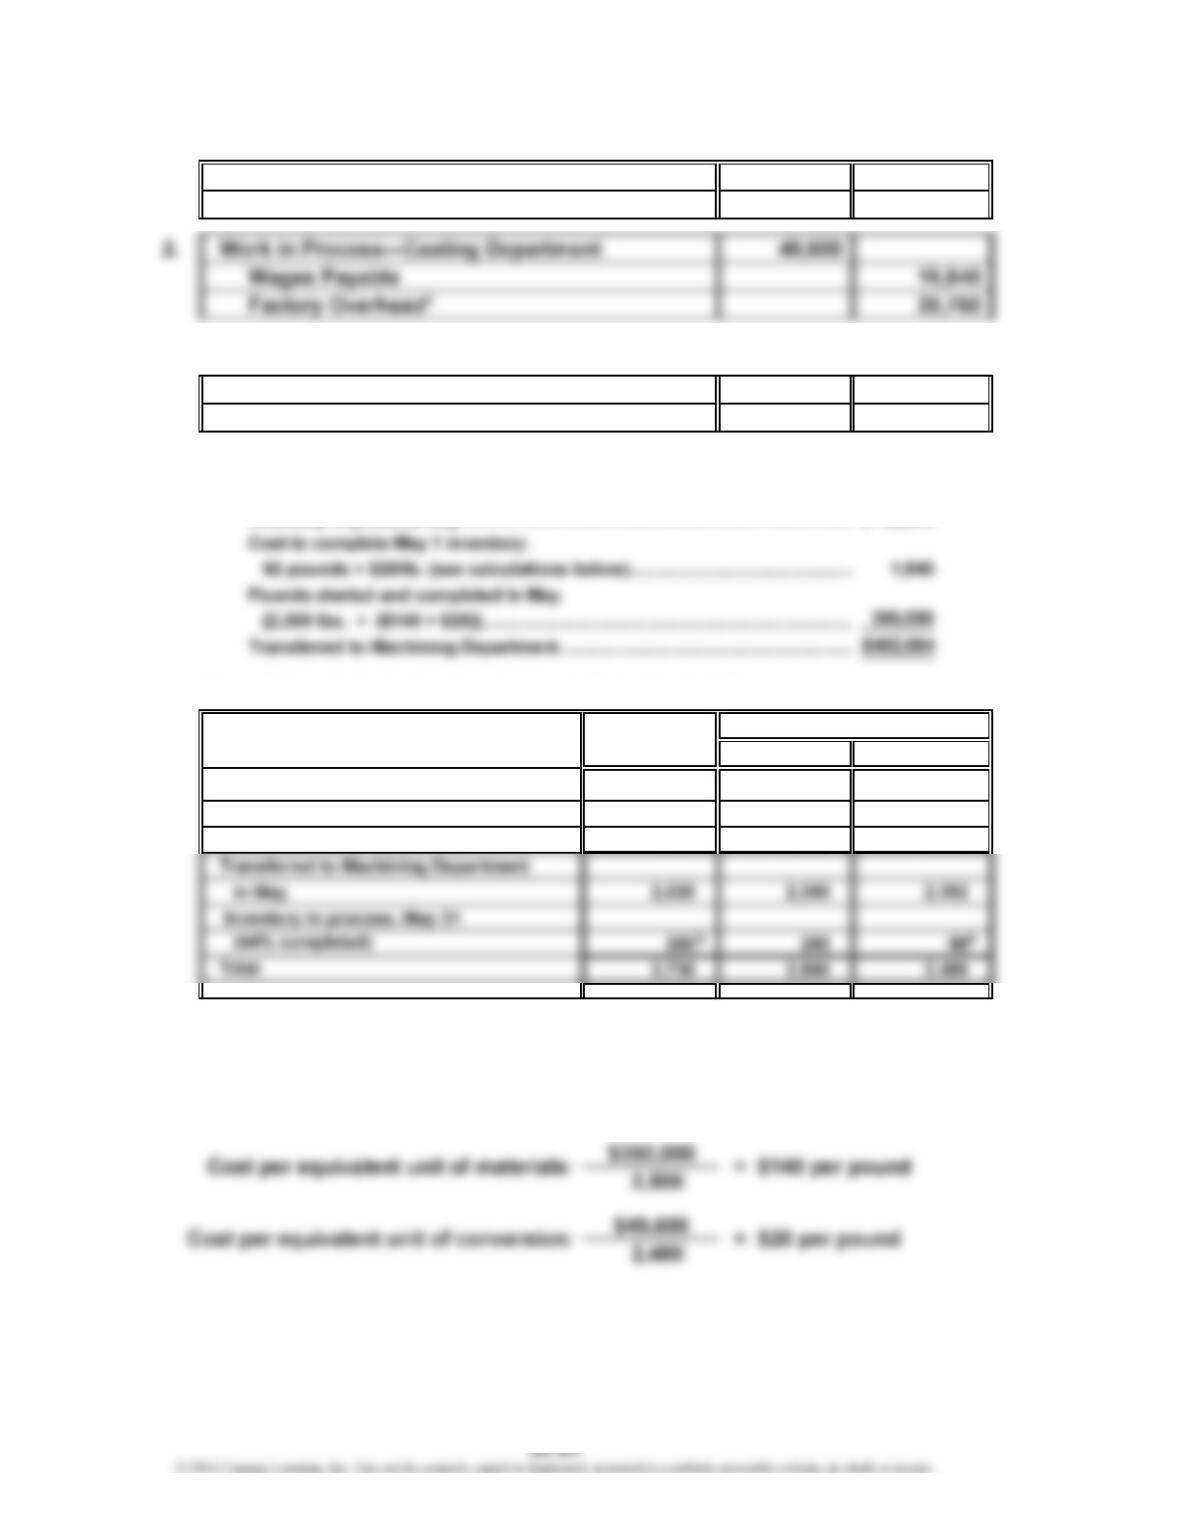
Ex. 20-18
a. 1. Work in Process—Casting Department 350,000
Materials—Alloy 350,000
*
$19,840 × 150%
3. Work in Process—Machining Department* 402,684
Work in Process—Casting Department 402,684
*
Supporting calculations:
Cost of 2,530 transferred-out pounds:
Supporting equivalent unit and cost per equivalent unit calculations:
Whole Units Materials Conversion
Inventory in process, May 1
(60% completed) 230 0 92
Started and completed in May 2,300 2,300 2,300
1
230 units × (100% – 60%)
2
2,530 units – 230 units
3
230 units + 2,500 units – 2,530 units
4
200 units × 44%
Equivalent Units
1
2
CHAPTER 20 Process Cost Systems
Ex. 20-18 (Concluded)
b. $29,760, determined as follows:
Direct materials (200 × $140)……………………………
…
$28,000
Conversion (200 × 44% × $20)…………………………… 1,760
$29,760
or $29,760 = $32,844 + $350,000 + $49,600 – $402,684
c. Materials: From current period…………………………………… $140
From beginning inventory……………………………
…
132
Increase…………………………………………………
…
$8
…
…
CHAPTER 20 Process Cost Systems
Ex. 20-19
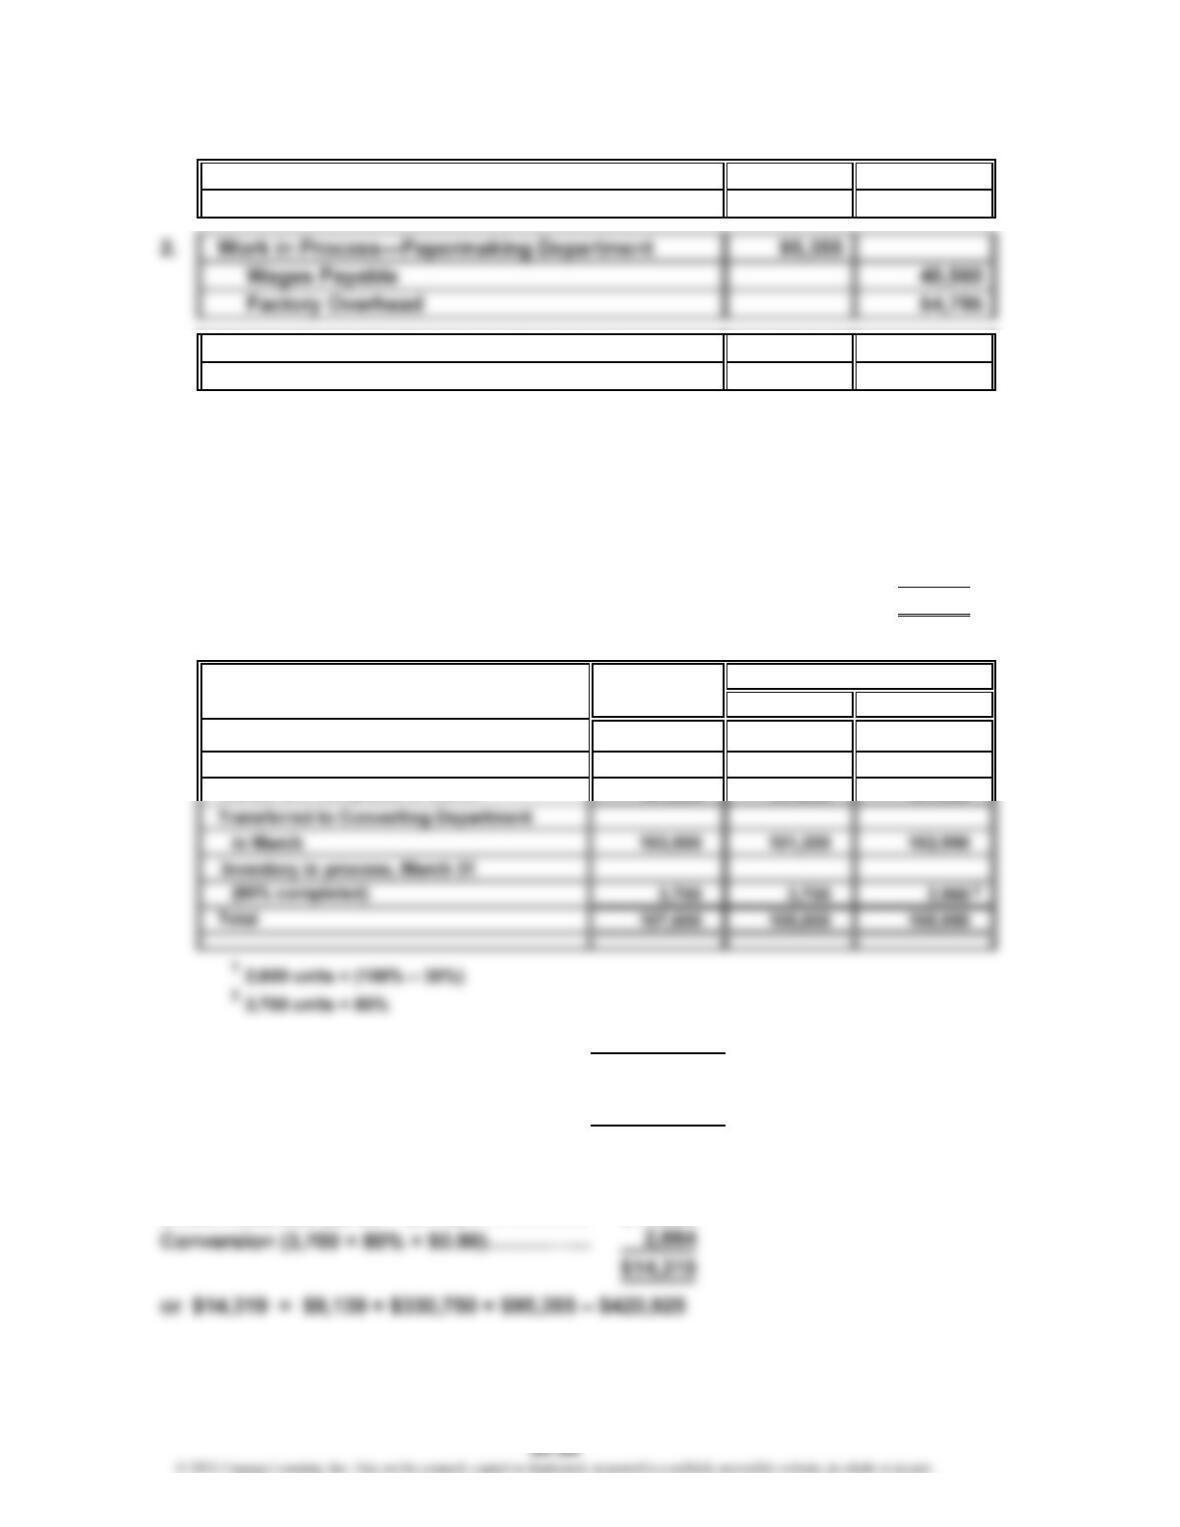
a. 1. Work in Process—Papermaking Department 330,750
Materials—Pulp 330,750
3. Work in Process—Converting Department* 420,925
Work in Process—Papermaking Department 420,925
*
Supporting calculations:
Cost of 103,900 transferred-out units:
Inventory in process, March 1……………………………………………………… $ 9,139
Cost to complete March 1 inventory:
1,690 units × $0.90/unit (see calculations below)……………………………
…
1,521
Pounds started and completed in March
[101,300 units × ($3.15 + $0.90)]………………………………………………
…
410,265
Transferred to Converting Department…………………………………………
…
$420,925
Supporting equivalent unit and cost per equivalent unit calculations:
Whole Units Materials Conversion
Inventory in process, March 1
(35% completed) 2,600 0 1,690
Started and completed in March 101,300 101,300 101,300
$330,750
105,000
$95,355
105,950
b. $14,319; determined as follows:
Direct materials (3,700 × $3.15)……………… $11,655
Cost per equivalent unit of conversion: = $0.90 per unit
Equivalent Units
= $3.15 per unitCost per equivalent unit of materials:
1
CHAPTER 20 Process Cost Systems
Ex. 20-20
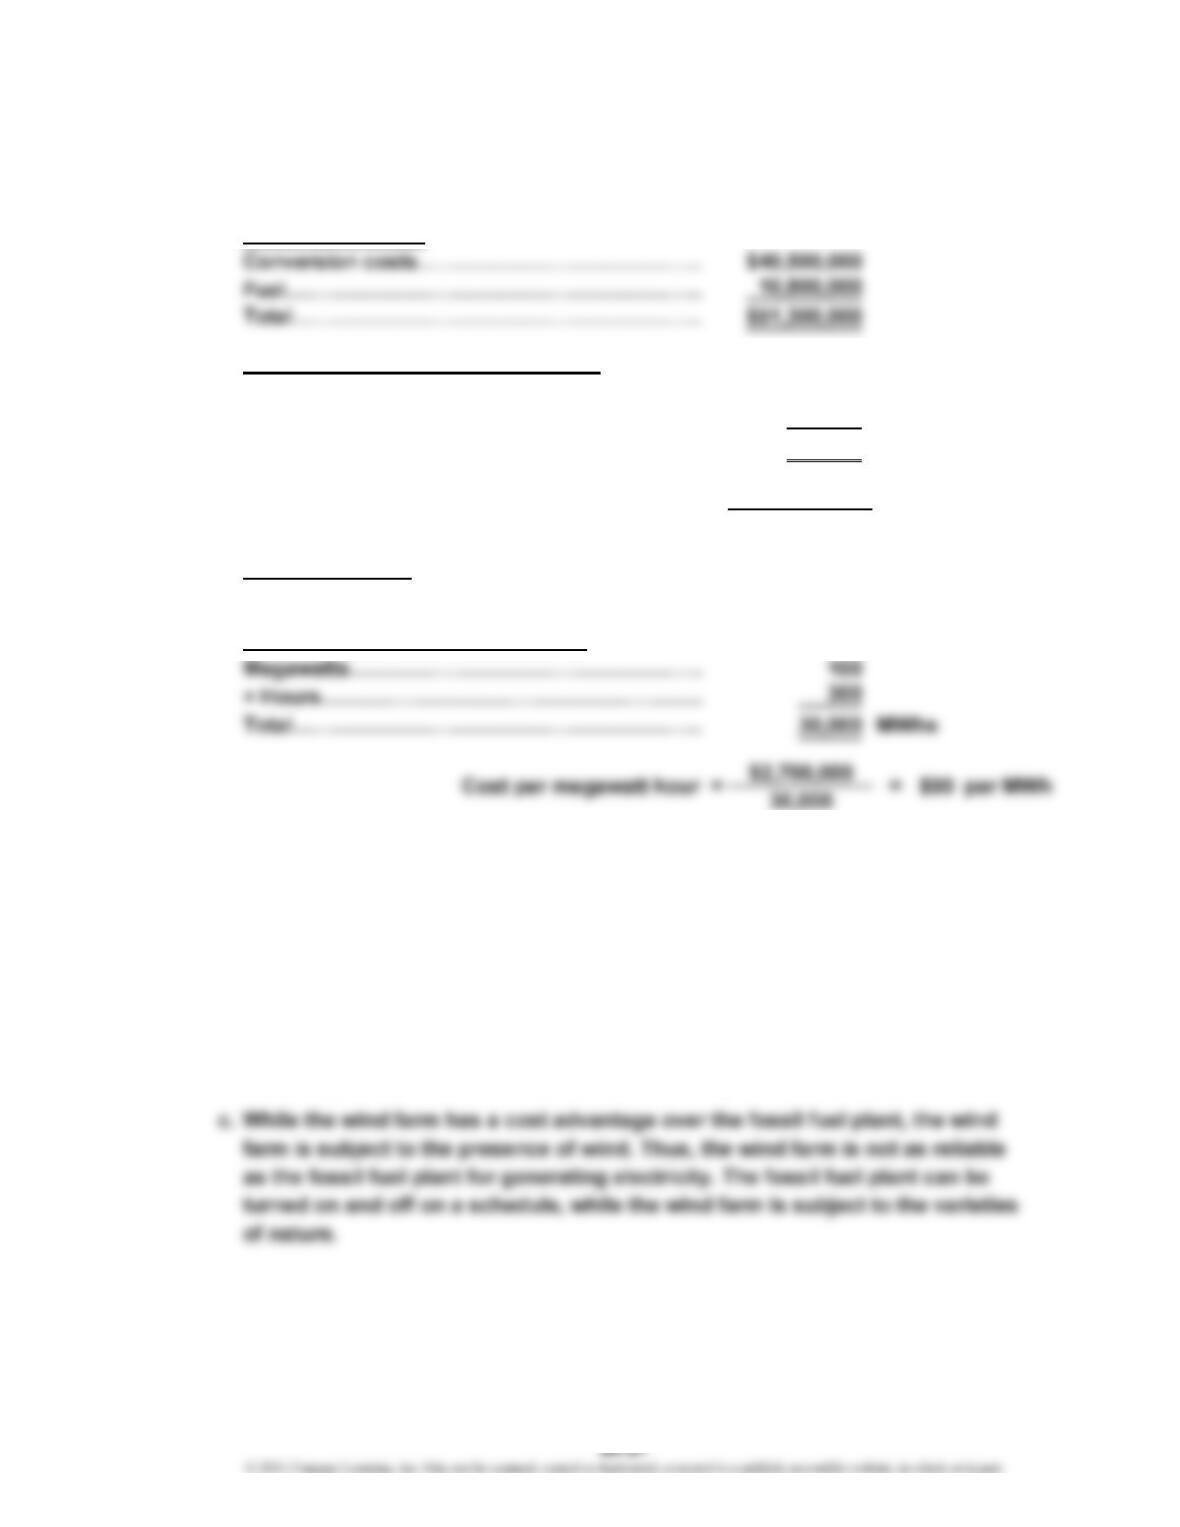
a. Cost per megawatt hour (MWh):
Fossil plant costs:
Fossil plant megawatt hours (MWh):
Megawatts…………………………………………… 900
× Hours………………………………………………
…
600
Total…………………………………………………
…
540,000 MWhs
$51,300,000
540,000
Wind farm costs:
Conversion costs…………………………………
…
$2,700,000
Wind farm megawatt hours (MWh):
…
…
The wind farm cost per megawatt hour was $90, compared to the fossil plant
cost of $95 per megawatt hour. The wind farm is the less costly resource.
Note: These figures are close to the national average and show the slight
advantage of wind farms.
b. Equivalent units of production are calculated when there are beginning or
ending inventories that are partially completed to either coversion costs or
materials. There are no beginning or ending inventories for generating
electricity; thus, there is no need to determine equivalent units of production.
$95 per MWh ==Cost per megawatt hour
…
…
CHAPTER 20 Process Cost Systems
Ex. 20-21
Memo
To: Production Manager
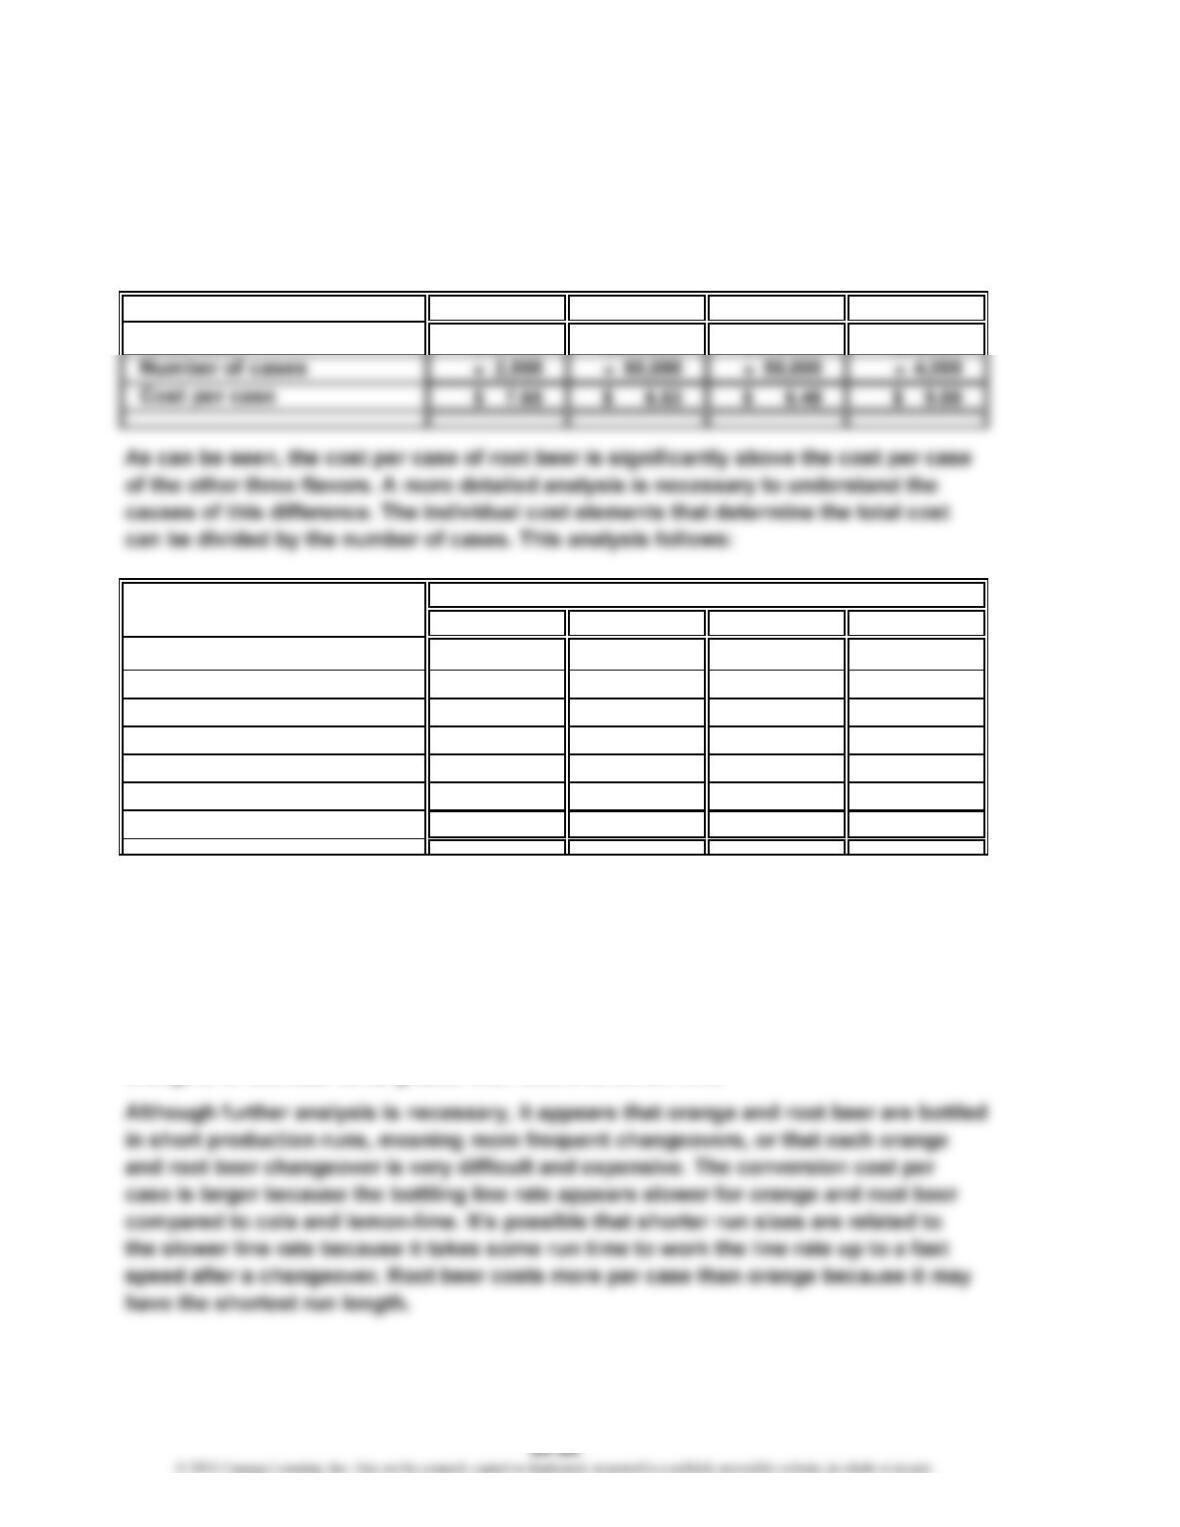
The cost of production report is used to identify the cost per case for each of the
four flavors as follows:
Orange Cola Lemon-Lime Root Beer
Total cost
$19,125 $391,800 $324,000 $36,000
Orange Cola Lemon-Lime Root Beer
Concentrate
$1.85 $2.15 $2.10 $1.90
Water
0.50 0.50 0.50 0.50
Sugar
1.20 1.20 1.20 1.20
Bottles
2.20 2.20 2.20 2.20
Flavor changeover
1.20 0.08 0.08 2.50
Conversion cost
0.70 0.40 0.40 0.70
Total cost per case
$7.65 $6.53 $6.48 $9.00
This table indicates that the concentrate per case is actually less for orange and root
beer than for cola and lemon-lime. This is because the concentrate supplier charges
a higher price for the more popular flavors. The costs per case for water, sugar, and
bottles are the same for each flavor. However, the costs per case for changeover are
much greater for orange and root beer than for the other two flavors. In addition, the
conversion costs per unit for orange and root beer are $0.30 higher than for cola and
lemon-lime. These last two cost elements are sufficient to cause the cost per case of
orange and root beer to be greater than cola and lemon-lime.
Cost per Case by Cost Element
CHAPTER 20 Process Cost Systems
Ex. 20-22
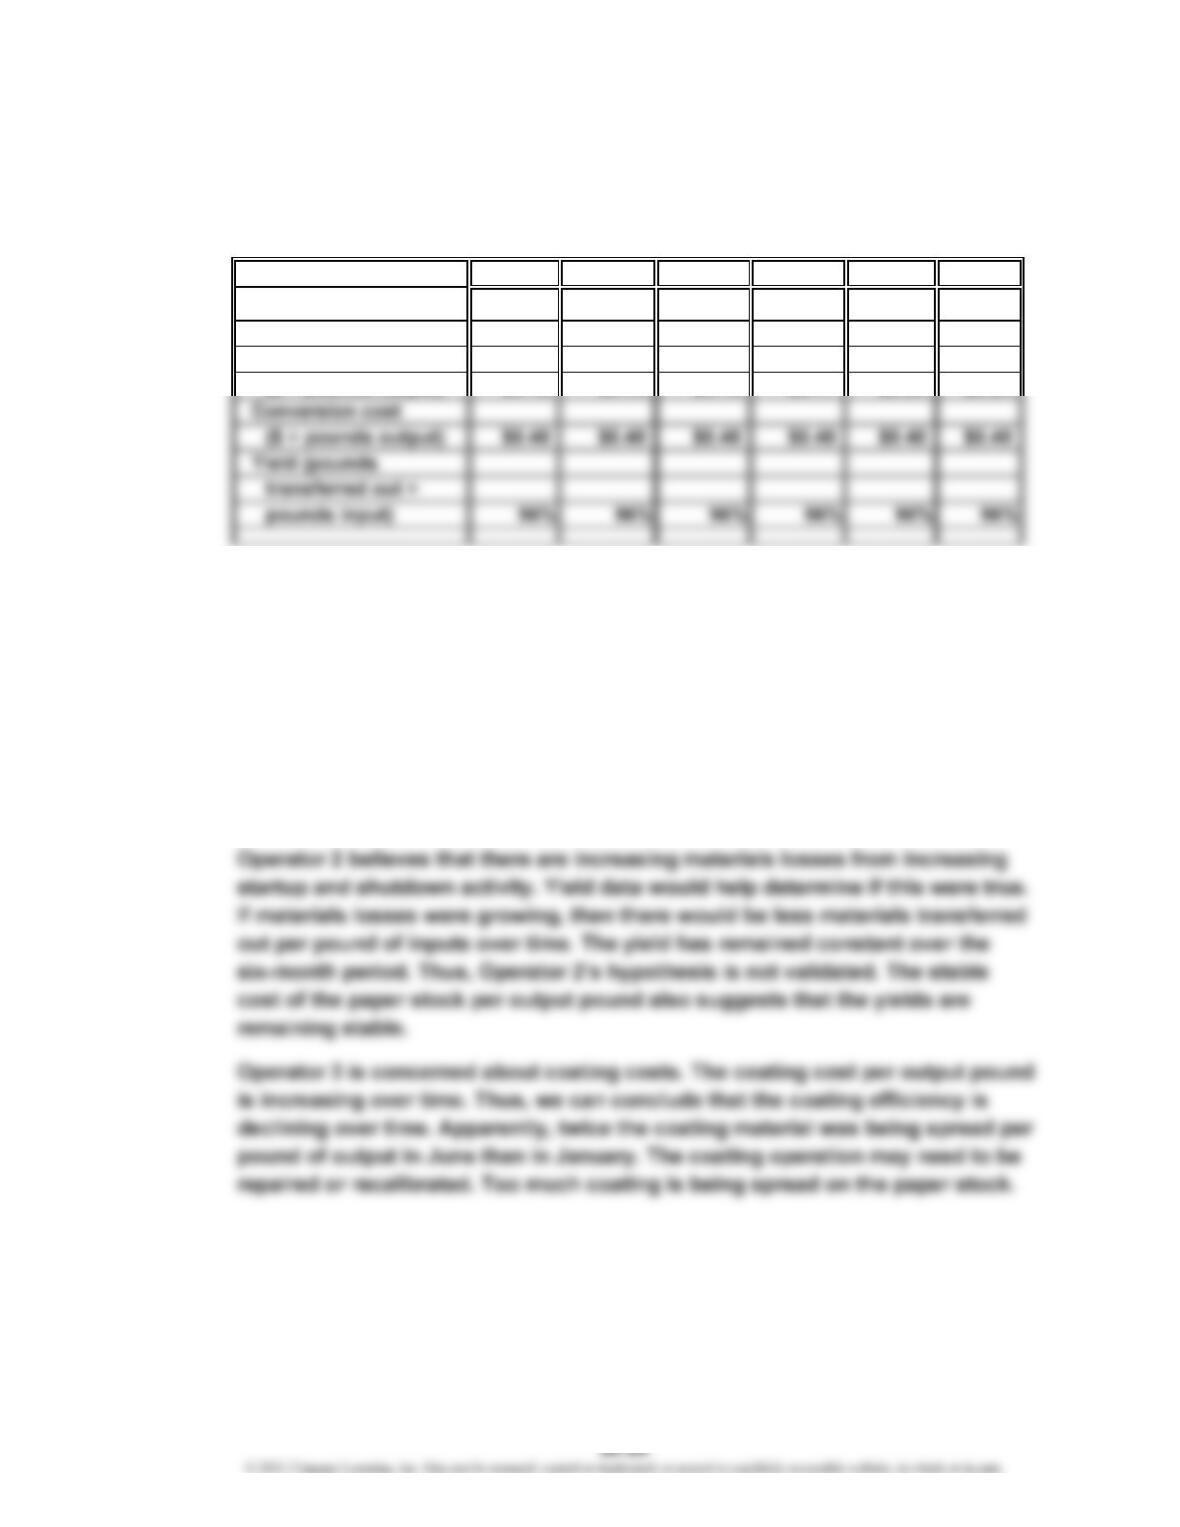
The solution to this exercise is to determine if the cost per pound trends in paper
stock, conversion, and coating costs are remaining stable over time. The
following table can be developed from the data:
a.
January February March April May June
Paper stock
($ ÷ pounds output) $0.70 $0.70 $0.70 $0.70 $0.70 $0.70
Coating
The cost per pound information is determined by dividing the costs by the
pounds transferred out. The yield is determined by dividing the pounds
transferred out by the pounds input.
b. Operator 1 believes that energy consumption is becoming less efficient. The
energy cost is part of the conversion cost. The conversion cost per output
pound has remained constant for the six months. If the energy efficiency were
declining, it would take more energy per pound of output over time. Thus, we
would expect to see the conversion rate per pound increasing if Operator 1
were correct.
CHAPTER 20 Process Cost Systems
Ex. 20-23
The Hawkeye Machining managers are displaying typical fears to a lean manufacturing
system. Lean manufacturing removes the safety provided by materials, in-process,
and finished goods inventory balances. Indeed, these types of comments reflect
conventional manufacturing philosophy, which views inventory as a necessary
buffer against surprises and other unwelcome events. Lean manufacturing focuses
on removing the causes that require a need for inventory.
The in-process inventories can be reduced significantly if the underlying manufacturing
processes are made reliable. The director of manufacturing is correct in his observation
but his solution is wrong. The solution is not to increase inventory but to improve the
reliability of the machines so that they do not experience emergency breakdowns.
Thus, the manufacturing operation must be improved to produce the right product, in
the right quantities, at the right quality, and at the right time. Only with this level of
reliability can a plant responsibly remove in-process inventories from the system.
In other words, inventory covers a “multitude of sins.” When the “sins” are removed,
the inventory can be removed.
Appendix Ex. 20-24
a. and b.
a. Whole b. Equivalent Units
Units of Production
Units to be accounted for:
Beginning work in process 1,900
Units started during period 15,100
Total 17,000
1
CHAPTER 20 Process Cost Systems
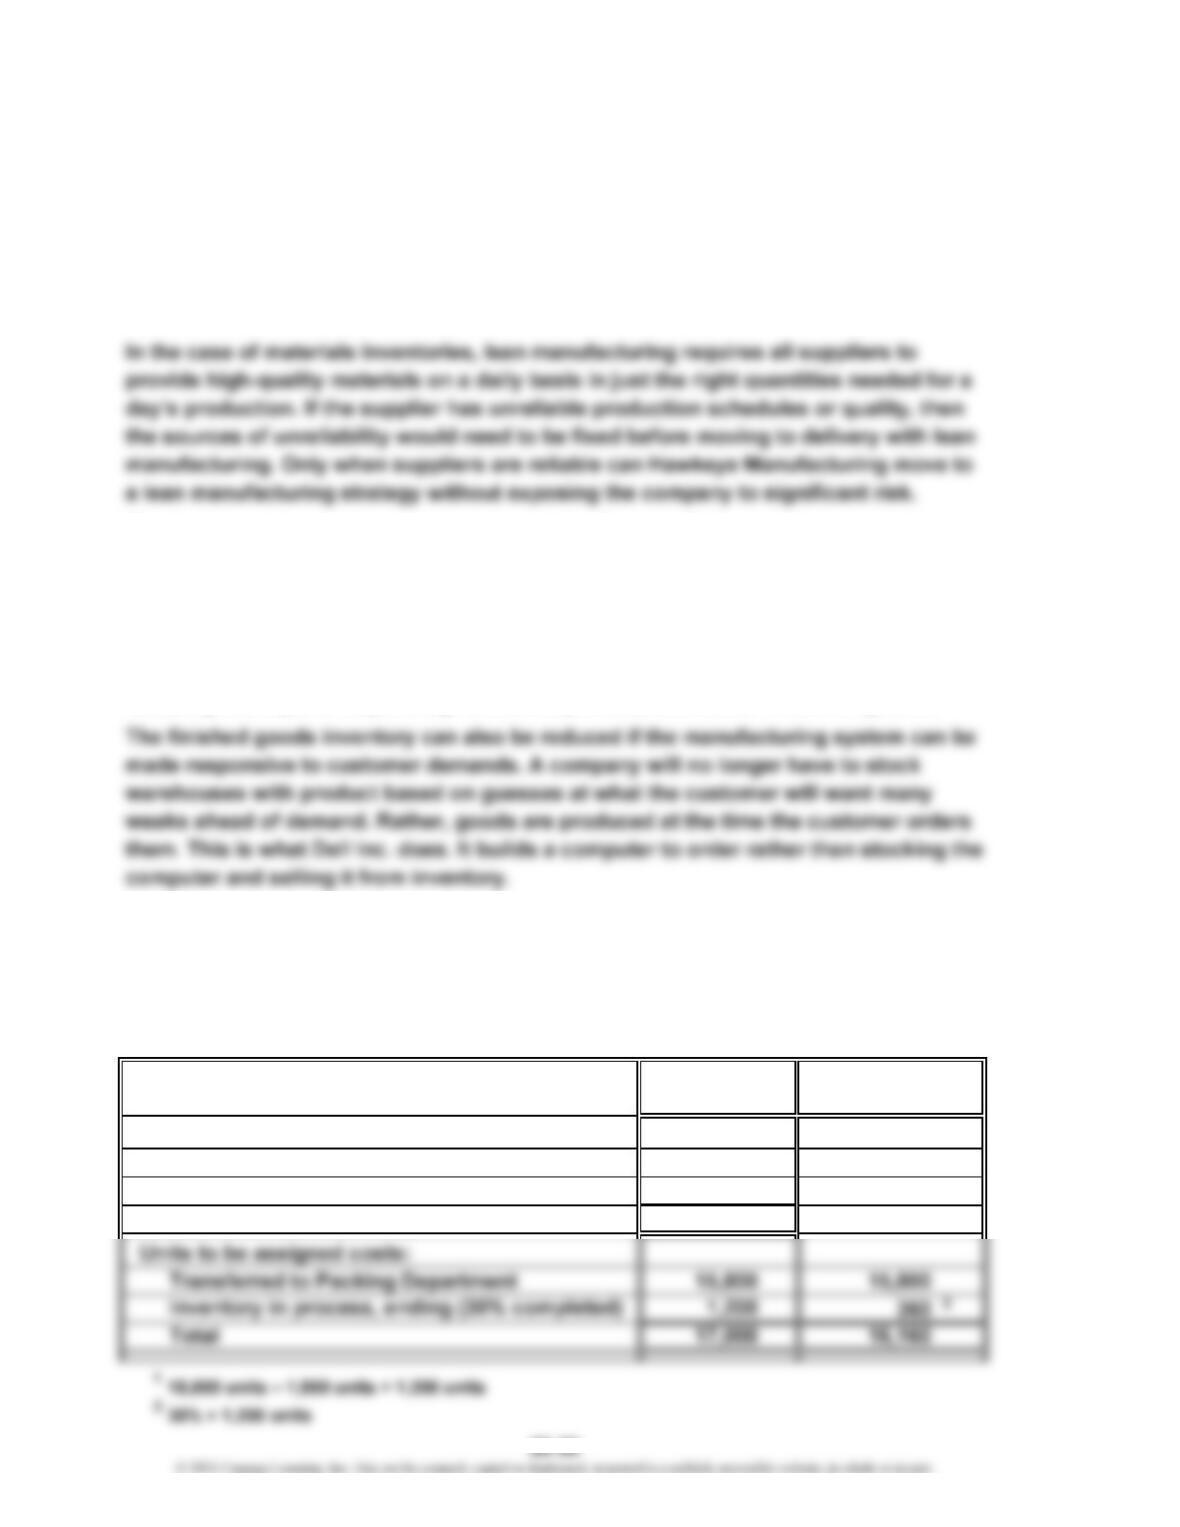
Appendix Ex. 20-25
a. Drawing Department
Whole Equivalent Units
Units of Production
Units to be accounted for:
Beginning work in process 500
Units started during period 11,600
Total 12,100
1
11,400 units – 500 units + 700 units
2
55% × 700 units
b. Winding Department
Whole Equivalent Units
Units of Production
Units to be accounted for:
Beginning work in process 350
Units started during period 11,400
Total 11,750
1
10,950 units – 350 units + 800 units
2
25% × 800 units
1
1
CHAPTER 20 Process Cost Systems
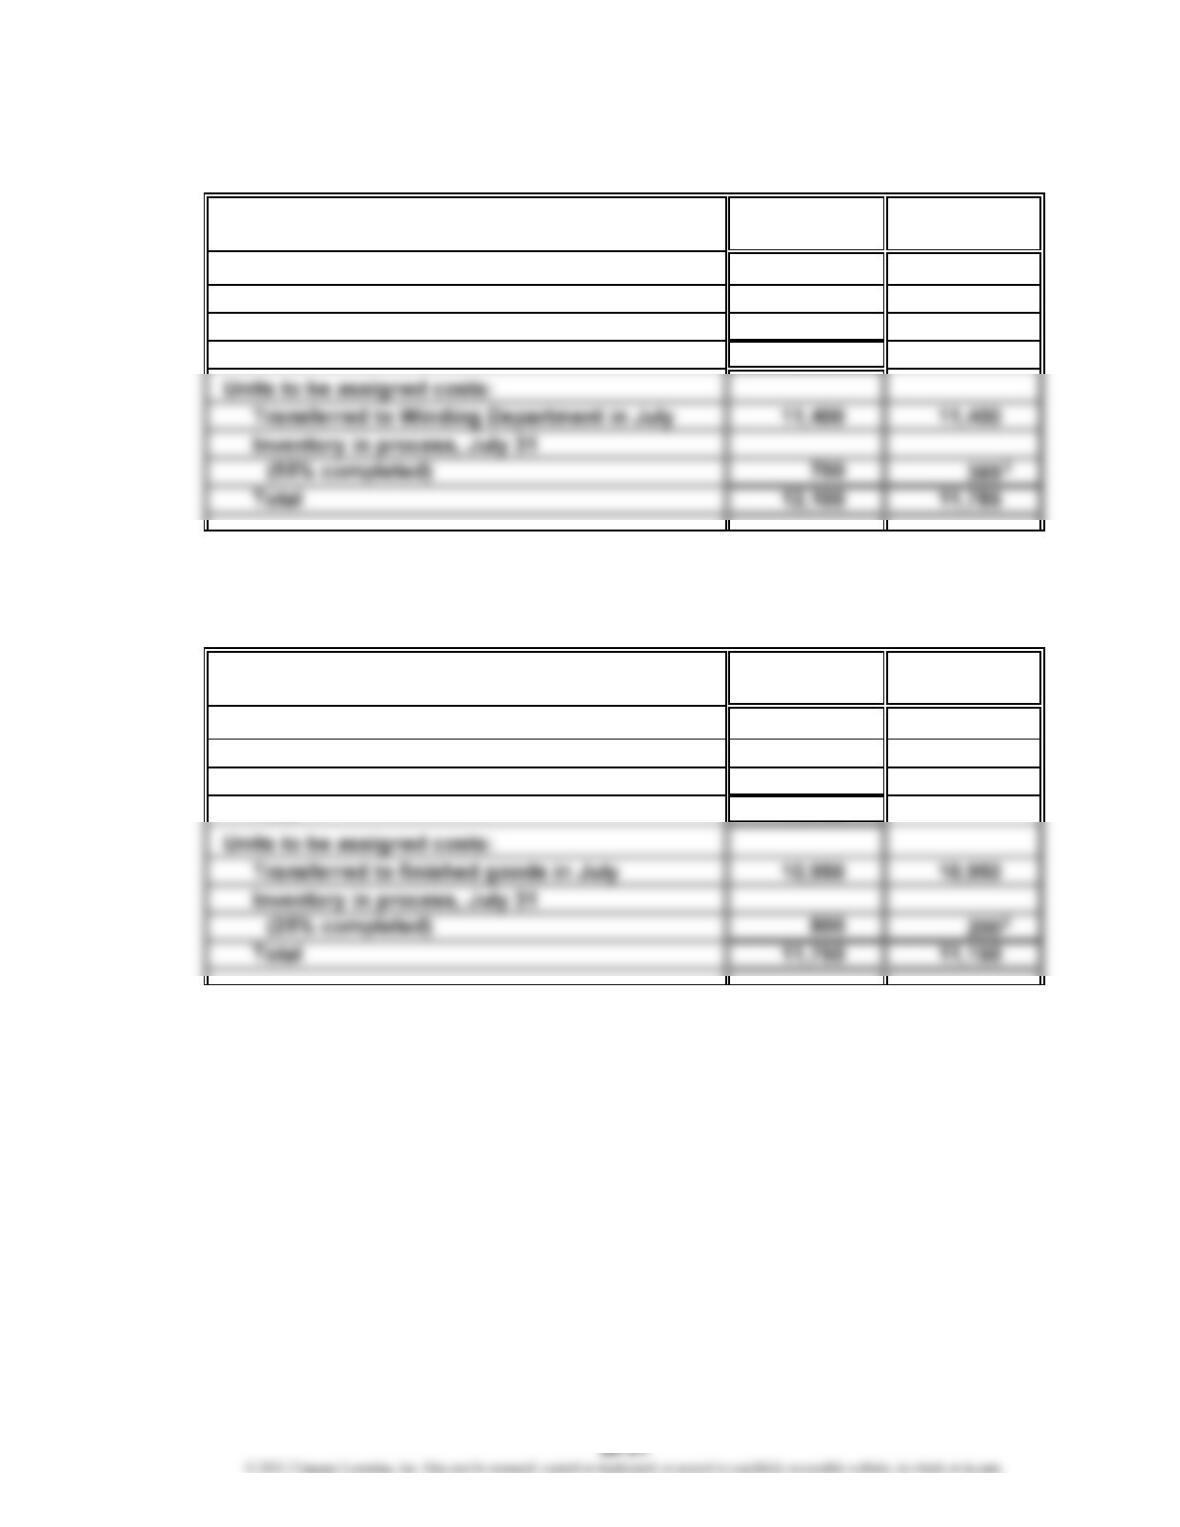
Appendix Ex. 20-26
a. Units in process, May 1…………………………………………………………
…
4,200
Units placed into production for May………………………………………… 23,600
Less units finished during May………………………………………………
…
(24,700)
Units in process, May 31………………………………………………………
…
3,100
b.
Equivalent
Whole Units of
Units Production
Units to be accounted for:
Beginning work in process 4,200
Units started during the period 23,600
*
30% × 3,100 units
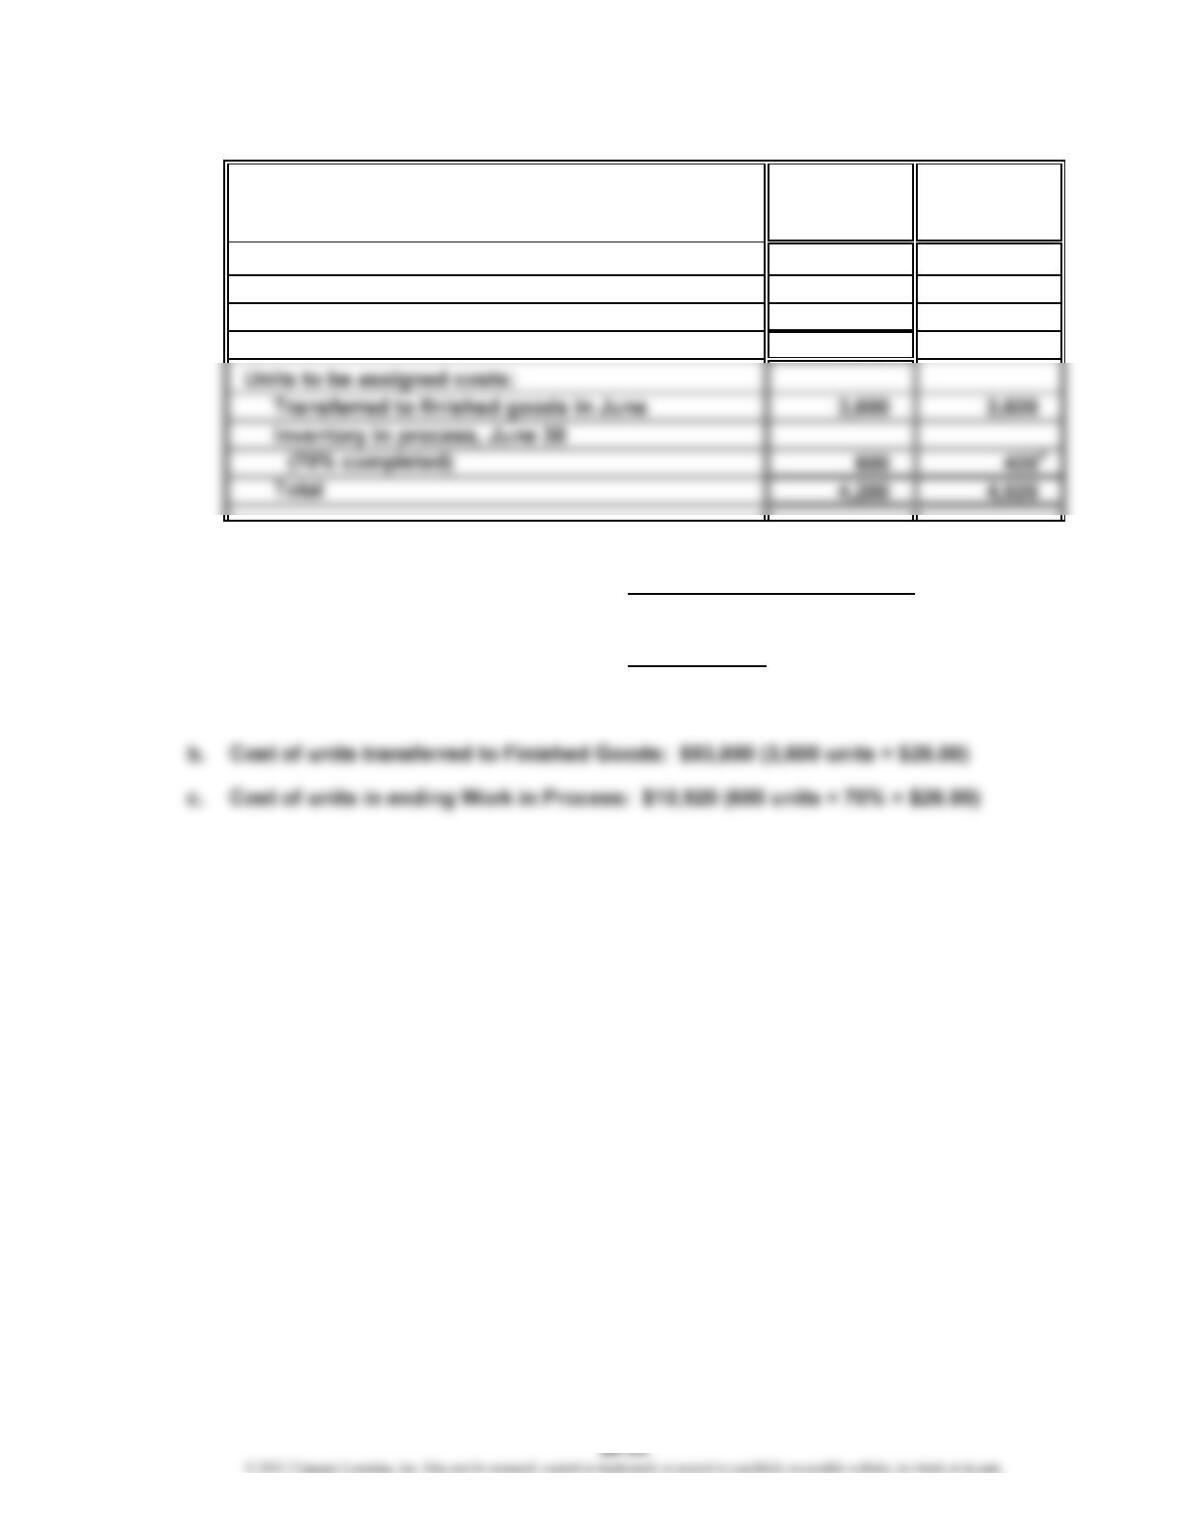
Appendix Ex. 20-27
a. and b.
Equivalent
Whole Units of
Units Production
Units to be accounted for:
Beginning work in process 900
Units started during the period 8,400
Total 9,300
*
60% × 1,200 units
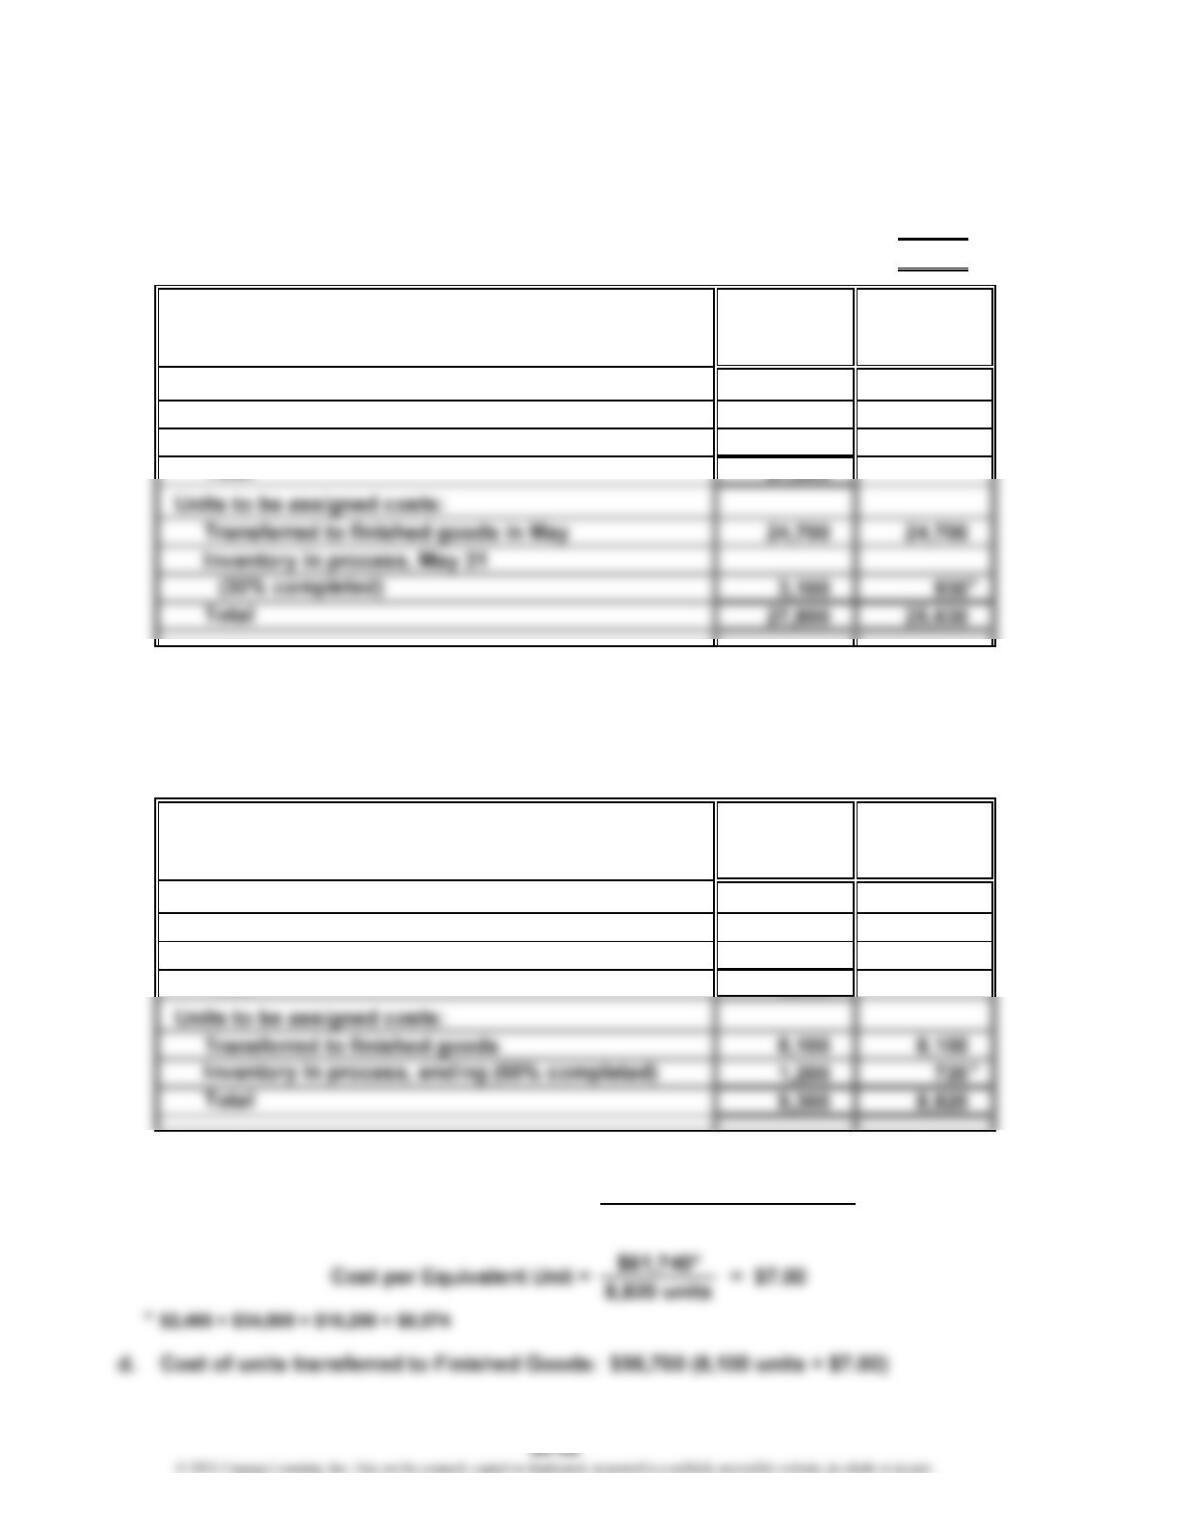
e. Cost of units in ending Work in Process: $5,040 (1,200 units × 60% × $7.00)
Total Equivalent Units
c. Cost per Equivalent Unit =
Total Production Costs
CHAPTER 20 Process Cost Systems
Appendix Ex. 20-28
a.
Equivalent
Whole Units of
Units Production
Units to be accounted for:
Beginning work in process 500
Units started during the period 3,700
Total 4,200
*
70% × 600 units
$104,520**
4,020 units
**
$5,000 + $49,200 + $25,200 + $25,120
Total Equivalent Units
Cost per Equivalent Unit =
Cost per Equivalent Unit = = $26.00
Total Production Costs
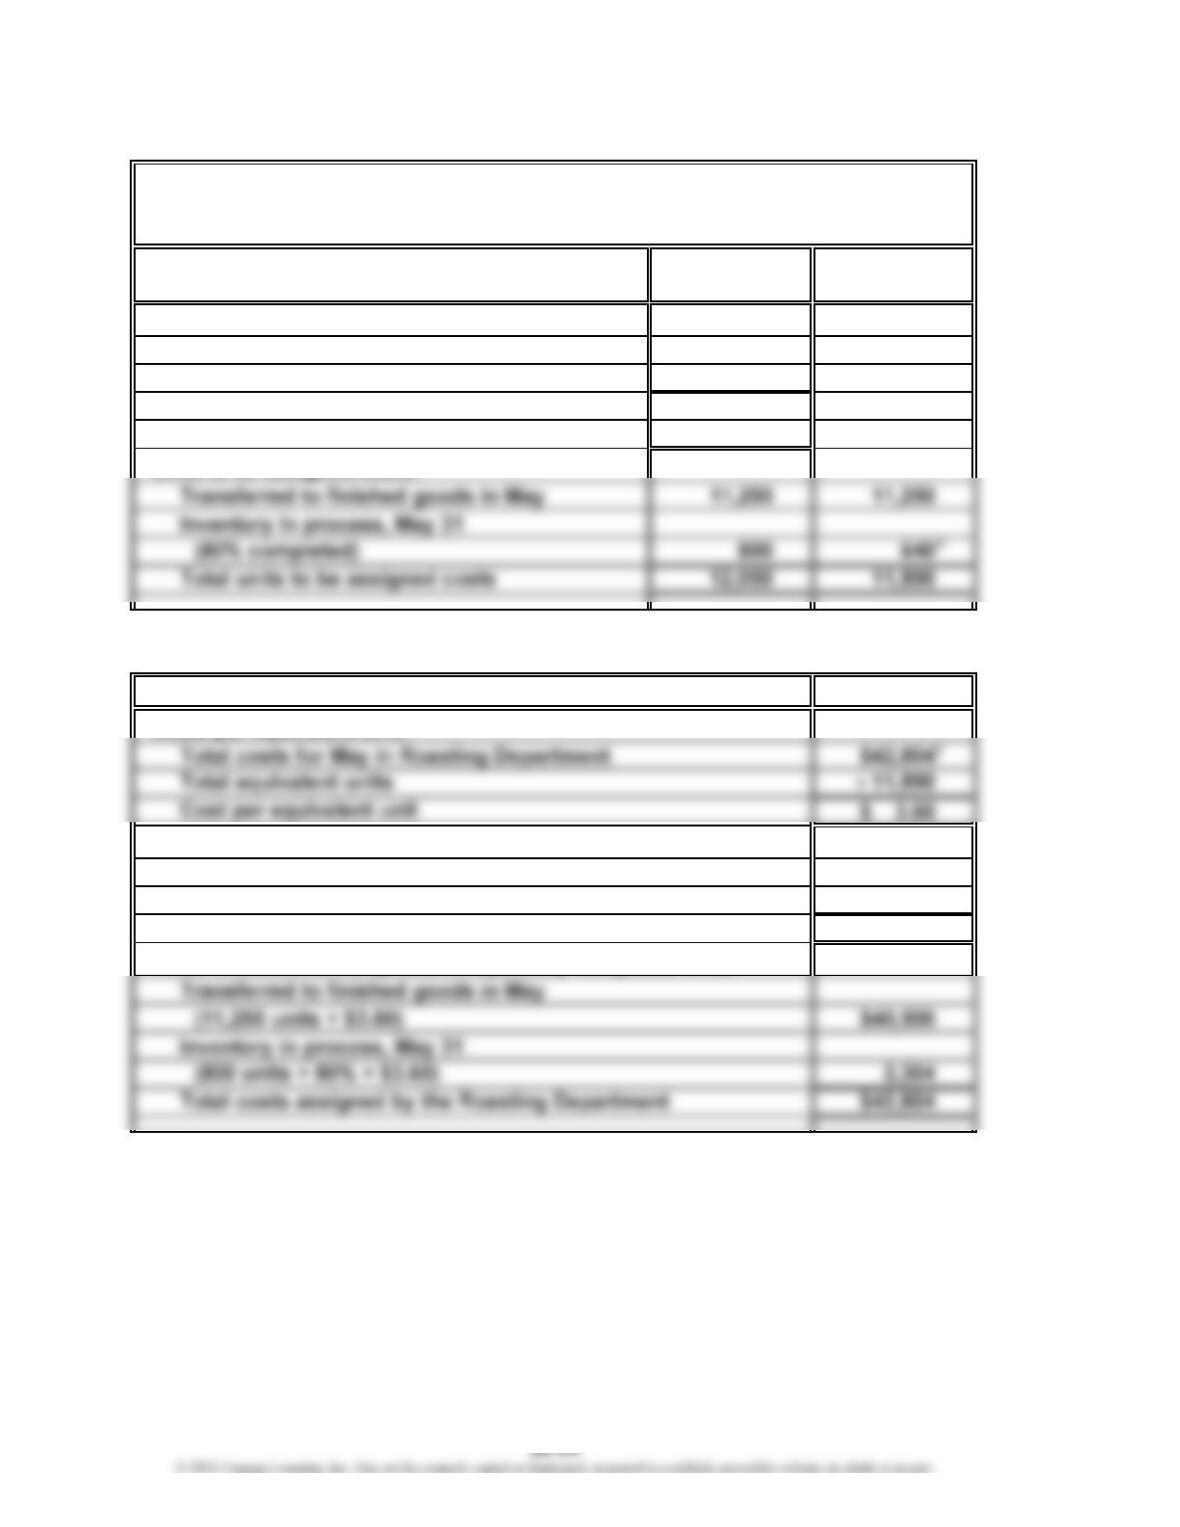
CHAPTER 20 Process Cost Systems
Appendix Ex. 20-29
Whole Equivalent Units
UNITS Units of Production
Units to account for during production:
Inventory in process, May 1 1,150
Received from materials storeroom 10,900
Total units accounted for by the
Roasting Department 12,050
*
80% × 800 units
COSTS Costs
Costs assigned to production:
Inventory in process, May 1 $ 1,700
Costs incurred in May 41,104
Total costs accounted for by the Roasting Department $42,804
Costs allocated to completed and partially completed units:
1
$1,700 + $28,600 + $12,504
2
$28,600 + $12,504
Highlands Coffee Company
Cost of Production Report—Roasting Department
For the Month Ended May 31
2
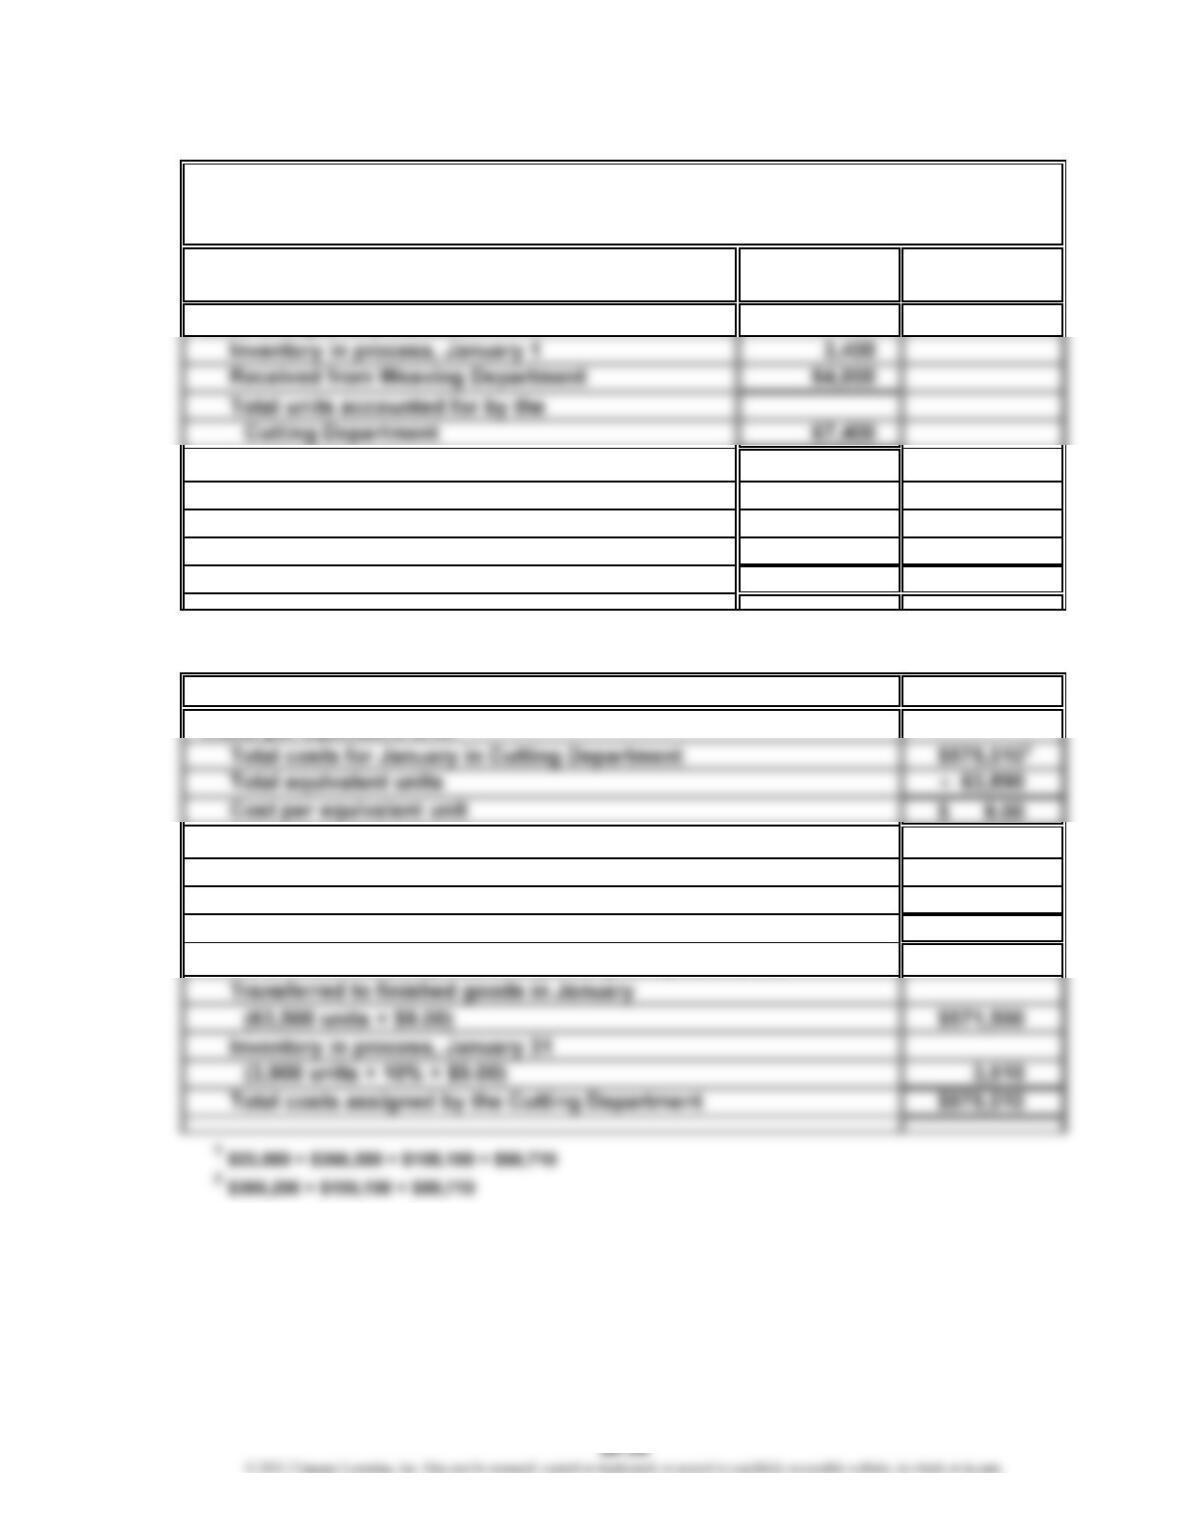
CHAPTER 20 Process Cost Systems
Appendix Ex. 20-30
Whole Equivalent Units
UNITS Units of Production
Units charged to production:
Units to be assigned costs:
Transferred to finished goods in January 63,500 63,500
Inventory in process, January 31
(10% completed) 3,900 390
Total units to be assigned costs 67,400 63,890
*
10% × 3,900 units
COSTS Costs
Costs assigned to production:
Inventory in process, January 1 $ 23,000
Costs incurred in January 552,010
Total costs accounted for by the Cutting Department $575,010
Costs allocated to completed and partially completed units:
Dalton Carpet Company
Cost of Production Report—Cutting Department
For the Month Ended January 31
2
*
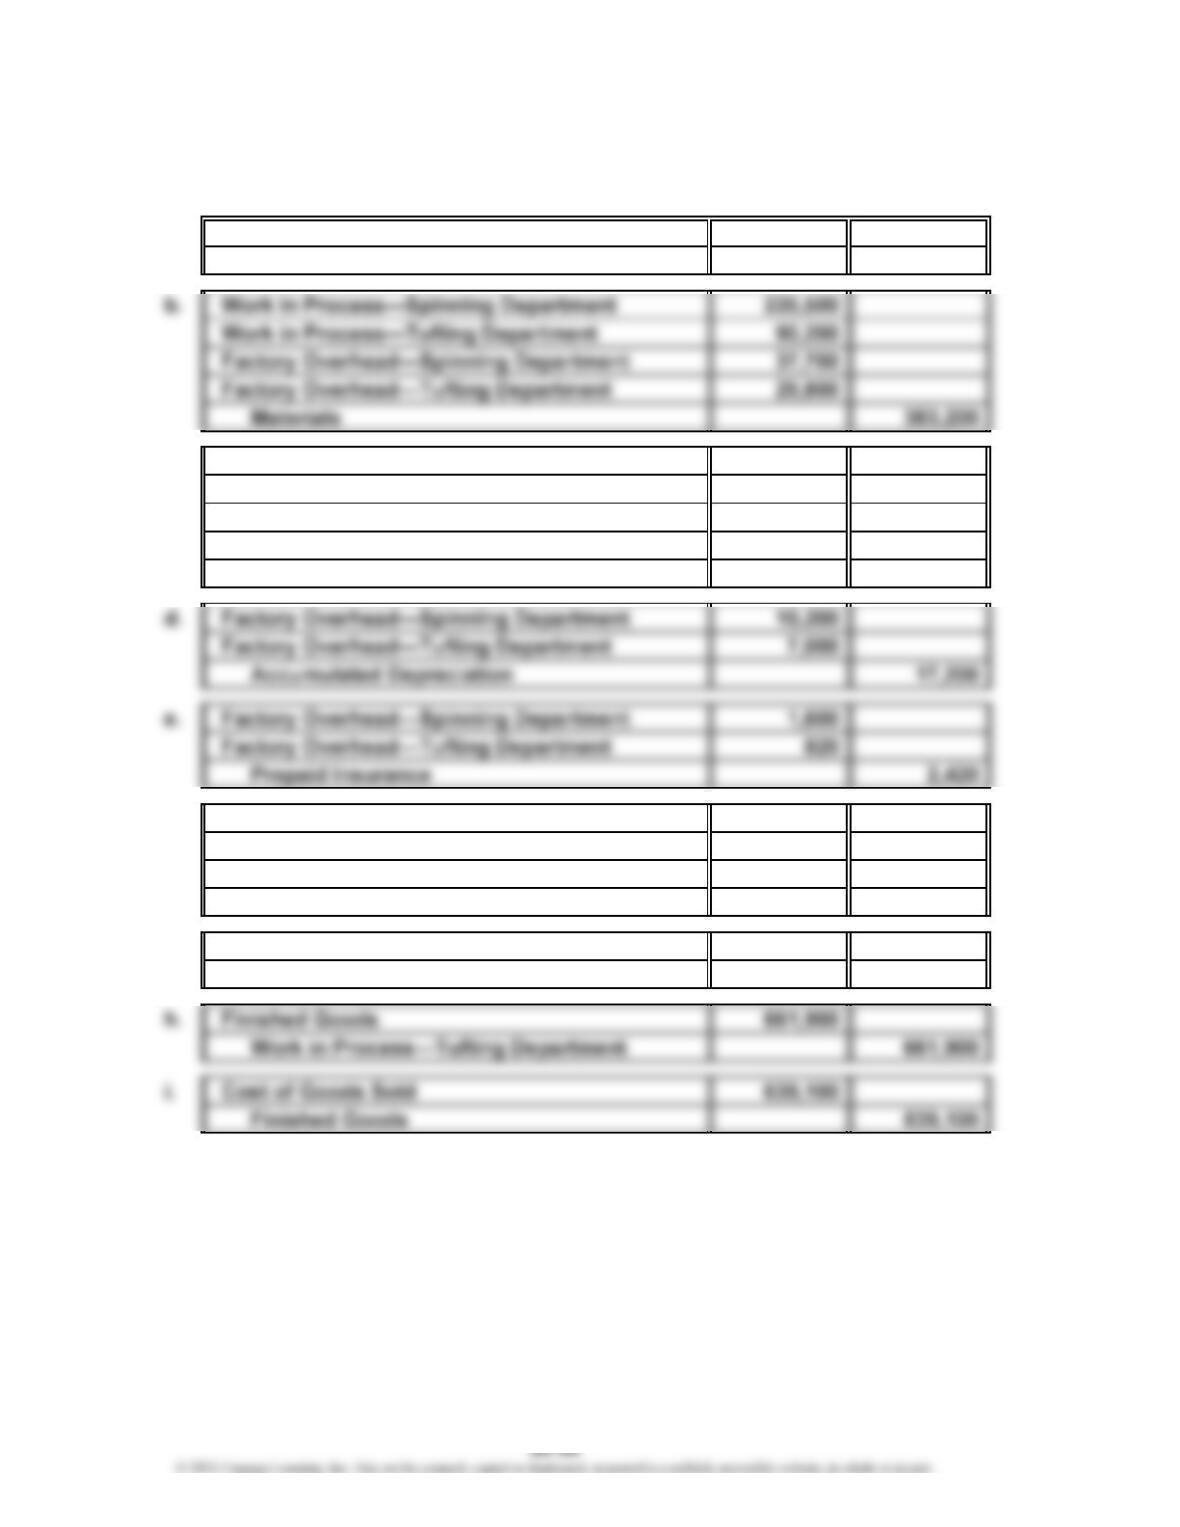
CHAPTER 20 Process Cost Systems
Prob. 20-1A
1. a. Materials 410,000
Accounts Payable 410,000
c. Work in Process—Spinning Department 151,700
Work in Process—Tufting Department 80,300
Factory Overhead—Spinning Department 14,900
Factory Overhead—Tufting Department 7,500
Wages Payable 254,400
f. Work in Process—Spinning Department 64,600
Work in Process—Tufting Department 45,100
Factory Overhead—Spinning Department 64,600
Factory Overhead—Tufting Department 45,100
g. Work in Process—Tufting Department 448,500
Work in Process—Spinning Department 448,500
PROBLEMS
CHAPTER 20 Process Cost Systems
Prob. 20-1A (Concluded)
2.
Work in Work in
Process— Process— Finished
Materials Spinning Dept. Tufting Dept. Goods
Balance, January 1…
…
$ 13,900 $ 28,700 $ 23,400 $ 50,800
Debits…………………
…
410,000 441,800 664,100 661,900
3.
Balance, January 1…
…
Debits…………………
…
Factory Overhead— Factory Overhead—
Spinning Dept. Tufting Dept.
$0 $0
64,400 45,120
12
2
1
CHAPTER 20 Process Cost Systems
Prob. 20-2A
1.
Whole Direct
UNITS Units Materials Conversion
Units charged to production:
Units to be assigned costs:
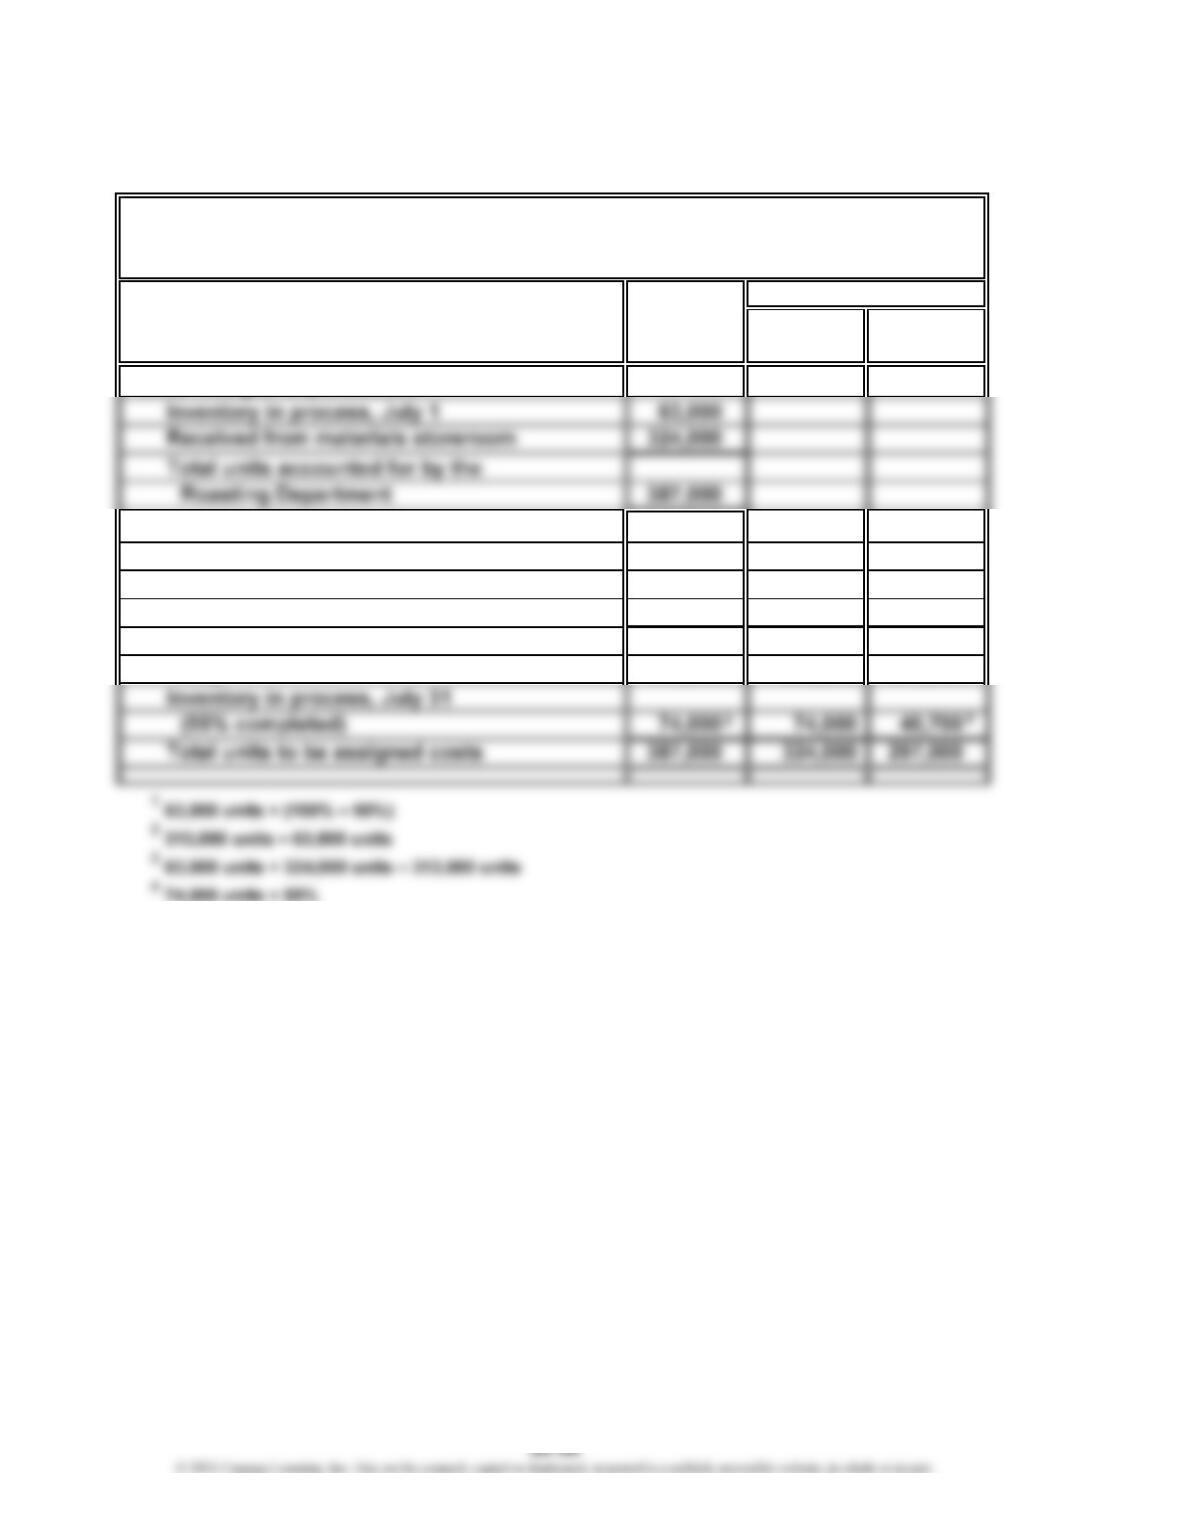
Inventory in process, July 1
(90% completed) 63,000 06,300
Started and completed in July 250,000 250,000 250,000
Transferred to Packing Department in
July 313,000 250,000 256,300
Mochaccino Express Coffee Company
Cost of Production Report—Roasting Department
For the Month Ended July 31
Equivalent Units
1
2
CHAPTER 20 Process Cost Systems
Prob. 20-2A (Continued)
Direct
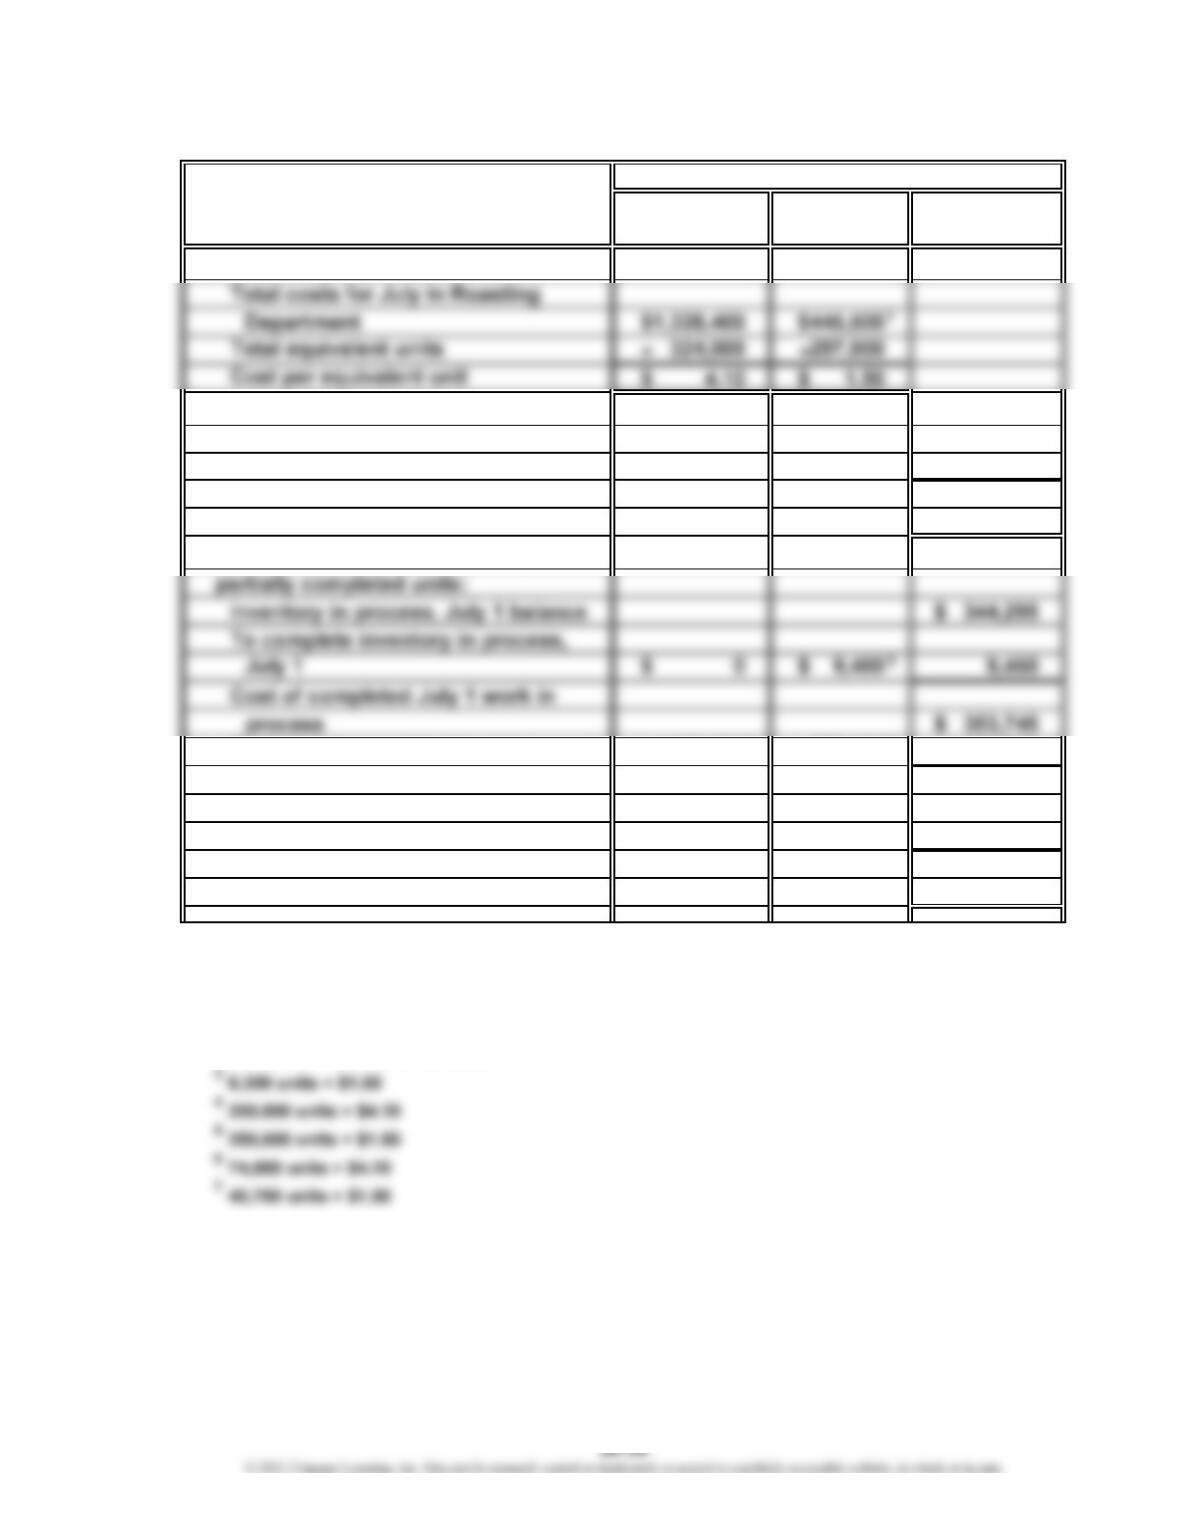
COSTS Materials Conversion Total
Costs per equivalent unit:
Costs assigned to production:
Inventory in process, July 1 $ 344,295
Costs incurred in July 1,773,900
Total costs accounted for by the
Roasting Department $2,118,195
Cost allocated to completed and
Started and completed in July 1,025,000 375,000 1,400,000
Transferred to Packing Department
in July $1,753,745
Inventory in process, July 31 303,400 61,050 364,450
Total costs assigned by the Roasting
Department $2,118,195
Costs transferred to Packing Department: $1,753,745
Work in process, July 31: 74,000 units at a cost of $364,450
1
$325,200 + $120,300
2
$1,328,400 + $325,200 + $120,300
Costs
2
4
5
67
CHAPTER 20 Process Cost Systems
Prob. 20-2A (Concluded)
2. Direct materials cost increased $0.03, from $4.07 in June to $4.10 in July.
Conversion cost decreased $0.05, from $1.55 in June to $1.50 in July.
Computations:
Prob. 20-3A
1.
Whole Direct
UNITS Units Materials Conversion
Units charged to production:
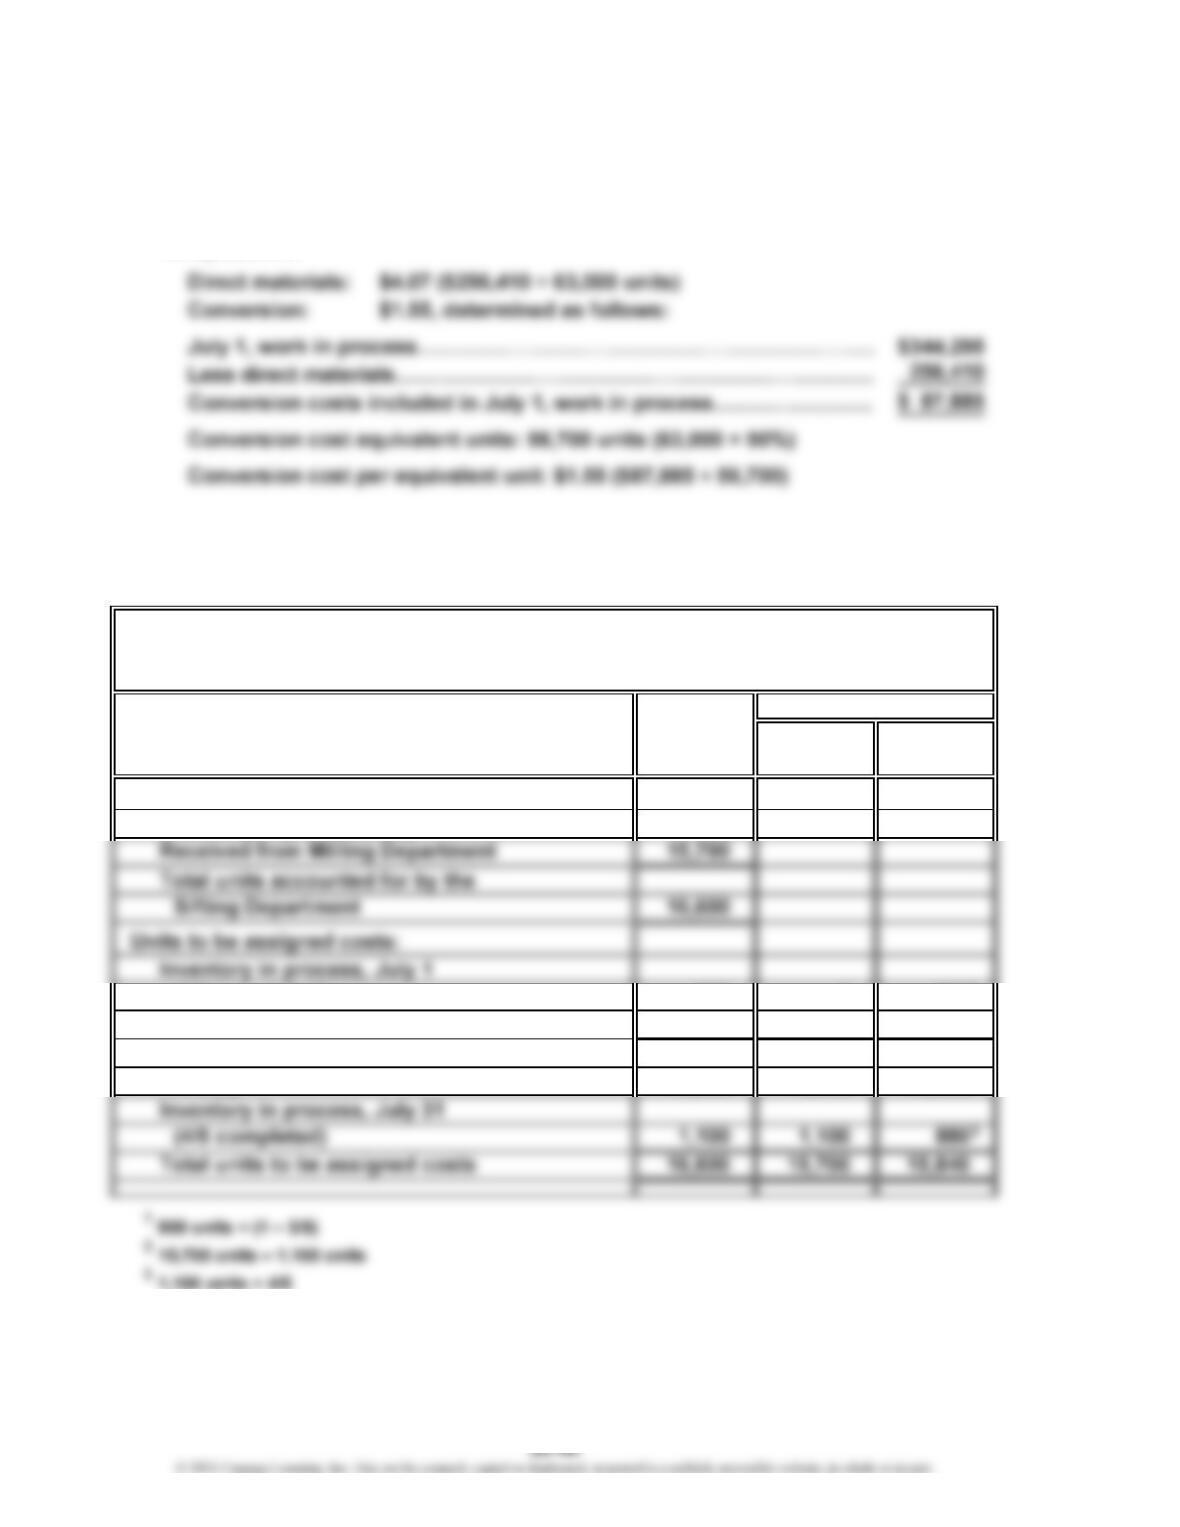
Inventory in process, July 1 900
(3/5 completed) 900 0360
Started and completed in July 14,600 14,600 14,600
Transferred to Packaging Department
in July 15,500 14,600 14,960
White Diamond Flour Company
Cost of Production Report—Sifting Department
For the Month Ended July 31
Equivalent Units
2
1