CHAPTER 16 (FIN MAN); CHAPTER 2 (MAN) Job Order Costing
Prob. 16–5A (FIN MAN); Prob. 2–5A (MAN)
1.
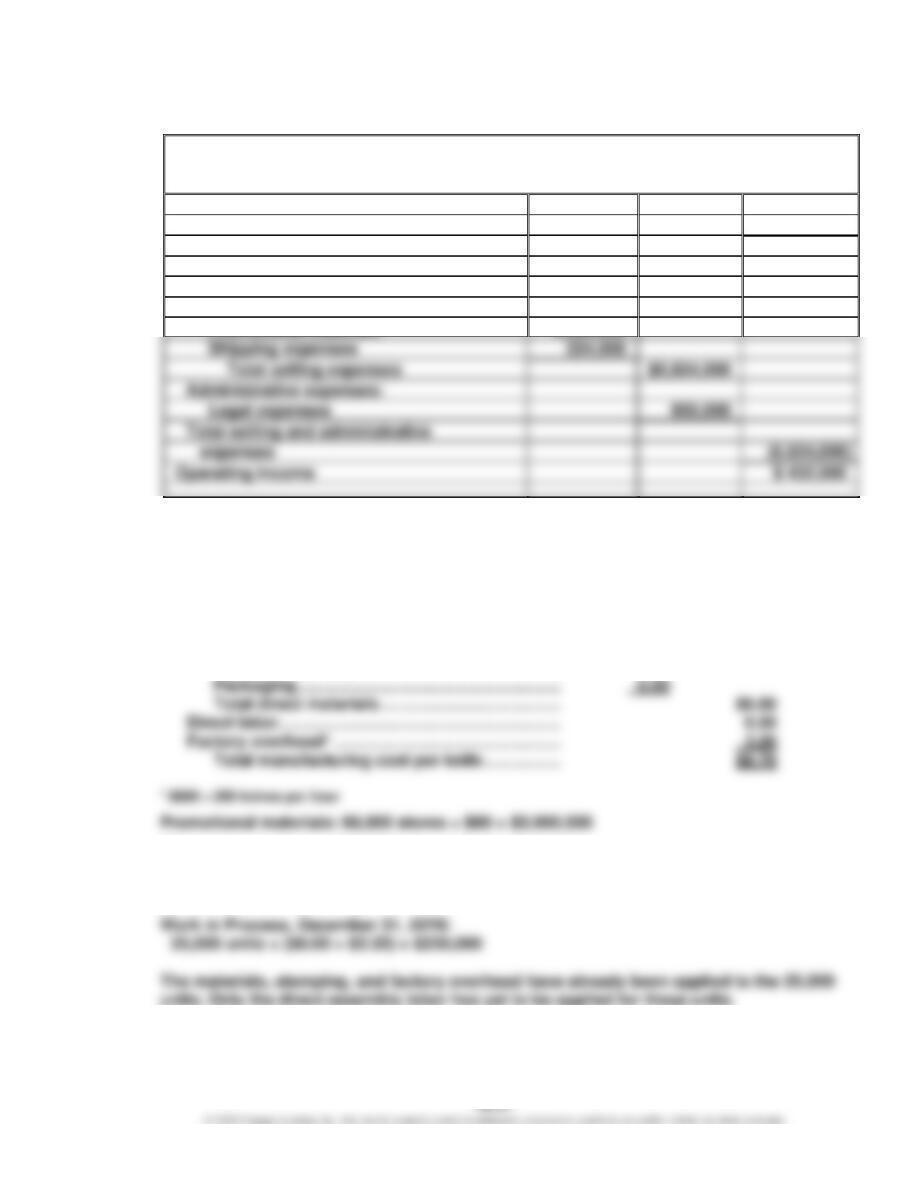
Ginocera Inc.
Income Statement
For the Year Ended December 31, 20Y8
Sales
$ 17,920,000
Cost of goods sold
(10,864,000)
Gross profit
$ 7,056,000
Selling and administrative expenses:
Selling expenses:
Infomercial campaign
$2,000,000
Shipping expenses
Administrative expenses:
Operating income
Supporting calculations:
Sales: 1,120,000 units × $16 = $17,920,000
Cost of goods sold: 1,120,000 units × $9.70 = $10,864,000
Manufacturing cost per unit:
Direct materials:
Hardened steel blanks ………………………………. $4.00
Wood (for handle) …………………………………….. 1.50
Shipping expenses: 1,120,000 units × $0.20 = $224,000
2. Finished Goods balance, December 31, 20Y8:
(1,200,000 units – 1,120,000 units) × $9.70 = $776,000
CHAPTER 16 (FIN MAN); CHAPTER 2 (MAN) Job Order Costing
Prob. 16–1B (FIN MAN); Prob. 2–1B (MAN)
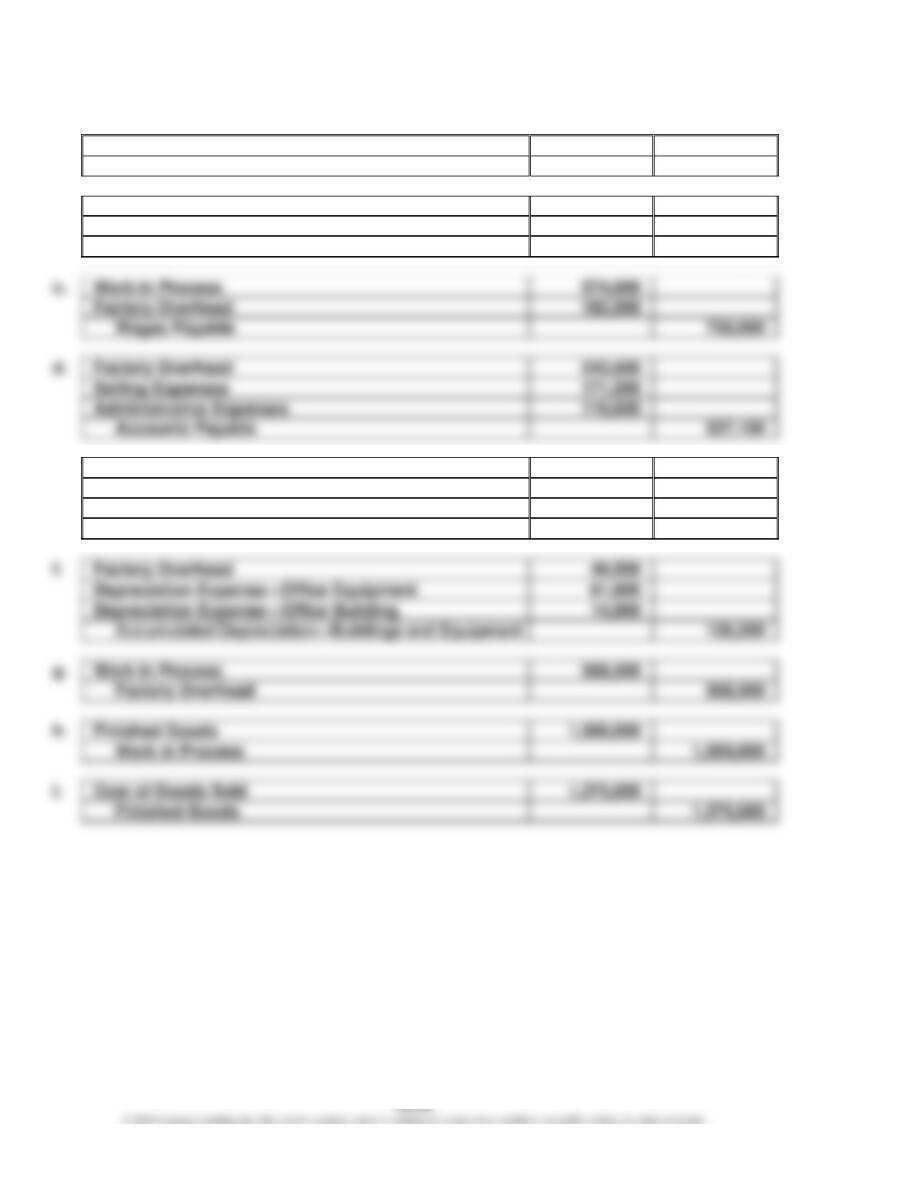
a.
Materials
770,000
Accounts Payable
770,000
b.
Work in Process
604,200
Factory Overhead
75,800
Materials
680,000
c.
Work in Process
574,000
Factory Overhead
182,000
Wages Payable
756,000
d.
Factory Overhead
245,000
Selling Expenses
171,500
Administrative Expenses
110,600
Accounts Payable
527,100
e.
Factory Overhead
24,500
Selling Expenses
28,420
Administrative Expenses
16,660
Prepaid Expenses
69,580
f.
Factory Overhead
49,500
Depreciation Expense—Office Equipment
61,800
Depreciation Expense—Office Building
14,900
126,200
Work in Process
568,500
Factory Overhead
568,500
Finished Goods
Work in Process
i.
Cost of Goods Sold
Finished Goods
CHAPTER 16 (FIN MAN); CHAPTER 2 (MAN) Job Order Costing
Prob. 16–2B (FIN MAN); Prob. 2–2B (MAN)
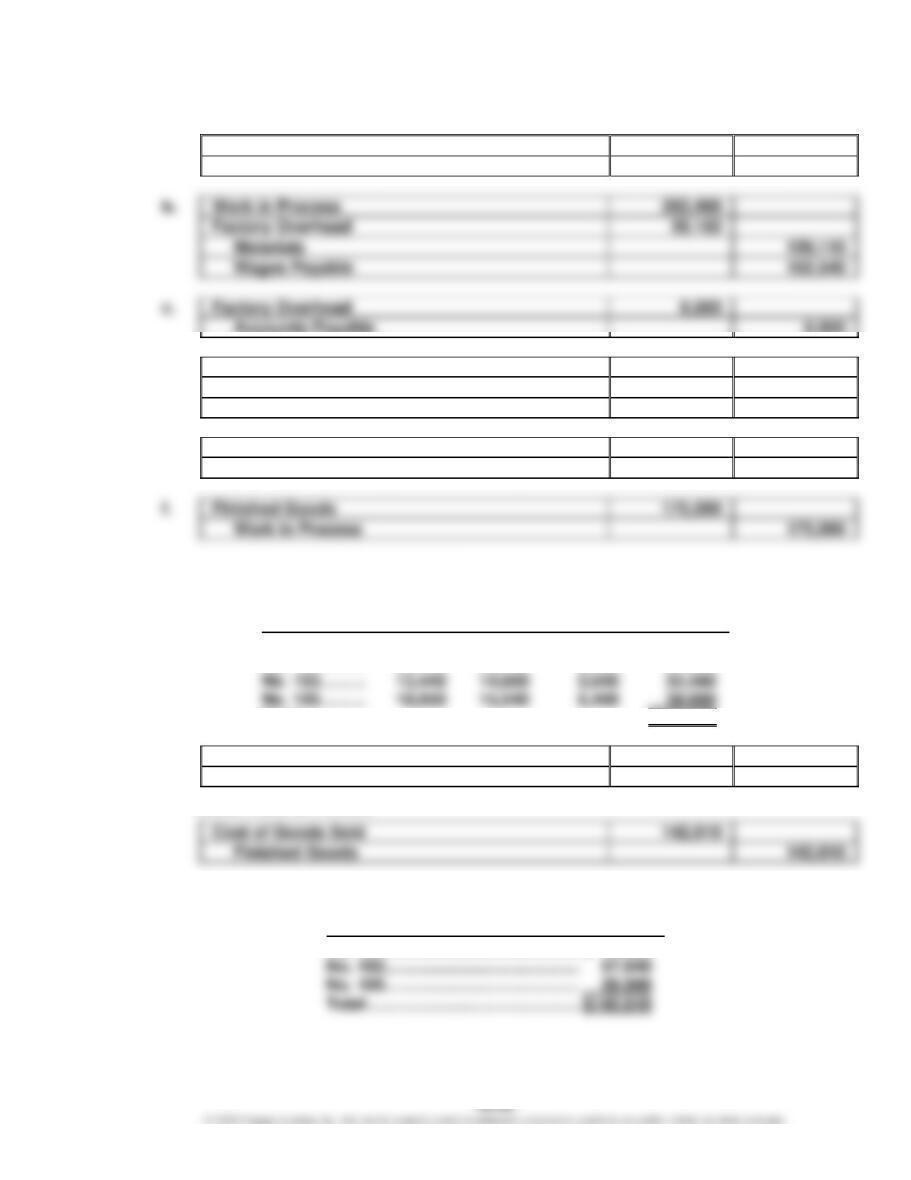
1.
a.
Materials
147,000
Accounts Payable
147,000
Work in Process
262,490
Factory Overhead
Materials
139,110
Wages Payable
152,540
c.
Factory Overhead
6,000
Accounts Payable
6,000
d.
Factory Overhead
4,100
Accumulated Depreciation—Machinery
and Equipment
4,100
e.
Work in Process
40,480
Factory Overhead (1,012 hours × $40)
40,480
Finished Goods
175,090
Work in Process
175,090
Computation of cost of jobs finished:
Job
Direct
Materials
Direct
Labor
Factory
Overhead
Total
No. 101……….
$19,320
$19,500
$6,160
$ 44,980
No. 102……….
23,100
28,140
6,400
57,640
No. 103……….
No. 105……….
18,050
15,540
6,400
Total …………………………………………………………….
$175,090
g.
Accounts Receivable
189,100
Sales*
189,100
* $62,900 + $80,700 + $45,500
Cost of Goods Sold
142,610
Finished Goods
142,610
Computation of cost of jobs sold:
Job
No. 101 ………………………………………………..
No. 102 ………………………………………………..
No. 105 ………………………………………………..
Total ……………………………………………………
CHAPTER 16 (FIN MAN); CHAPTER 2 (MAN) Job Order Costing
Prob. 16–2B (FIN MAN); Prob. 2–2B (MAN) (Concluded)
2.
Work in Process
Finished Goods
(b)
262,490
(f)
175,090
(f)
175,090
(g)
142,610
(e)
40,480
_________
__________
__________
Bal.
127,880
Bal.
32,480
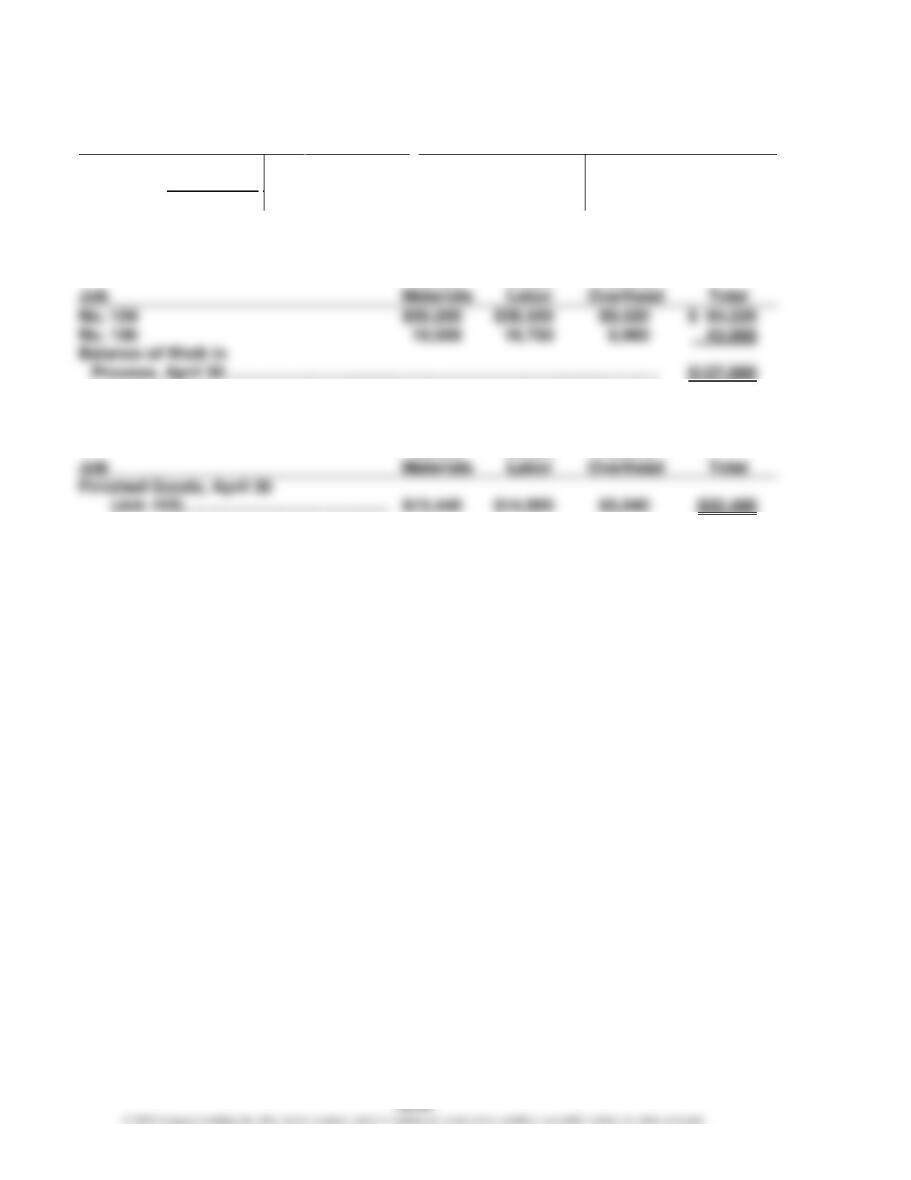
3. Schedule of unfinished jobs:
No. 104
No. 106
Balance of Work in
4. Schedule of completed jobs:
Finished Goods, April 30
CHAPTER 16 (FIN MAN); CHAPTER 2 (MAN) Job Order Costing
Prob. 16–3B (FIN MAN); Prob. 2–3B (MAN)
1. and 2.
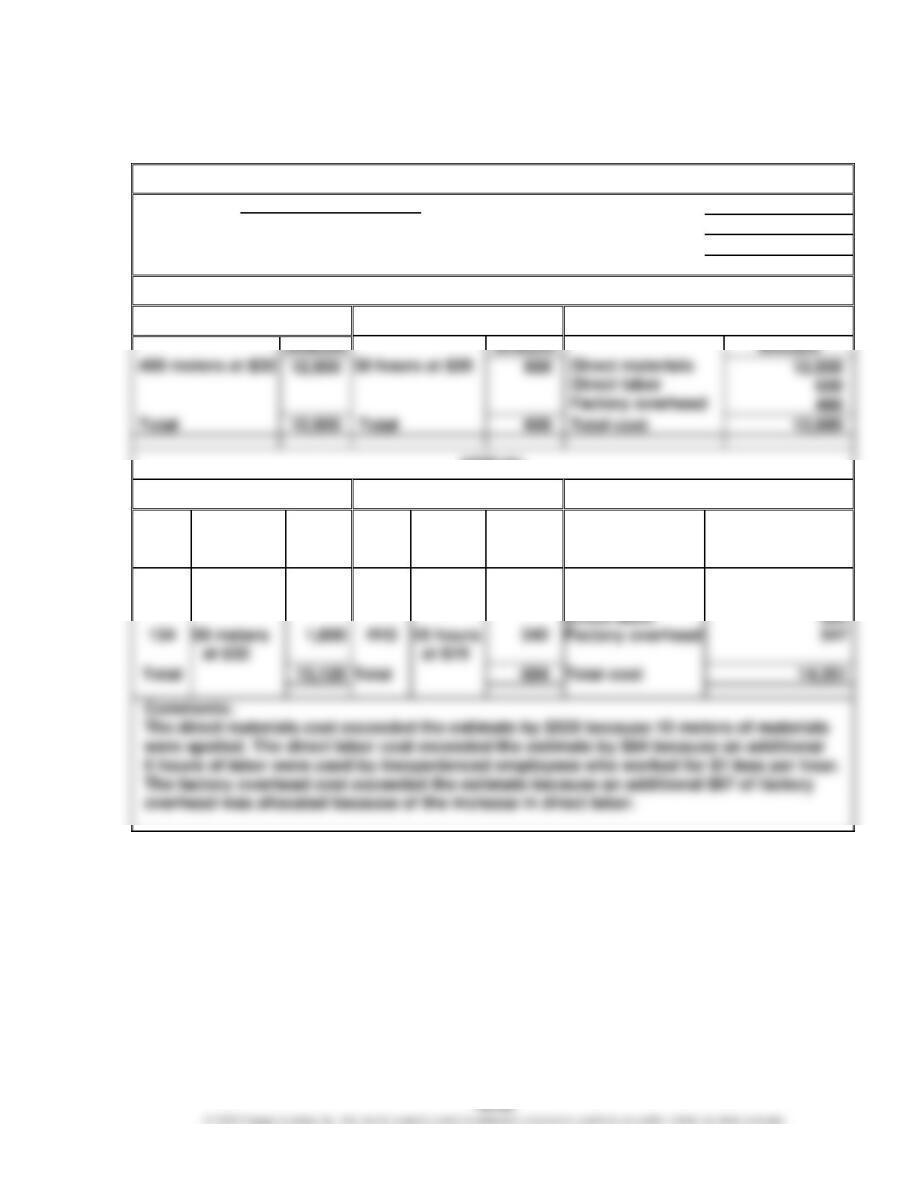
JOB COST SHEET
Customer Lunden Consulting Date
Date wanted
Date completed
Job. No.
May 9
May 15
May 15
ESTIMATE
Direct Materials
Direct Labor
Summary
Amount
Total
Total
Total cost
ACTUAL
Direct Materials
Direct Labor
Summary
Mat.
Req.
No.
Description
Amount
Time
Ticket
No.
Descrip-
tion
Amount
Item
Amount
132
360 meters
at $32
11,520
H9
18 hours
at $19
342
Direct materials
13,120
CHAPTER 16 (FIN MAN); CHAPTER 2 (MAN) Job Order Costing
Prob. 16–4B (FIN MAN); Prob. 2–4B (MAN)
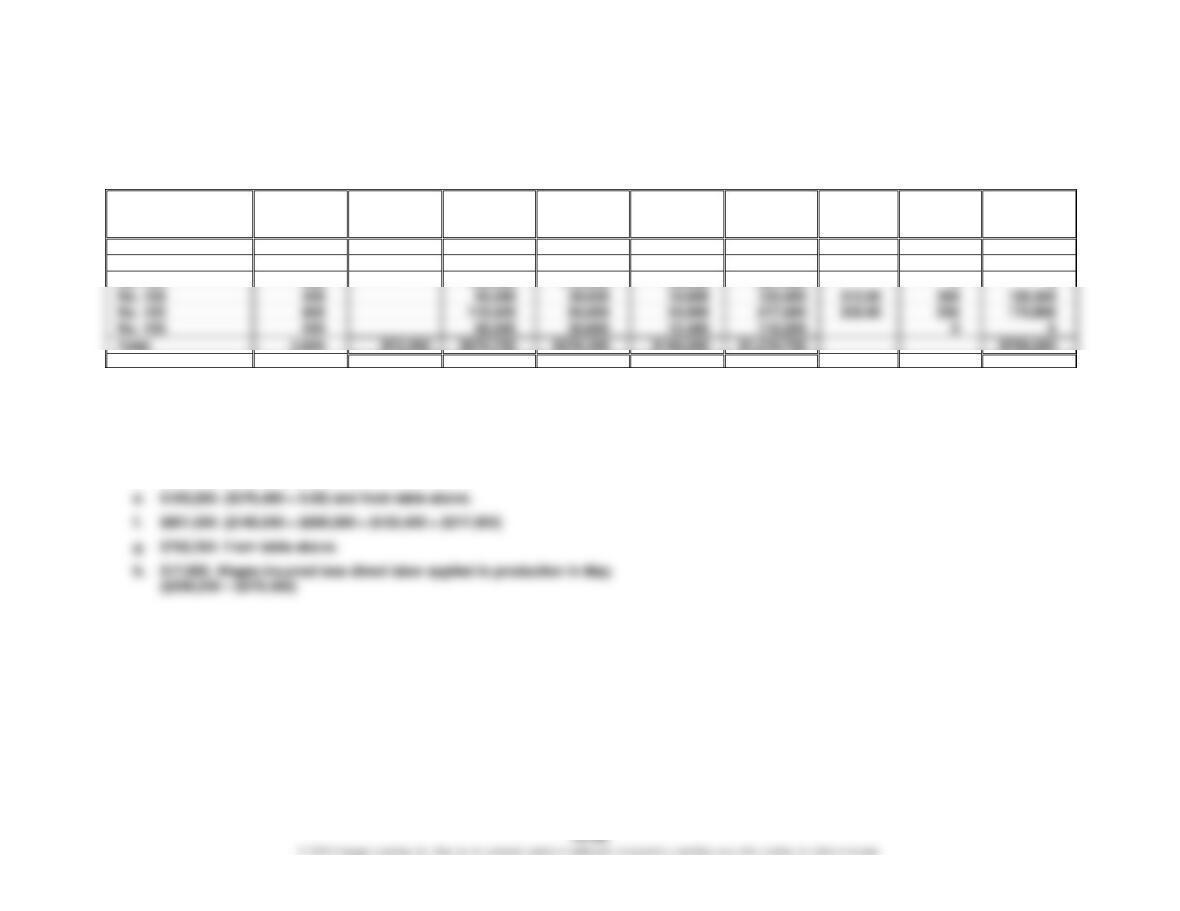
1. Supporting calculations:
Job. No.
Quantity
May 1
Work in
Process
Direct
Materials
Direct
Labor
Factory
Overhead
Total Cost
Unit
Cost
Units
Sold
Cost of
Goods
Sold
No. 101
330
$26,400
$ 82,500
$ 59,400
$ 29,700
$ 198,000
$600.00
264
$158,400
No. 102
380
46,000
105,400
72,600
36,300
260,300
685.00
360
246,600
No. 103
55,000
No. 104
400
66,000
39,600
19,800
125,400
384
120,384
No. 105
660
118,800
66,000
33,000
217,800
330.00
530
174,900
No. 106
330
66,000
30,800
15,400
112,200
Total
2,600
$72,400
$570,700
$378,400
$189,200
$1,210,700
$700,284
a. $586,100. Materials applied to production in May + indirect materials.
($570,700 + $15,400)
b. $72,400. From table above and problem.
c. $570,700. From table above.
d. $378,400. From table above.
CHAPTER 16 (FIN MAN); CHAPTER 2 (MAN) Job Order Costing
Prob. 16–4B (FIN MAN); Prob. 2–4B (MAN) (Concluded)
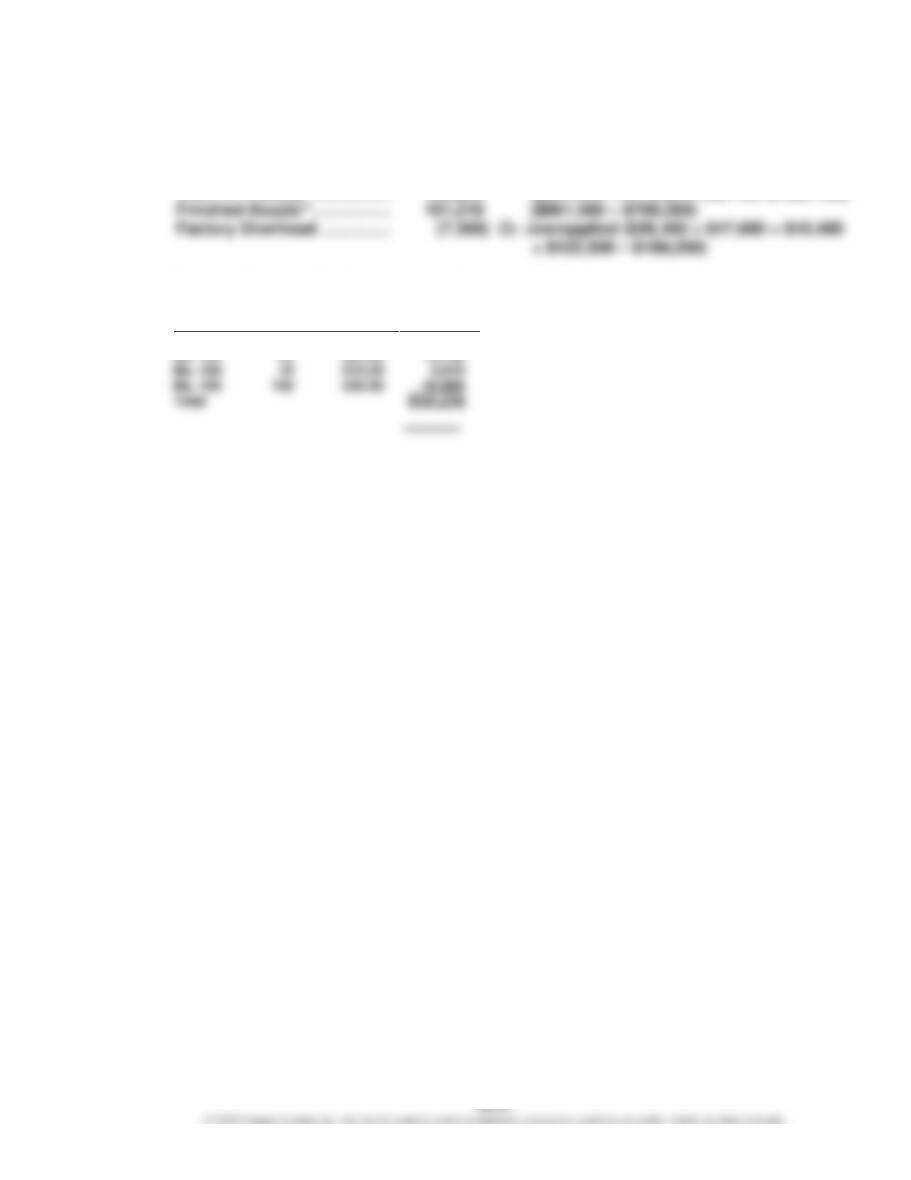
2. May 31 balances:
Materials ………………………… $ 19,500 ($105,600 + $500,000 – $586,100)
* $72,400 + $570,700 + $378,400 + $189,200 – $801,500 = $409,200
**
Job. No.
Units in
Inventory
Unit
Cost
Total
Cost
No. 101
66
$600.00
$ 39,600
No. 104
16
No. 105
Total
CHAPTER 16 (FIN MAN); CHAPTER 2 (MAN) Job Order Costing
Prob. 16–5B (FIN MAN); Prob. 2–5B (MAN)
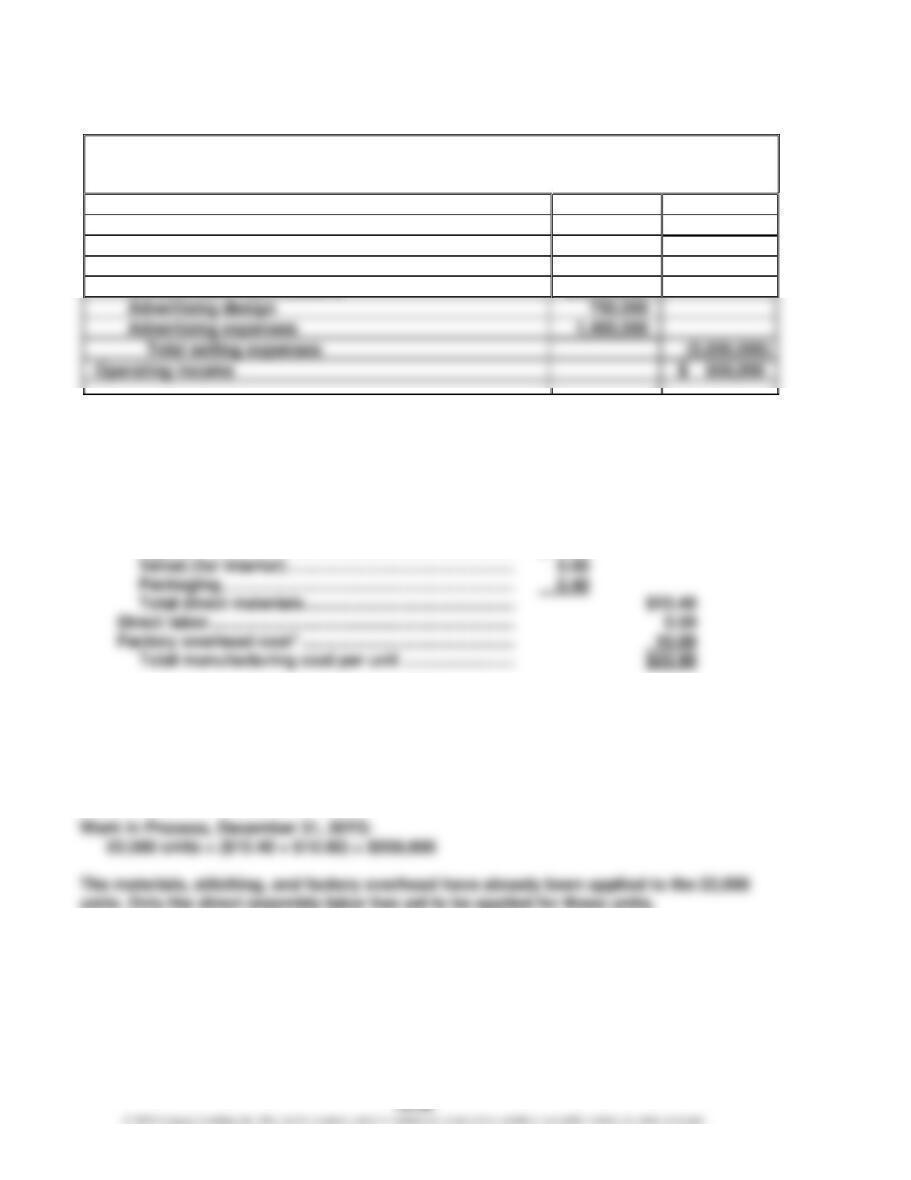
1.
Technology Accessories Inc.
Income Statement
For the Year Ended December 31, 20Y3
Sales
$ 18,400,000
Cost of goods sold
(11,914,000)
Gross profit
$ 6,486,000
Selling expenses:
Operating income
Supporting calculations:
Sales: 460,000 units × $40 = $18,400,000
Cost of goods sold: 460,000 units × $25.90 = $11,914,000
Manufacturing cost per unit:
Direct materials:
Leather ………………………………………………………….. $10.00
* $1,250 ÷ 125 units per hour
Salespersons commissions: $18,400,000 × 20% = $3,680,000
2. Finished Goods balance, December 31, 20Y3:
(500,000 units – 460,000 units) × $25.90 = $1,036,000
CHAPTER 16 (FIN MAN); CHAPTER 2 (MAN) Job Order Costing
MAKE A DECISION
MAD 16–1 (FIN MAN); MAD 2–1 (MAN)
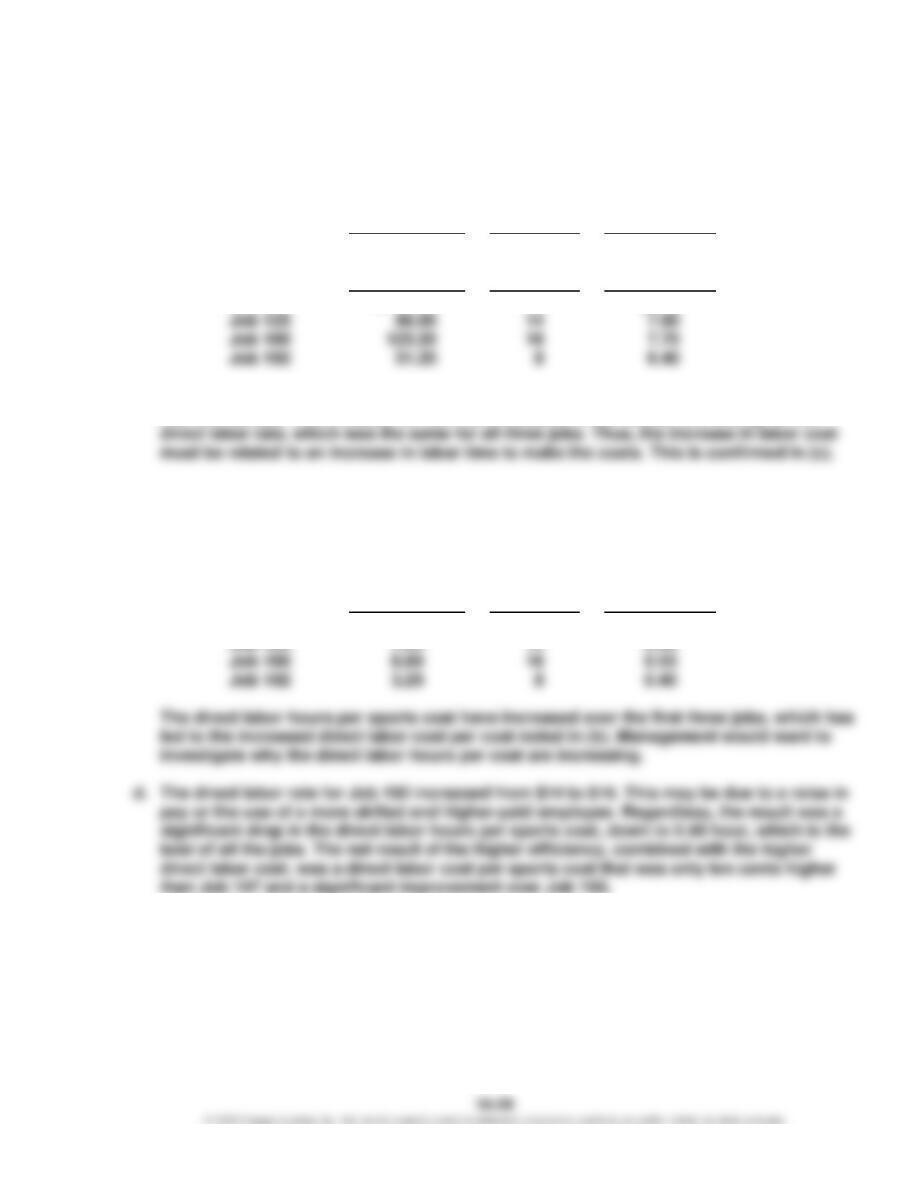
a. Divide the total direct labor cost by the count to determine the direct labor cost per unit
for each job:
Total Direct
Labor Cost
Count
Direct Labor
Cost per
Sports Coat
Job 107
$ 63.00
10
$6.30
Job 125
14
7.00
b. The direct labor cost per sports coat increased over the first three jobs, then declined
with the last job. The increase for the first three jobs is not related to a change in the
c. The direct labor hours per sports coat is determined by dividing the total direct labor
hours by the count as follows:
Direct
Labor Hours
Count
Direct Labor
Hours per
Sports Coat
Job 107
4.50
10
0.45
Job 125
7.00
14
0.50
Job 192
3.20
0.40
than Job 107 and a significant improvement over Job 160.
MAD 16–2 (FIN MAN); MAD 2–2 (MAN)
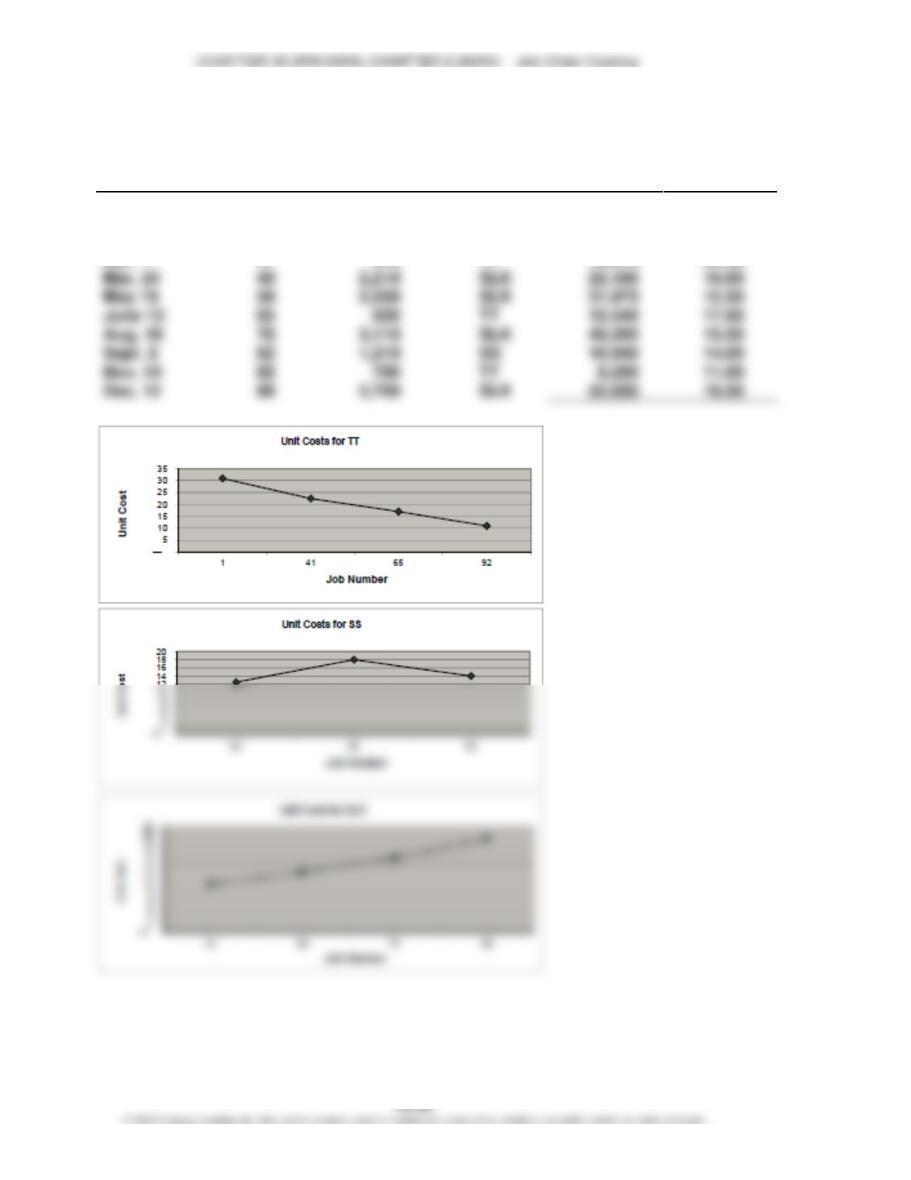
a.
Date
Job. No.
Quantity
Product
Amount
Unit
Cost
Jan. 2
1
520
TT
$16,120
$31.00
Jan. 15
22
1,610
SS
20,125
12.50
Feb. 3
30
1,420
SS
25,560
18.00
Mar. 7
41
15,075
22.50
Mar. 24
49
2,210
22,100
10.00
May 19
58
2,550
31,875
12.50
June 12
65
10,540
17.00
Aug. 18
78
3,110
48,205
15.50
Sept. 2
82
1,210
SS
16,940
14.00
Nov. 14
92
750
TT
8,250
11.00
Dec. 12
98
2,700
52,650
19.50
CHAPTER 16 (FIN MAN); CHAPTER 2 (MAN) Job Order Costing
MAD 16–2 (FIN MAN); MAD 2–2 (MAN) (Concluded)
As can be seen, the unit costs behave differently for each product. SLK has
increasing unit costs during the year, SS is steady, and TT has decreasing unit
costs during the year.
b. Management should want to determine why SLK costs are increasing and why TT