CHAPTER 16 (FIN MAN); CHAPTER 2 (MAN) Job Order Costing
MAD 16–3 (FIN MAN); MAD 2–3 (MAN)
a. The first item to note is that the cost did not go up due to any increases in the cost of
labor or materials. Rather, the cost of the plaques increased because Job 105 used
more labor and materials per unit than did Job 101. Specifically, Job 101 required
exactly the same number of backboards and brass plates as the number of actual
plaques shipped. However, Job 105 required four more backboards and brass plates
than the number actually shipped (34 versus 30). This is illustrated as follows:
Job 101:
Materials
Walnut plaques:
Brass plates:
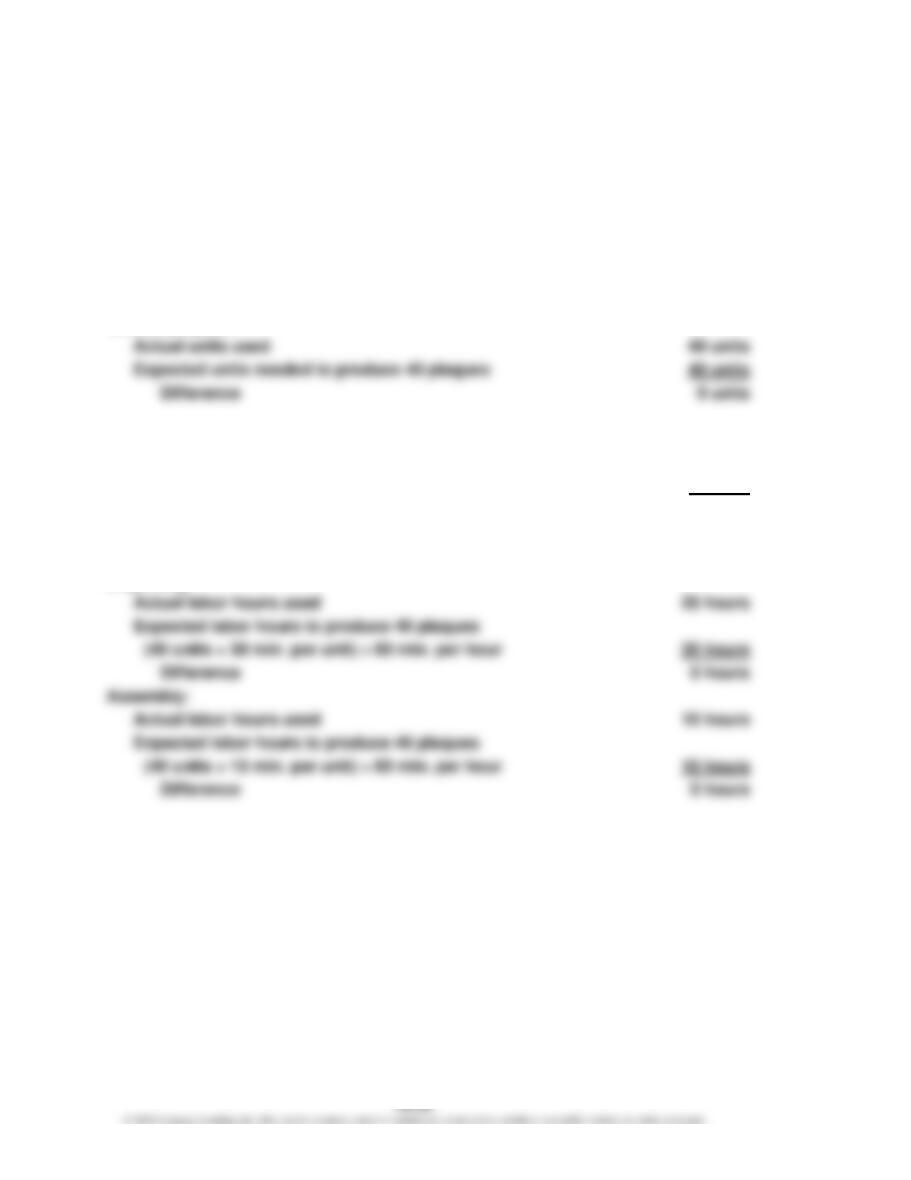
Actual units used 40 units
Expected units needed to produce 40 plaques 40 units
Difference 0 units
Labor
Engraving:
CHAPTER 16 (FIN MAN); CHAPTER 2 (MAN) Job Order Costing
MAD 16–3 (FIN MAN); MAD 2–3 (MAN) (Concluded)
Job 105:
Materials
Walnut plaques:
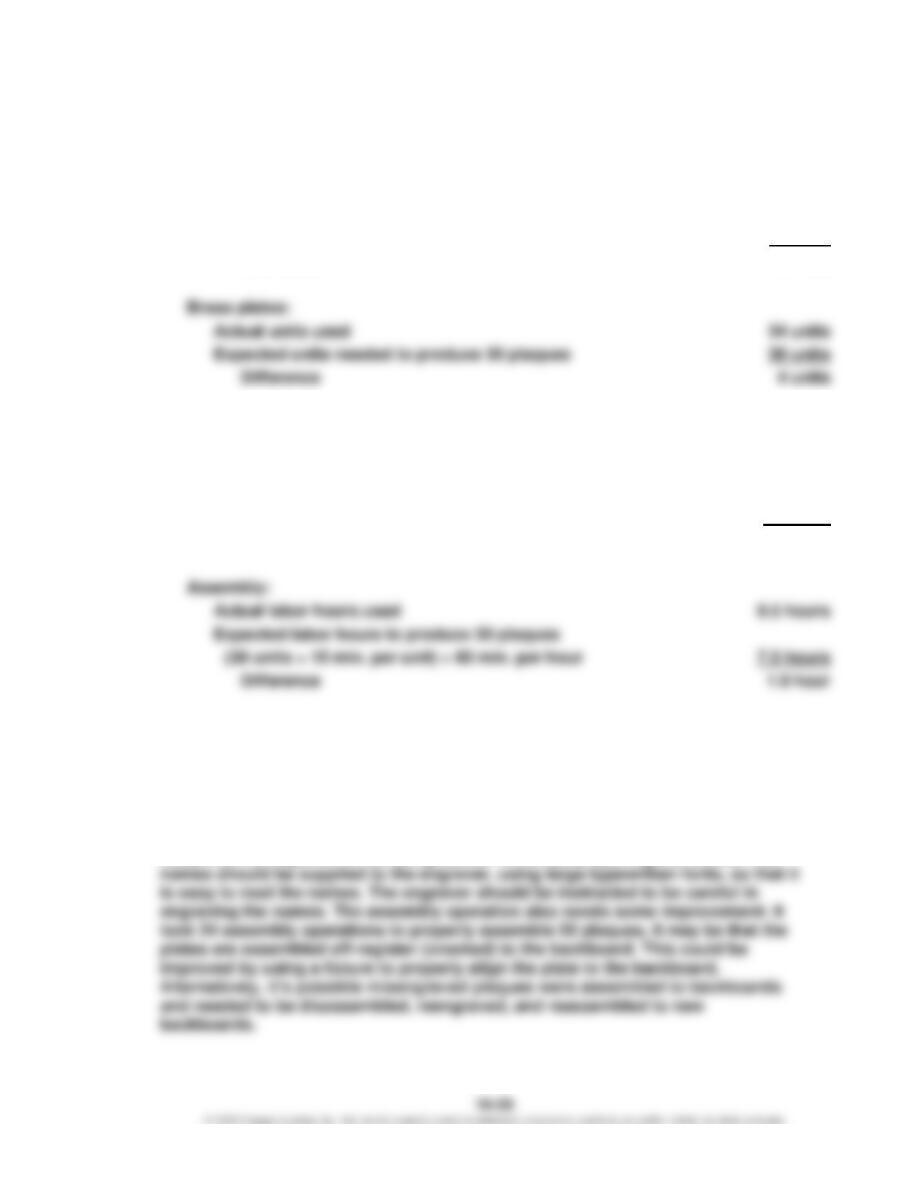
Actual units used 34 units
Expected units needed to produce 30 plaques 30 units
Difference 4 units
Labor
Engraving:
Actual labor hours used 17 hours
Expected labor hours to produce 30 plaques
(30 units × 30 min. per unit) ÷ 60 min. per hour 15 hours
Difference 2 hours
Job 105’s 25.5 labor hours are 3.0 more (25.5 hrs. – 22.5 hrs.) than should have
been expected for a job of 30 plaques [(30 × 45 min.) ÷ 60 min. = 22.5 hrs.]. As a
result, the additional hours of labor cost, applied factory overhead, and direct
materials cost cause the unit cost of Job 105 to increase.
b. Apparently, the engraving and assembly work is becoming sloppy. Job 105
required 34 engraved brass plates in order to get 30 with acceptable quality. It is
likely that the engraver is not being careful in correctly spelling the names. The
CHAPTER 16 (FIN MAN); CHAPTER 2 (MAN) Job Order Costing
MAD 16–4 (FIN MAN); MAD 2–4 (MAN)
a.
A
B
C
D
E
F
Job. No.
Date
Style
Count
Total Direct
Material Cost
Material Cost
per Unit
[Col. E ÷ Col. D]
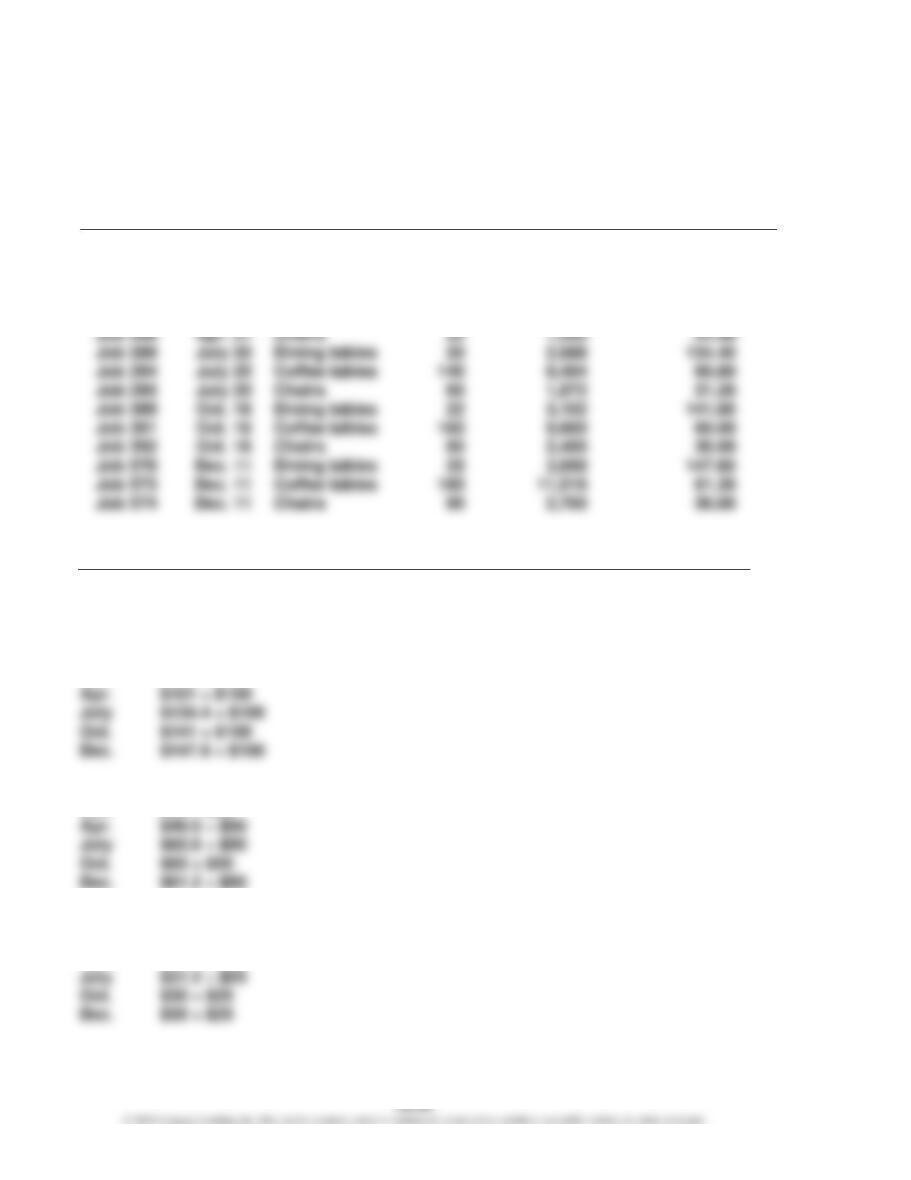
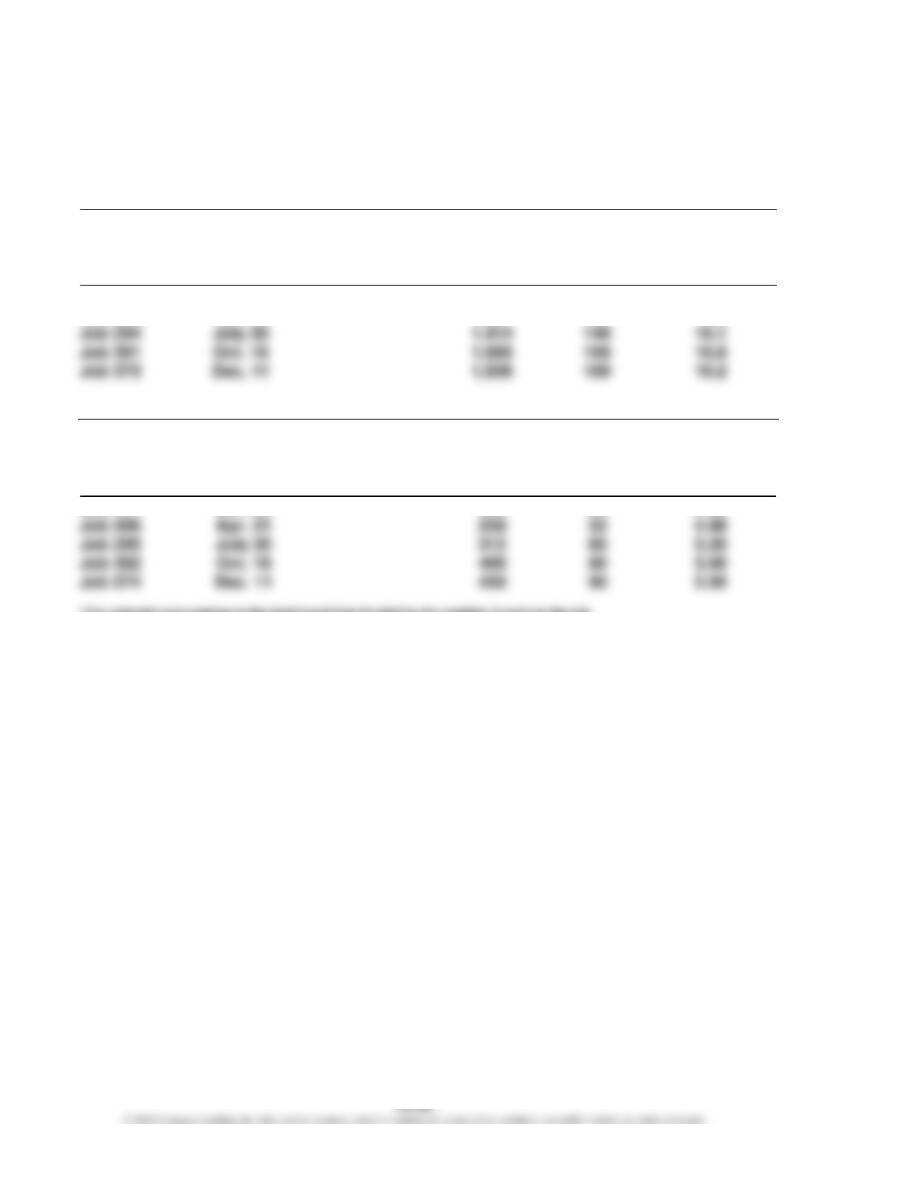
Job 102
Jan. 20
Dining tables
20
$ 2,000
$100.00
Job 106
Jan. 20
Coffee tables
100
5,000
50.00
Job 107
Jan. 20
Chairs
50
1,250
25.00
Job 203
Apr. 21
Dining tables
20
2,020
101.00
Job 205
Apr. 21
Coffee tables
100
4,950
49.50
Job 206
Apr. 21
Chairs
52
1,295
24.90
Job 289
July 20
Dining tables
20
2,688
134.40
Job 294
July 20
Coffee tables
140
8,484
60.60
July 20
Chairs
60
1,872
31.20
Job 389
Dining tables
22
3,102
141.00
Job 391
Coffee tables
160
9,600
60.00
Job 392
Chairs
80
2,400
30.00
Job 570
Dec. 11
Dining tables
25
3,690
147.60
Job 573
Dec. 11
Coffee tables
180
11,016
61.20
Job 574
Dec. 11
Chairs
90
2,700
30.00
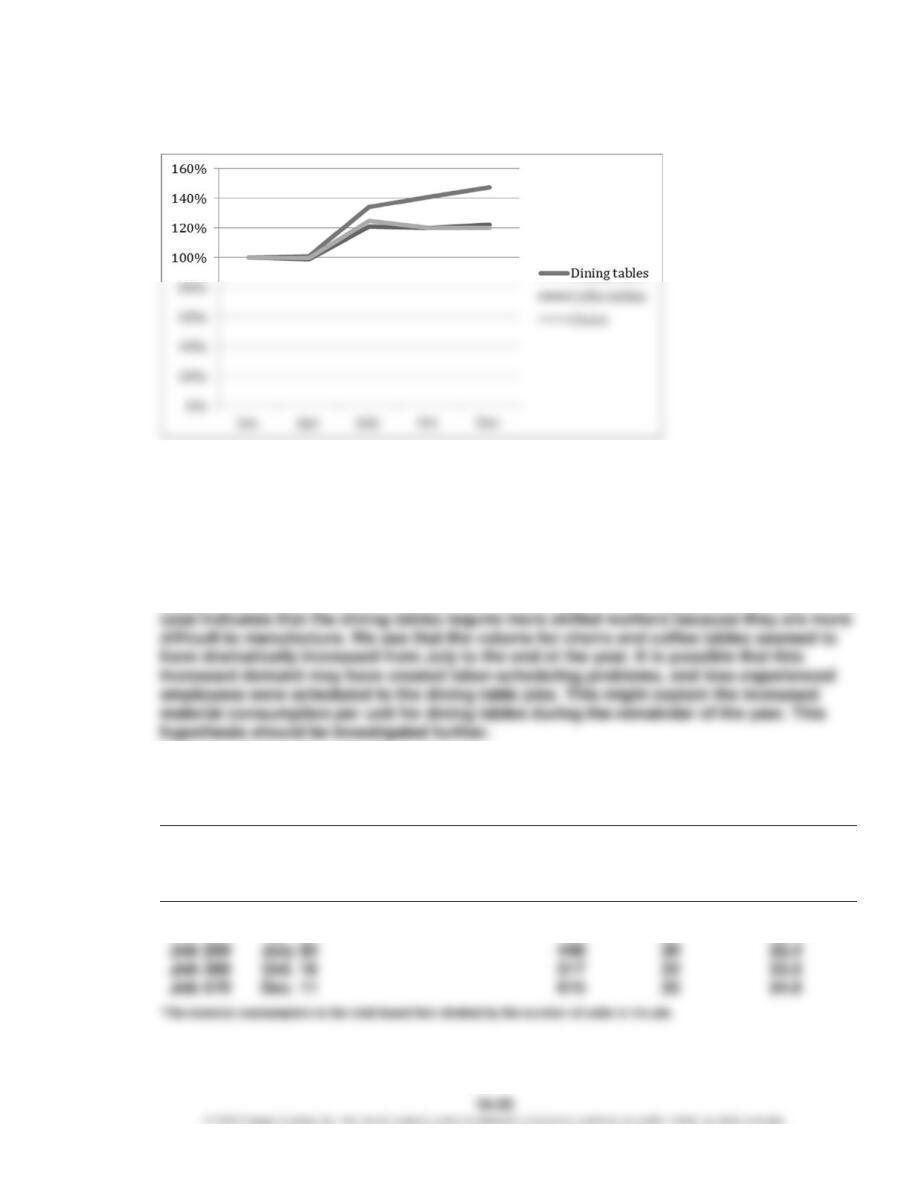
b.
Jan. Apr. July Oct. Dec.
Dining tables 100% 101.0% 134.4% 141.0% 147.6%
Coffee tables 100% 99.0% 121.2% 120.0% 122.4%
Chairs 100% 99.6% 124.8% 120.0% 120.0%
Dining tables:
Jan. $100 ÷ $100
Coffee tables:
Dec. $61.2 ÷ $50
Chairs:
Jan. $25 ÷ $25
Apr. $24.9 ÷ $25
CHAPTER 16 (FIN MAN); CHAPTER 2 (MAN) Job Order Costing
MAD 16–4 (FIN MAN); MAD 2–4 (MAN) (Continued)
c.
d. The cost of all styles went up in July relative to the previous months because of the
change in the cost of the lumber from $5 per board foot to $6 per board foot. This may
have been unavoidable and merely a function of market conditions for oak lumber.
Regardless, the cause of the price increase should be investigated.
However, the material cost per unit for dining tables deviated to the high side relative to
the other two styles, beyond the increased cost of lumber. This must be the result of
using more lumber per unit in October and December, than during January and April. The
Note to Instructors: While not asked in the case specifically, the material consumption
pattern for dining tables is as follows:
Dining Tables
Job. No.
Date
Total Board
Feet
Units
Material
Consumption per
Unit (in board
feet)*
Job 102
Jan. 20
400
20
20.0
Job 203
Apr. 21
404
20
20.2
Job 289
July 20
448
20
22.4
Job 389
Oct. 18
517
22
23.5
Job 570
615
25
24.6
CHAPTER 16 (FIN MAN); CHAPTER 2 (MAN) Job Order Costing
MAD 16–4 (FIN MAN); MAD 2–4 (MAN) (Concluded)
For comparison, the other two styles are as follows:
Coffee Tables
Job. No.
Date
Total Board
Feet
Units
Material
Consumption
per Unit (in
board feet)*
Job 106
Jan. 20
1,000
100
10.0
Job 205
Apr. 21
990
100
9.9
July 20
Job 391
Oct. 18
1,600
160
10.0
Dec. 11
Chairs
Job. No.
Date
Total Board
Feet
Units
Material
Consumption
per Unit (in
board feet)*
Job 107
250
Job 206
259
Job 392
400
*The material consumption is the total board feet divided by the number of units in the job.
CHAPTER 16 (FIN MAN); CHAPTER 2 (MAN) Job Order Costing
TAKE IT FURTHER
TIF 16–1 (FIN MAN); TIF 2–1 (MAN)
No. Tandy’s plan is not ethical. A job order cost accounting system accumulates and
records product costs by jobs. The resulting total and unit product costs can be compared
TIF 16–2 (FIN MAN); TIF 2–2 (MAN)
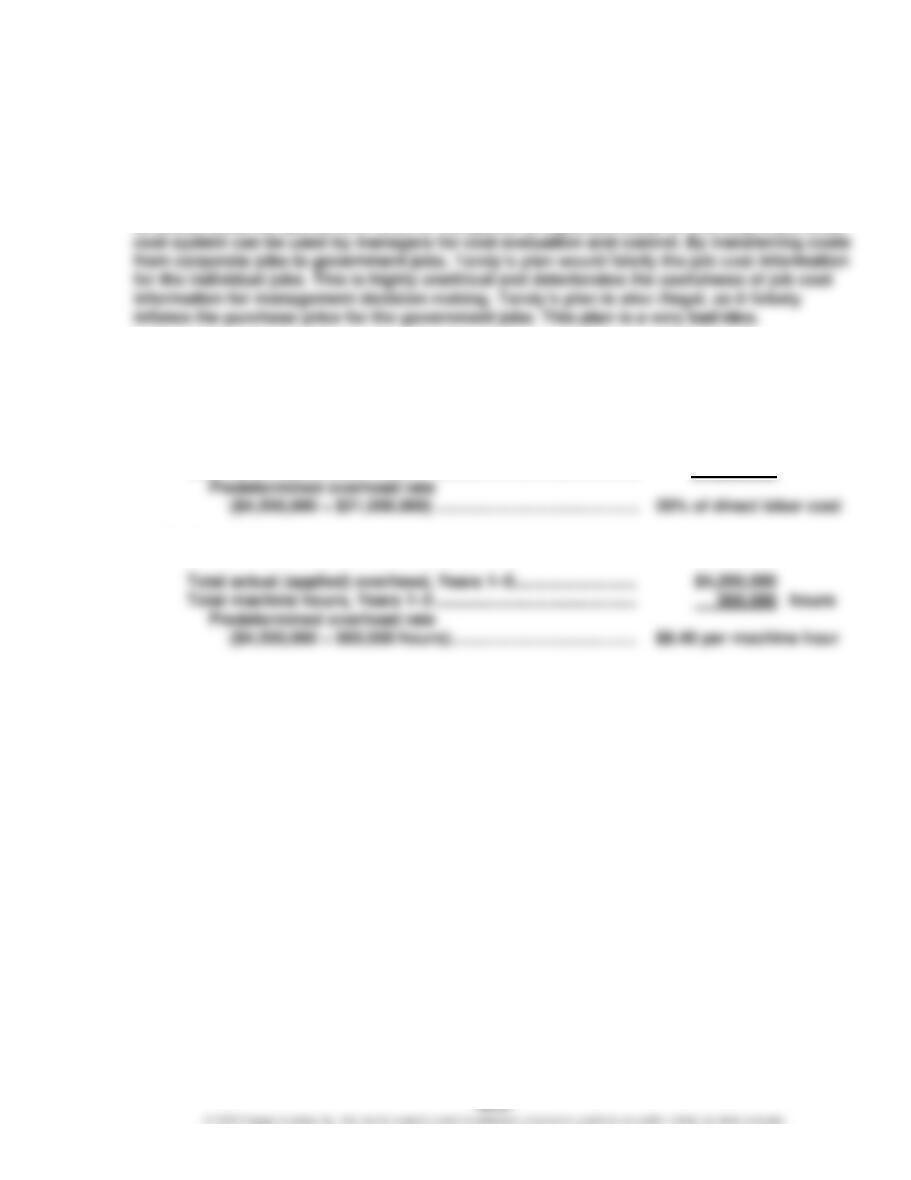
a. Direct labor cost:
Total actual (applied) overhead, Years 1–5 ……………………… $ 4,200,000
Total direct labor cost, Years 1–5 …………………………………… 21,000,000
Machine cost:
CHAPTER 16 (FIN MAN); CHAPTER 2 (MAN) Job Order Costing
TIF 16–2 (FIN MAN); TIF 2–2 (MAN) (Continued)
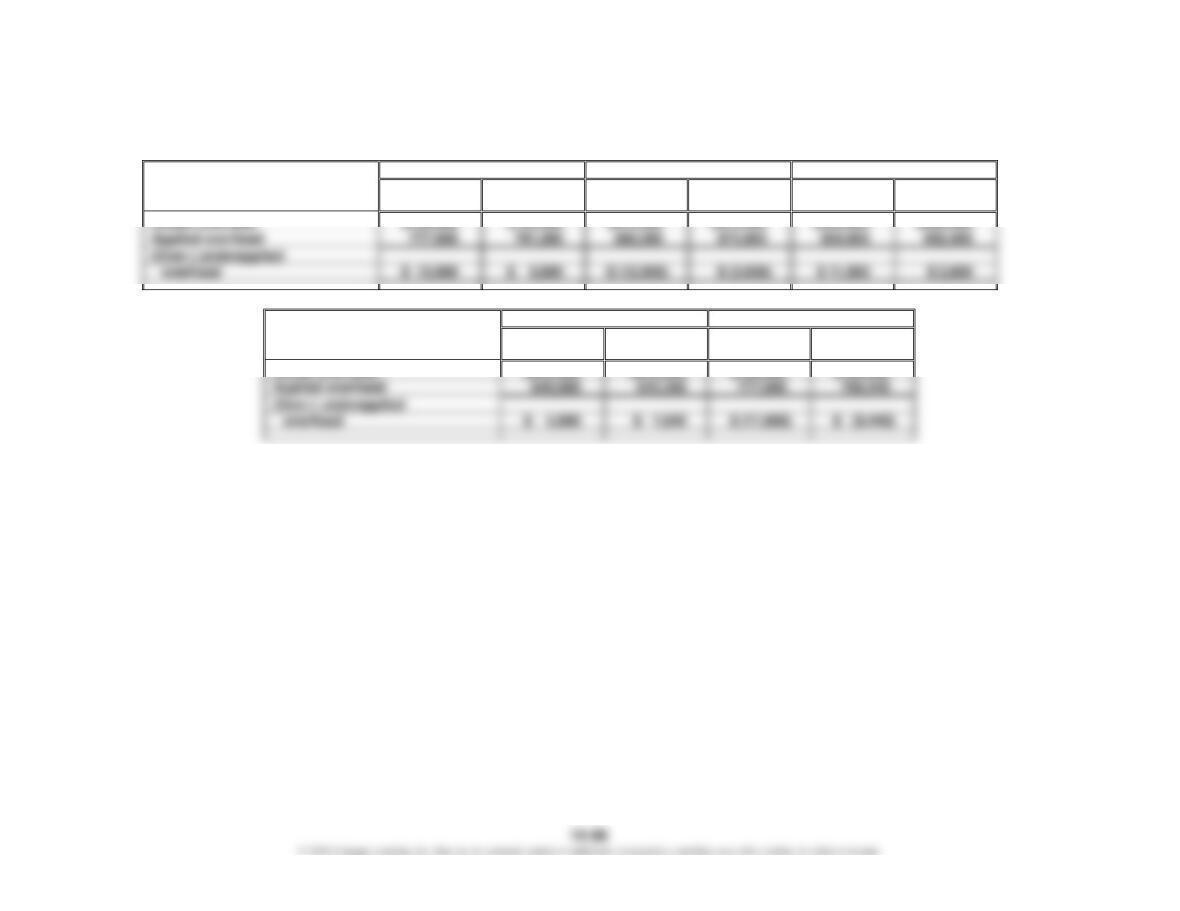
b.
Year 5
Year 4
Year 3
Direct Labor
Cost
Machine
Hours
Direct Labor
Cost
Machine
Hours
Direct Labor
Cost
Machine
Hours
Year 2
Year 1
Direct Labor
Cost
Machine
Hours
Direct Labor
Cost
Machine
Hours
CHAPTER 16 (FIN MAN); CHAPTER 2 (MAN) Job Order Costing
TIF 16–2 (FIN MAN); TIF 2–2 (MAN) (Concluded)
c. The best predetermined overhead rate is machine hours. Although the total overhead
applied for each rate developed in part (a) is the same over the entire five-year period (as
a result of the method by which the predetermined overhead rates were developed), the
TIF 16–3 (FIN MAN); TIF 2–3 (MAN)
Memo
To: Carol Creedence
From: A+ Student
Re: Product CCR Job Cost
The graph of job costs for Product CCR indicates two significant trends in job cost. First,
there appears to be a strong and consistent “Friday effect.” Unit cost increases significantly
The Friday effect could be caused by a reduction in the efficiency of the workforce on
Fridays, as it is the last day of the work week. If this is the case and the trend is not product
The increasing trend in job costs is potentially more complicated. This could be caused by
any number of factors, including increased raw materials cost, decreased quality of raw
materials, or decreased labor efficiency. To evaluate these potential explanations,
CHAPTER 16 (FIN MAN); CHAPTER 2 (MAN) Job Order Costing
TIF 16–4 (FIN MAN); TIF 2–4 (MAN)
a. The unit costs are influenced by both the price and quantity of inputs. On the price side,
Input Quantity per Unit
Job 206
Job 228
Steel input
2.10
tons1
2.60
tons2
Foundry labor
8.00
hours3
10.00
hours4
Welding labor
11.00
hours5
14.00
hours6
1 105 tons ÷ 50 units
These numbers were determined by dividing the total input quantities by the number of
units produced to discover the inputs per unit. The inputs for the components were
unchanged between the two jobs.
b. A possible reason for this deterioration in performance is related to the purchasing
manager’s decision to change vendors in order to secure a lower price per ton. The new
CHAPTER 16 (FIN MAN); CHAPTER 2 (MAN) Job Order Costing
TIF 16–5 (FIN MAN); TIF 2–5 (MAN)
a. Todd should record the debits for factory wages as a debit to Work in Process. The
factory wages are product costs that must be accumulated in the cost of producing
the product. Eventually, these wage costs will become part of the finished goods
b. Jeff would not be concerned about expensing administrative wages and depreciation
CHAPTER 16 (FIN MAN); CHAPTER 2 (MAN) Job Order Costing
CERTIFIED MANAGEMENT ACCOUNTANT (CMA®)
EXAMINATION QUESTIONS (ADAPTED)
1. b. Baldwin’s annual budgeted overhead is $600,000, computed as follows:
2. b. Total overhead applied to Job 231 is $303, computed as follows:
Tooling overhead per hour: $8,625 ÷ 460 hours = $18.75
Fabricating overhead per hour: $16,120 ÷ 620 hours = $26.00
Job 231 overhead: ($18.75 × 12) + ($26.00 × 3) = $303.00
3. c. The unit costs for Job ICU2 would consist of direct materials, direct labor, and
applied overhead per unit.
4. d. The overhead applied to a job incurring 20 direct labor hours would be $140,
computed as follows: