Unlock document.
This document is partially blurred.
Unlock all pages and 1 million more documents.
Get Access
From 2012 through 2013 Intel wrote off a total of $6 million of accounts and charged $8 million to the
bad expense account. These amounts seem reasonable. Intel estimates that about 1% of their accounts
receivable will not be collected each year, however, the firm actually collects more than 99% of their
receivables which is impressive.
(d) Intel has the typical liabilities found on most companies' balance sheets: short-term debt,
accounts payable, accrued liabilities, deferred income, long-term debt and deferred tax liabilities. No
one current liability account is significant. Long-term debt is the most significant liability for Intel making
up 14% of total assets. There have been no significant changes to the debt and equity structure. While
the percentage of long-term debt has dropped 2%, the actual dollar amount has increased slightly. This
change in percentage is a result of the total assets increasing faster than the long-term debt. Intel’s total
stockholder’s equity makes up 63% of total assets while total debt makes up 37%. Equity has increased
2% from 2012 as a result of increases to retained earnings and the accumulated other income accounts.
Contingencies are comprised of legal proceedings including significant challenges filed by AMD and
others to the company’s competitive practices. The European Commission (EC) imposed a $1.447 billion
fine on Intel in 2009 that Intel has paid; however, Intel has appealed the EC’s decision and the EC is
expected to rule in 2014. Intel anticipates these challenges will continue for a number of years and may
require financial resources and management time to defend their position. Intel has indicated in their
(f) Deferred taxes are included under current assets, non-current assets and non-current liabilities.
Depreciation is the most significant component of deferred taxes.
Case 2.2 (a)
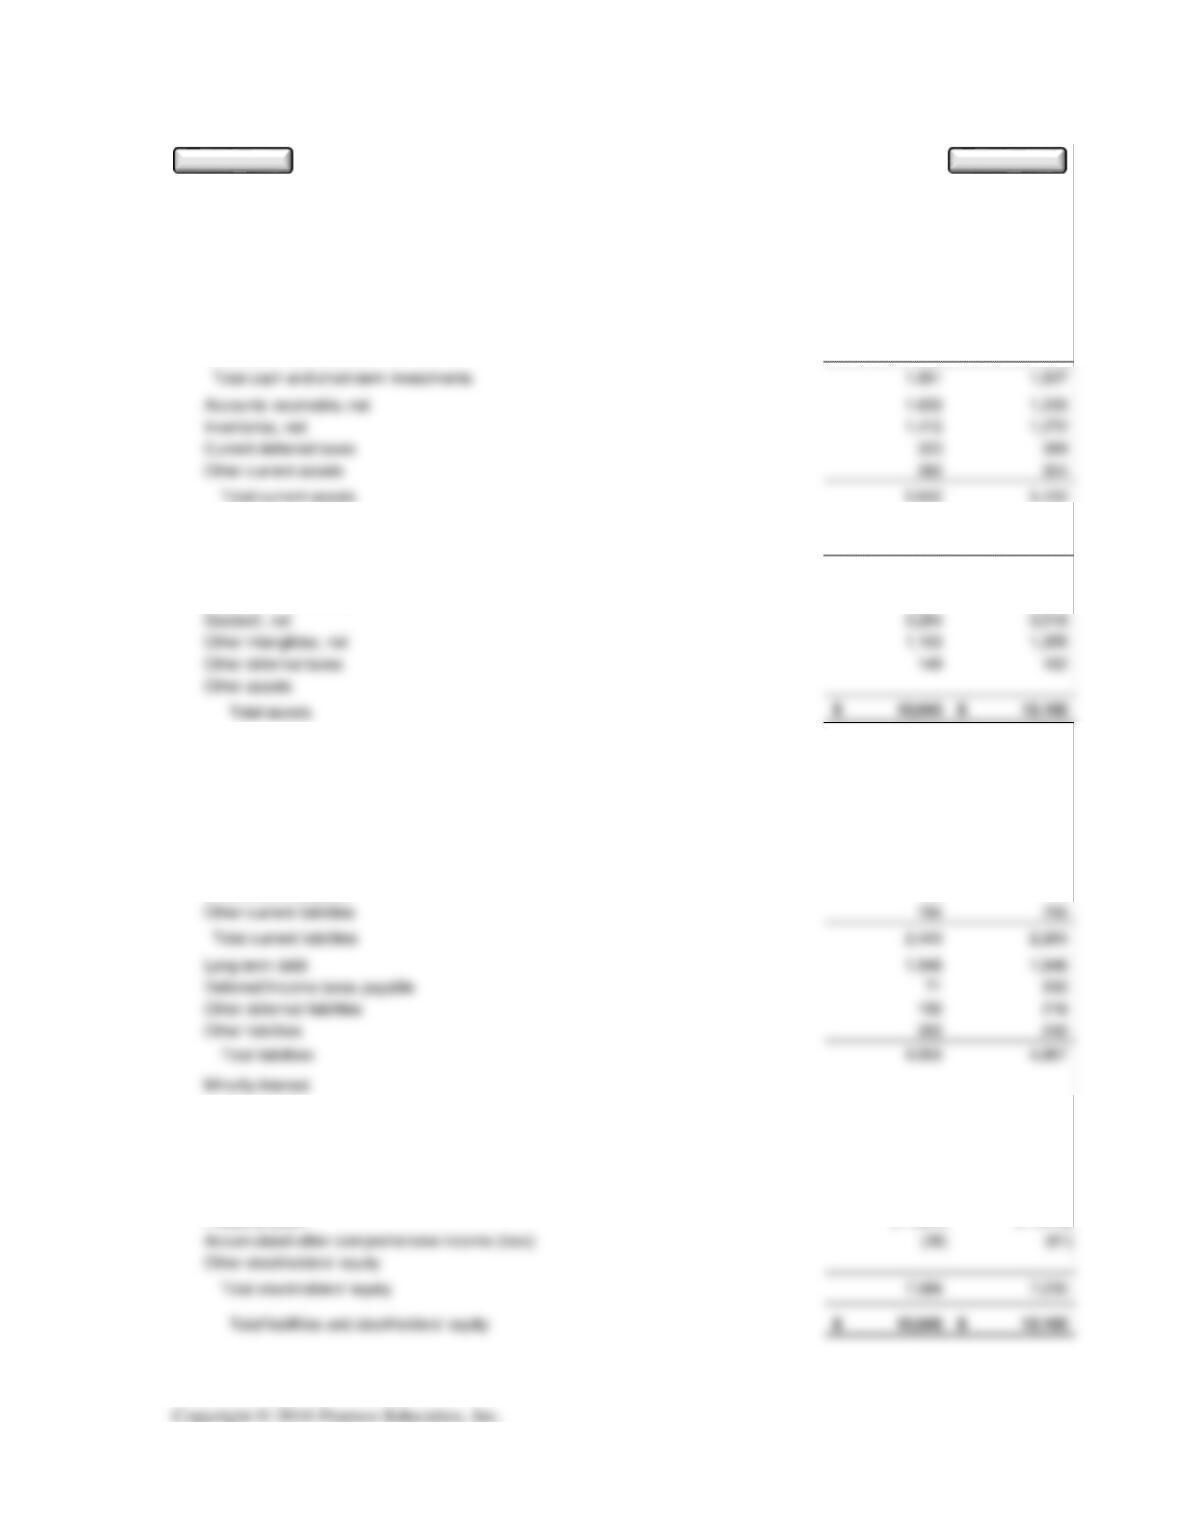
Oct 27, 2013 Oct 28, 2012
ASSETS
Current Assets:
Cash and cash equivalents 1,711$ 1,392$
Short-term investments 180 545
Property, plant, and equipment 2,817 2,917
Less: accumulated depreciation 1,967 2,007
Net property, plant, and equipment 850 910
Long-term investments 1,005 1,055
LIABILITIES
Current Liabilities:
Accounts payable 582$ 396$
Short-term debt
Current portion of long-term debt
Accrued liabilities 994 1,040
Income taxes payable 73 74
STOCKHOLDERS' EQUITY
Preferred stock
Common stock, par value plus additional paid-in capital 6,163 5,875
Retained earnings (accumulated deficit) 12,487 12,700
Treasury stock (11,524) (11,279)
Applied Materials (AMAT / NASDAQ)
Annual Consolidated Balance Sheet
Amou n ts Rou n d ed to : M illion s
Results as of
Clear
Edit
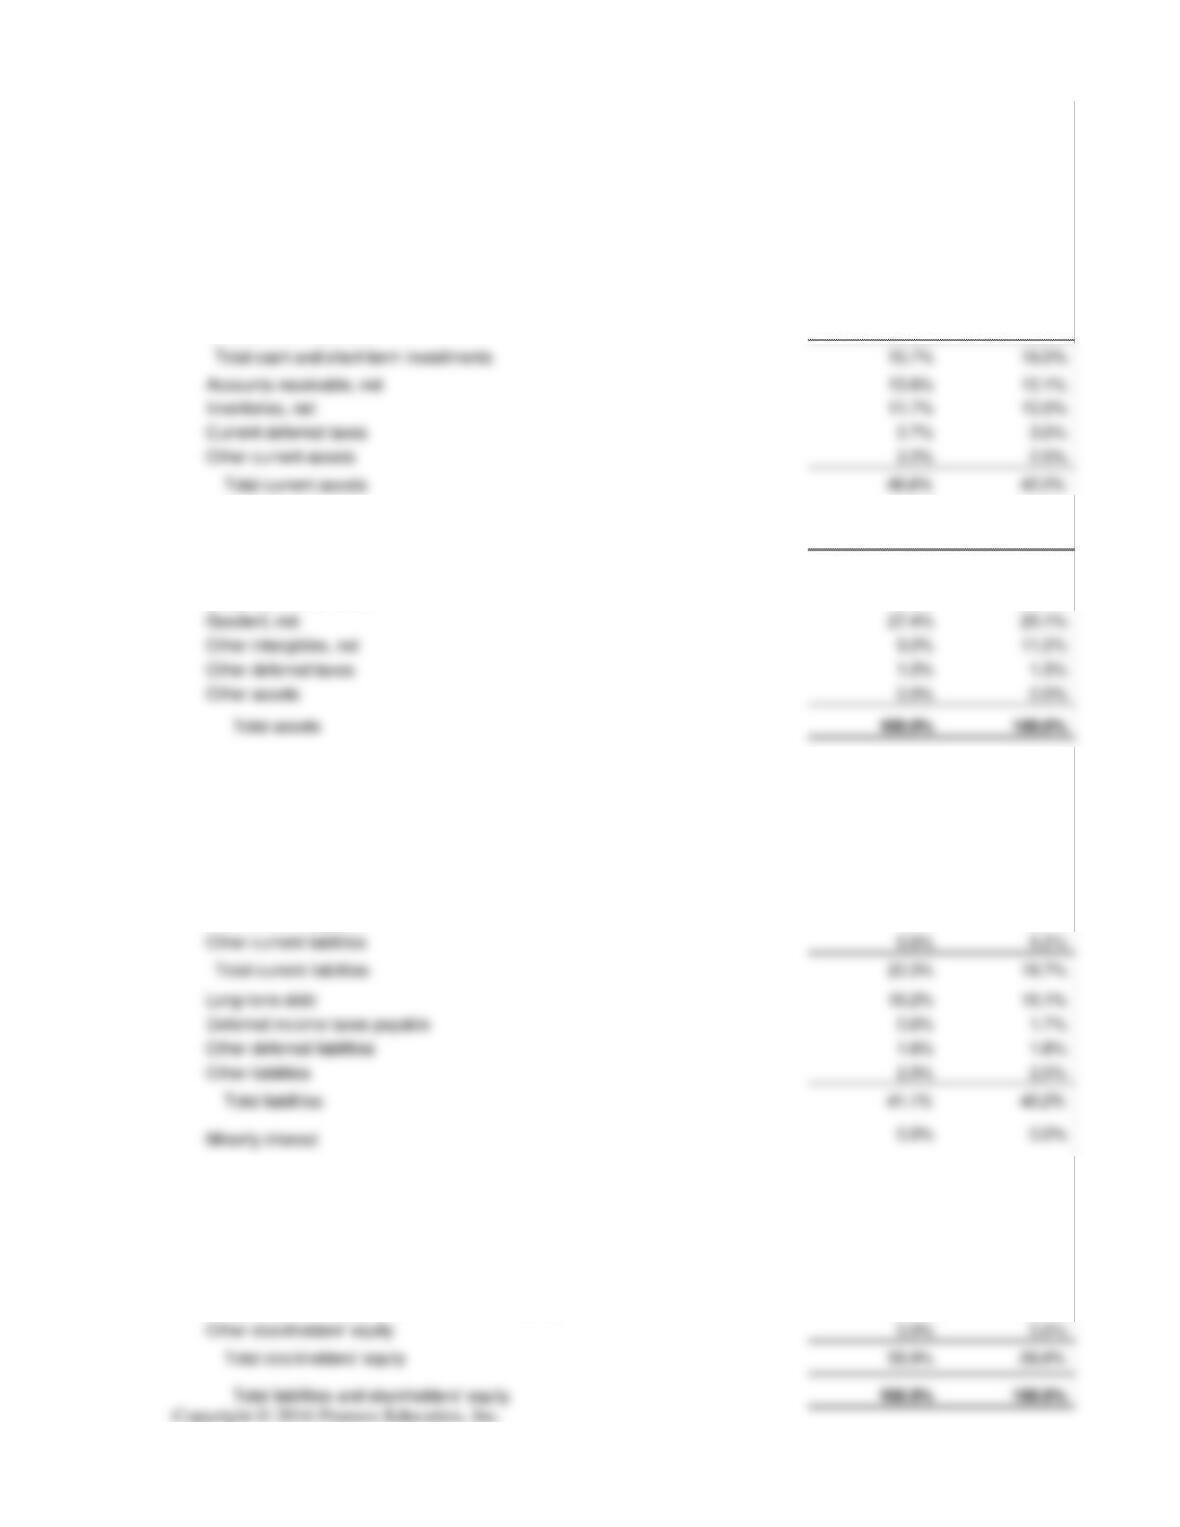
Oct 27, 2013 Oct 28, 2012
ASSETS
Current Assets:
Cash and cash equivalents 14.2% 11.5%
Short-term investments 1.5% 4.5%
Property, plant, and equipment 23.4% 24.1%
Less: accumulated depreciation 16.3% 16.6%
Net property, plant, and equipment 7.1% 7.5%
Long-term investments 8.3% 8.7%
LIABILITIES
Current Liabilities:
Accounts payable 4.8% 3.3%
Short-term debt 0.0% 0.0%
Current portion of long-term debt 0.0% 0.0%
Accrued liabilities 8.3% 8.6%
Income taxes payable 0.6% 0.6%
STOCKHOLDERS' EQUITY
Preferred stock 0.0% 0.0%
Common stock, par value plus additional paid-in capital 51.2% 48.5%
Retained earnings (accumulated deficit) 103.7% 104.9%
Treasury stock (95.7%) (93.2%)
Accumulated other comprehensive income (loss) (0.3%) (0.5%)
Results as of
S um m ary percen tag es in italics will n ot foot d u e to rou nd ing
Annual Common Size Balance Sheet
Applied Materials (AMAT / NASDAQ)
(b) The overall structure of Applied Materials’ (AMAT) balance sheet is stable from 2012 to 2013.
Total assets have decreased slightly in 2013. Current assets have grown over 4% mainly due to growth in
accounts receivable and inventories. All long-term asset accounts have declined slightly.
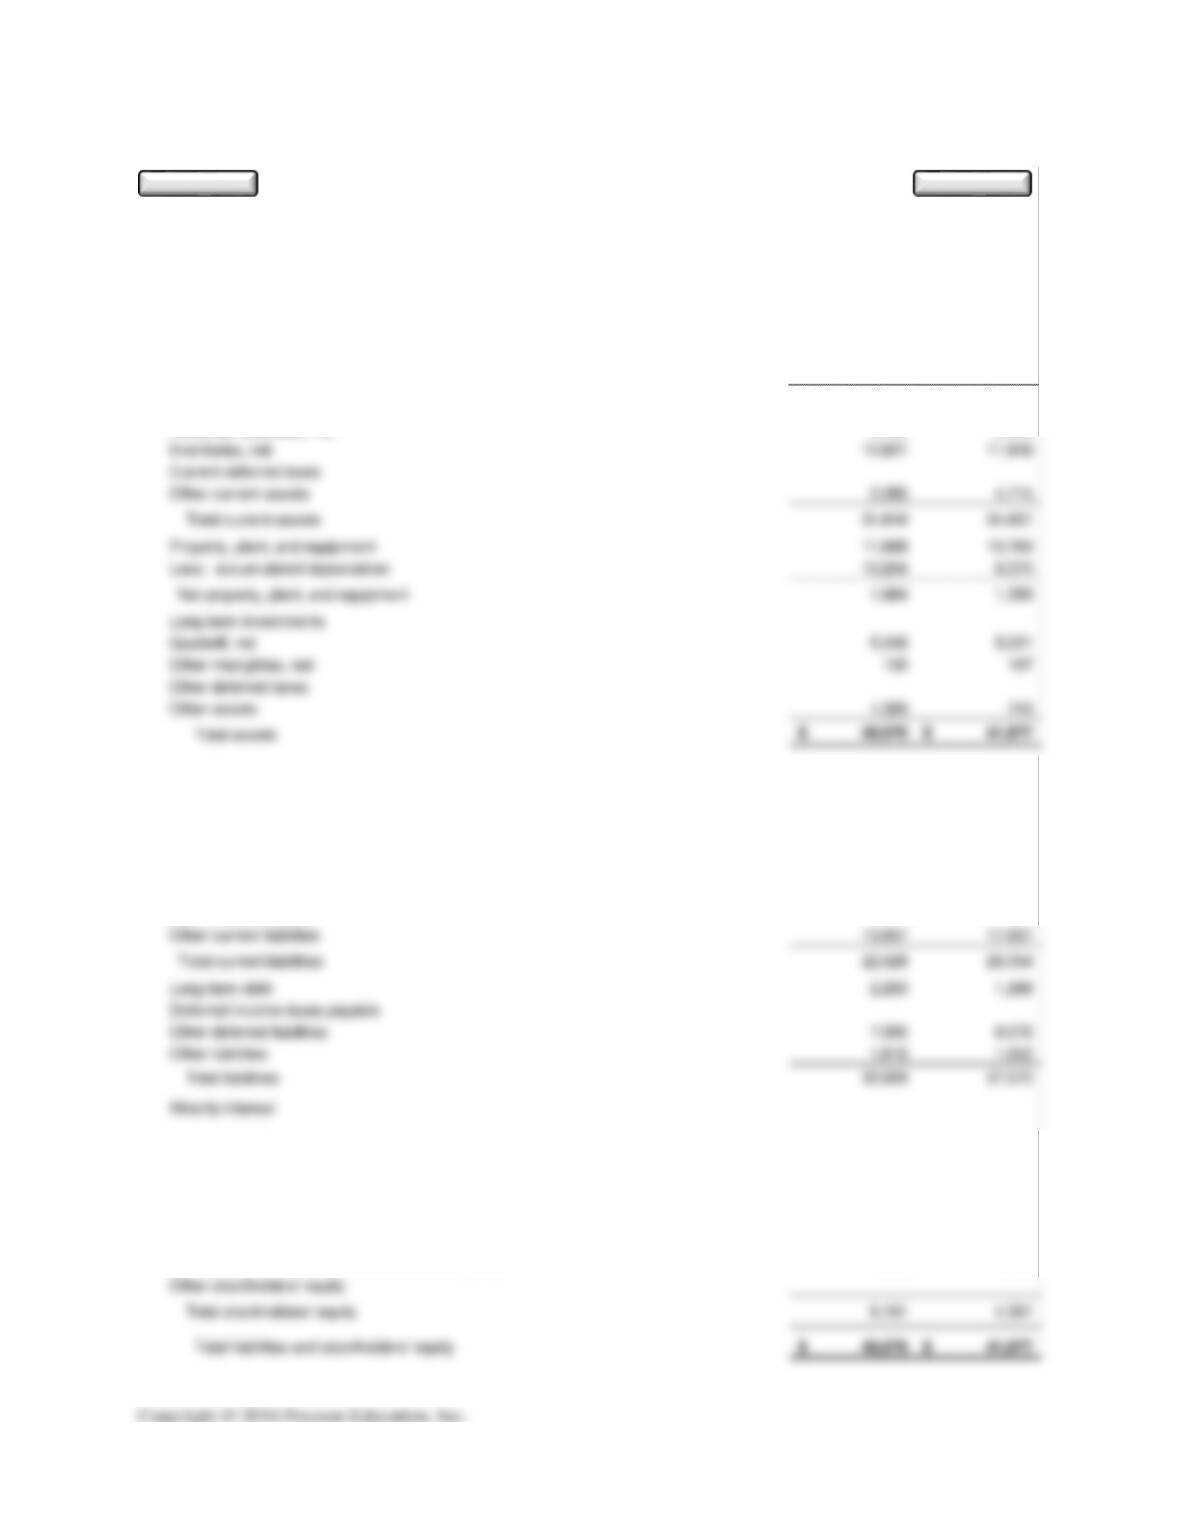
Case 2.3 (a) Walgreen Co. and Subsidiaries
Common Size Balance Sheet
August 31,
Assets
2013
2012
Current Assets:
Cash and cash equivalents
6
%
4
%
Accounts receivable, net
7
6
Non-Current Assets
Property and equipment, at cost less accumulated
depreciation and amortization
34
36
Equity investment in Alliance Boots
18
18
Liabilities and Shareholders’ Equity
Current Liabilities
Short-term borrowings
2
%
4
%
Trade accounts payable
13
13
Accrued expenses and other liabilities
10
9
Other non-current liabilities
6
6
Total Non-Current Liabilities
20
%
20
%
Total Liabilities
45
%
46
%
Shareholders' Equity
Common stock
--
%
--
%
Paid-in capital
3
3
Total Shareholders' Equity
55
%
54
%
Total Liabilities and Shareholders' Equity
100
%
100
%
(b) Inventories are the most significant current asset and property and equipment is the most
significant noncurrent asset. The proportion of inventories to total assets is low compared to the
(c) Allowance account as a percentage of accounts receivable:
Allowance for doubtful accounts
Net Receivables + Allowance
Percentage of
Receivables
Change from
2012 to 2013
Sales
0.8%
Total accounts receivable
22.9%
Allowance for doubtful accounts
55.6%
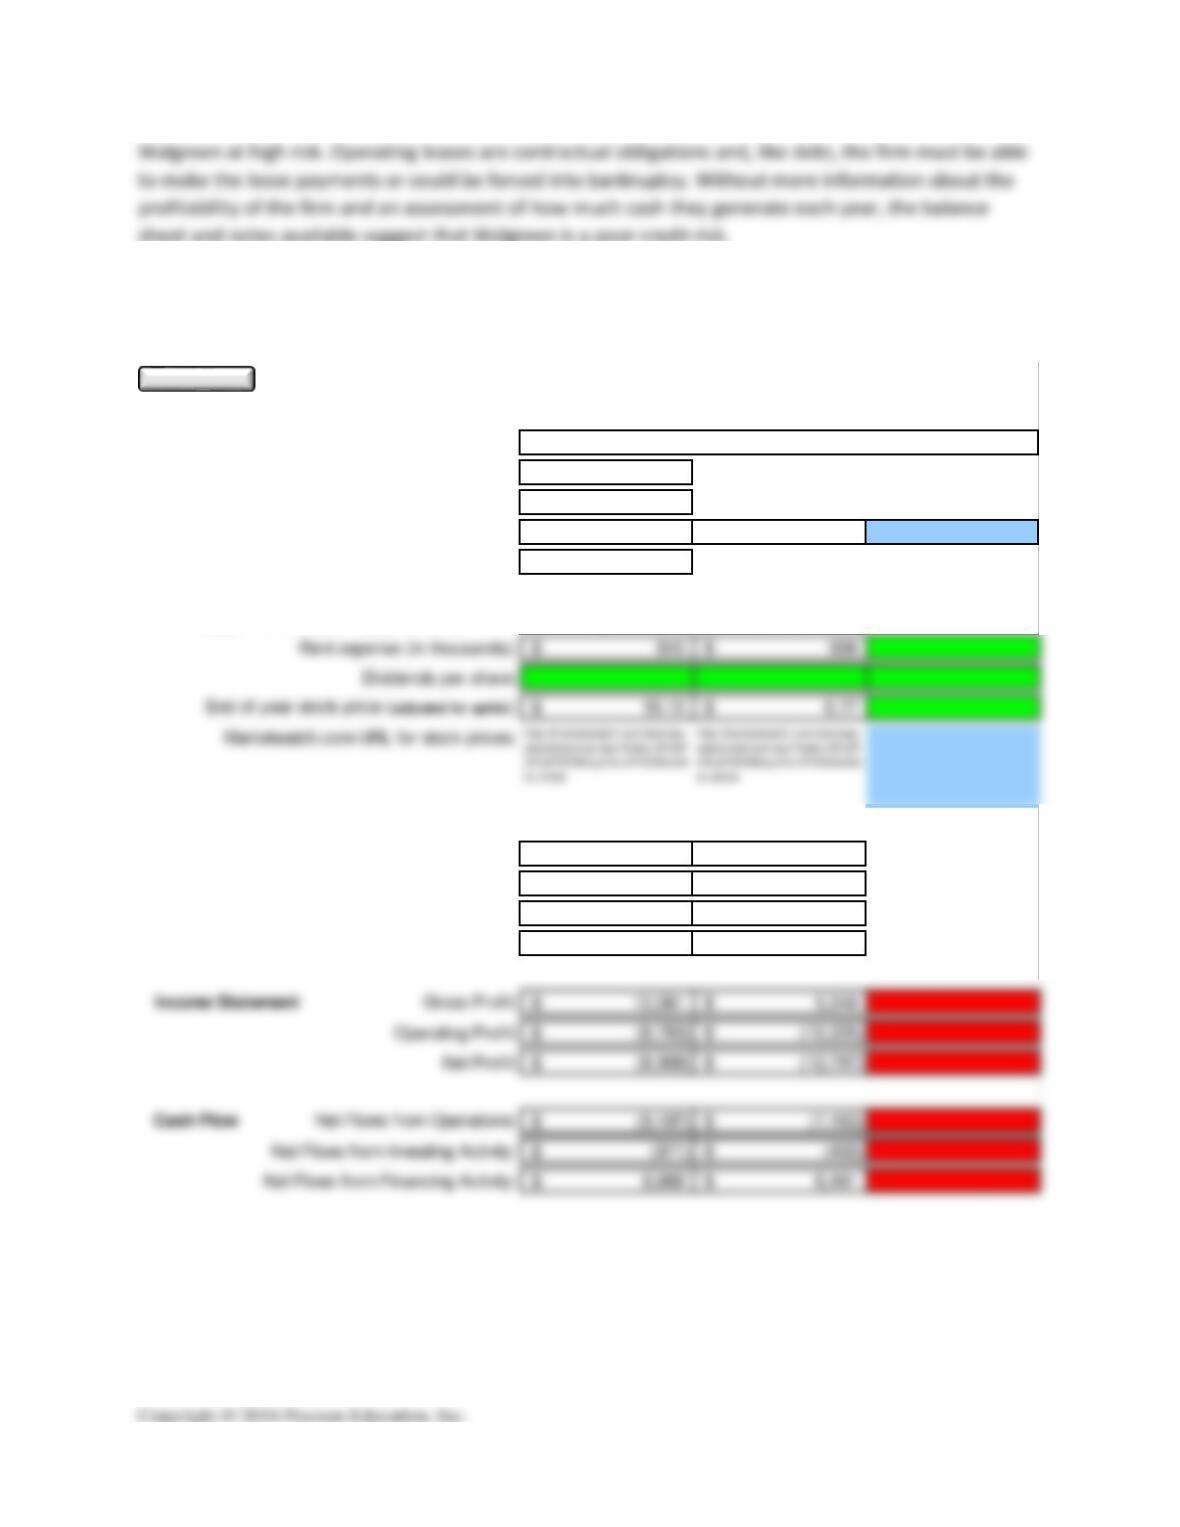
As sales have increased both the accounts receivable and the allowance for doubtful accounts
have also increased. This is a normal pattern although the accounts receivable and allowance accounts
have risen at a faster rate than the sales growth rate. Looking at the valuation and qualifying accounts
schedule for Walgreen it appears that Walgreens made fairly accurate estimates until 2012. Fewer
(d) Walgreen uses the LIFO method of inventory valuation. The notes to the financial statements
explain that inventories would have been recorded at a higher amount if the FIFO method of inventory
had been used. This implies that inflation has occurred since under FIFO, the most recent purchases
would be recorded on the balance sheet, and under LIFO, the first purchases would be recorded on the
(e) Walgreen’s most significant current liabilities are accounts payable and accrued expenses,
typical accounts, making up 23% of total assets in 2013. Long-term debt is 12% of total assets. The level
of risk appears to be low.
(f) Walgreen most likely paid dividends in the amount of $1,083 million calculated as follows:
Beginning retained earnings + net income – dividends = Ending retained earnings
Case 2.4 Hydrogenics Case
(a)
Company Name:
Stock Ticker Symbol: HYGS
U.S. Stock Exchange: NASDAQ Variable
12/31/2000
Statement Year-end Dates: 12/31/2013 12/31/2012
Financial Reports Rounded to : Thousands
Supplemental Ratio Requirements: 2013 2012 0
Check Figures:
Balance Sheet Current Assets: 31,649$ 34,607$
Total Assets: 40,070$ 41,877$
Current Liabilities: 22,528$ 26,054$
Total Stockholders' Equity: 6,161$ 4,307$
Hydrogenics Corporation
The 'Analysis ToolPak' add-in must be installed and active.
Enter data on this sheet before other financial statement information.
Clear
(b)
Dec 31, 2013 Dec 31, 2012
ASSETS
Current Assets:
Cash and cash equivalents 11,823$ 13,020$
Short-term investments
Total cash and short-term investments 11,823 13,020
Accounts receivable, net 4,725 5,024
LIABILITIES
Current Liabilities:
Accounts payable 3,115$ 5,285$
Short-term debt
Current portion of long-term debt
Accrued liabilities 5,556 3,162
Income taxes payable
STOCKHOLDERS' EQUITY
Preferred stock
Common stock, par value plus additional paid-in capital 351,761 341,508
Retained earnings (accumulated deficit) (345,351) (336,443)
Treasury stock
Accumulated other comprehensive income (loss) (249) (758)
Hydrogenics Corporation (HYGS / NASDAQ)
Annual Consolidated Balance Sheet
Amou n ts Rou n d ed to : T hou san ds
Results as of
Clear
Edit
Type all entries, DO NOT cut & paste values
Dec 31, 2013 Dec 31, 2012
ASSETS
Cash and cash equivalents 11,823$ 13,020$
Short-term investments
Accounts receivable, net 4,725 5,024
Accounts receivable allowance 139 124
Inventories, net 12,821 11,848
LIABILITIES
Accounts payable 3,115$ 5,285$
Short-term debt
Current portion of long-term debt
Accrued liabilities 5,556 3,162
Income taxes payable
Other current liabilities 13,857 17,607
Long-term debt 2,260 1,288
Review
Clear
Dec 31, 2013 Dec 31, 2012
ASSETS
Current Assets:
Cash and cash equivalents 29.5% 31.1%
Short-term investments 0.0% 0.0%
Total cash and short-term investments 29.5% 31.1%
Total assets 100.0% 100.0%
LIABILITIES
Current Liabilities:
Accounts payable 7.8% 12.6%
Short-term debt 0.0% 0.0%
Current portion of long-term debt 0.0% 0.0%
Accrued liabilities 13.9% 7.6%
Income taxes payable 0.0% 0.0%
STOCKHOLDERS' EQUITY
Preferred stock 0.0% 0.0%
Common stock, par value plus additional paid-in capital 877.9% 815.5%
Retained earnings (accumulated deficit) (861.9%) (803.4%)
Treasury stock 0.0% 0.0%
Total stockholders' equity 15.4% 10.3%
Results as of
S um m ary percen tag es in italics will n ot foot d u e to rou nd ing
Annual Common Size Balance Sheet
Hydrogenics Corporation (HYGS / NASDAQ)
(c) The asset structure of Hydrogenics is stable with minimal changes in accounts. Current assets
make up the majority of total assets and include significant amounts of cash (29.5%), inventories (32%)
and accounts receivable (11.8%) relative to total assets in 2013. Property, plant and equipment and
goodwill, are the significant long-term assets of the firm. It should be noted that the net amount of
property, plant and equipment makes up only 4.2% of total assets because the assets are almost fully
The liability and equity structure has changed with liabilities decreasing and equity increasing
approximately 5% from 2012 to 2013. Changes in accounts payable and accrued liabilities offset each
other for the most part and those two accounts make up just over 20% of total assets. The largest
decrease in current liabilities was in the deferred revenue account. The increase in long-term debt was
offset by the decrease in other long-term deferred liabilities. Common stock (share capital) and
additional paid-in capital (contributed surplus) increased faster than the decrease in retained earnings
(deficit) resulting in total stockholders’ equity increasing by 5.1%. The firm is high risk with 85% debt and
only 15% equity as of 2013.
(d) Allowance account as a percentage of accounts receivable:
Allowance for doubtful accounts
Net Receivables + Allowance
Percentage of
Receivables
2013
$139
$4,725 + $139
2.9%
Change from
2012 to 2013
Sales
33.8%
Total accounts receivable
(5.5)%
Allowance for doubtful accounts
12.1%
As sales have increased, accounts receivable has decreased. This is not an expected pattern, but
is a positive situation for Hydrogenics as they have reduced accounts receivable through collection,
rather than through write-offs of bad debts, as evidenced by the valuation schedule in Note 27. The
allowance for doubtful accounts has increased even though accounts receivable has decreased; again,
(e) Commitments of Hydrogenics include operating leases. The firm is committed to total future
minimum lease payments of $4.677 million. This is significant to the debt structure of the firm since
operating leases are a form of off-balance sheet financing. Without considering an underlying value for
the assets leased, adding $4.677 million to the debt already on the balance sheet increases the debt
ratio from 85% to 96%.


