6e Balance Sheet Page 45 Chapter 2
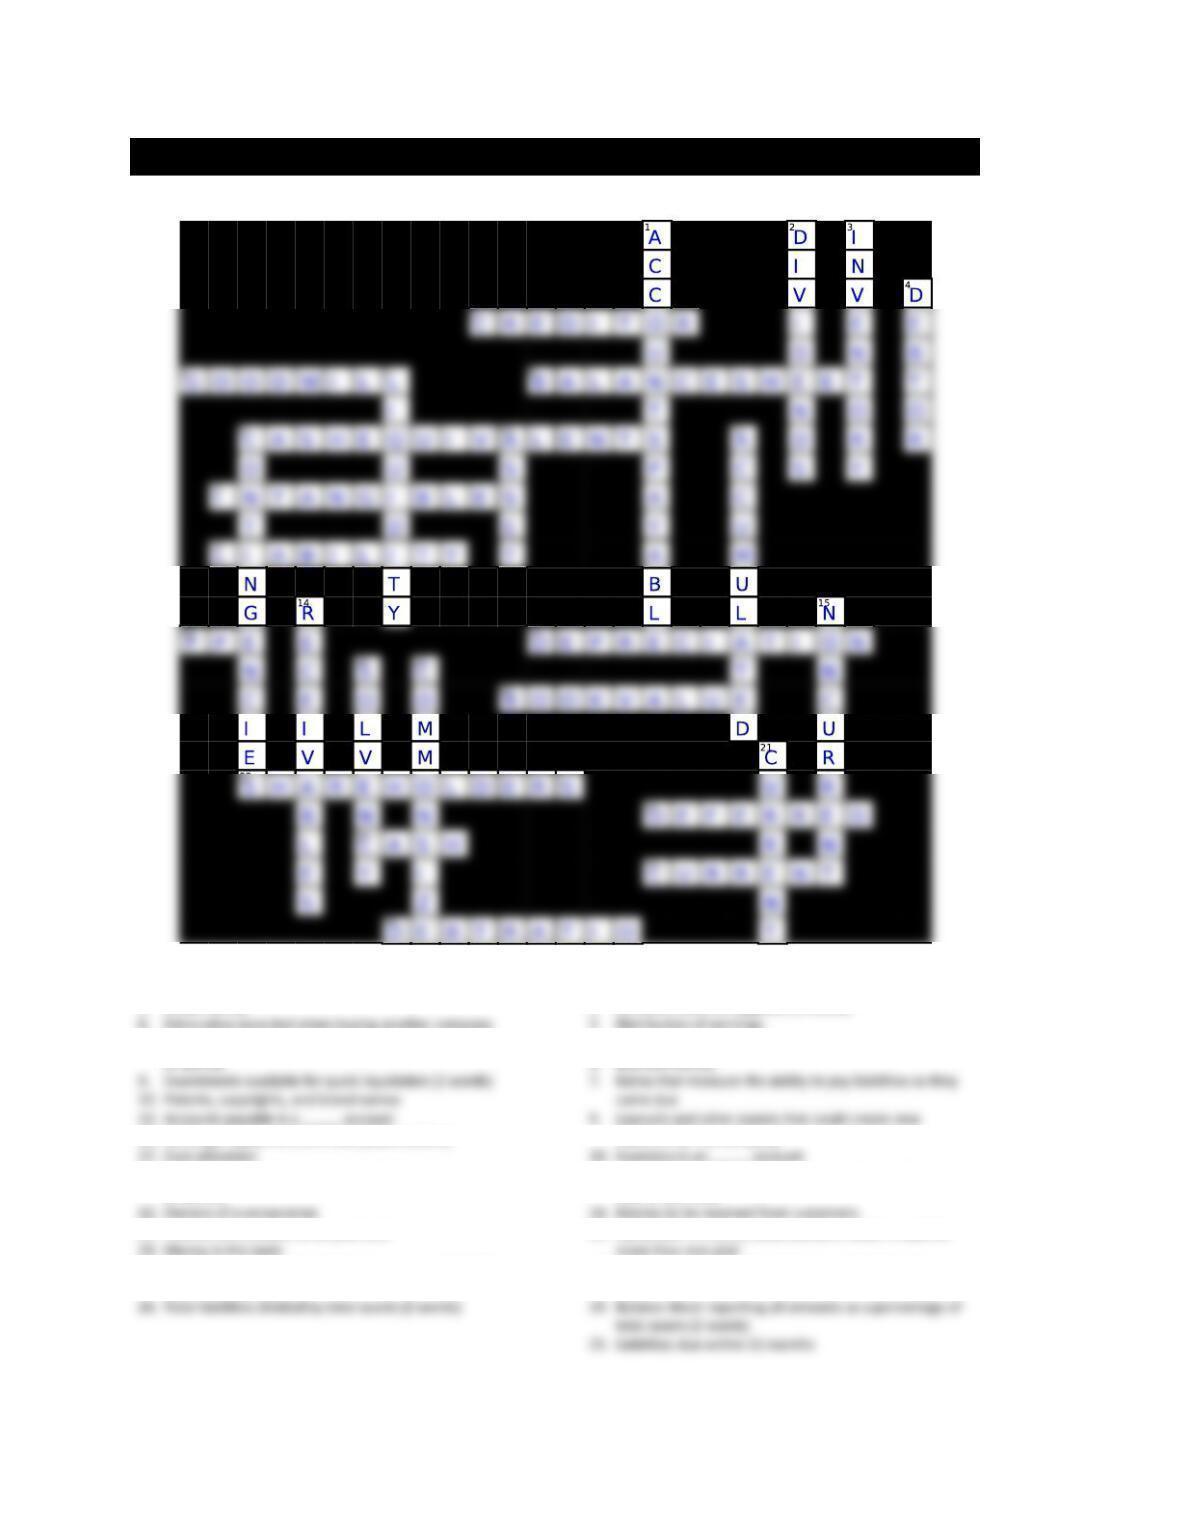
ACTIVITY 12 CROSSWORD PUZZLE FOR CHAPTER 2
Across
5. Lends money
8. Reports assets, liabilities, and stockholders’ equity
(2 words)
16. Buildings, equipment, and land (abbreviation)
20. Acquisition Cost less Accumulated Depreciation
(2 words)
23. Income tax amounts to be paid later
25. Ratio that measures the ability to pay current liabilities
with current assets
Down
1. Amounts owed to suppliers (2 words)
3. Merchandise held for sale
4. Borrows money
liabilities for the company
11. Total amount of depreciation expensed since the assets’
date of purchase
15. Equipment is a _____ asset account, which is used for
18. Ratios that measure the ability to pay liabilities for many
years
6e Balance Sheet Page 46 Chapter 2
ACTIVITY 13 THE CLASSIFIED BALANCE SHEET
Purpose: • Identify account classifications typically used on the balance sheet.
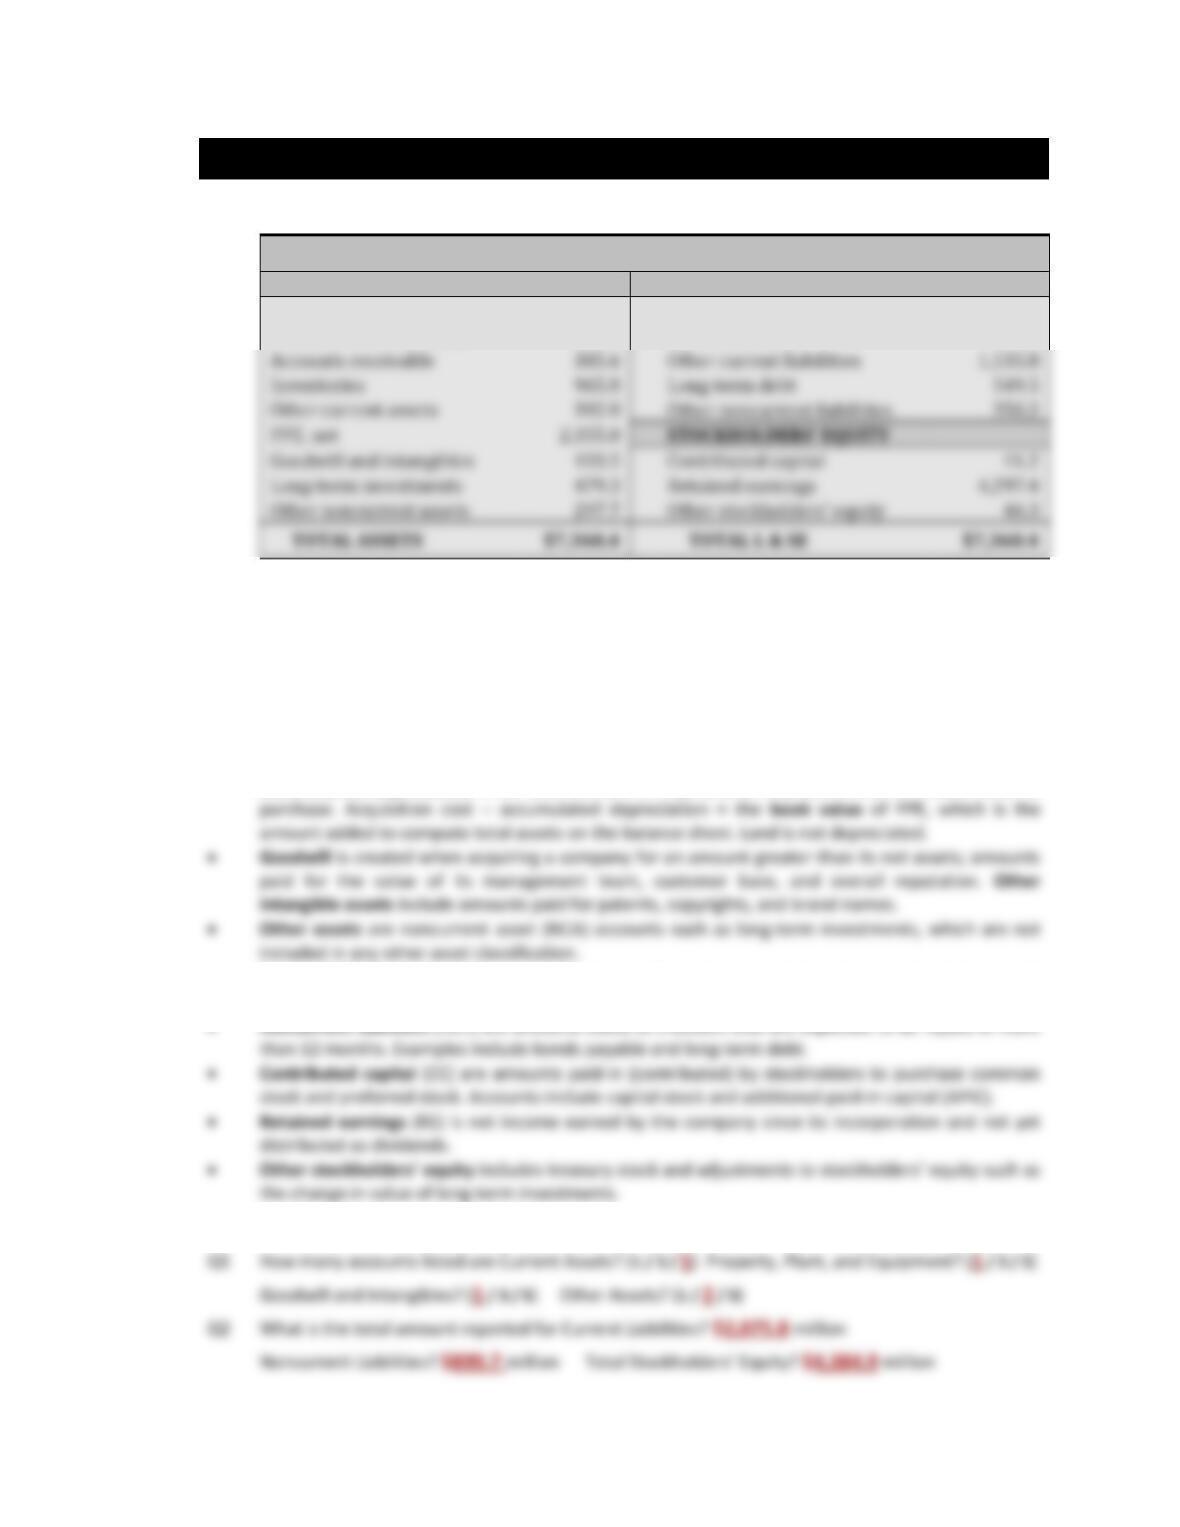
STARBUCKS (SBUX) 10/02/2011 BALANCE SHEET ($ in millions)
ASSETS
LIABILITIES
Cash and cash equivalents
$ 1,148.1
Accounts payable
$ 540.0
Short-term investments
902.6
Short-term debt
0.0
A classified balance sheet breaks the three major account types (assets, liabilities, and stockholders’
equity) into smaller classifications to help decision makers better understand the information presented.
Typical classifications and a brief description follow.
• Current assets (CA) are those assets expected to be converted into cash, sold, or consumed within
12 months.
• Property, plant, and equipment (PPE) summarize amounts for equipment, buildings, and land.
These are long-term assets that are expected to benefit more than one accounting period.
Depreciation expense is the cost allocated to each year of an asset’s long-term useful life.
Accumulated depreciation is the total amount of depreciation expensed since the asset’s date of
• Current liabilities (CL) are amounts owed to creditors that are expected to be repaid within 12
months. Examples include accounts payable and short-term debt.
• Noncurrent liabilities (NCL) are amounts owed to creditors that are expected to be repaid in more
To answer the following questions refer to the balance sheet presented above.
Accounts receivable
385.6
Other current liabilities
Inventories
965.8
Long-term debt
Other current assets
392.8
Other noncurrent liabilities
PPE, net
Goodwill and intangibles
433.5
Contributed capital
Long-term investments
479.3
Retained earnings
Other noncurrent assets
297.7
Other stockholders’ equity
6e Balance Sheet Page 47 Chapter 2
ACTIVITY 14 UNDERSTANDING THE BALANCE SHEET
Purpose: • Identify the value at which amounts are reported on the balance sheet.
Use Starbucks’ balance sheet dated 10/02/2011 (on the opposite page) to answer the following questions.
c. For property, plant, and equipment, net, $2,355.0 million is the (acquisition cost / current market
d. What amount of investments does this company intend to hold for more than a year?
assets to pay off its current liabilities.
income earned by the company).
time).
l. Assets and liabilities are recorded on the balance sheet in order of (magnitude / alphabetically /
6e Balance Sheet Page 48 Chapter 2
ACTIVITY 15 UNDERSTANDING THE BALANCE SHEET
Purpose: • Identify the value at which amounts are reported on the balance sheet.
• Understand what an increase or a decrease in an account indicates.
• Develop strategies for analyzing the balance sheet.
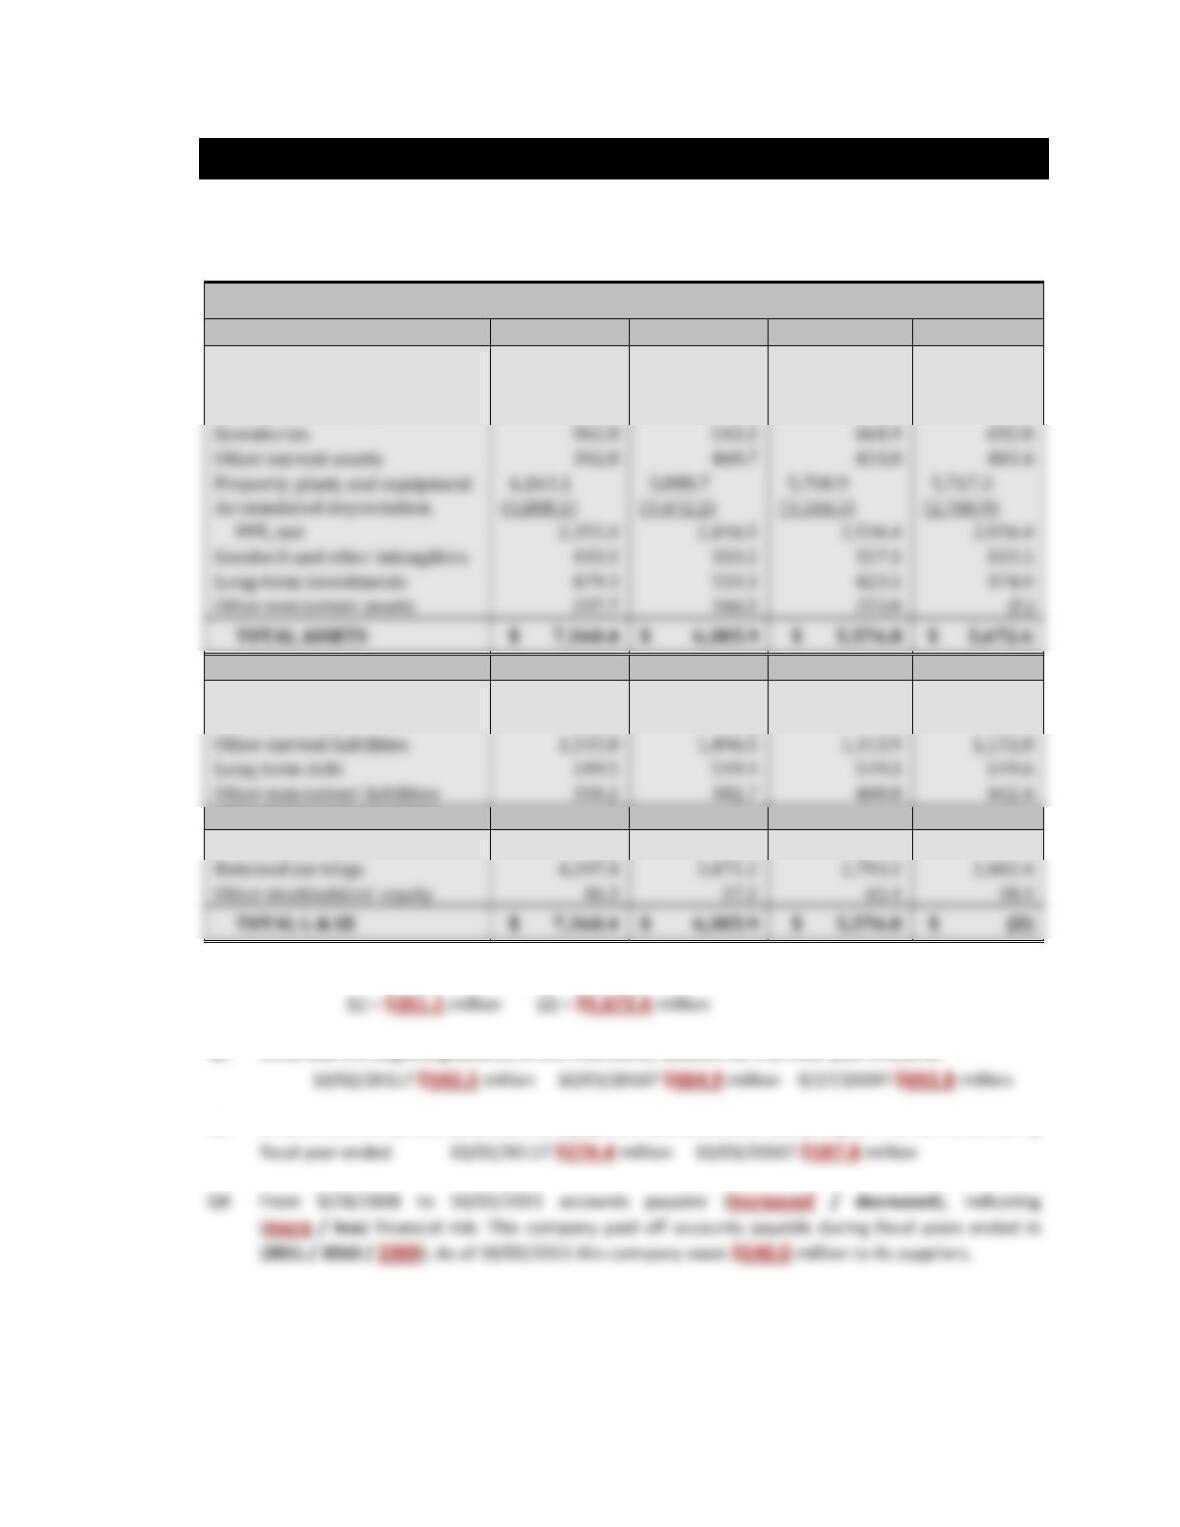
STARBUCKS (SBUX) BALANCE SHEET ($ in millions)
ASSETS
10/02/2011
10/03/2010
9/27/2009
9/28/2008
Cash and cash equivalents
$ 1,148.1
$ 1,164.0
$ 599.8
$ 269.8
Short-term investments
902.6
285.7
66.3
52.5
Accounts receivable
385.6
302.7
271.0
329.5
LIABILITIES
Accounts payable
$ 540.0
$ 282.6
$ 267.1
$ 324.9
Short-term debt
0.0
0.0
0.0
713.0
Other current liabilities
Long-term debt
549.5
549.4
549.3
549.6
Other noncurrent liabilities
350.2
382.7
400.8
442.4
STOCKHOLDERS’ EQUITY
Contributed capital
41.2
146.3
187.1
40.1
Retained earnings
Other stockholders’ equity
46.3
57.2
65.4
48.4
Q1 Calculate the amounts that should be reported for (L) and (Z) on the 9/28/2008 balance sheet:
Q2 What was the beginning balance of the inventories account for the fiscal year ended on
Q3 What amount of property, plant, and equipment was purchased (assuming no PPE was sold) during
Inventories
965.8
543.3
664.9
692.8
Other current assets
392.8
460.7
433.8
403.4
Property, plant, and equipment
Accumulated depreciation
PPE, net
Goodwill and other intangibles
433.5
333.2
327.3
333.1
Long-term investments
479.3
533.3
423.5
374.0
Other noncurrent assets
297.7
346.5
253.8
6e Balance Sheet Page 49 Chapter 2
Q6 What are total liabilities for the fiscal year ended on:
What is the debt ratio for the fiscal year ended on:
Discuss the change in the company’s use of debt over this 4-year period.
accounting period.
Q9 Develop a strategy to analyze the balance sheet. Which line would you look at first? Second? Third?
Why?
position. Why? Support your response with at least two observations.
Answers will vary, but should include two of the following:
6e Balance Sheet Page 50 Chapter 2
ACTIVITY 16 DEBT VS. EQUITY
Purpose: • Identify the characteristics of debt and equity.
• Assess financial risk.
Corporations externally finance the purchase of assets with debt (liabilities) or equity (common stock).
Assets = Liabilities + Stockholders’ Equity
Large amounts of debt are usually issued in the form of bonds. The borrowing corporation records a bond
payable and is referred to as the debtor, while the entity loaning the money records a bond receivable
and is referred to as the creditor. The debtor must pay back the amount borrowed plus interest to the
creditor. The interest paid by the borrowing corporation is an expense that reduces taxable income. The
return to creditors is the interest received. Creditors are not owners of the corporation and, therefore,
have no ownership rights.
Equity refers to the issuance of stock, which may be common stock or preferred stock. Entities owning
shares of stock are the owners of the corporation and are referred to as stockholders or shareholders.
Stockholders’ primary ownership rights include a right to vote at annual meetings and a right to a portion
of the profits (net income). Dividends are the distribution of profits to stockholders. The corporate board
of directors decides whether to pay dividends or not and has no obligation to purchase the shares of stock
back from the stockholders. If stockholders sell their shares of stock, they usually sell to another investor
using a stockbroker, who in turn executes the trade on a stock exchange such as the New York Stock
Exchange or NASDAQ. Stockholders earn a return on their investment by receiving dividends or selling the
stock for a greater amount than the purchase price.
The balance sheet helps investors, both creditors and stockholders, assess the degree of financial risk a
corporation is assuming. In general, the more a corporation relies on debt to finance assets, the greater
the financial risk of the corporation.
($ in millions)
Google (GOOG)
12/31/2011
General Mills (GIS)
5/29/2011
Q1 Compute the values for (B) and (Y) in the above chart. Compute the Debt Ratio and record in the
above chart. (Debt ratio = Liabilities / Assets) This ratio quantifies the proportion of assets financed
Q2 For each item circle the correct response when comparing the issuance of debt and equity.
6e Balance Sheet Page 51 Chapter 2
6e Balance Sheet Page 52 Chapter 2
ACTIVITY 17 ANALYSIS: RATIOS
Purpose: • Understand the information provided by the current ratio and the debt ratio.
Liquidity and Solvency Ratios measure the ability to meet financial obligations and the level of financial
risk.
The Current Ratio measures the ability to pay current payables as they come due by comparing current
assets to current liabilities. It is a measure of short-term liquidity. A higher ratio indicates a stronger ability
to pay current debts.
Current Ratio
=
Current assets
Current liabilities
The Debt Ratio measures the proportion of assets financed by debt by comparing total liabilities to total
assets. It is a measure of long-term solvency. A higher ratio indicates greater financial risk.
Debt Ratio
=
Total liabilities
Total assets
For the year 2010
Industry
Average for
Restaurants
DineEquity
(DIN)
Darden
Restaurants
(DRI)
Nathan’s
Famous
(NATH)
Current Ratio
1.1
1.32
0.54
6.12
Debt Ratio
52%
97%
64%
17%
Debt-to-Equity Ratio*
1.10
33.17
1.77
0.20
Use the chart above to answer the following questions. Stock symbols are shown in parentheses.
• DIN operates Applebee’s Neighborhood Grill & Bar and IHOP.
• DRI operates Red Lobster, Olive Garden, Bahama Breeze, and Smokey Bones Barbeque and Grill.
• NATH operates Nathan’s Famous.
6e Balance Sheet Page 53 Chapter 2
Q4 Why does a company with a higher debt ratio tend to have greater financial risk?
* Instead of reporting the Debt Ratio, some financial sources report the Debt-to-Equity ratio, computed as liabilities
divided by stockholders’ equity. To convert:
Debt ratio = [Debt-to-equity ratio/ (1 + Debt-to-equity ratio)]
For DineEquity 0.97 = 33.17 / 34.17
6e Balance Sheet Page 54 Chapter 2
ACTIVITY 18 ANALYSIS: TREND
Purpose: • Prepare a trend analysis and understand the information provided.
A Trend Analysis compares amounts of a more recent year to a base year. The base year is the earliest
year being studied. The analysis measures the percentage of change from the base year.
Q1 For Starbucks, use the amounts listed below to compute the trend indexes for noncurrent (NC)
liabilities, common stock, and retained earnings by dividing each amount by the amount for the
base year. Record the resulting trend index in the shaded area. Use 9/28/2008 as the base year.
STARBUCKS
10/02/2011
10/03/2010
9/27/2009
9/28/2008
($ in millions)
$
Trend
$
Trend
$
Trend
BASE YEAR
Current assets
3,794.9
217
2,756.4
158
2,035.8
116
1,748.0
100
PPE, net
2,355.0
80
2,416.5
82
2,536.4
86
2,956.4
100
Goodwill + Intang.
433.5
130
333.2
100
327.3
98
333.1
100
Other assets
777.0
122
879.8
139
677.3
107
635.1
100
TOTAL ASSETS
7,360.4
130
6,385.9
113
5,576.8
98
5,672.6
100
Refer to the series of balance sheets and the trend analysis above to answer the following questions.
Q3 From 9/28/2008 to 10/02/2011, which of the following accounts increased at a greater rate than
Q4 The annual total asset growth rate can be compared between companies.
Assume less than 5% is low, 5 to 15% is moderate, and more than 15% is high.
The three-year average total asset growth rate of this company is considered
Current liabilities
2,075.8
95
1,779.1
81
1,581.0
72
2,189.7
100
NC liabilities
899.7
932.1
950.1
992.0
Common stock
146.3
187.1
Retained earnings
4,297.4
3,471.2
2,793.2
2,402.4
Other SE
96
118
135
100
TOTAL L and SE
7,360.4
130
6,385.9
113
5,576.8
98
5,672.6
100
6e Balance Sheet Page 55 Chapter 2
Q5 Examine the financial information reported above and comment on at least two items of
significance that the trend analysis helps to reveal.
Answers will vary and may include two of the following…