19-1
CHAPTER 19
BALANCED SCORECARD:
QUALITY, TIME, AND THE THEORY OF CONSTRAINTS
19-1 Quality costs (including the opportunity cost of lost sales because of poor quality) can be
as much as 10% to 20% of sales revenues of many organizations. Quality-improvement
programs can result in substantial cost savings and higher revenues and market share from
increased customer satisfaction.
19-3 Exhibit 19-1 of the text lists the following six line items in the prevention costs category:
design engineering; process engineering; supplier evaluations; preventive equipment
maintenance; quality training; and testing of new materials.
19-4 Exhibit 19-1 of the text lists the following three examples of appraisal costs: inspection;
online product manufacturing and process inspection; and product testing.
19-6 Three methods that companies use to identify quality problems are (a) a control chart,
which is a graph of a series of successive observations of a particular step, procedure, or
operation taken at regular intervals of time; (b) a Pareto diagram, which is a chart that indicates
how frequently each type of failure (defect) occurs, ordered from the most frequent to the least
frequent; and (c) a cause-and-effect diagram, which helps identify potential causes of defects
using a diagram that resembles the bone structure of a fish.
19-7 No. It is true that an important advantage of financial measures of quality is that they can
be linked to bottom-line performance, but nonfinancial measures, such as number of defects,
customer satisfaction, and employee satisfaction, have several advantages as well. They are
19-2
19-8 Examples of nonfinancial measures of customer satisfaction relating to quality include
the following:
1. the number of defective units shipped to customers as a percentage of total units of product
shipped;
19-9 Examples of nonfinancial measures of internal-business-process quality include the
following:
1. the percentage of defective products;
2. percentage of reworked products;
3. manufacturing cycle time (the amount of time from when an order is received by
production to when it becomes a finished good); and
4. number of product and process design changes
19-11 Customer-response time is how long it takes from the time a customer places an order for
a product or a service to the time the product or service is delivered to the customer.
Manufacturing cycle time is how long it takes from the time an order is received by
manufacturing to the time a finished good is produced. Manufacturing cycle time is only one part
19-12 No. There is a tradeoff between customer-response time and on-time performance.
Simply scheduling longer customer-response time makes achieving on-time performance easier.
Companies should, however, attempt to reduce the uncertainty of the arrival of orders, manage
bottlenecks, reduce setup and processing time, and run smaller batches. This would have the
effect of reducing both customer-response time and improving on-time performance.

19-3
time, causing delays, and (2) limited capacity and bottlenecks––a bottleneck is an operation
where the work to be performed approaches or exceeds the available capacity.
19-14 No. Adding a product when capacity is constrained and the timing of customer orders is
uncertain causes delays in delivering all existing products. If the revenue losses from delays in
delivering existing products and the increase in carrying costs of the existing products exceed the
positive contribution earned by the product that was added, then it is not worthwhile to make and
sell the new product, despite its positive contribution margin. The chapter describes the negative
effects (negative externalities) that one product can have on others when products share common
manufacturing facilities.
19-4
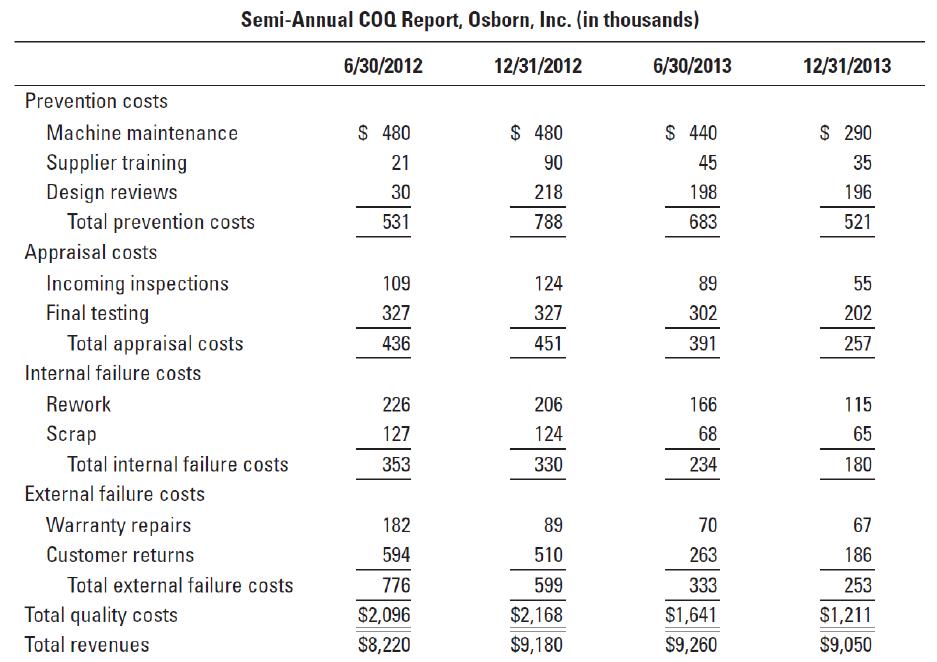
19-16 (30 min.) Costs of quality.
(CMA, adapted) Osborn, Inc., produces cell phone equipment. Amanda Westerly, Osborn’s president, decided to devote more
resources to the improvement of product quality after learning that her company had been ranked fourth in product quality in a 2011
survey of cell phone users. Osborn’s quality-improvement program has now been in operation for 2 years, and the cost report shown
here has recently been issued.
19-5
Required:
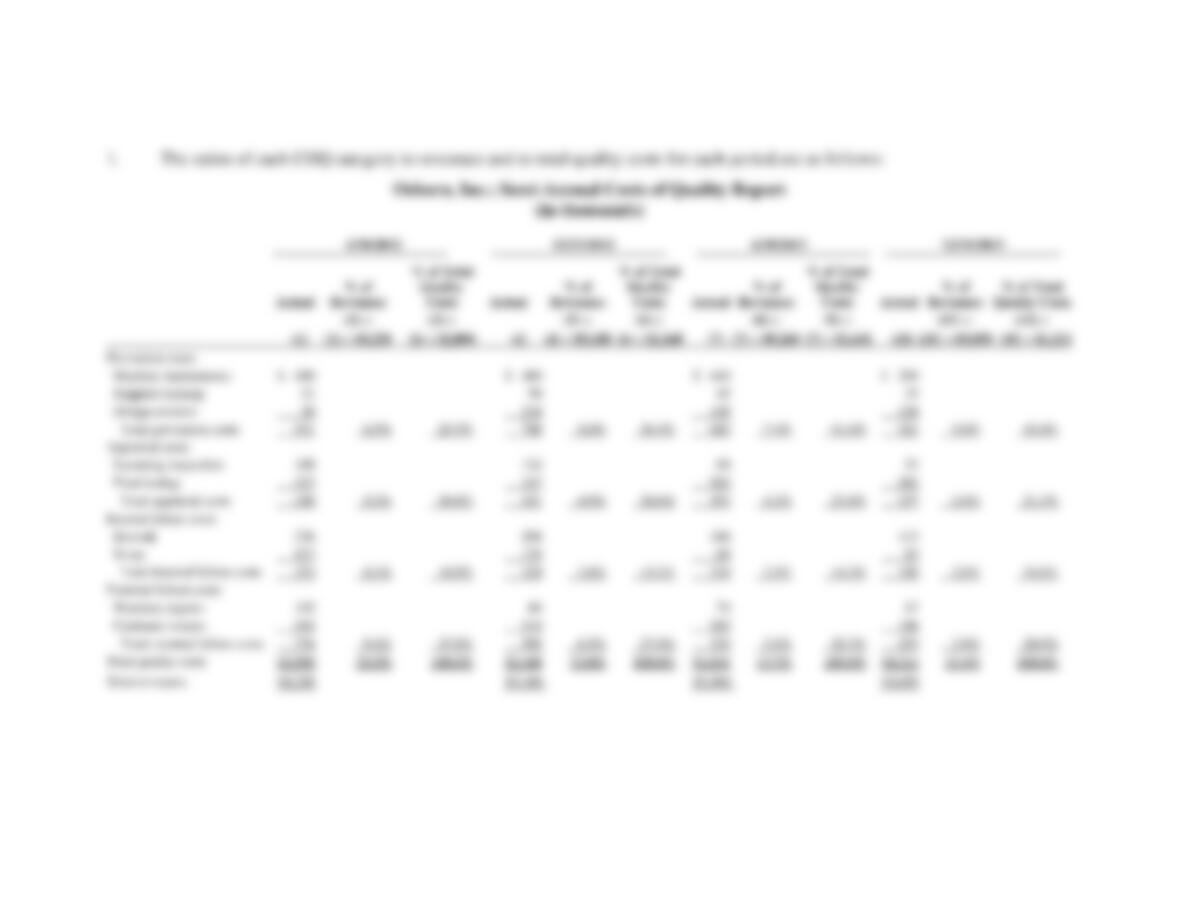
1. For each period, calculate the ratio of each COQ category to revenues and to total quality costs.
2. Based on the results of requirement 1, would you conclude that Osborn’s quality program has been successful? Prepare a short
report to present your case.
3. Based on the 2011 survey, Amanda Westerly believed that Osborn had to improve product quality. In making her case to Osborn
management, how might Westerly have estimated the opportunity cost of not implementing the quality-improvement program?
19-6
SOLUTION
19-7
19-8
19-17 (20 min.) Costs of quality analysis.
Safe Travel produces car seats for children from newborn to 2 years old. The company is worried
because one of its competitors has recently come under public scrutiny because of product
failure. Historically, Safe Travel’s only problem with its car seats was stitching in the straps. The
problem can usually be detected and repaired during an internal inspection. The cost of the
inspection is $5.00 per car seat, and the repair cost is $1.00 per car seat. All 200,000 car seats
were inspected last year, and 5% were found to have problems with the stitching in the straps
during the internal inspection. Another 1% of the 200,000 car seats had problems with the
stitching, but the internal inspection did not discover them. Defective units that were sold and
shipped to customers needed to be shipped back to Safe Travel and repaired. Shipping costs are
$8.00 per car seat, and repair costs are $1.00 per car seat. However, the out-of-pocket costs
(shipping and repair) are not the only costs of defects not discovered in the internal inspection.
Negative publicity will result in a loss of future contribution margin of $100 for each external
failure.
Required:
1. Calculate appraisal cost.
2. Calculate internal failure cost.
3. Calculate out-of-pocket external failure cost.
4. Determine the opportunity cost associated with the external failures.
5. What are the total costs of quality?
6. Safe Travel is concerned with the high up-front cost of inspecting all 200,000 units. It is
considering an alternative internal inspection plan that will cost only $3.00 per car seat
inspected. During the internal inspection, the alternative technique will detect only 3.5% of
the 200,000 car seats that have stitching problems. The other 2.5% will be detected after the
car seats are sold and shipped. What are the total costs of quality for the alternative
technique?
7. What factors other than cost should Safe Travel consider before changing inspection
techniques?
SOLUTION
19-9
19-10
19-18 (15 min.) Cost of quality analysis, ethical considerations (continuation of 19-17).
Refer to information in Exercise 19-17 in answering this question. Safe Travel has discovered a
more serious problem with the plastic core of its car seats. An accident can cause the plastic in
some of the seats to crack and break, resulting in serious injuries to the occupant. It is estimated
that this problem will affect about 200 car seats in the next year. This problem could be corrected
by using a higher quality of plastic that would increase the cost of every car seat produced by
$10. If this problem is not corrected, Safe Travel estimates that out of the 200 car seats affected,
customers will realize that the problem is due to a defect in the seats in only three cases. Safe
Travel’s legal team has estimated that each of these three cases would result in a lawsuit that
could be settled for about $500,000. All lawsuits settled would include a confidentiality clause,
so Safe Travel’s reputation would not be affected.
1. Assuming that Safe Travel expects to sell 200,000 car seats next year, what would be the cost
of increasing the quality of all 200,000 car seats?
2. What will be the total cost of the lawsuits next year if the problem is not corrected?
3. Suppose Safe Travel has decided not to increase the quality of the plastic because the cost of
increasing the quality exceeds the benefits (saving the cost of lawsuits). What do you think of
this decision? (Note: Because of the confidentiality clause, the decision will have no effect on
Safe Travel’s reputation.)
4. Are there any other costs or benefits that Safe Travel should consider?
SOLUTION
19-11
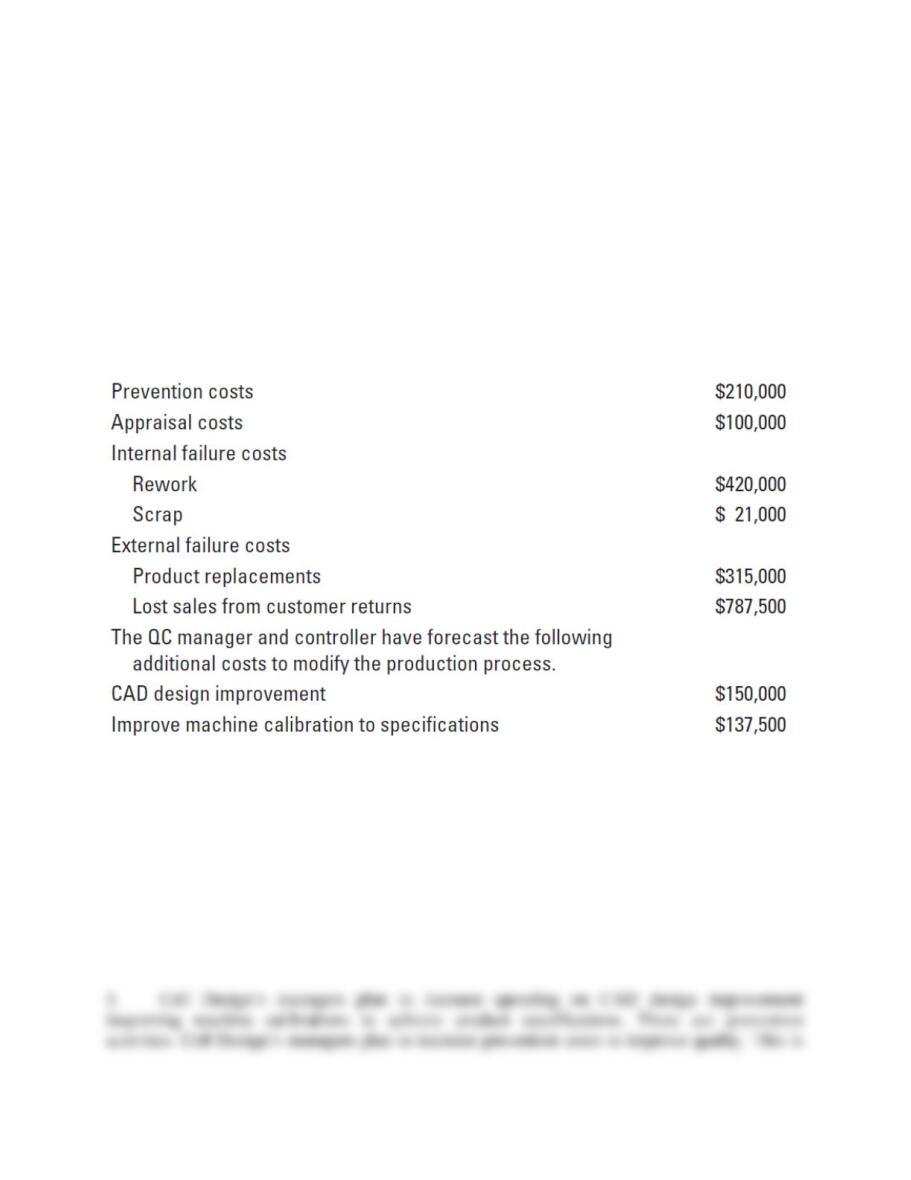
19-19 (25 min.) Costs of quality, quality improvements.
Cell Design produces cell phone covers for all makes and models of cell phones. Cell Design
sells 1,050,000 units each year at a price of $10 per unit and a contribution margin of 40%.
A survey of Cell Design customers over the past 12 months indicates that customers were
very satisfied with the products but a disturbing number of customers were disappointed because
the products they purchased did not fit their phones. They then had to hassle with returns and
replacements.
Cell Design’s managers want to modify their production processes to develop products that
more closely match Cell Design’s specifications because the quality control in place to prevent
ill-fitting products from reaching customers is not working very well.
The current costs of quality are as follows:
Required:
1. Which cost of quality category are managers focusing on? Why?
2. If the improvements result in a 60% decrease in customer replacement cost and a 70%
decrease in customer returns, what is the impact on the overall COQ and the company’s
operating income? What should Cell Design do? Explain.
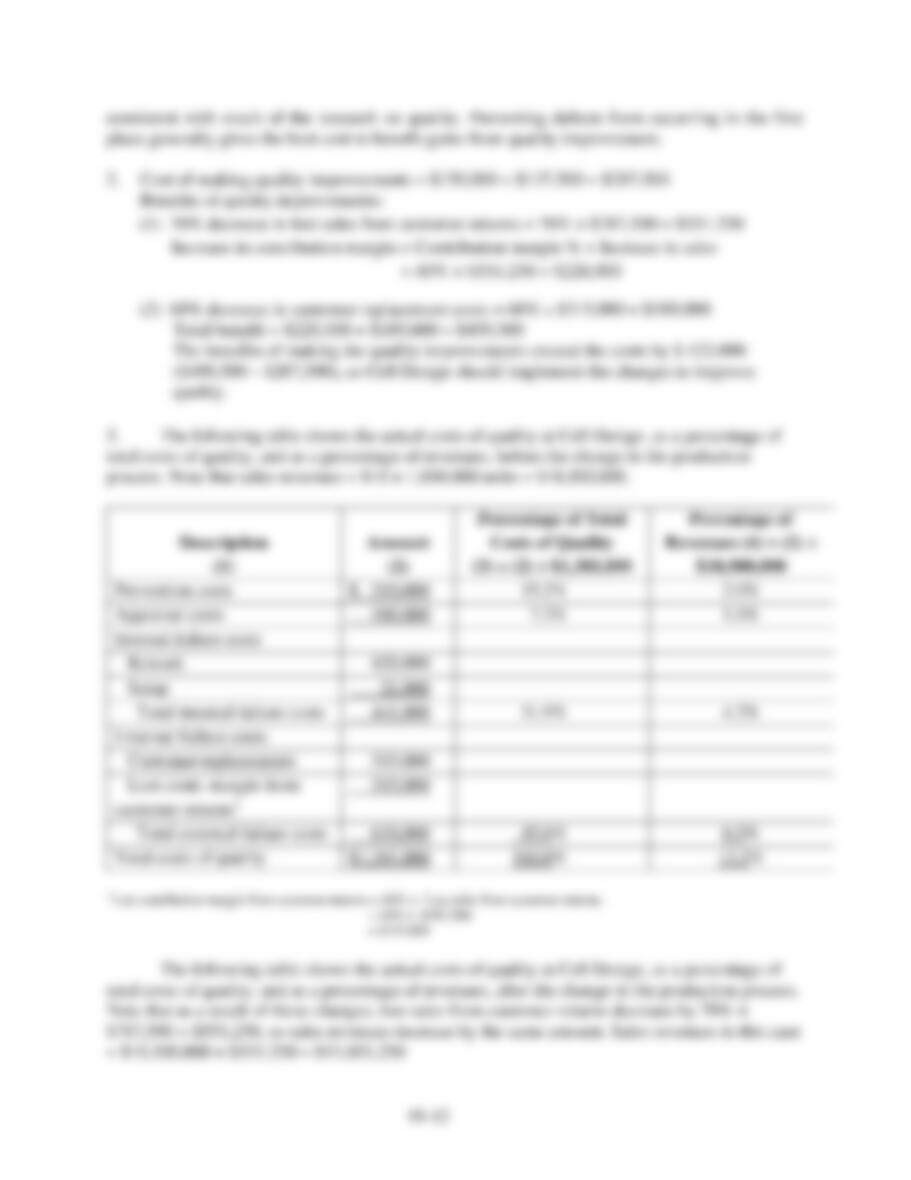
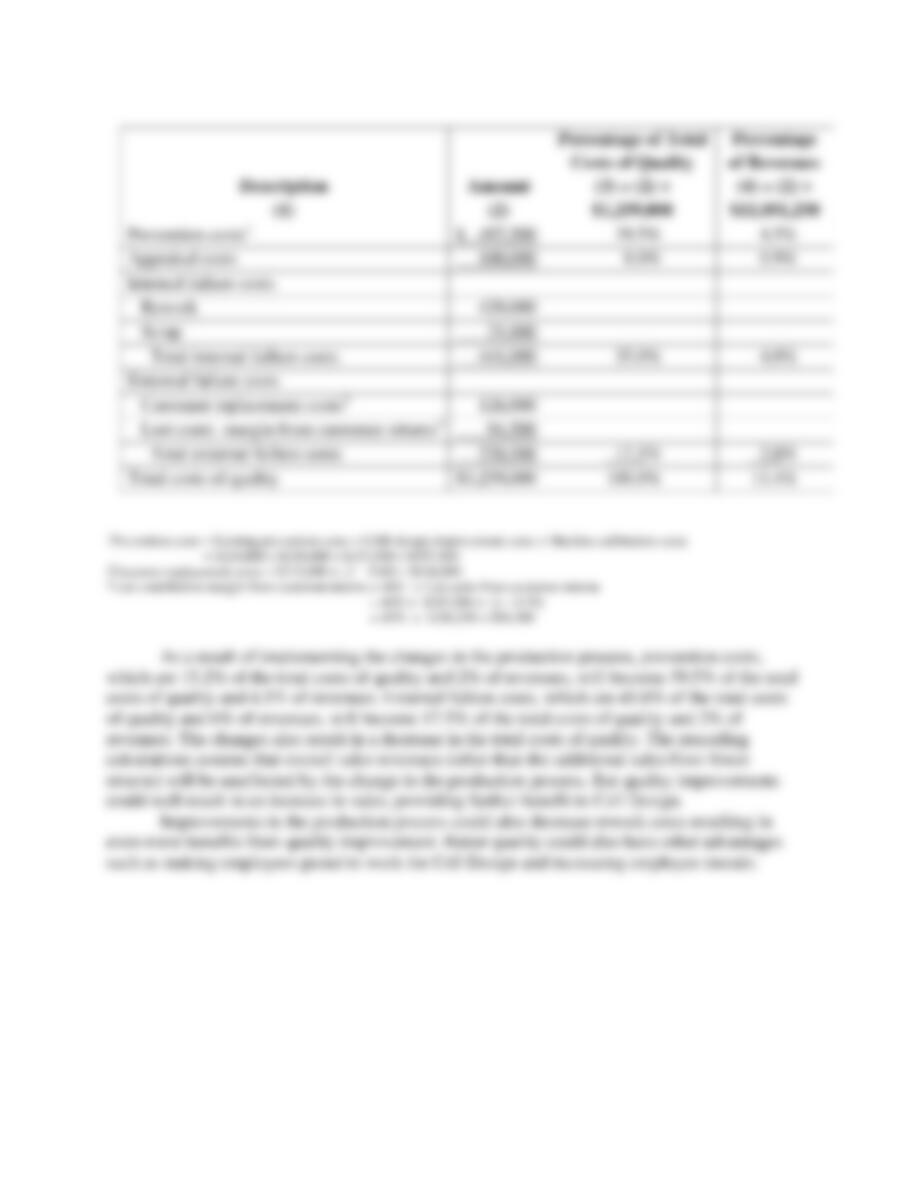
3. Calculate prevention, appraisal, internal failure, and external failure costs as a percentage of
total quality costs and as a percentage of sales before and after the change in the production
process. Comment briefly on your results.
SOLUTION
19-13
19-14
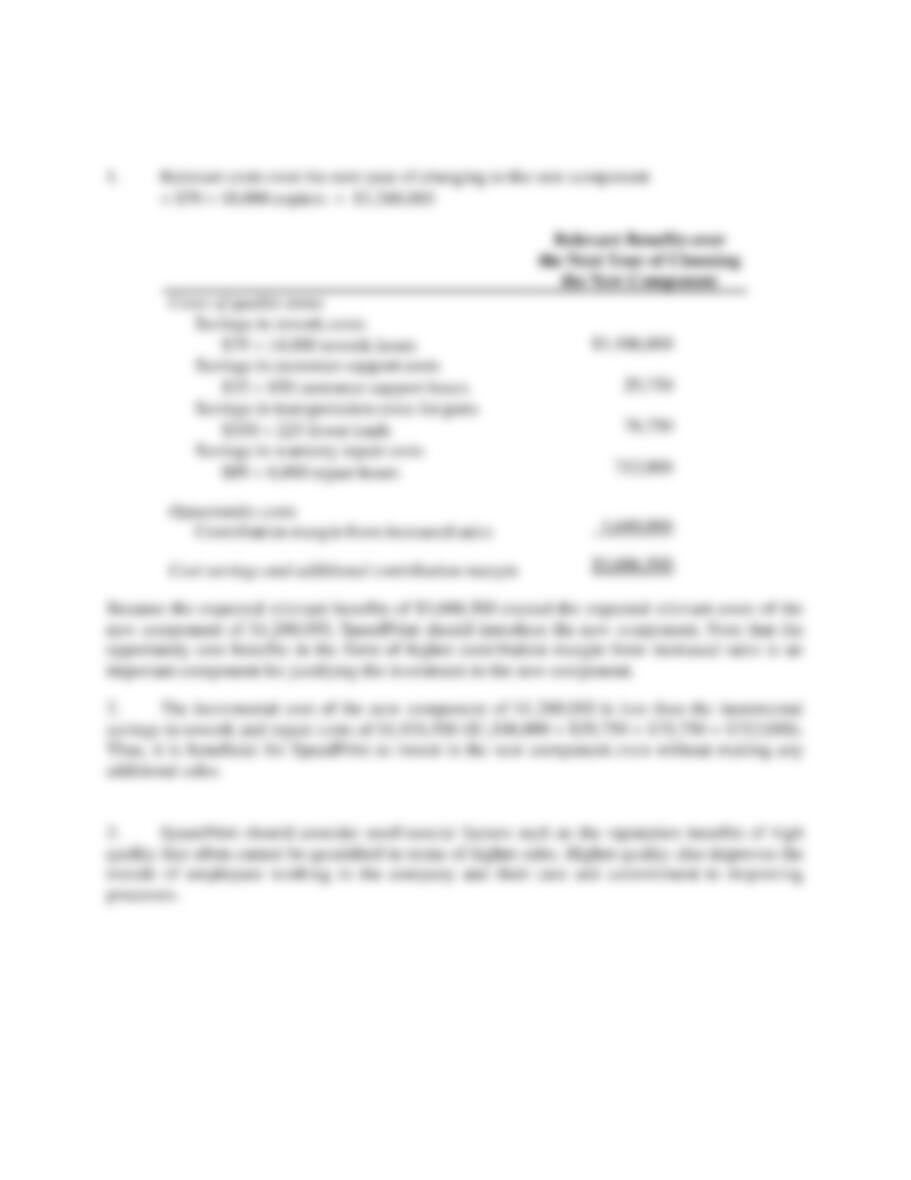
19-20 (25 min.) Quality improvement, relevant costs, and relevant revenues.
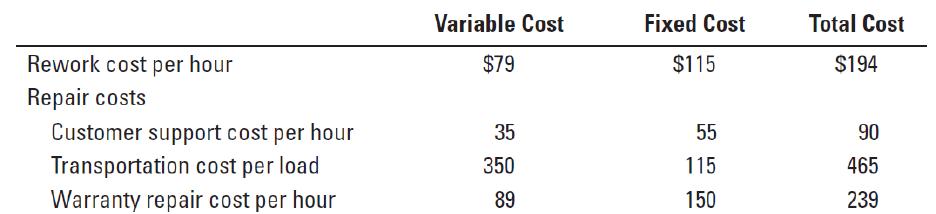
SpeedPrint manufactures and sells 18,000 high-technology printing presses each year. The
variable and fixed costs of rework and repair are as follows:
SpeedPrint’s current presses have a quality problem that causes variations in the shade of some
colors. Its engineers suggest changing a key component in each press. The new component will
cost $70 more than the old one. In the next year, however, SpeedPrint expects that with the new
component it will (1) save 14,000 hours of rework, (2) save 850 hours of customer support, (3)
move 225 fewer loads, (4) save 8,000 hours of warranty repairs, and (5) sell an additional 140
printing presses, for a total contribution margin of $1,680,000. SpeedPrint believes that even as it
improves quality, it will not be able to save any of the fixed costs of rework or repair. SpeedPrint
uses a 1-year time horizon for this decision because it plans to intro– duce a new press at the end
of the year.
Required:
1. Should SpeedPrint change to the new component? Show your calculations.
2. Suppose the estimate of 140 additional printing presses sold is uncertain. What is the
minimum number of additional printing presses that SpeedPrint needs to sell to justify
adopting the new component?
3. What other factors should managers at SpeedPrint consider when making their decision about
changing to a new component?
19-15
SOLUTION
19-16
19-21 (20 min.) Quality improvement, relevant costs, relevant revenues.
Keswick Conference Center and Catering is a conference center and restaurant facility that hosts
more than 300 national and international events each year attended by 50,000 professionals. Due
to increased competition and soaring customer expectations, the company has been forced to
revisit its quality standards. In the company’s 25-year history, customer demand has never been
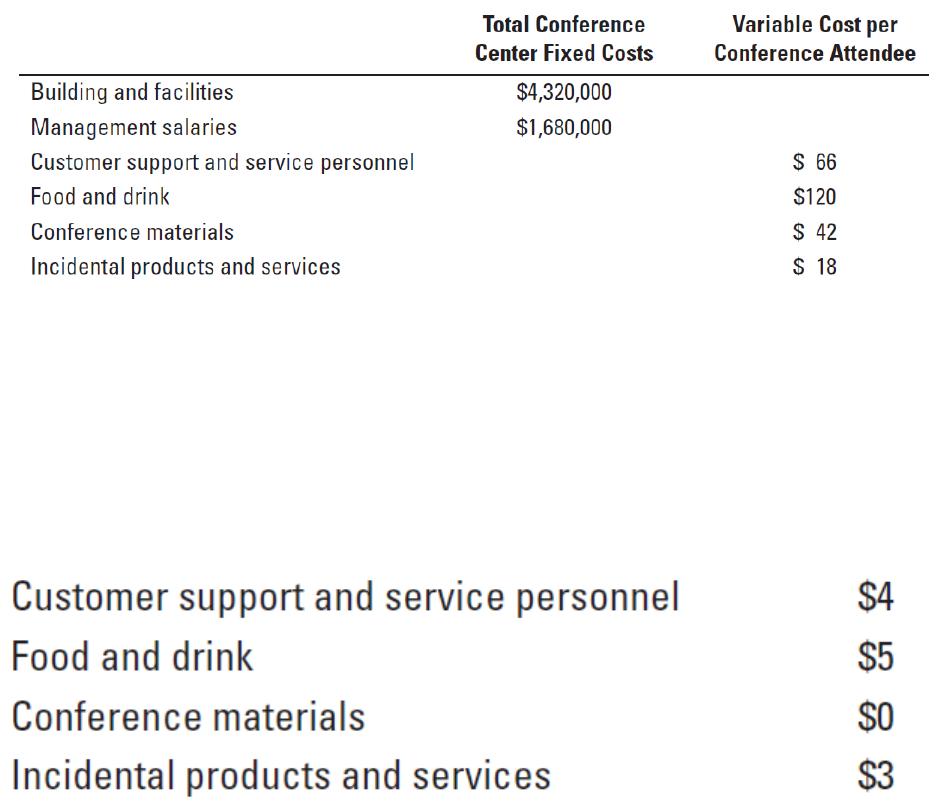
greater for high-quality products and services. Keswick has the following budgeted fixed and
variable costs for 2013:
The company’s budgeted operating income is $4,200,000.
After conducting a survey of 3,000 conference attendees, the company has learned that its
customers would most like to see the following changes in the quality of the company’s products
and services: (1) more menu options and faster service, (2) more incidental products and services
(wireless access in all meeting rooms, computer stations for Internet use, free local calling, and
so on), and (3) upscale and cleaner meeting facilities. To satisfy these customer demands, the
company would be required to increase fixed costs by 50% per year and increase variable costs
by $12 per attendee as follows:
Keswick believes that the preceding improvements in product and service quality would increase
overall conference attendance by 40%.
Required:
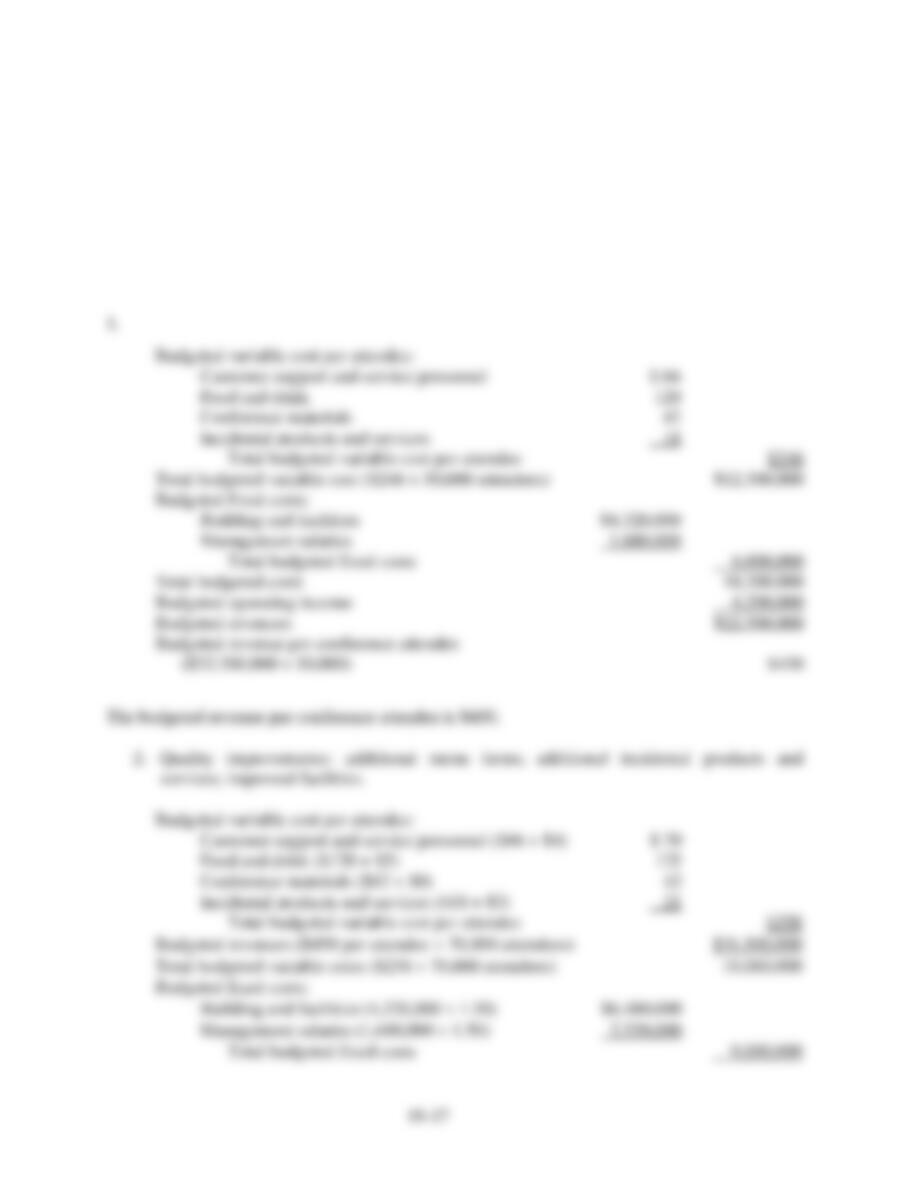
1. What is the budgeted revenue per conference attendee?
2. Assuming budgeted revenue per conference attendee is unchanged, should Keswick
implement the proposed changes?
3. Assuming budgeted revenue per conference attendee is unchanged, what is the variable cost
per conference attendee at which Keswick would be indifferent between implementing and
not implementing the proposed changes?
SOLUTION
19-18
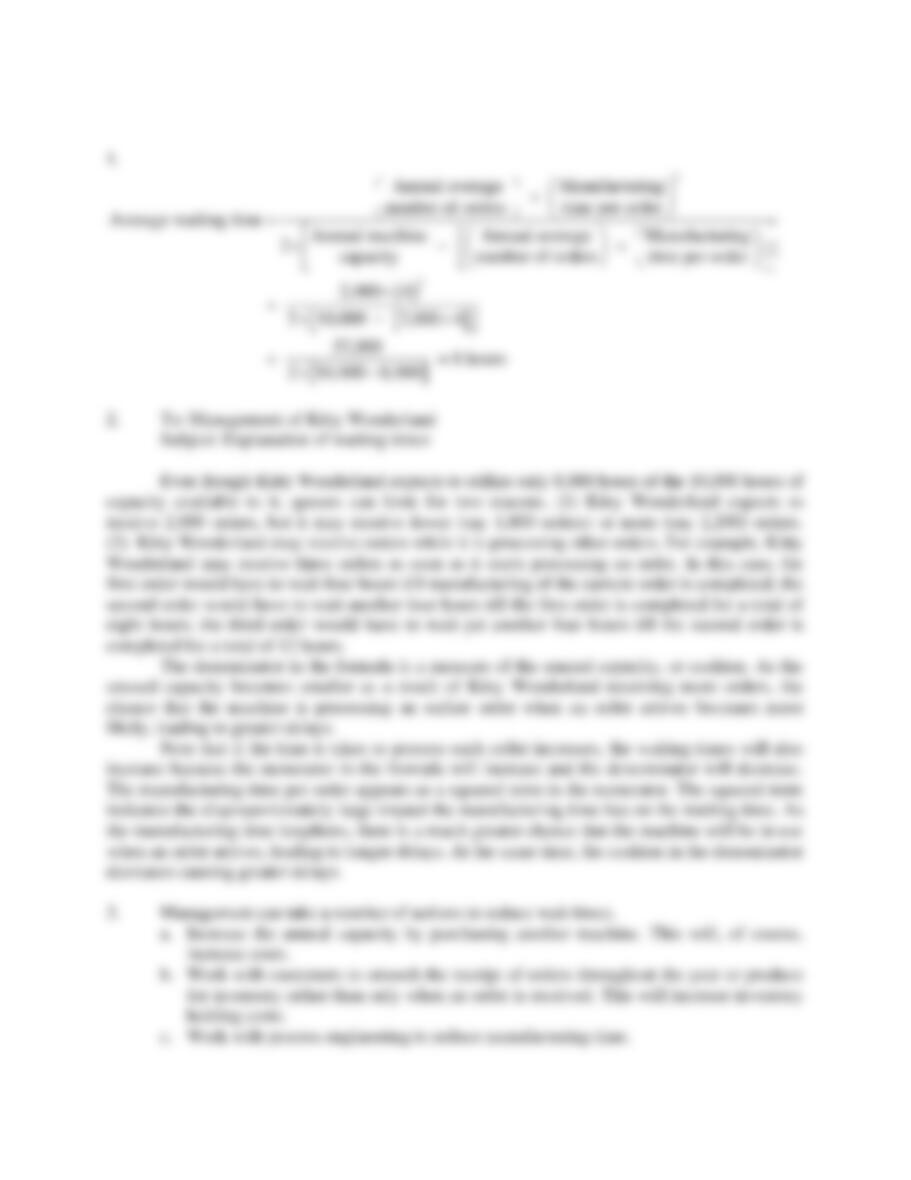
19-22 (25min.) Waiting time.
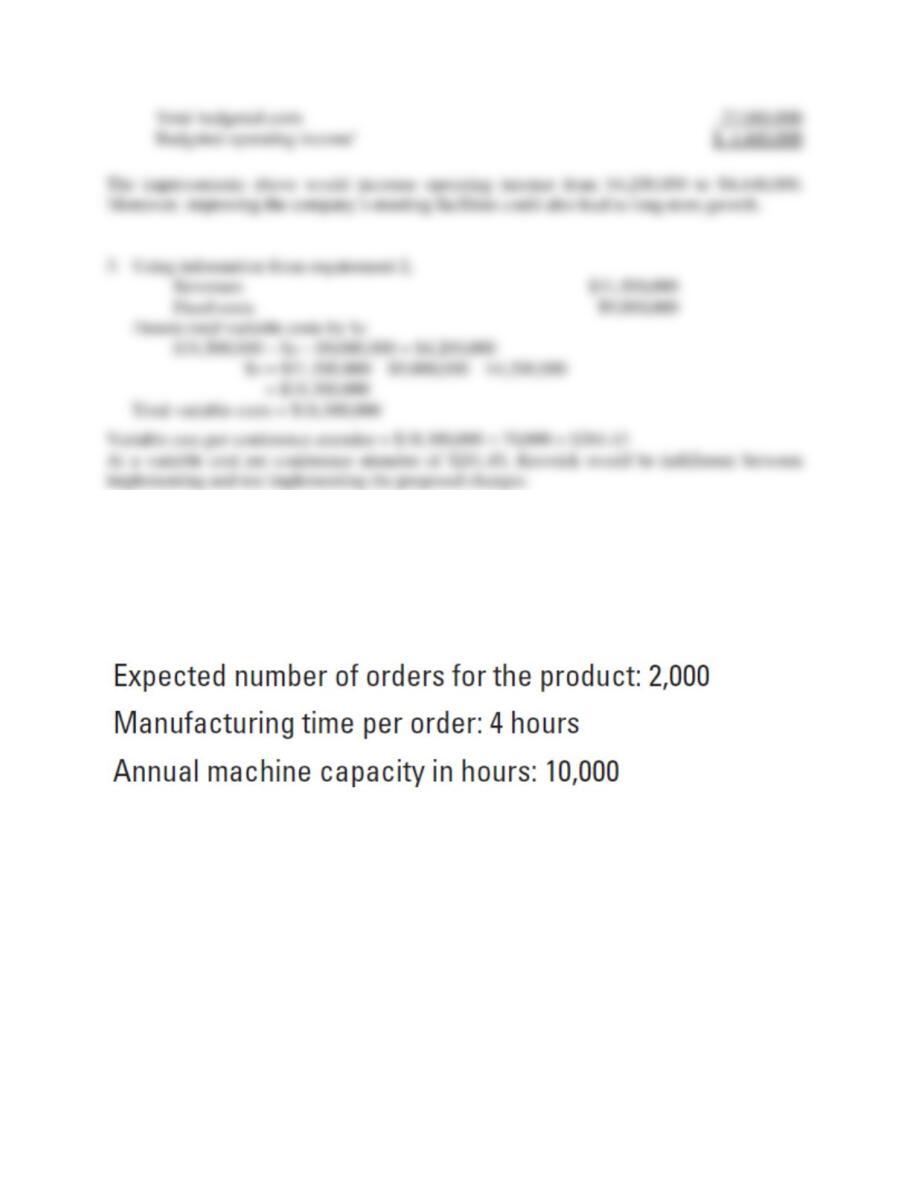
Kitty Wonderland (KW) makes toys for cats and kittens. KW’s managers have recently learned
that they can calculate the average waiting time for an order from the time an order is received
and the time it is manufactured. They have asked for your help and have provided the following
information.
Required:
1. Calculate the average waiting time per order.
2. After learning about the average waiting time, KW’s managers are confused. They do not
understand why, if annual machine capacity is greater than the average number of orders for
the product, there would be any waiting time at all. Write a memo to clarify the situation.
3. The managers have asked for your suggestions on what they can do to minimize or eliminate
waiting time. How would you respond?
4. Management is expecting sales to increase. Will average waiting time increase or decrease?
Explain briefly.
19-19
SOLUTION
19-20
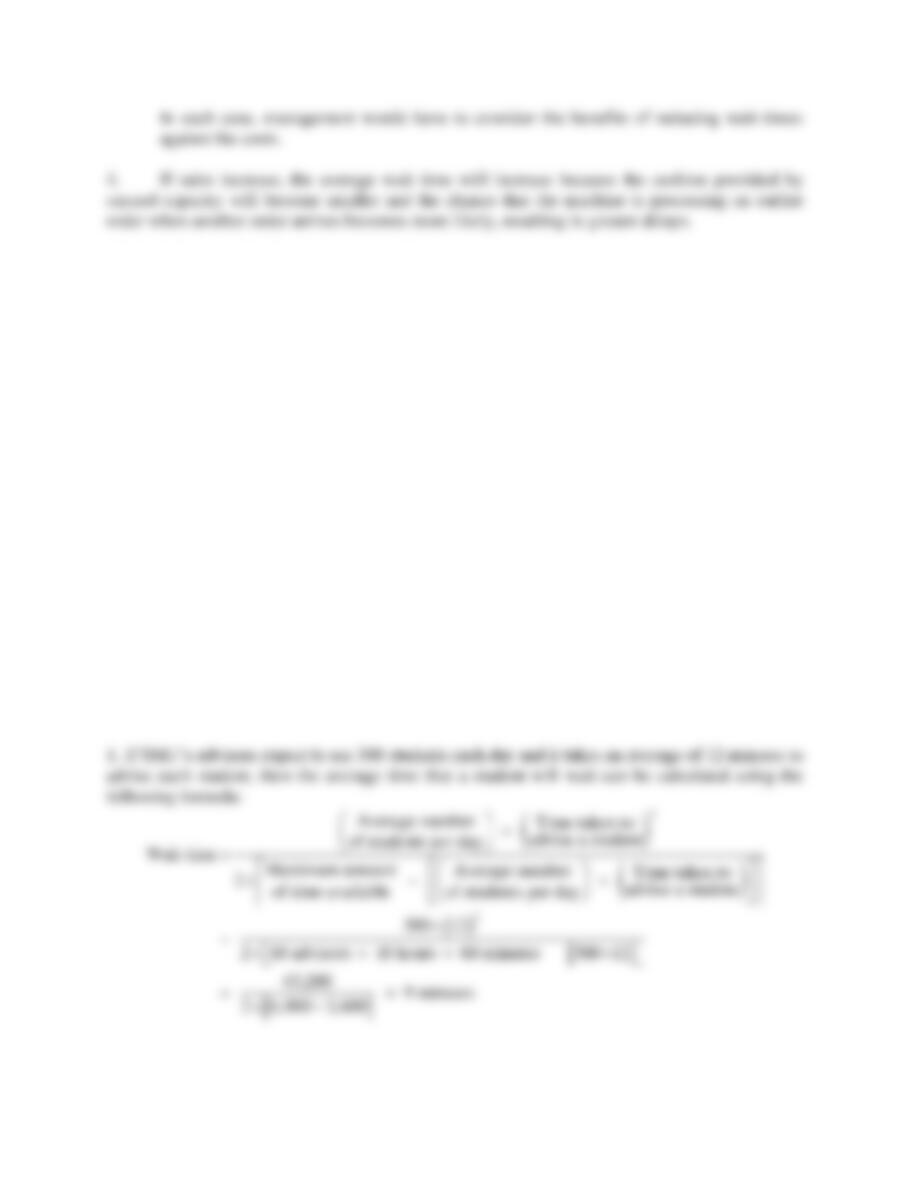
19-23 (30 min.) Waiting time, service industry.
The registration advisors at a small Midwestern university (SMU) help 4,200 students develop
their class schedules and register for classes each semester. Each advisor works for 10 hours a
day during the registration period. SMU currently has 10 advisors. While advising an individual
student can take anywhere from 2 to 30 minutes, it takes an average of 12 minutes per student.
During the registration period, the 10 advisors see an average of 300 students a day on a first-
come, first-served basis.
Required:
1. Using the formula on page 747, calculate how long the average student will have to wait in
the advisor’s office before being advised.
2. The head of the registration advisors would like to increase the number of students seen each
day because at 300 students a day it would take 14 working days to see all of the students.
This is a problem because the registration period lasts for only 2 weeks (10 working days). If
the advisors could advise 420 students a day, it would take only 2 weeks (10 days). However,
the head advisor wants to make sure that the waiting time is not excessive. What would be
the average waiting time if 420 students were seen each day?
3. SMU wants to know the effect of reducing the average advising time on the average wait
time. If SMU can reduce the average advising time to 10 minutes, what would be the average
waiting time if 420 students were seen each day?
SOLUTION