19-21
19-22
19-24 (25 min.) Waiting time, cost considerations, and customer satisfaction
(continued from 19-23).
Refer to the information presented in Exercise 19-23. The head of the registration advisors at
SMU has decided that the advisors must finish their advising in 2 weeks and therefore must
advise 420 students a day. However, the average waiting time given a 12-minute advising period
will result in student complaints, as will reducing the average advising time to 10 minutes. SMU
is considering two alternatives:
a. Hire two more advisors for the 2-week (10-working day) advising period. This will increase
the available number of advisors to 12 and therefore lower the average waiting time.
b. Increase the number of days that the advisors will work during the 2-week registration period
to 6 days a week. If SMU increases the number of days worked to 6 per week, then the 10
advisors need only see 350 students a day to advise all of the students in 2 weeks.
Required:
1. What would the average wait time be under alternative A and under alternative B?
2. If advisors earn $100 per day, which alternative would be cheaper for SMU (assume that if
advisors work 6 days in a given work week, they will be paid time and a half for the sixth
day)?
3. From a student satisfaction point of view, which of the two alternatives would be preferred?
Why?
SOLUTION
19-23
19-25 (25 min.) Nonfinancial measures of quality and time.
Global Cell Phones (GCP) has developed a cell phone that can be used anywhere in the world
(even countries like Japan that have a relatively unique cell phone system). GCP has been
receiving complaints about the phone. For the past two years, GCP has been test-marketing the
phones and gathering nonfinancial information related to actual and perceived aspects of the
phone’s quality. The company expects that, given the lack of competition in this market,
increasing the quality of the phone will result in higher sales and thereby higher profits.
19-24
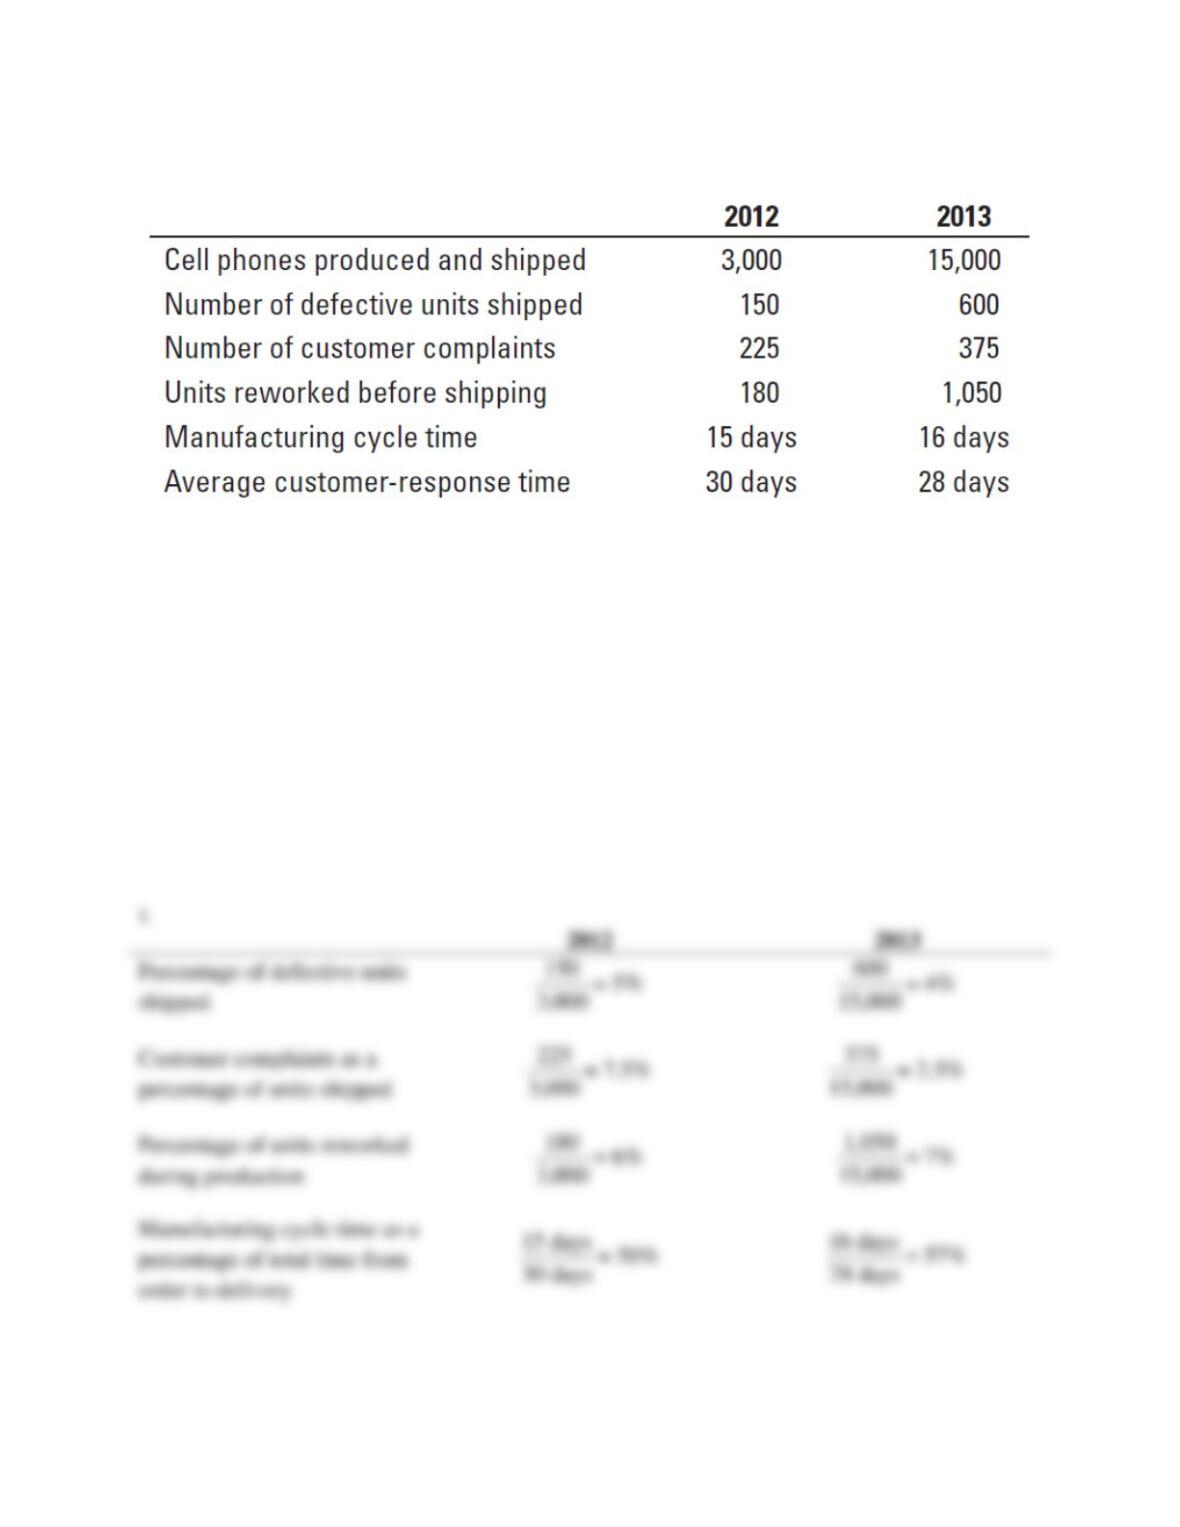
Quality data for 2012 and 2013 include the following:
Required:
1. For each year, 2012 and 2013, calculate the following:
a. Percentage of defective units shipped
b. Customer complaints as a percentage of units shipped
c. Percentage of units reworked during production
d. Manufacturing cycle time as a percentage of total time from order to delivery
2. Referring to the information computed in requirement 1, explain whether GCP’s quality and
timeliness have improved.
3. Why would manufacturing cycle time have increased while customer-response time
decreased? (It may be useful to first describe what is included in each time measurement—
see Exhibit 19-7, page 745.)
SOLUTION
19-25
19-26
19-26 (15 min.) Manufacturing cycle time, manufacturing cycle efficiency, nonfinancial
measures of quality.
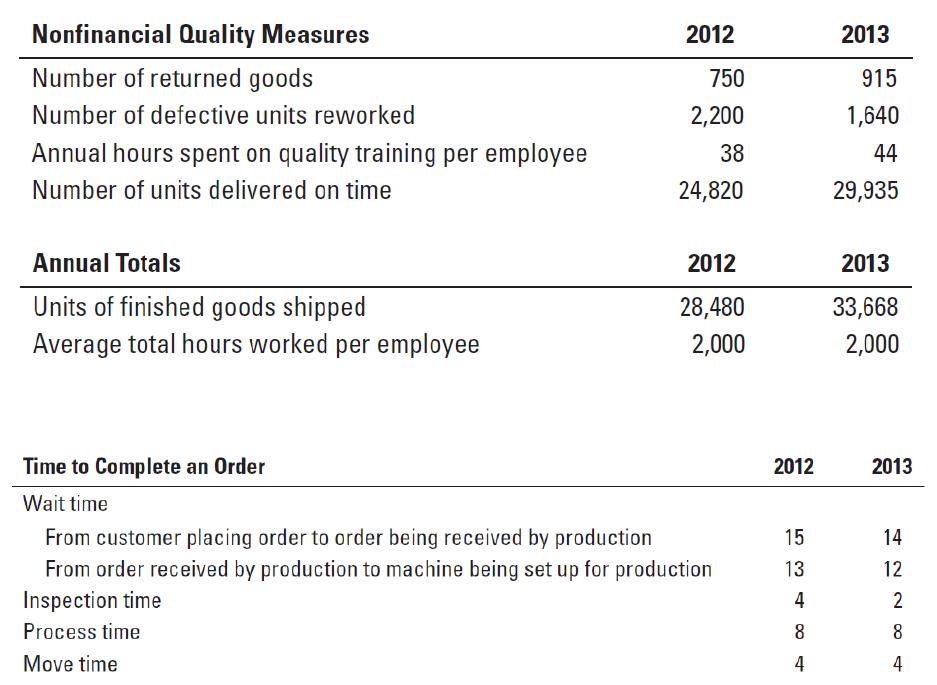
(CMA, adapted) Prescott Manufacturing evaluates the performance of its production managers
based on a variety of factors, including cost, quality, and cycle time. The following are
nonfinancial measures for quality and time for 2012 and 2013 for its only product:
The following information relates to the average amount of time needed to complete an order:
Required:
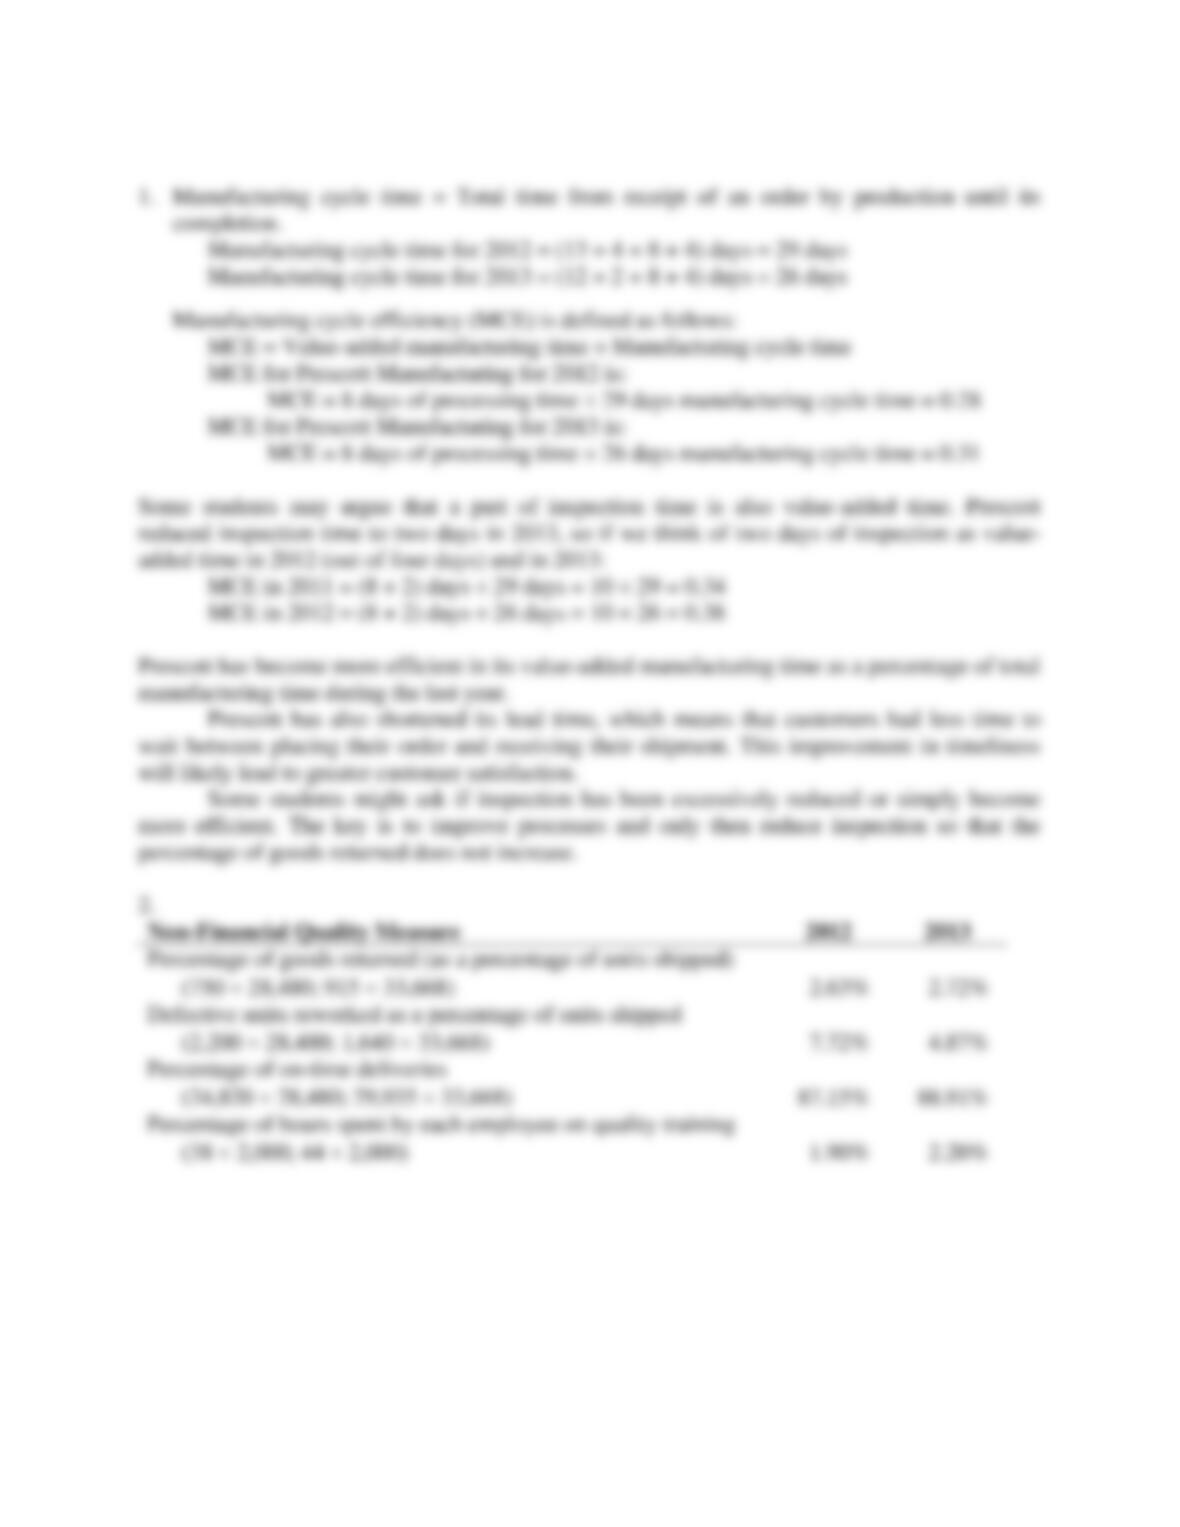
1. Compute the manufacturing cycle efficiency for an order for 2012 and 2013.
2. For each year 2012 and 2013, calculate the following:
a. Percentage of goods returned
b. Defective units reworked as a percentage of units shipped
c. Percentage of on-time deliveries
d. Percentage of hours spent by each employee on quality training
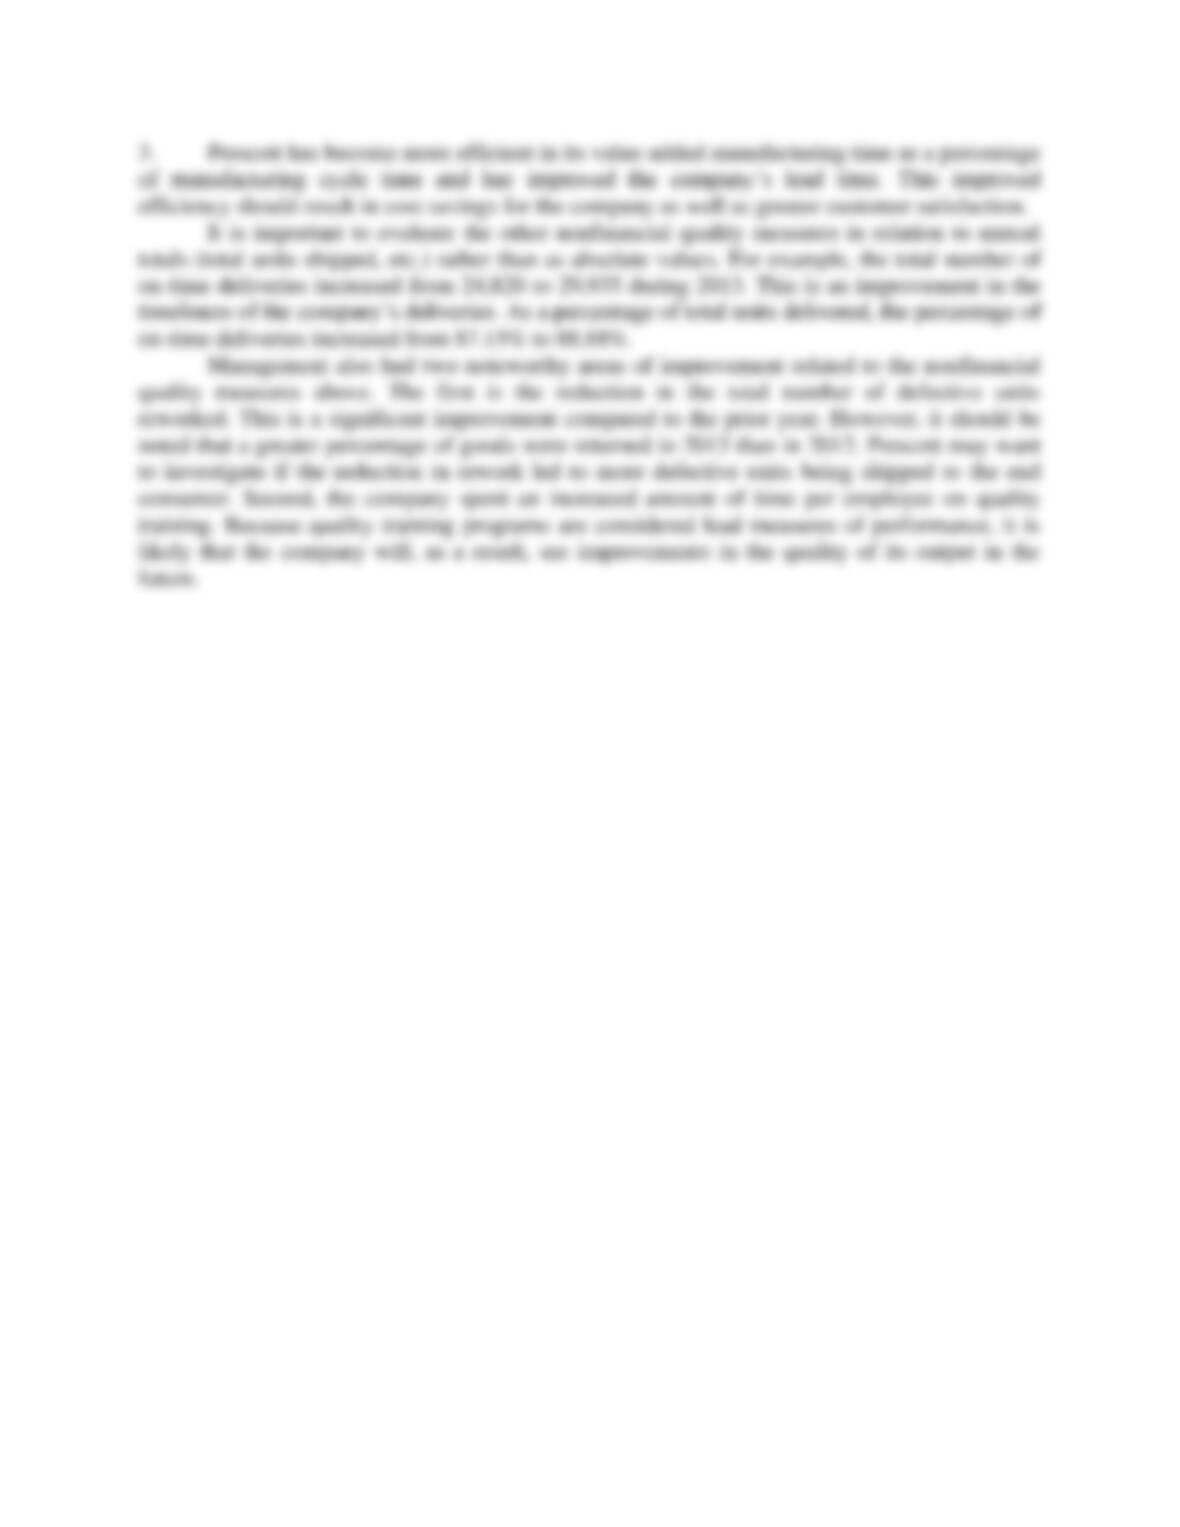
3. Evaluate management’s performance on quality and timeliness in 2012 and 2013.
19-27
SOLUTION
19-28
19-27 (30–40 min.) Statistical quality control.
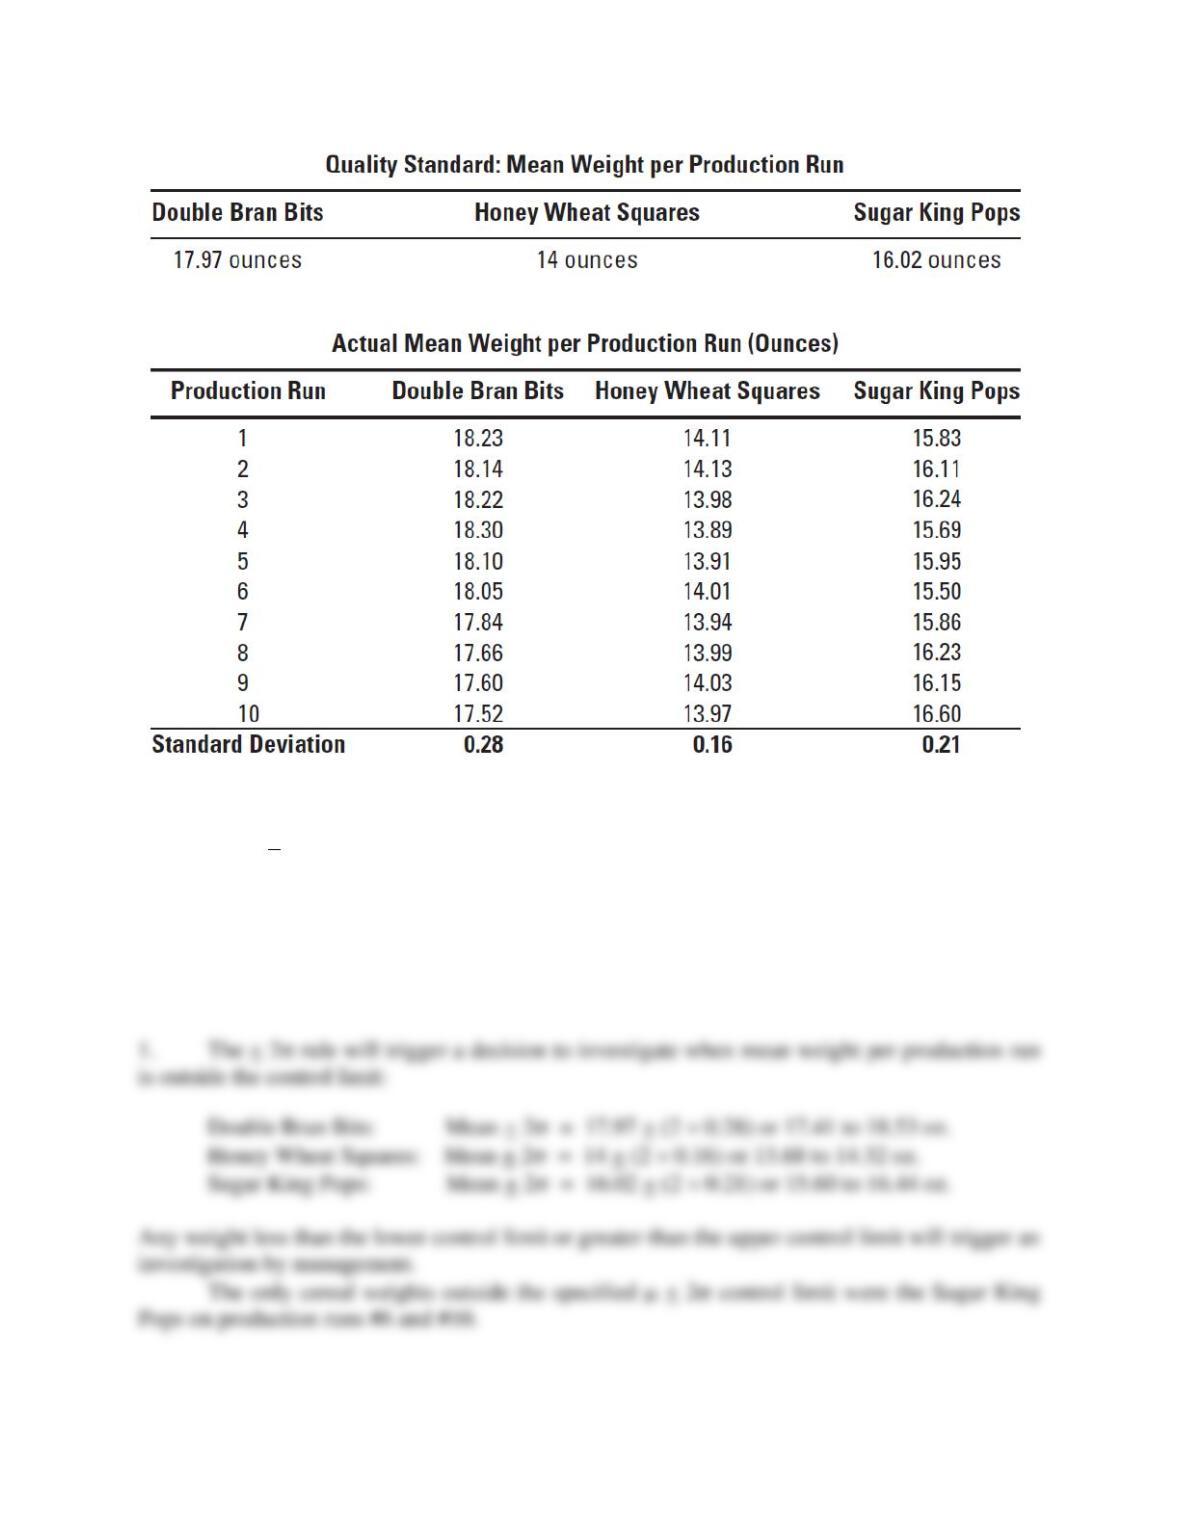
Harvest Cereals produces a wide variety of breakfast products. The company’s three best-selling
breakfast cereals are Double Bran Bits, Honey Wheat Squares, and Sugar King Pops. Each box
of a particular type of cereal is required to meet pre-determined weight specifications, so that no
single box contains more or less cereal than another. The company measures the mean weight
per production run to determine if there are variances over or under the company’s specified
upper- and lower-level control limits. A production run that falls outside of the specified control
limit does not meet quality standards and is investigated further by management to determine the
cause of the variance. The three Harvest breakfast cereals had the following weight standards
and production run data for the month of March:
19-29
Required:
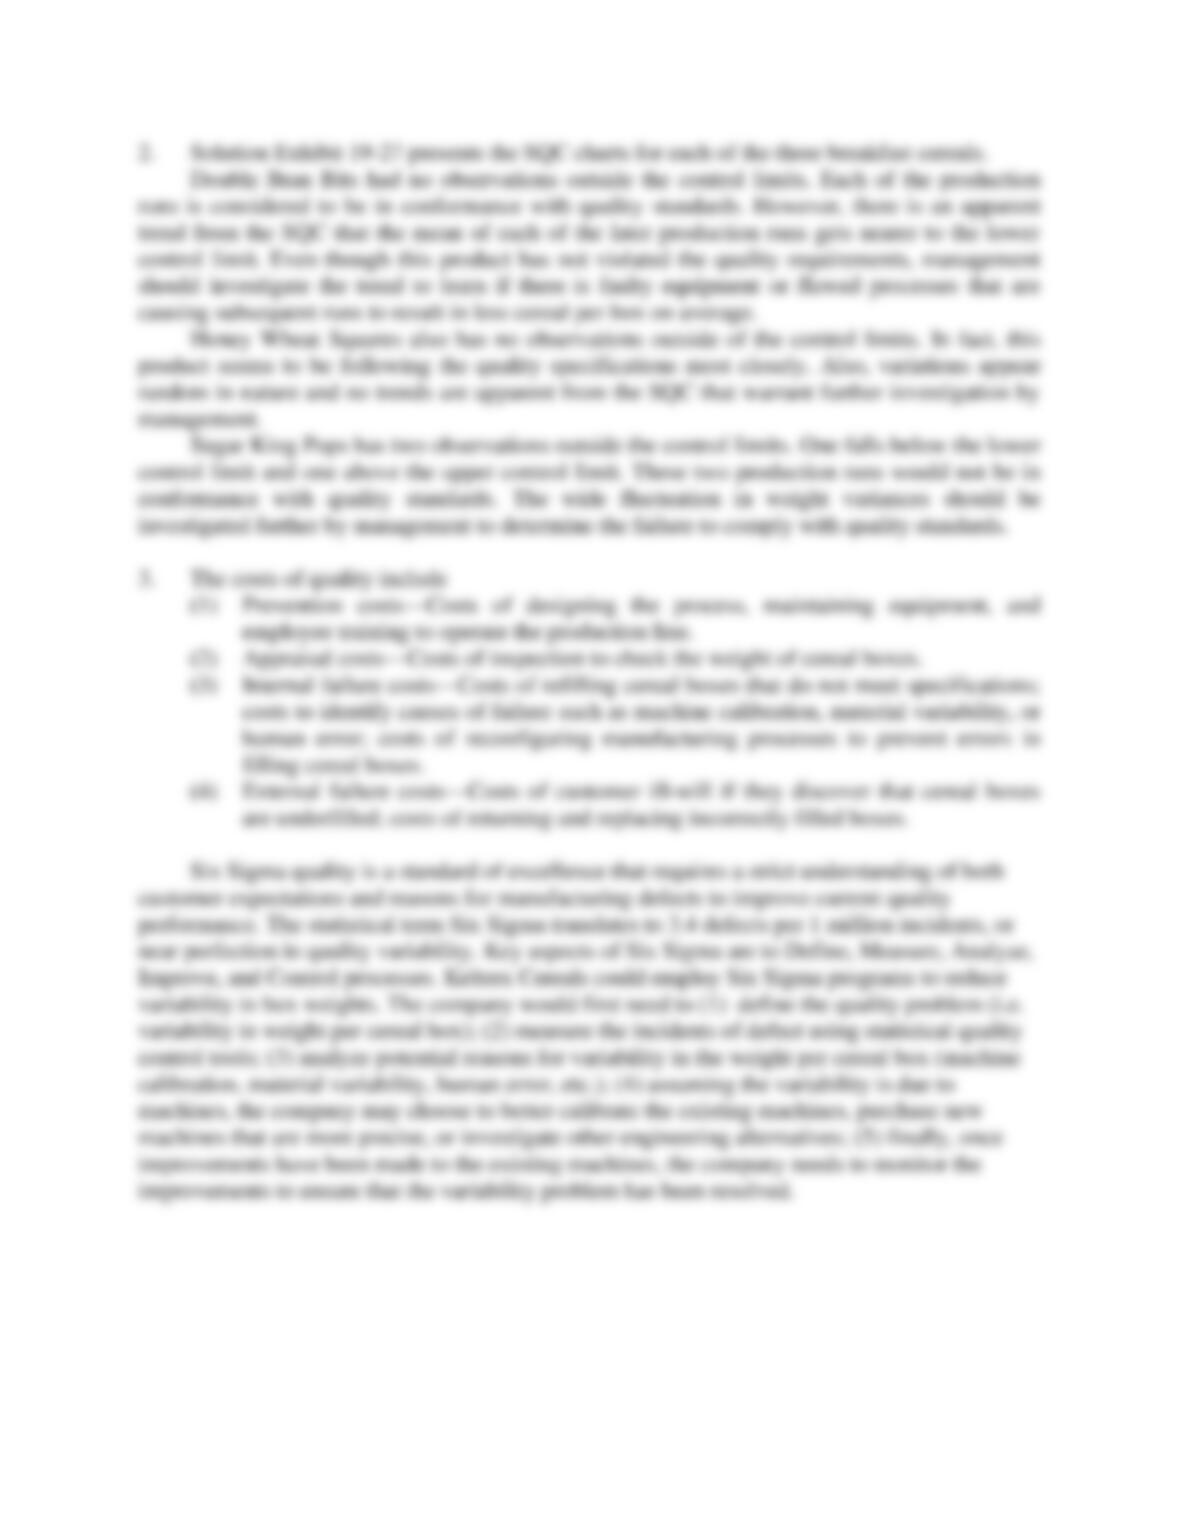
1. Using the + 2 rule, what variance investigation decisions would be made?
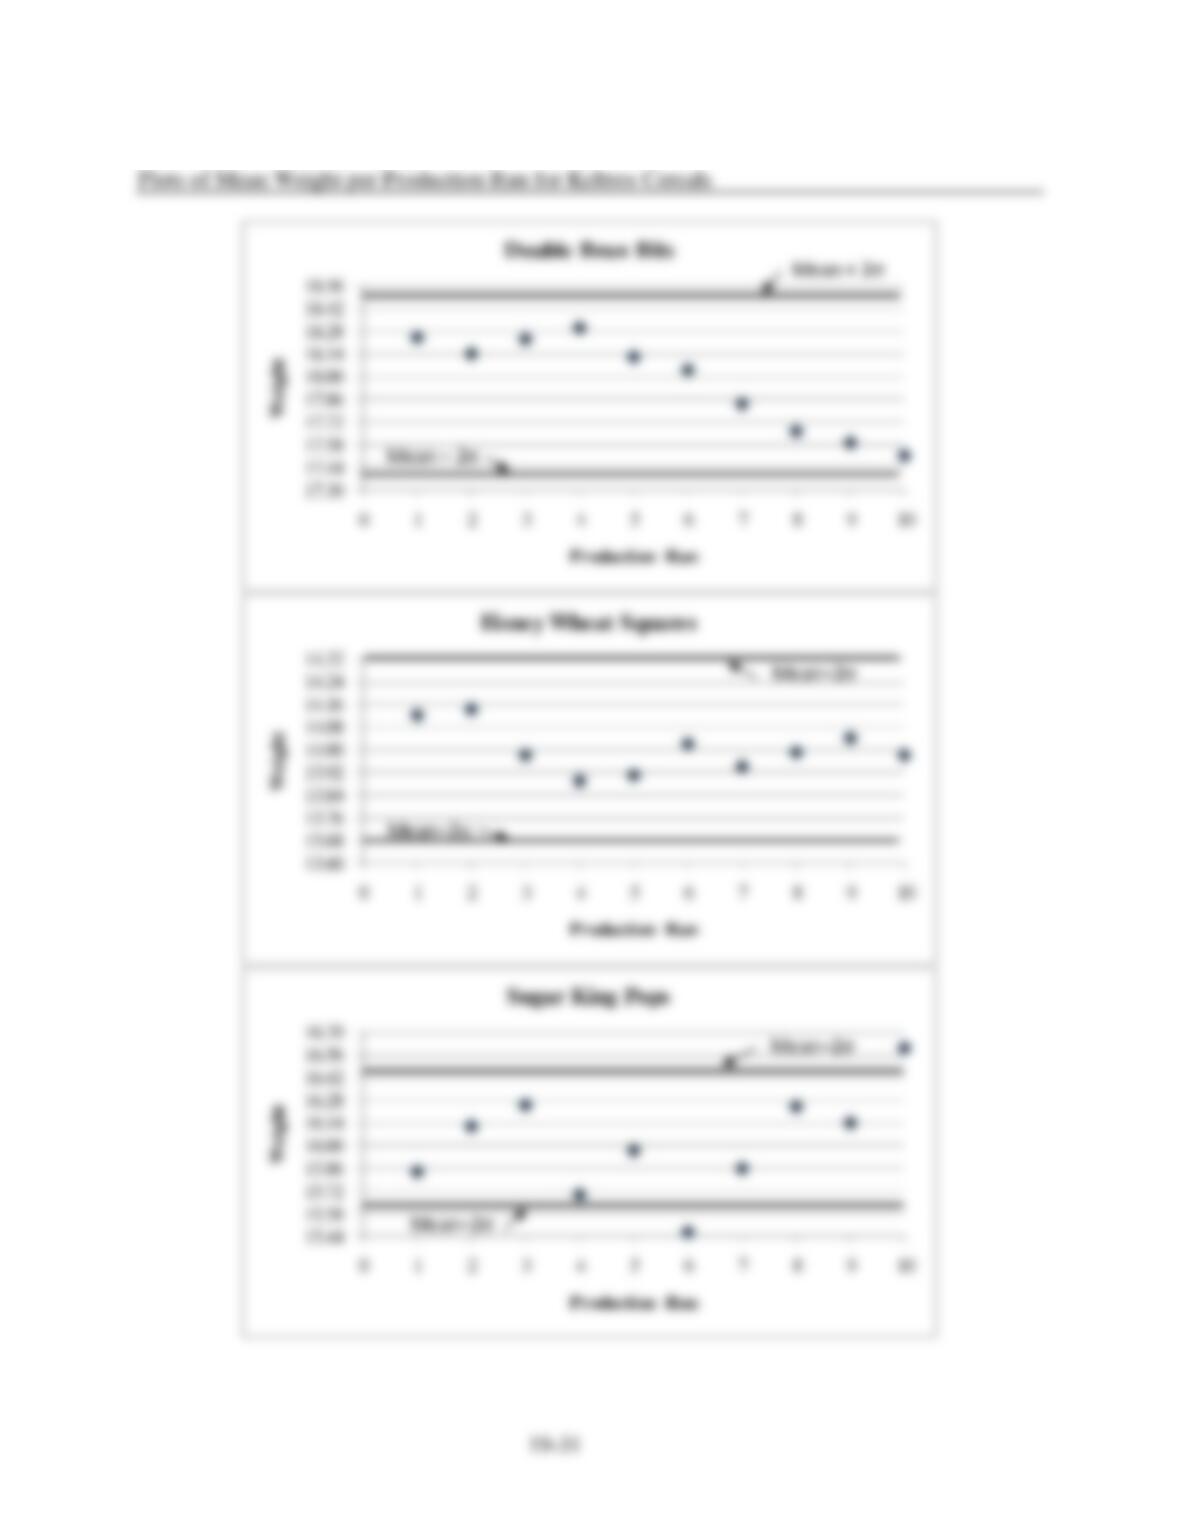
2. Present control charts for each of the three breakfast cereals for March. What inferences can
you draw from the charts?
3. What are the costs of quality in this example? How could Harvest employ Six Sigma
programs to improve quality?
SOLUTION
19-30
SOLUTION EXHIBIT 19-27
19-32
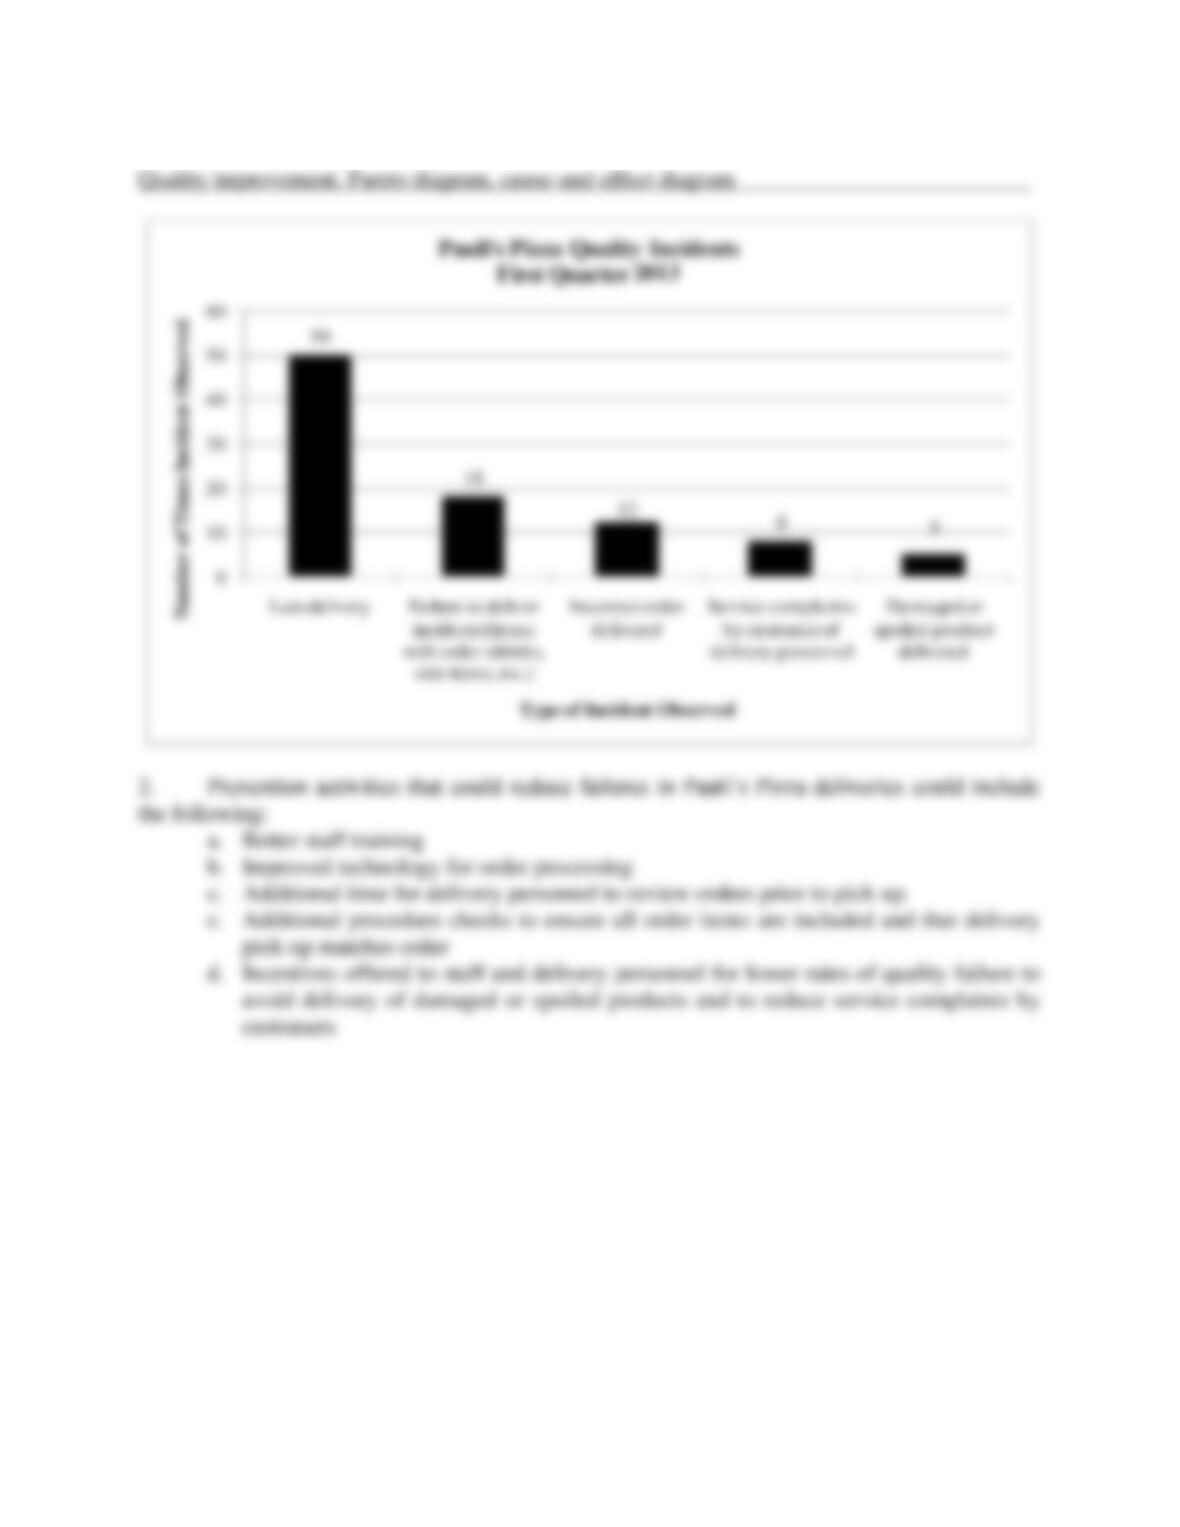
19-28 (25 min.) Quality improvement, Pareto diagram, cause-and-effect diagram.
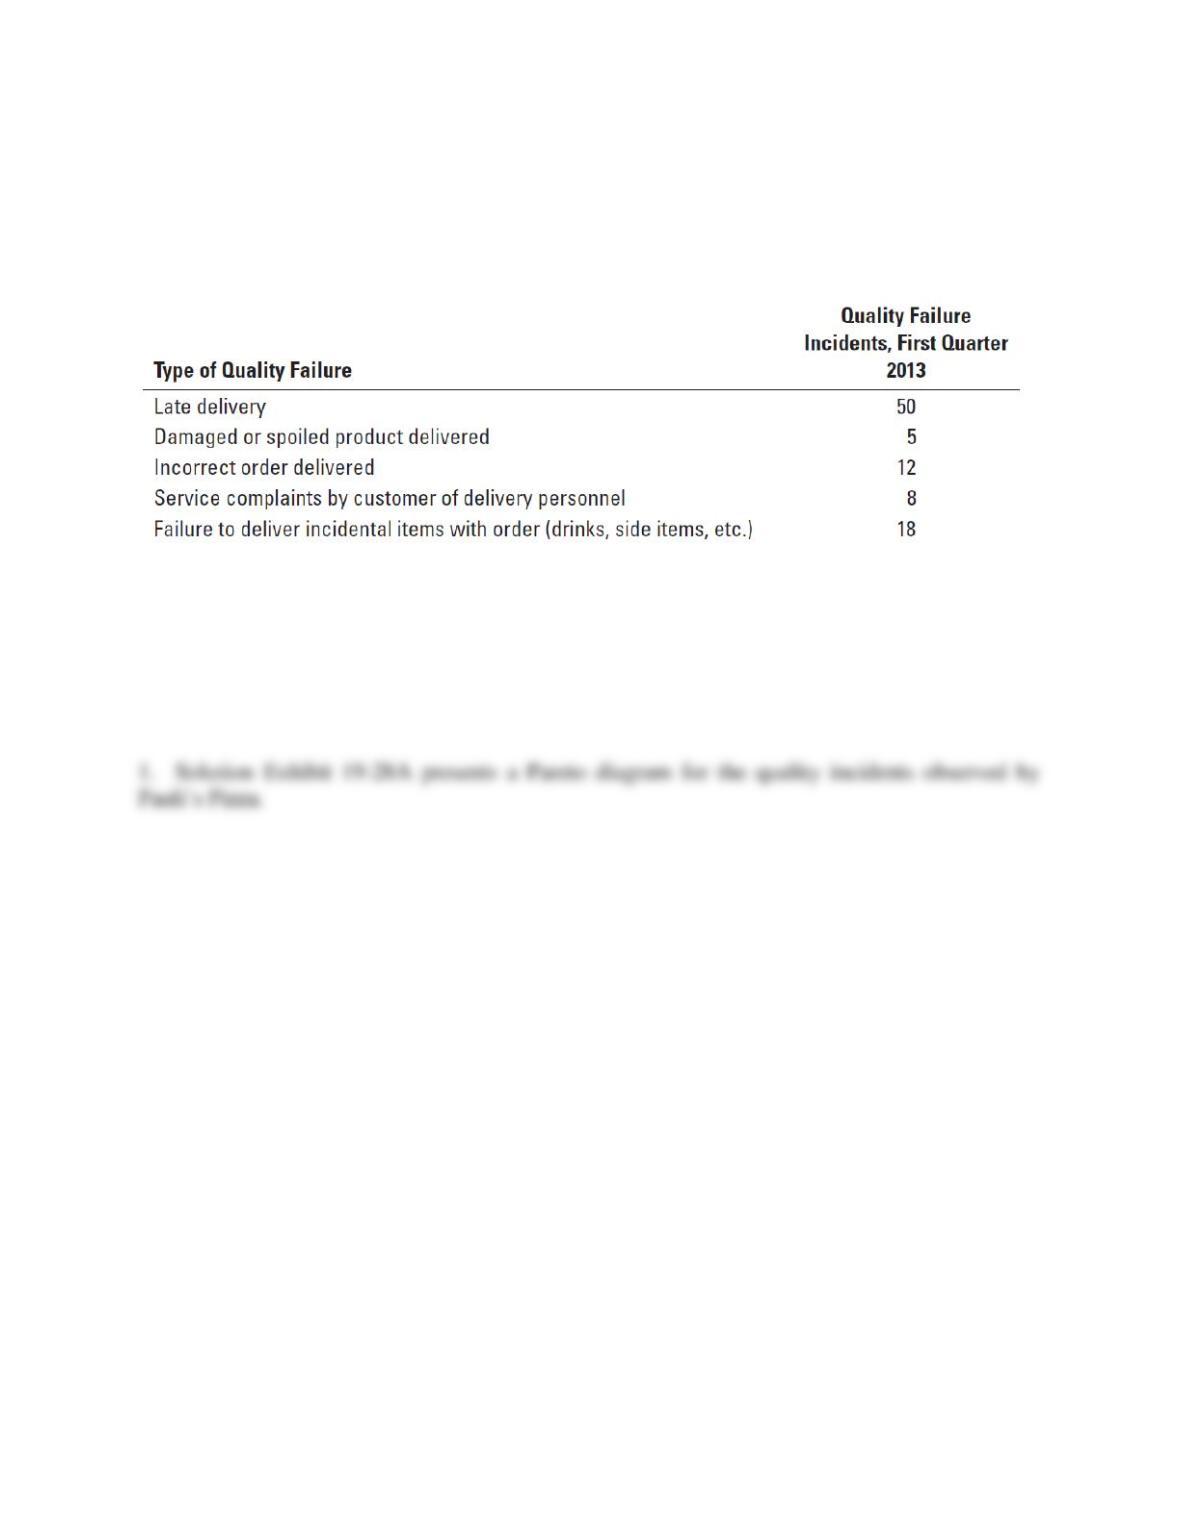
Pauli’s Pizza has recently begun collecting data on the quality of its customer order processing
and delivery. Pauli’s made 1,800 deliveries during the first quarter of 2013. The following
quality data pertain to first-quarter deliveries:
Required:
1. Draw a Pareto diagram of the quality failures experienced by Pauli’s Pizza.
2. Give examples of prevention activities that could reduce the failures experienced by Pauli’s.
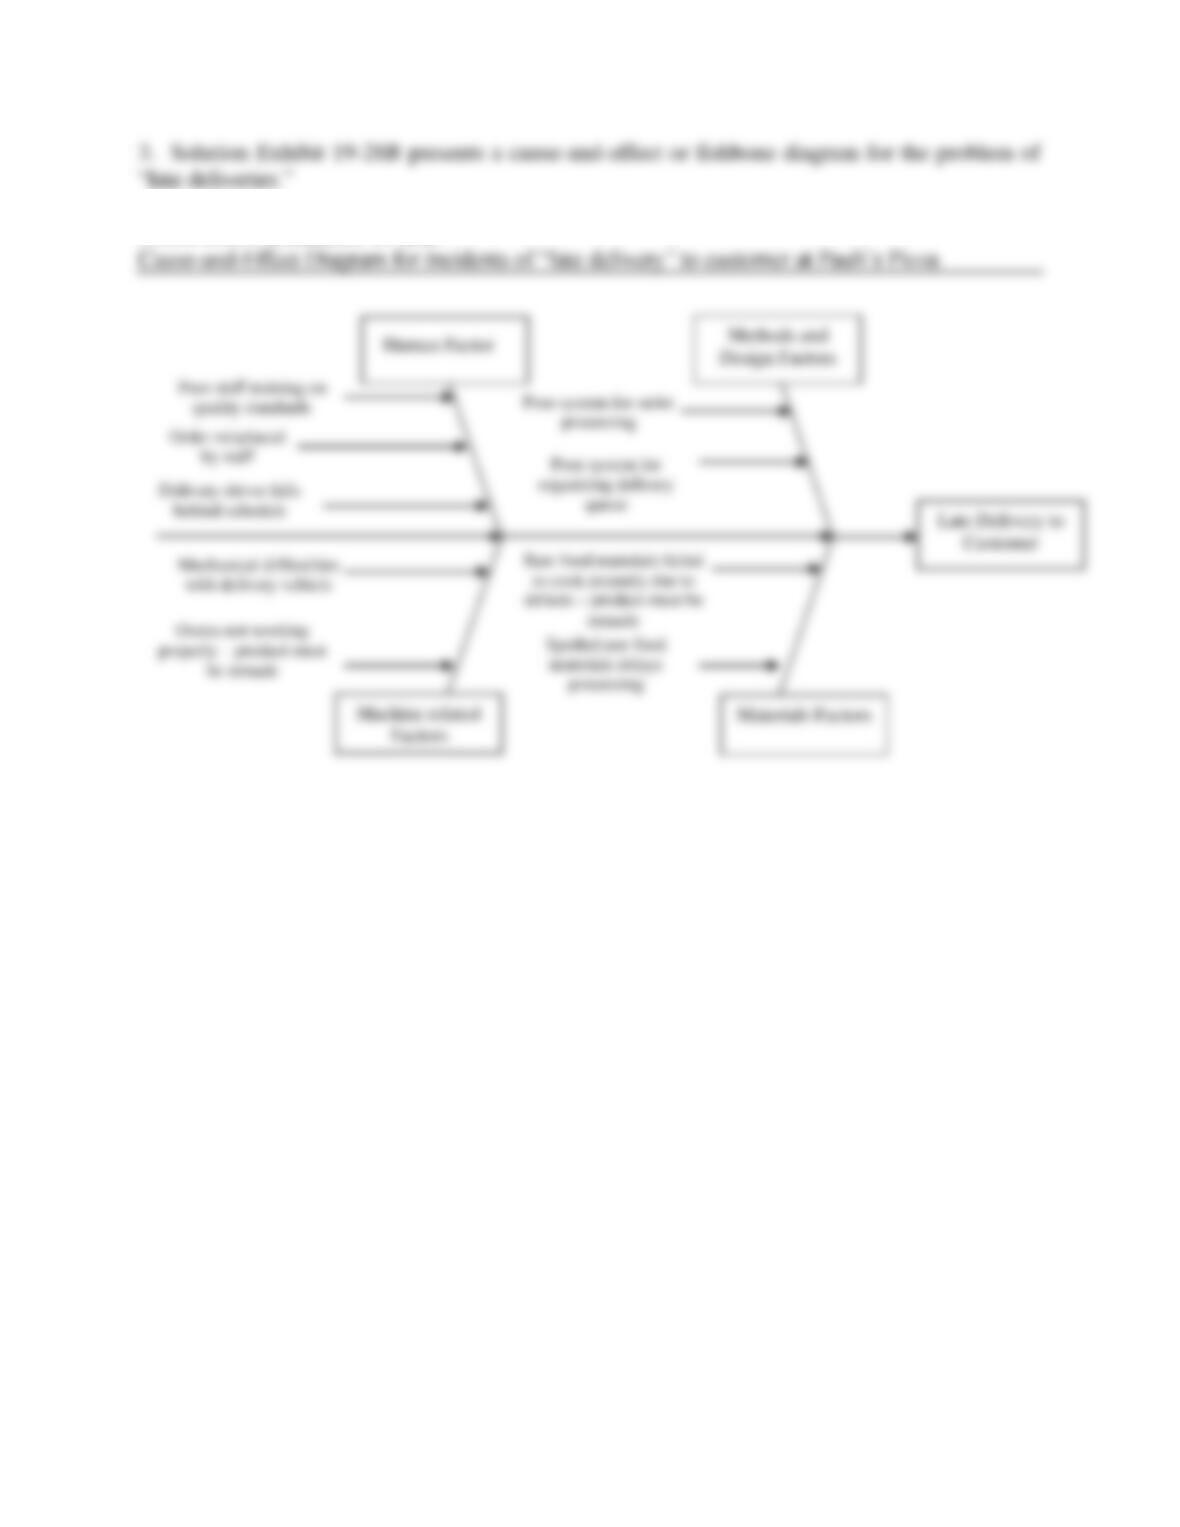
3. Draw a cause-and-effect diagram of possible causes for late deliveries.
SOLUTION
19-33
SOLUTION EXHIBIT 19-28A
19-34
SOLUTION EXHIBIT 19-28B
19-35
19-29 (30 min.) Quality improvement, relevant costs, and relevant revenues.
The Tristan Corporation sells 250,000 V262 valves to the automobile and truck industry. Tristan
has a capacity of 150,000 machine-hours and can produce two valves per machine–hour. V262’s
contribution margin per unit is $7. Tristan sells only 250,000 valves because 50,000 valves (20%
of the good valves) need to be reworked. It takes 1 machine-hour to rework two valves, so
25,000 hours of capacity are used in the rework process. Tristan’s rework costs are $550,000.
Rework costs consist of the following:
▪ Direct materials and direct rework labor (variable costs): $5 per unit
▪ Fixed costs of equipment, rent, and overhead allocation: $6 per unit
Tristan’s process designers have developed a modification that would maintain the speed of the
process and ensure 100% quality and no rework. The new process would cost $538,000 per year.
The following additional information is available:
▪ The demand for Tristan’s V262 valves is 400,000 per year.
▪ The Colton Corporation has asked Tristan to supply 27,000 T971 valves (another product)
if Tristan implements the new design. The contribution margin per T971 valve is $12.
Tristan can make one T971 valve per machine-hour with 100% quality and no rework.
Required:
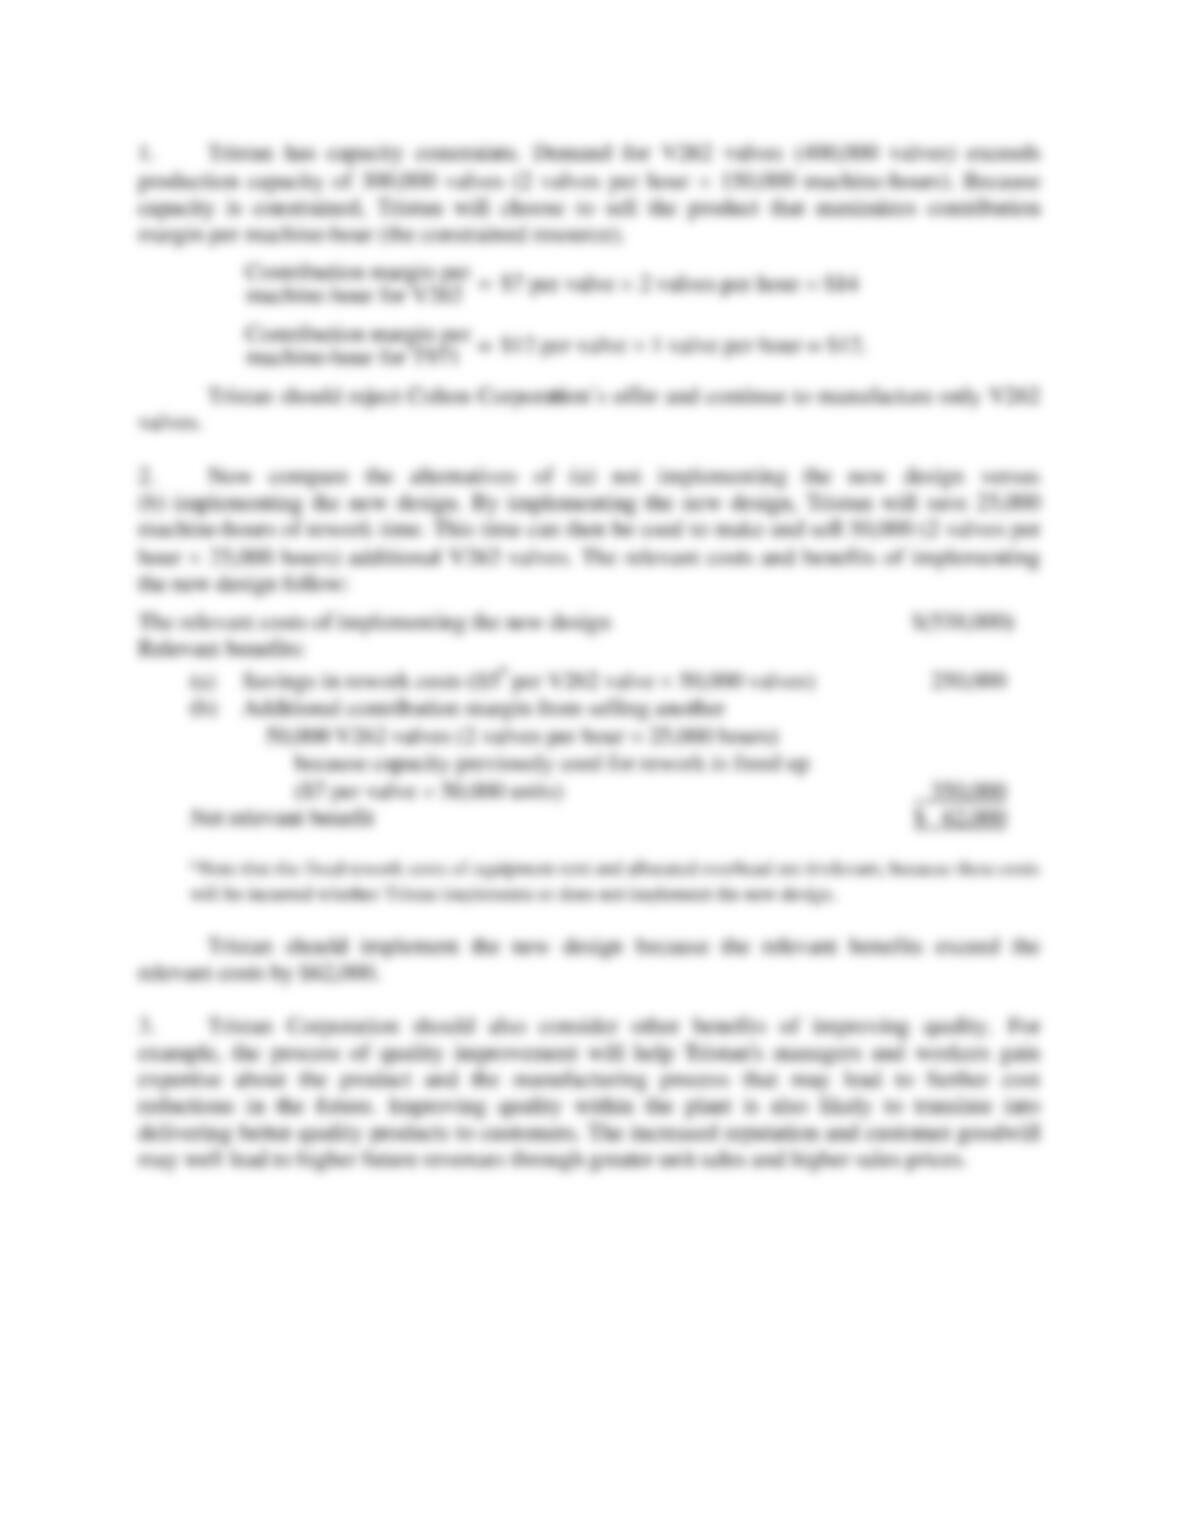
1. Suppose Tristan’s designers implement the new design. Should Tristan accept Colton’s order
for 27,000 T971 valves? Show your calculations.
2. Should Tristan implement the new design? Show your calculations.
3. What nonfinancial and qualitative factors should Tristan consider in deciding whether to
implement the new design?
SOLUTION
19-36
19-30 (30 min.) Quality improvement, relevant costs, and relevant revenues.
The Harvest Corporation uses multicolored molding to make plastic lamps. The molding
operation has a capacity of 100,000 units per year. The demand for lamps is very strong. Harvest
will be able to sell whatever output quantities it can produce at $50 per lamp.
Harvest can start only 100,000 units into production in the molding department because of
capacity constraints on the molding machines. If a defective unit is produced at the molding
19-37
operation, it must be scrapped at a net disposal value of zero. Of the 100,000 units started at the
molding operation, 10,000 defective units (10%) are produced. The cost of a defective unit,
based on total (fixed and variable) manufacturing costs incurred up to the molding operation,
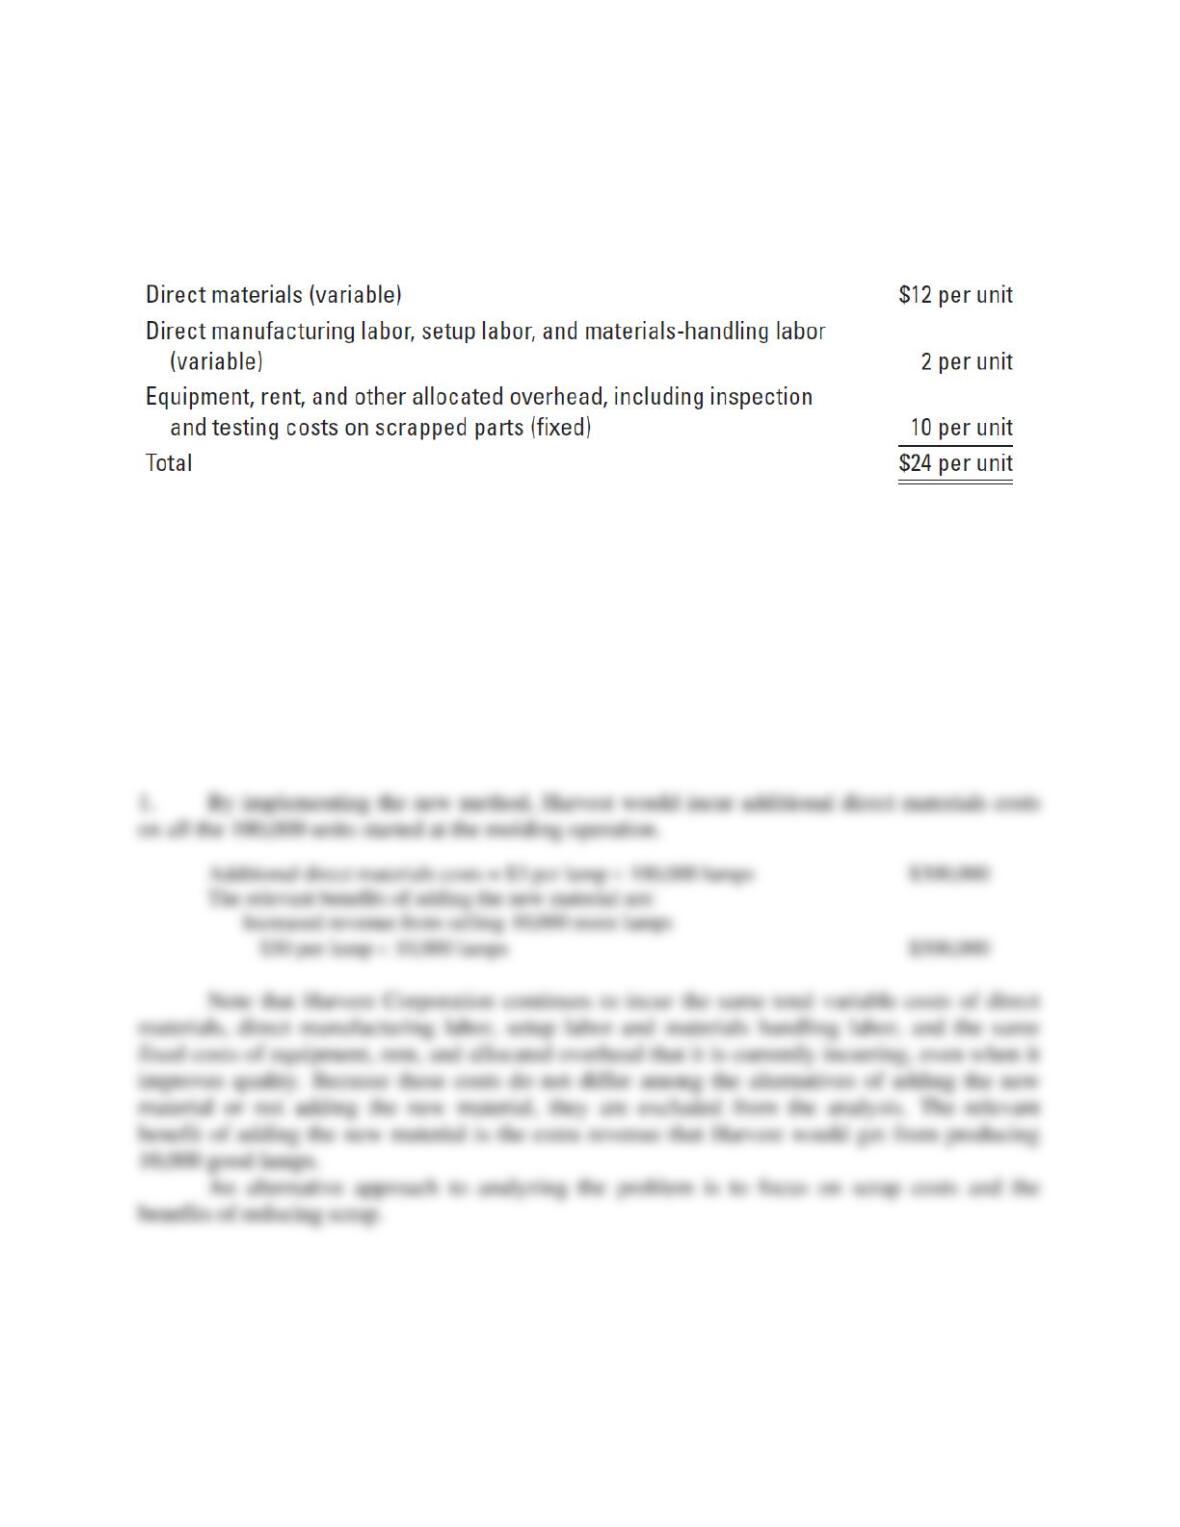
equals $24 per unit, as follows:
Harvest’s designers have determined that adding a different type of material to the existing direct
materials would result in no defective units being produced, but it would increase the variable
costs by $3 per lamp in the molding department.
Required:
1. Should Harvest use the new material? Show your calculations.
2. What nonfinancial and qualitative factors should Harvest consider in making the decision?
SOLUTION
19-38
19-31 (25–30 min.) Waiting times, manufacturing cycle times.
The Seawall Corporation uses an injection molding machine to make a plastic product, Z39, after
receiving firm orders from its customers. Seawall estimates that it will receive 50 orders for Z39
during the coming year. Each order of Z39 will take 80 hours of machine time. The annual
machine capacity is 5,000 hours.
Required:
1. Calculate (a) the average amount of time that an order for Z39 will wait in line before it is
processed and (b) the average manufacturing cycle time per order for Z39.
2. Seawall is considering introducing a new product, Y28. The company expects it will receive
25 orders of Y28 in the coming year. Each order of Y28 will take 20 hours of machine time.
Assuming the demand for Z39 will not be affected by the introduction of Y28, calculate (a)
the average waiting time for an order received and (b) the average manufacturing cycle time
per order for each product, if Seawall introduces Y28.