An asterisk (*) will appear to the right of an incorrect entry.
1.
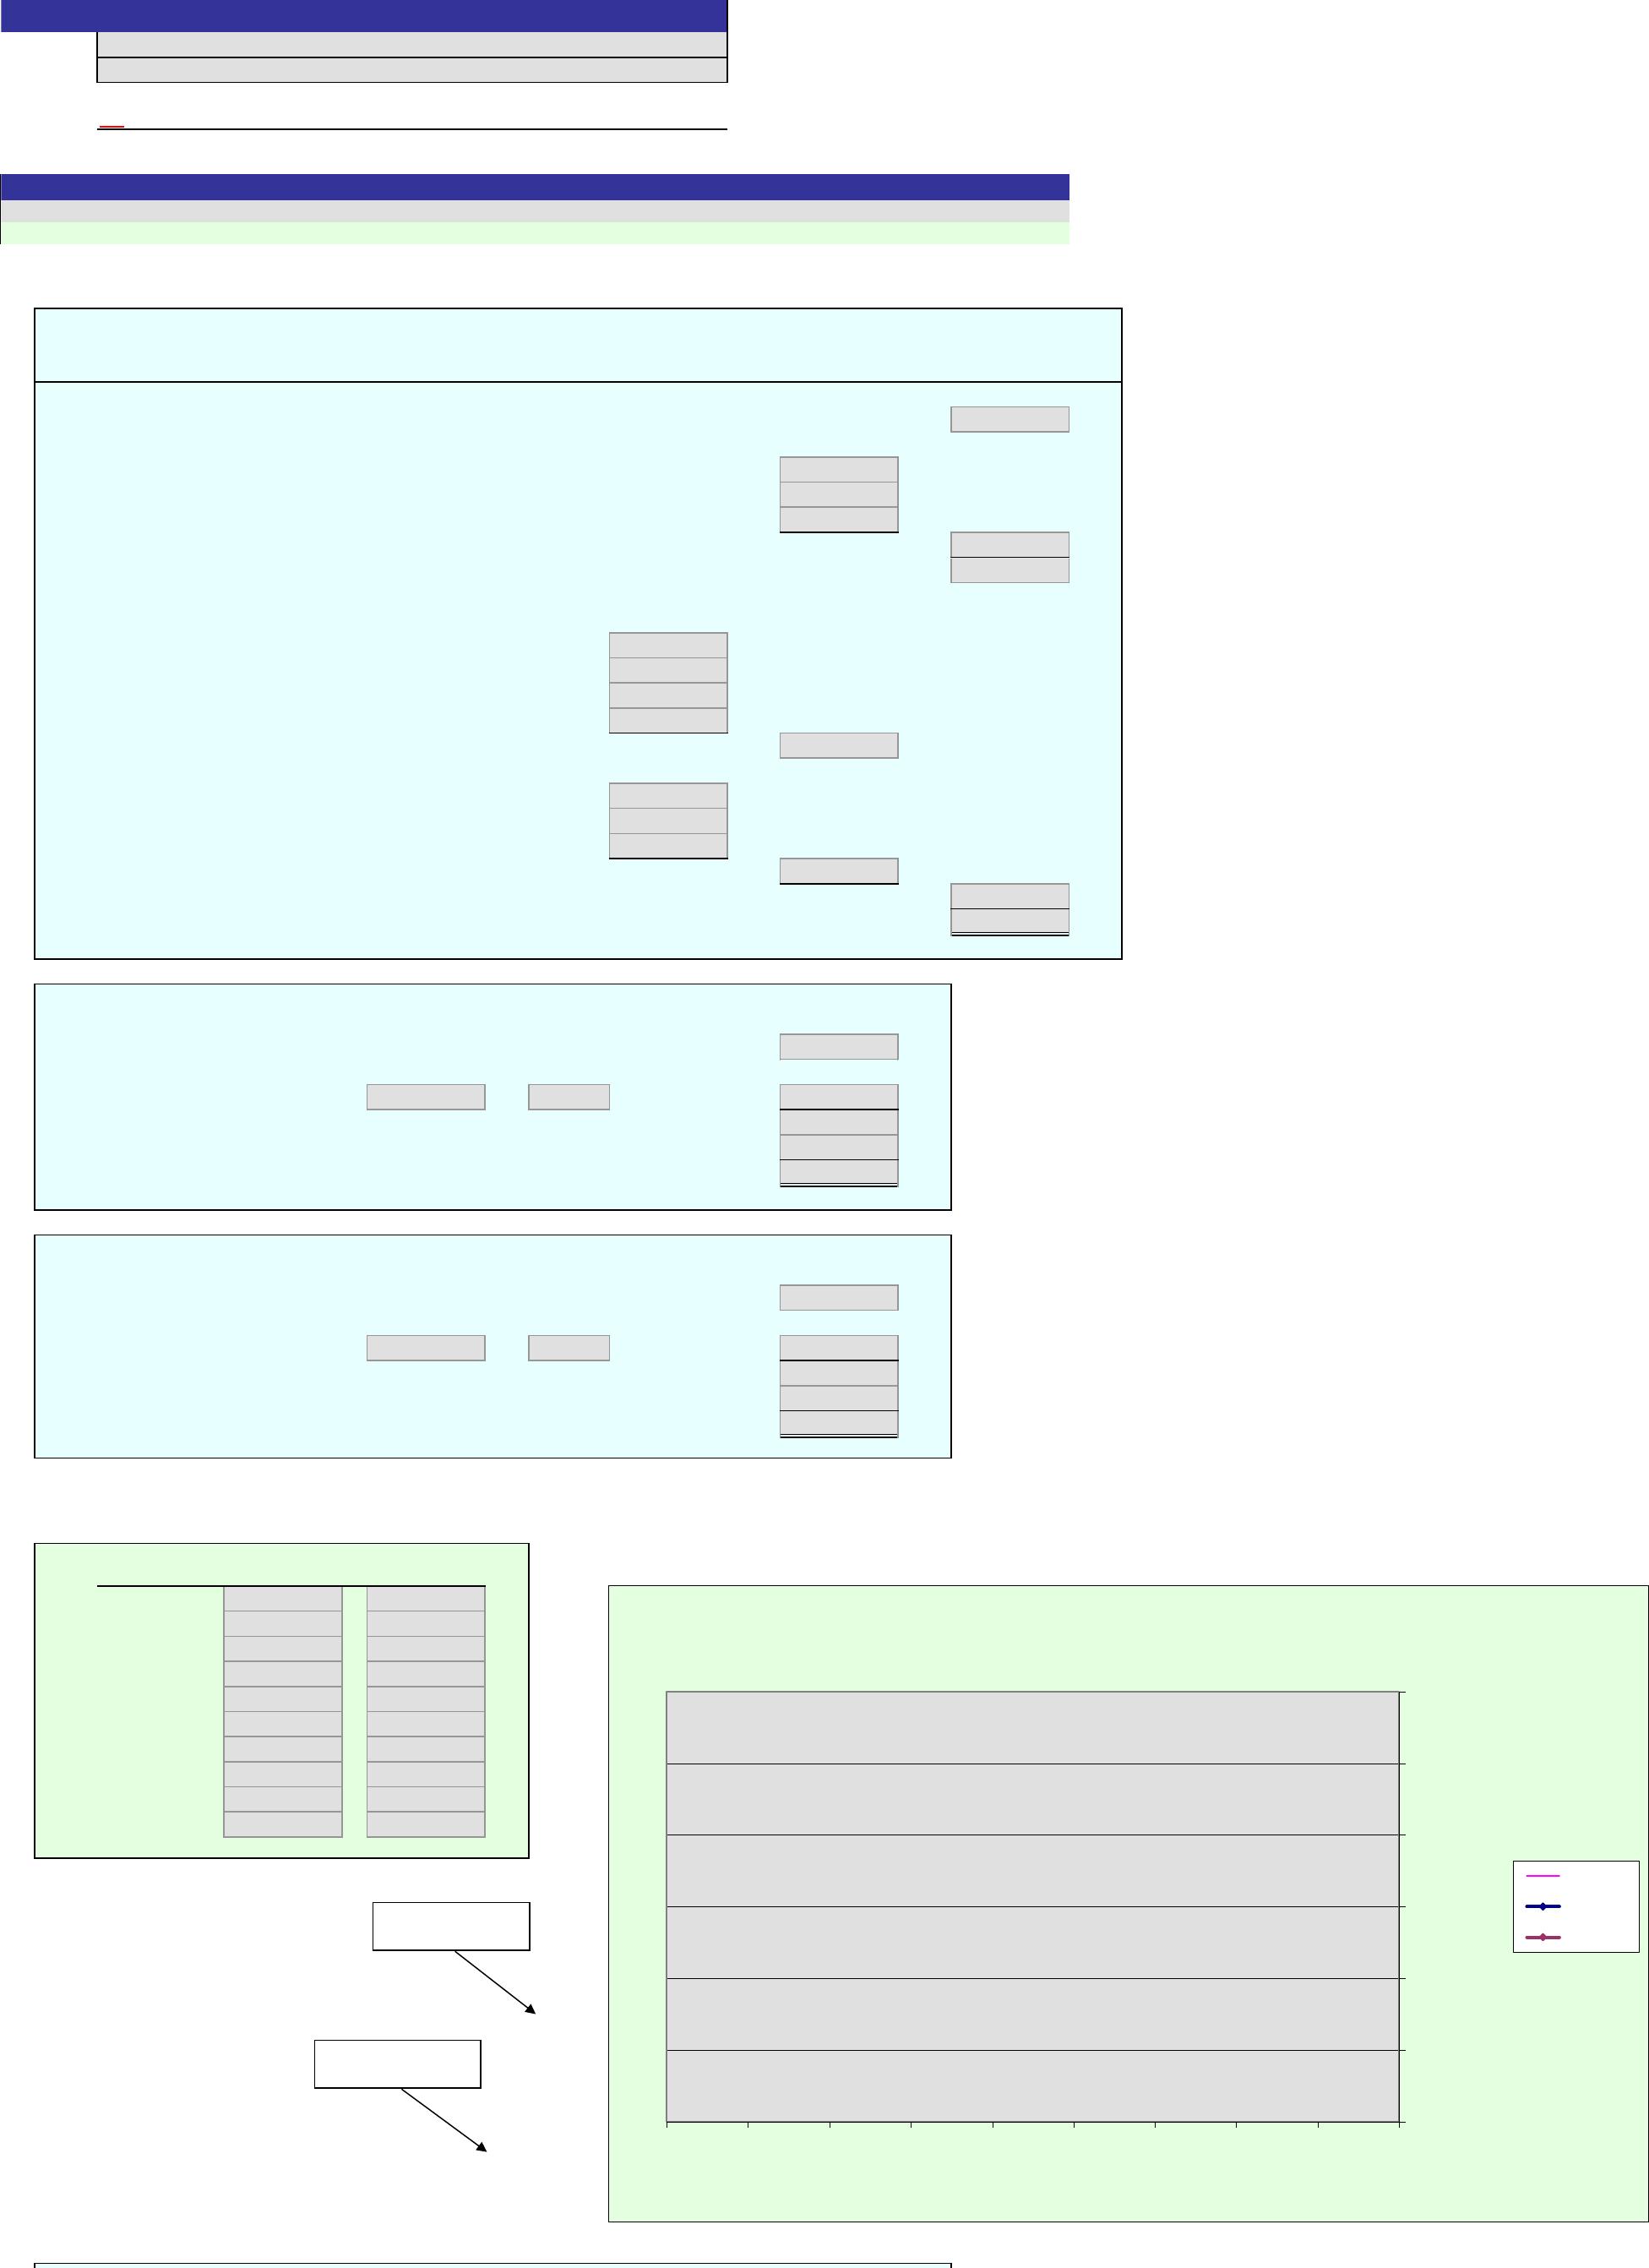
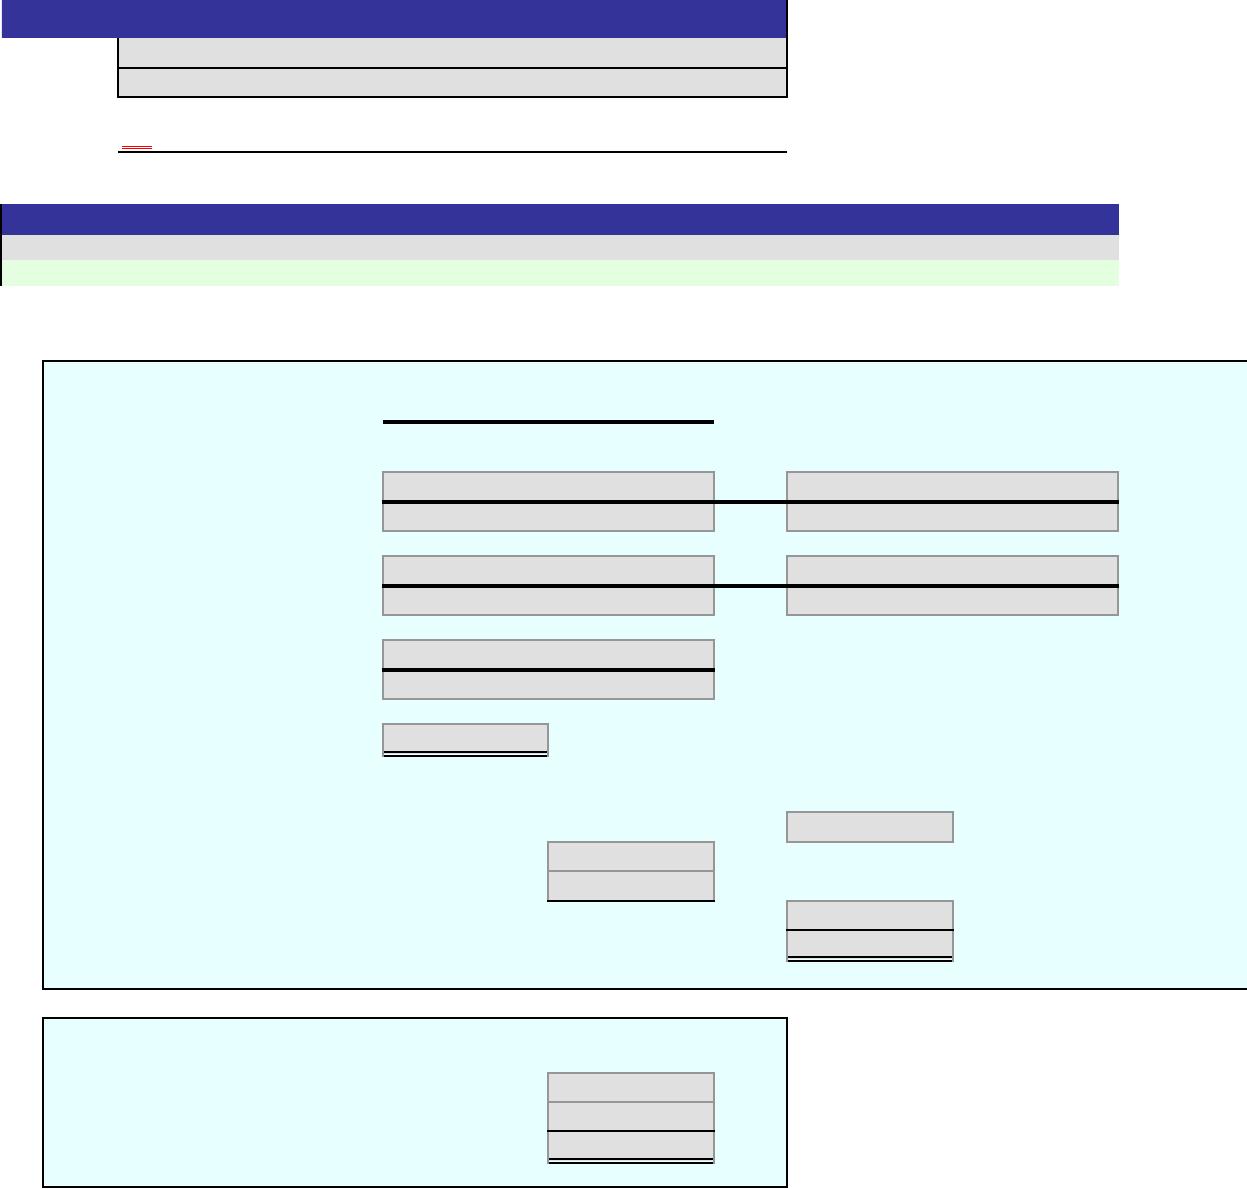
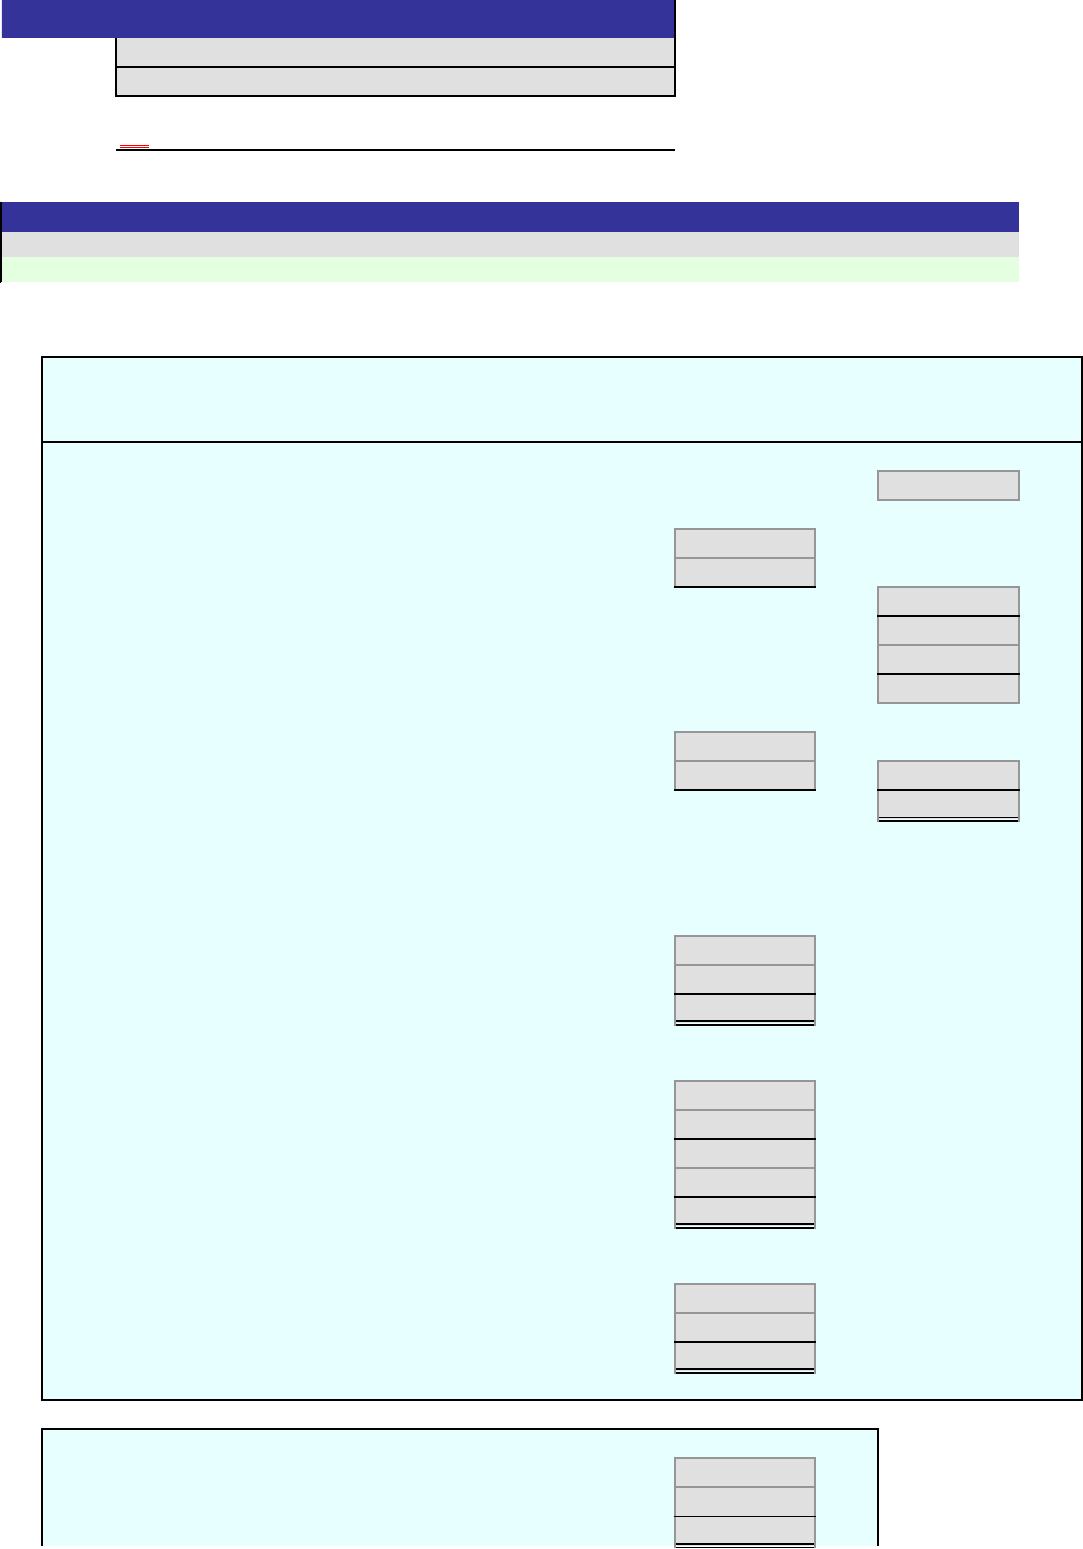
Sales
Cost of goods sold:
Direct materials
Direct labor
Factory overhead
Cost of goods sold
Gross profit
Expenses:
Selling expenses
Sales salaries and commissions
Advertising
Travel
Miscellaneous selling expense
Total selling expenses
Administrative expenses:
Office and officers’ salaries
Supplies
Miscellaneous administrative expense
Total administrative expenses
Total expenses
Income from operations
2.
Contribution margin ratio:
Sales
Variable costs
Contribution margin
Sales
Contribution margin ratio
3.
Break-even sales:
Fixed costs
Unit contribution margin
Break-even sales (units)
Sale price
Break-even sales (dollars)
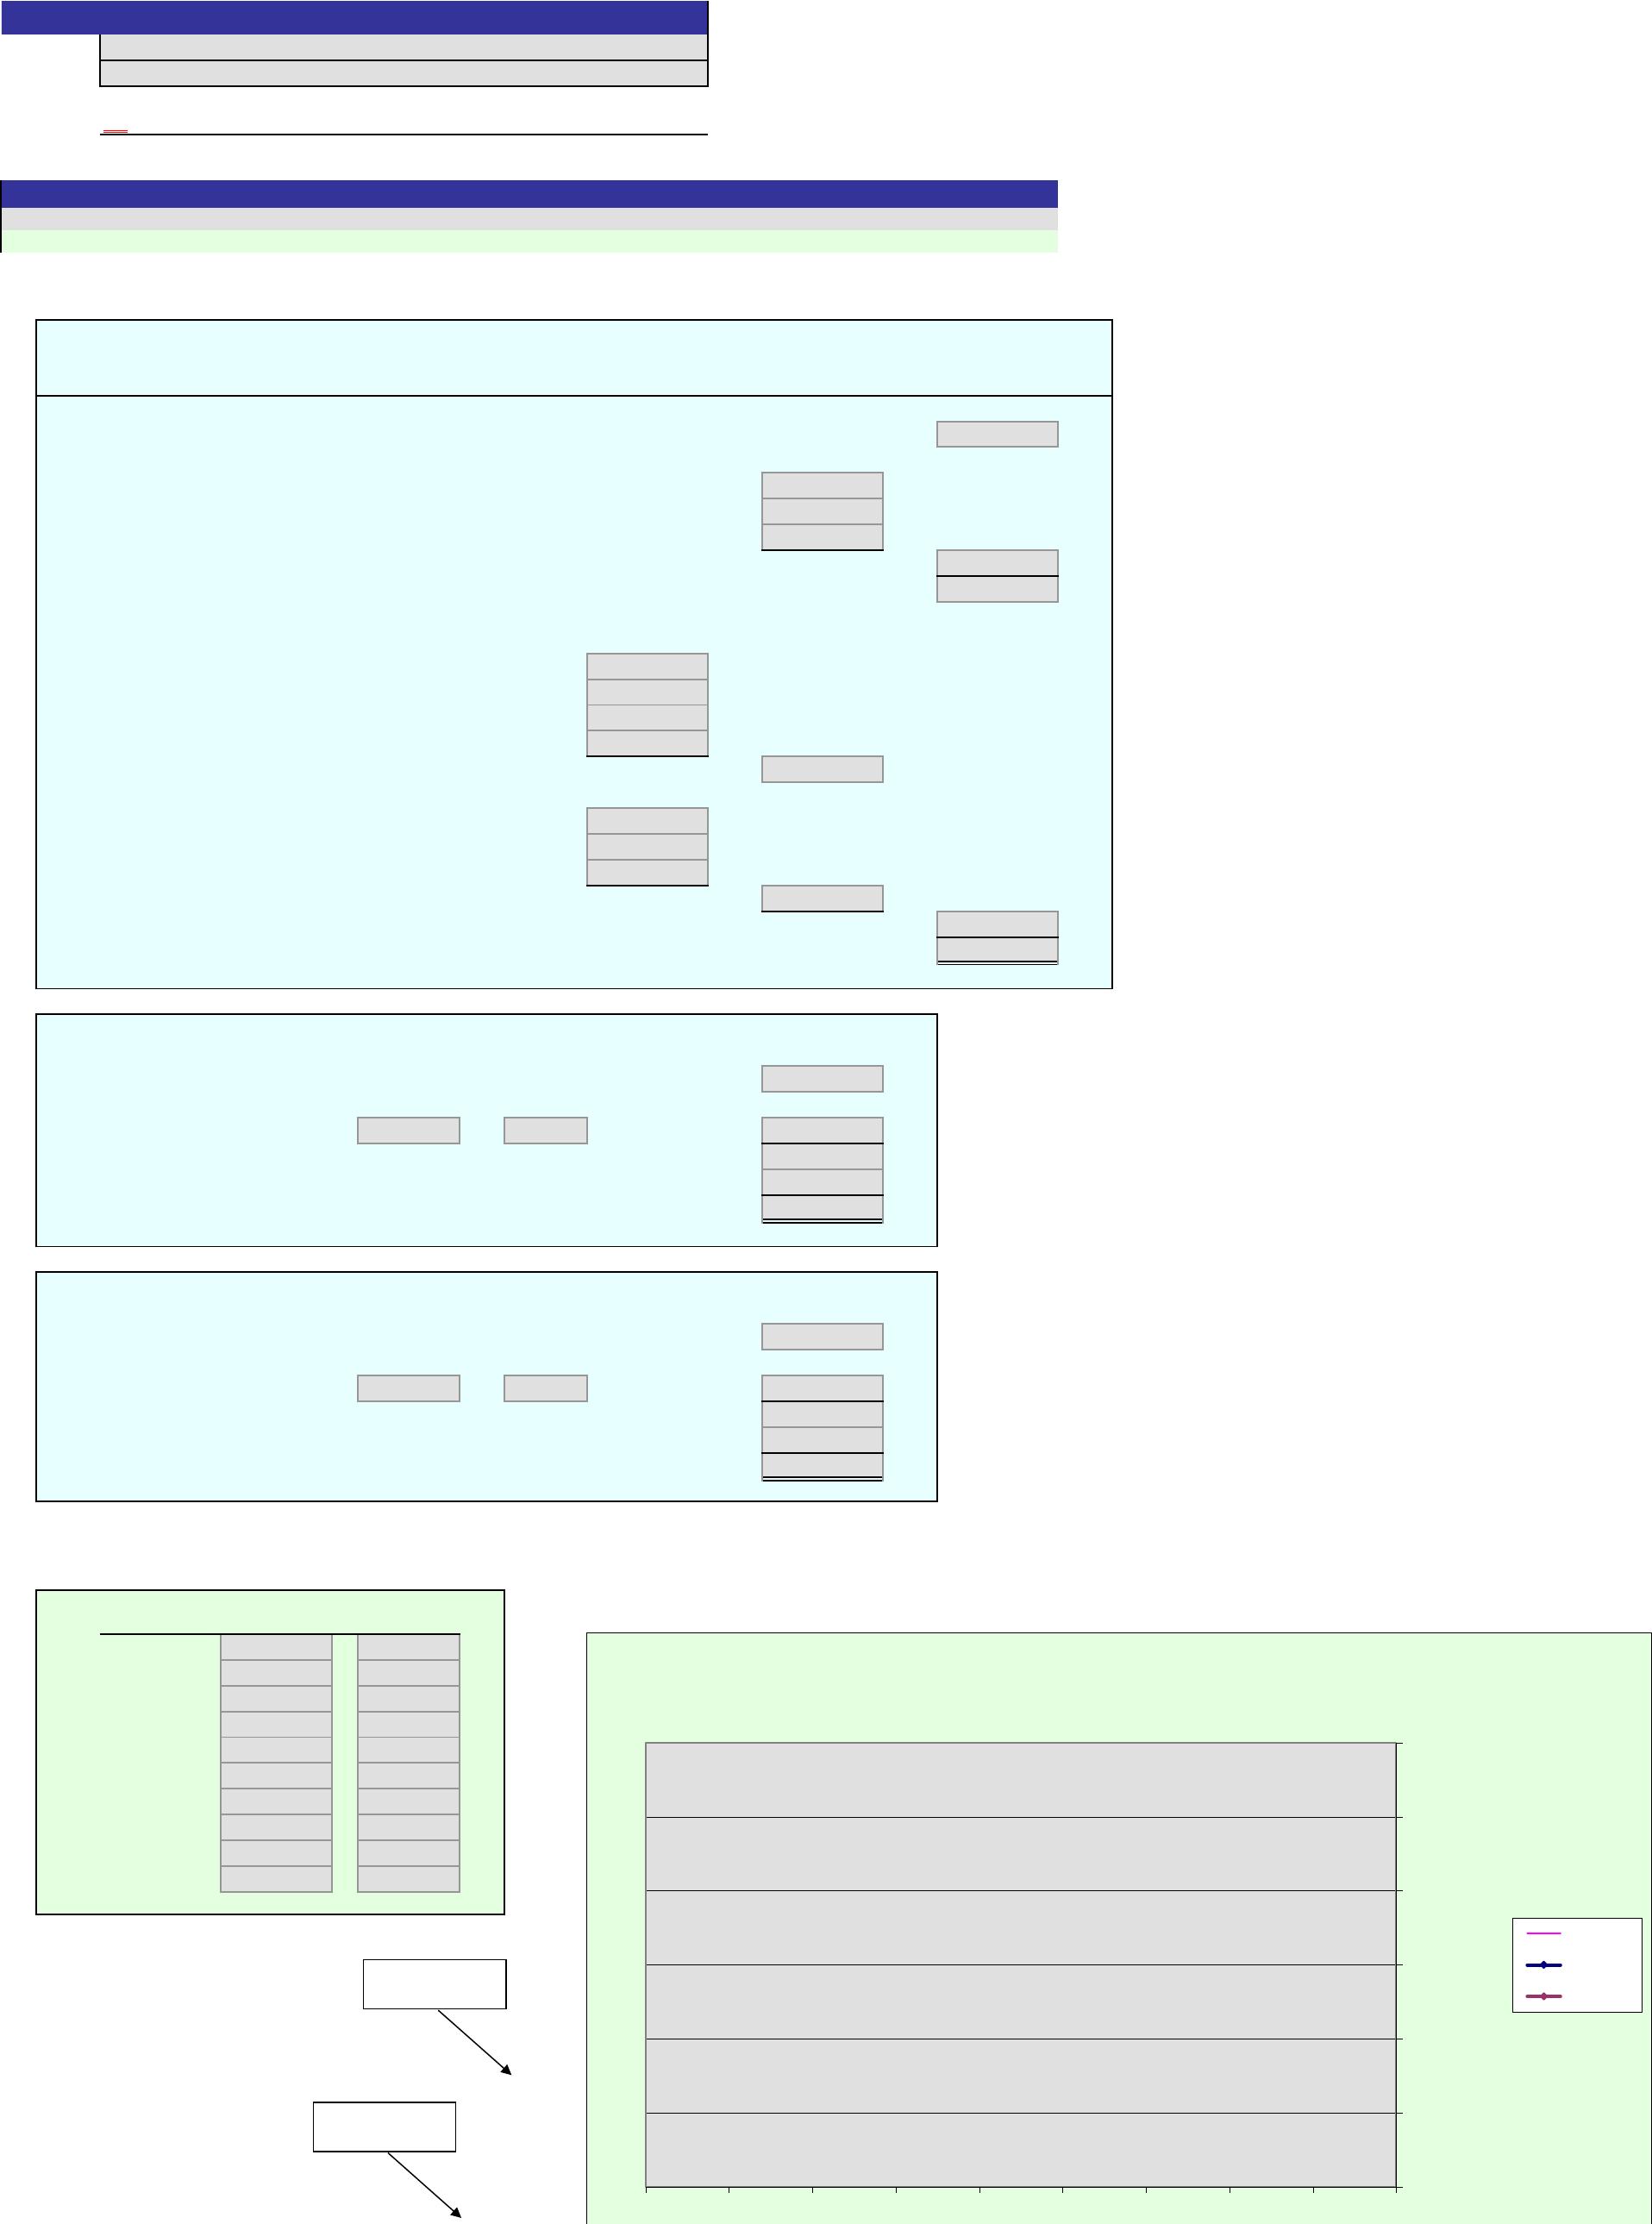
4. For each unit level of sales, enter the total sales dollars and total costs. The chart at right will be plotted as you enter the amounts.
After all points are plotted, grab and move the labels provided at the left to identify each area.
Units Sales $ Costs $
0
3,000
6,000
9,000
12,000
15,000
18,000
21,000
24,000
27,000
0%
Cells with non-gray backgrounds are protected and cannot be edited.
[Key code here]
Answers are entered in the cells with gray backgrounds.
Score:
Key Code:
Instructions
Units Unit Variable Cost
Sale Price – Unit Variable Cost
WOLSEY INDUSTRIES INC.
Estimated Income Statement
For the Year Ended December 31, 2016
Problem 19(4)-6A
Name:
Section:
$-
$0
$0
$1
$1
$1
$1
03,000 6,000 9,000 12,000 15,000 18,000 21,000 24,000 27,000
Sales and Costs
Cost-Volume-Profit Chart
Sales $
Costs $
Break-Even
Point
Operating Profit
Area
5.
Margin of safety:
Sale Price Units
Expected sales
Break-even point
Margin of safety (in dollars)
Expected sales
Margin of safety (as a percentage of sales)
6.
Operating leverage:
Unit CM $ Units
Contribution margin
Income from operations
Operating leverage
03,000 6,000 9,000 12,000 15,000 18,000 21,000 24,000 27,000
Units
An asterisk (*) will appear to the right of an incorrect entry.
1.
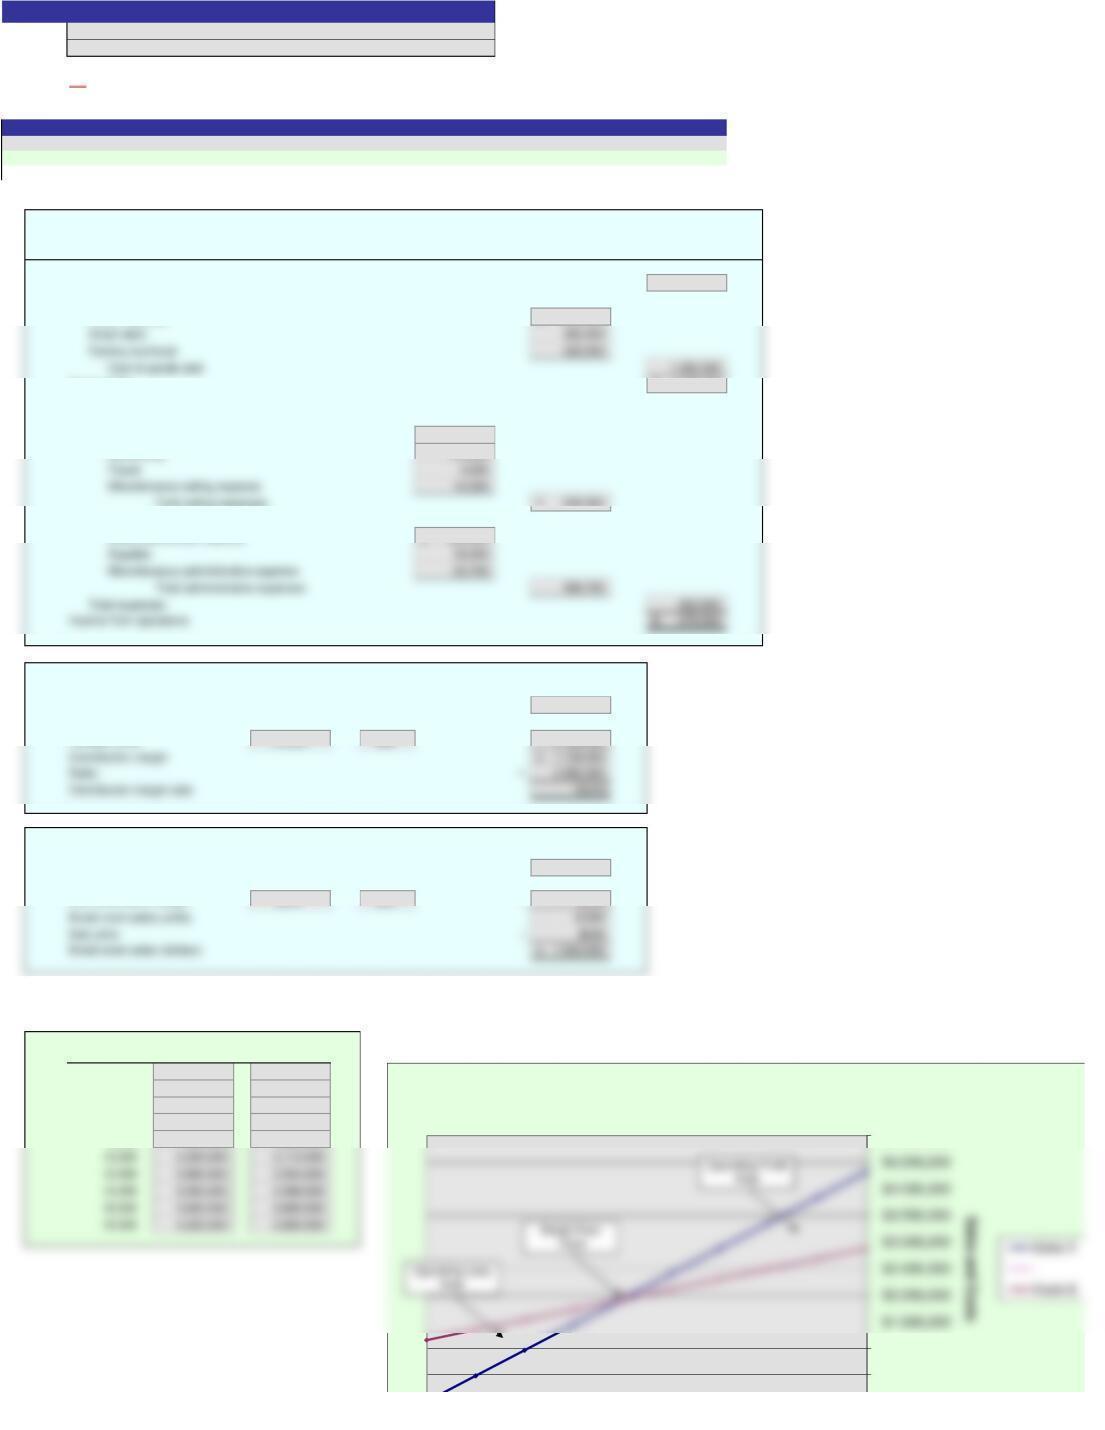
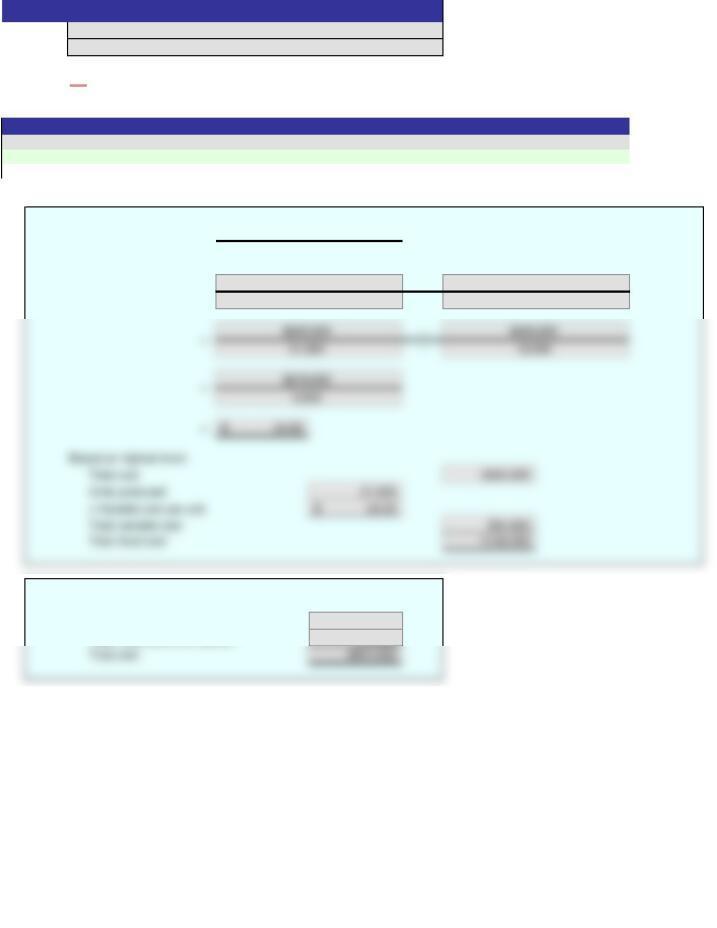
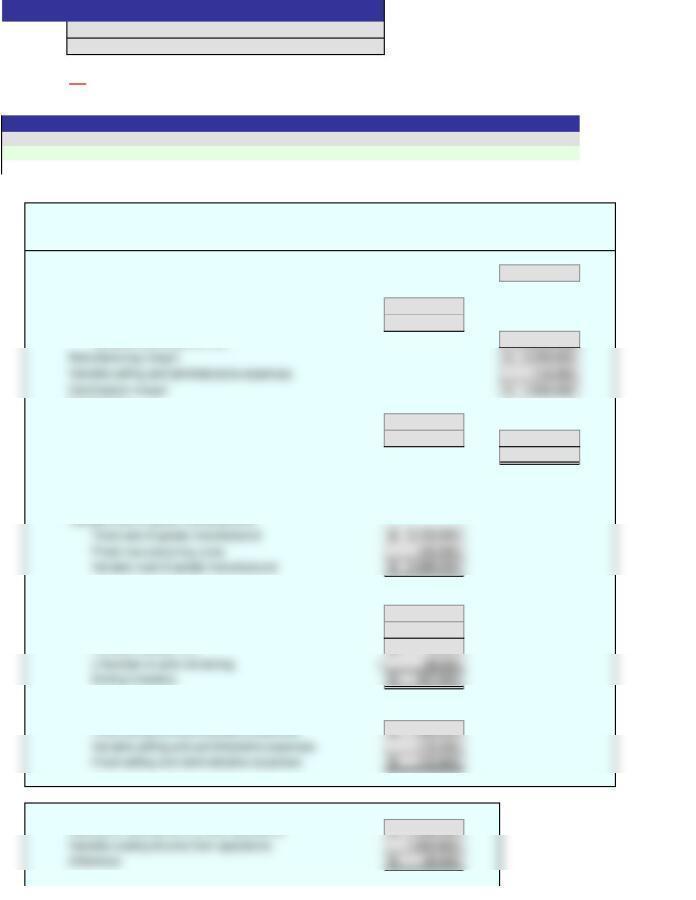
Sales 3,500,000$
Cost of goods sold:
Direct materials 1,006,250$
Direct labor 875,000
Factory overhead 637,500
Cost of goods sold
2,518,750
Gross profit 981,250$
Expenses:
3,500,000
2.
Contribution margin ratio:
Sales 3,500,000$
Variable costs 21,875 $120 2,625,000
Contribution margin 875,000$
3.
Break-even sales:
Fixed costs 525,000$
Unit contribution margin $160 $120
$40
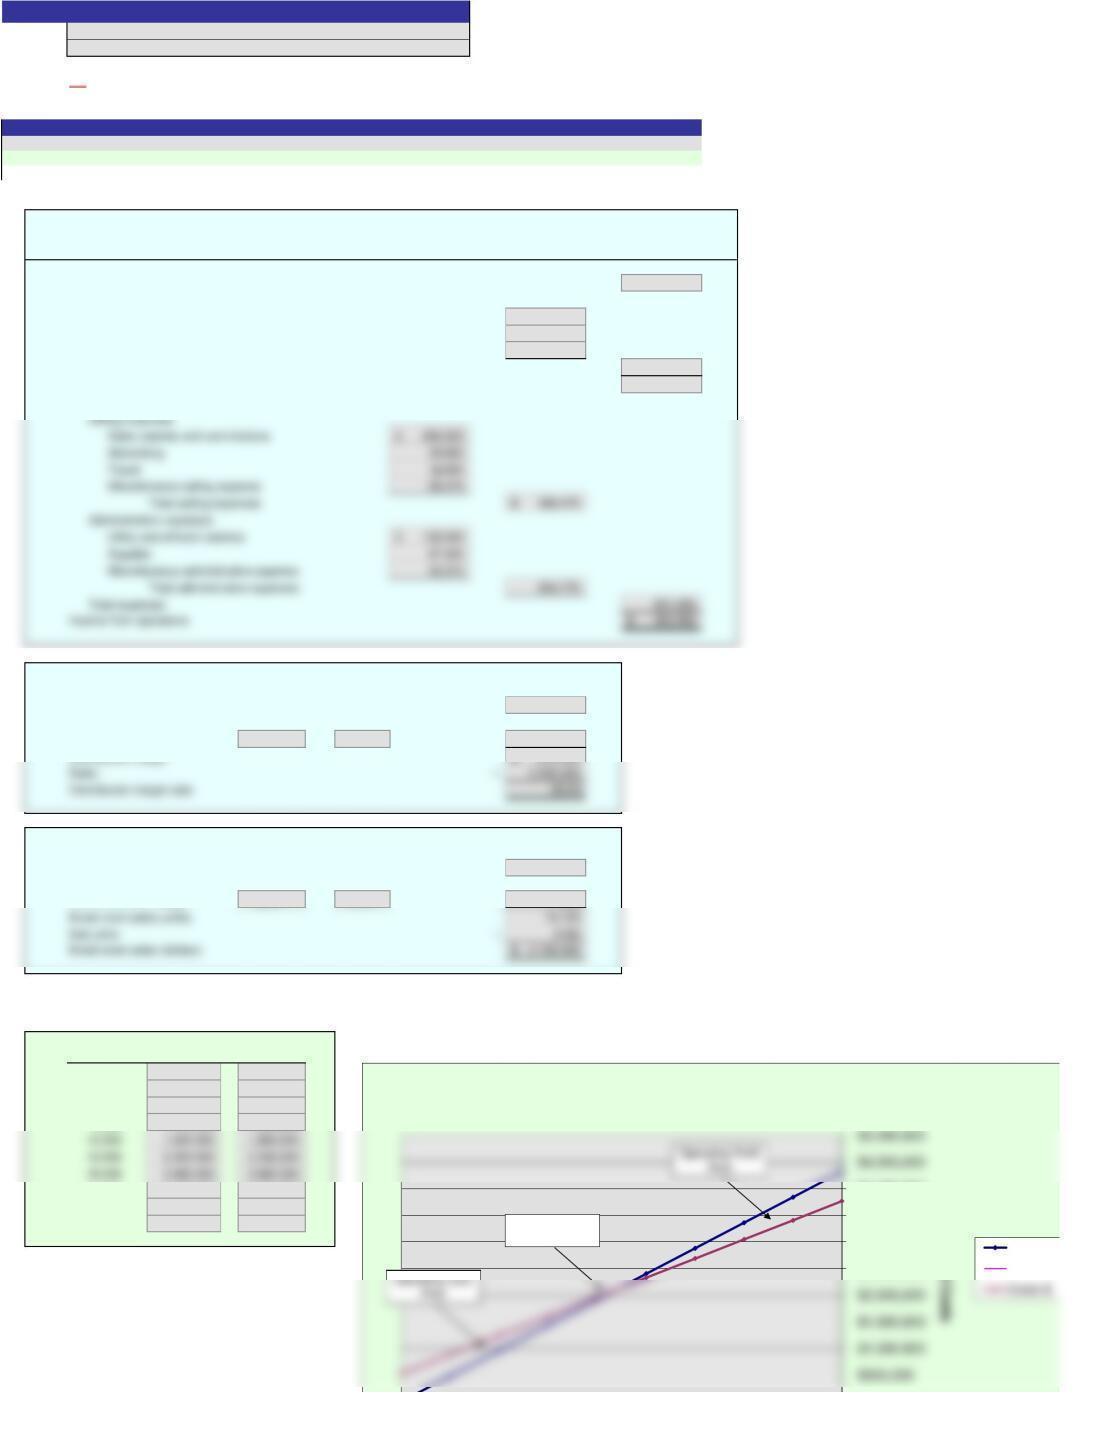
4.
For each unit level of sales, enter the total sales dollars and total costs. The chart at right will be plotted as you enter the amounts.
After all points are plotted, grab and move the labels provided at the left to identify each area.
Units Sales $ Costs $
0 –$ 525,000$
3,000 480,000 885,000
6,000 960,000 1,245,000
9,000 1,440,000 1,605,000
21,000 3,360,000 3,045,000
24,000 3,840,000 3,405,000
27,000 4,320,000 3,765,000
Problem 19(4)-6A
Solution
ON
Sale Price – Unit Variable Cost
Name:
Section:
WOLSEY INDUSTRIES INC.
Estimated Income Statement
For the Year Ended December 31, 2016
Cells with non-gray backgrounds are protected and cannot be edited.
Score:
Instructions
Answers are entered in the cells with gray backgrounds.
Units Unit Variable Cost
$-
$2,500,000
$3,000,000
$3,500,000
$4,000,000
Sales and Costs
Cost-Volume-Profit Chart
Sales $
Break-Even
Point
Miscellaneous administrative expense
5.
Margin of safety:
Sale Price Units
Expected sales $160 21,875 3,500,000$
Break-even point $160 13,125 2,100,000
6.
Operating leverage:
Unit CM $ Units
Contribution margin $40 21,875 875,000$
$-
Units
An asterisk (*) will appear to the right of an incorrect entry.
1.
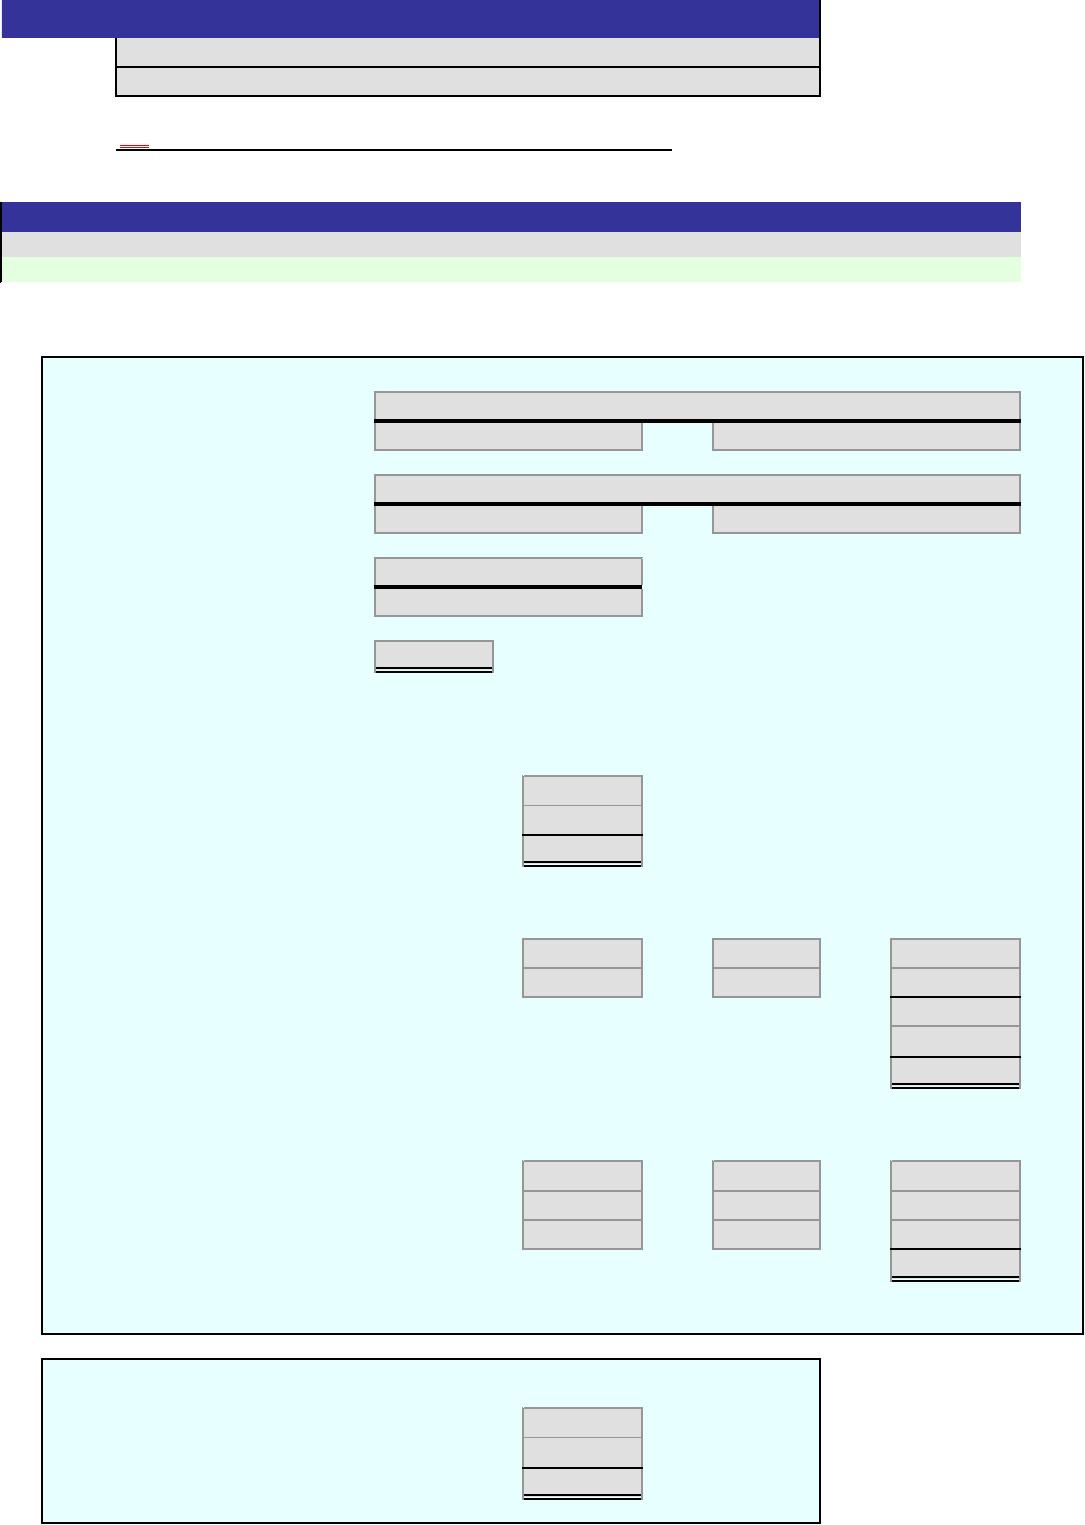
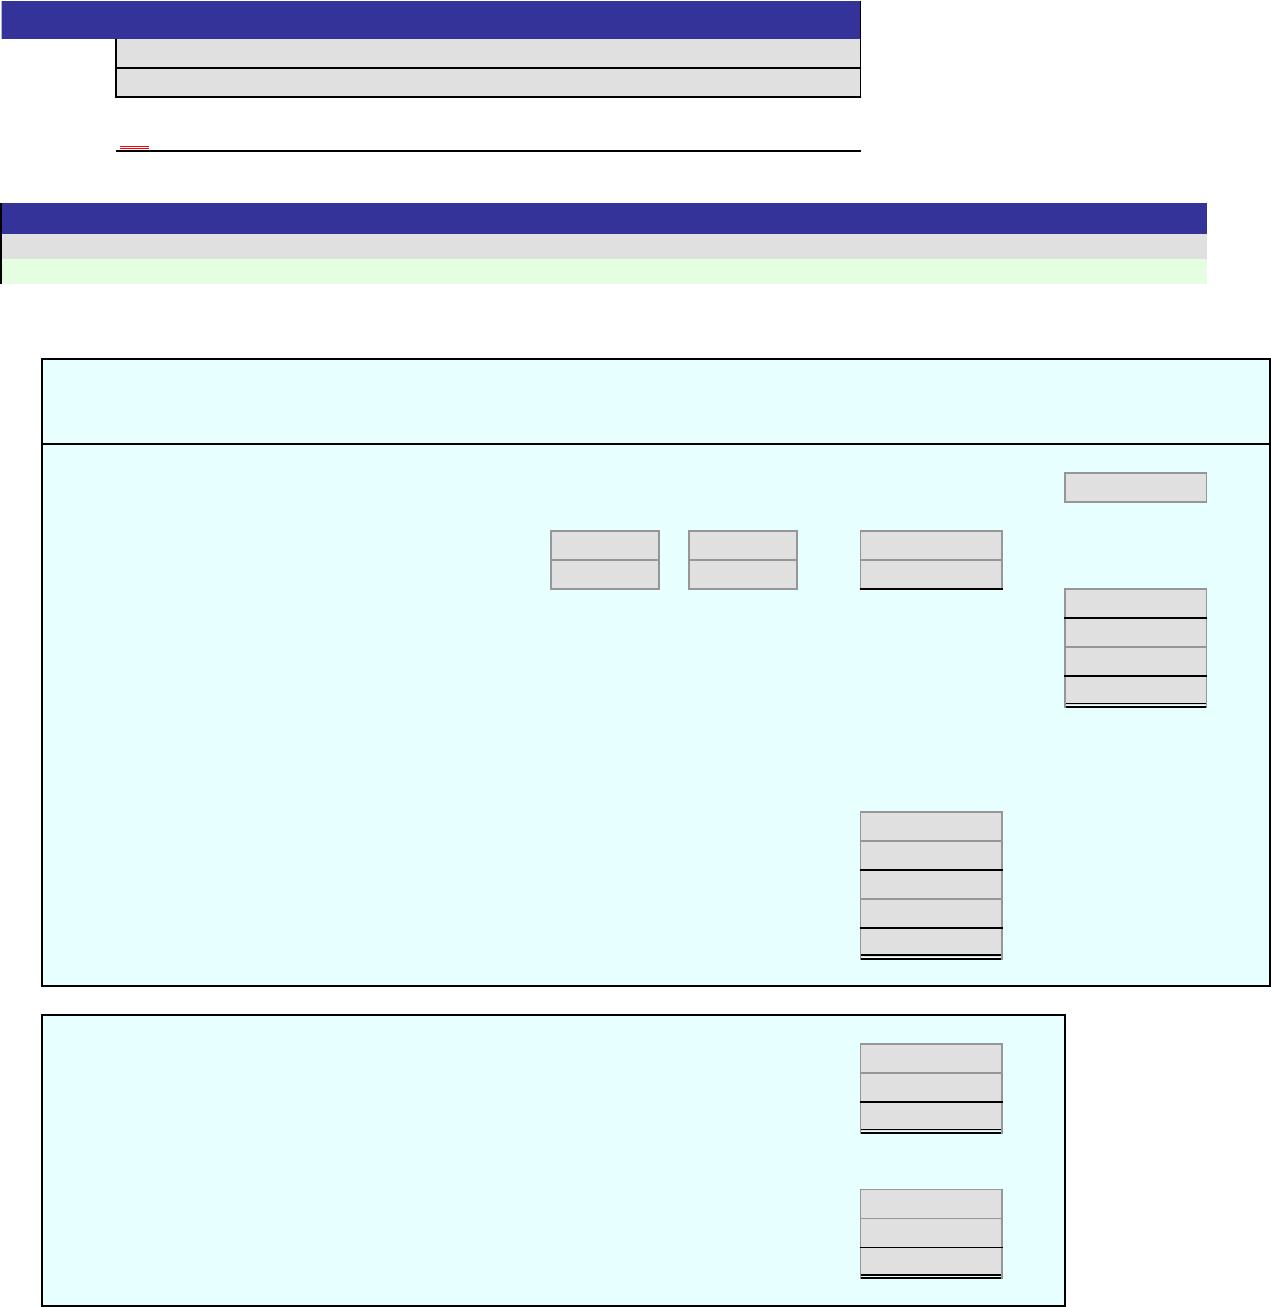
Sales
Cost of goods sold:
Direct materials
Direct labor
Factory overhead
Cost of goods sold
Gross profit
Expenses:
Selling expenses
Sales salaries and commissions
Advertising
Travel
Miscellaneous selling expense
Total selling expenses
Administrative expenses:
Office and officers’ salaries
Supplies
Miscellaneous administrative expense
Total administrative expenses
Total expenses
Income from operations
2.
Contribution margin ratio:
Sales
Variable costs
Contribution margin
Sales
Contribution margin ratio
3.
Break-even sales:
Fixed costs
Unit contribution margin
Break-even sales (units)
Sale price
Break-even sales (dollars)
4. For each unit level of sales, enter the total sales dollars and total costs. The chart at right will be plotted as you enter the amounts.
After all points are plotted, grab and move the labels provided at the left to identify each area.
Units Sales $ Costs $
0
2,000
4,000
6,000
8,000
10,000
12,000
14,000
16,000
18,000
5.
Sale Price – Unit Variable Cost
BELMAIN CO.
Estimated Income Statement
For the Year Ended December 31, 2016
0%
Cells with non-gray backgrounds are protected and cannot be edited.
[Key code here]
Answers are entered in the cells with gray backgrounds.
Score:
Problem 19(4)-6B
Name:
Section:
Units Unit Variable Cost
Key Code:
Instructions
$-
$0
$0
$1
$1
$1
$1
0 2,000 4,000 6,000 8,000 10,000 12,000 14,000 16,000 18,000
Sales and Costs
Units
Cost-Volume-Profit Chart
Sales $
Costs $
Break-Even
Point
Operating Profit
Area
Expected sales
Break-even point
Margin of safety (in dollars)
Expected sales
Margin of safety (as a percentage of sales)
6.
Operating leverage:
Unit CM $ Units
Contribution margin
Income from operations
Operating leverage
An asterisk (*) will appear to the right of an incorrect entry.
1.
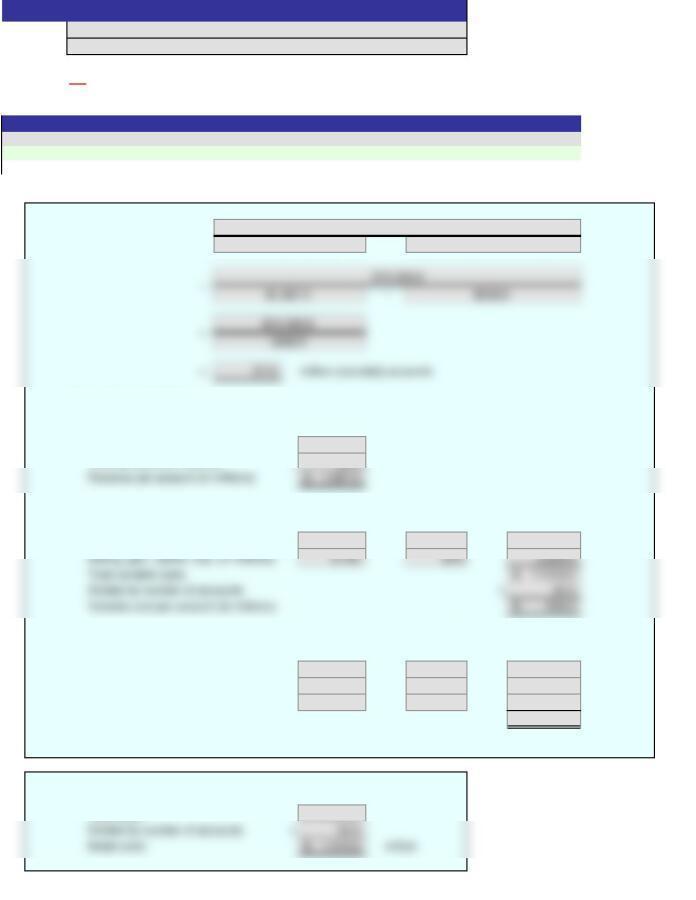
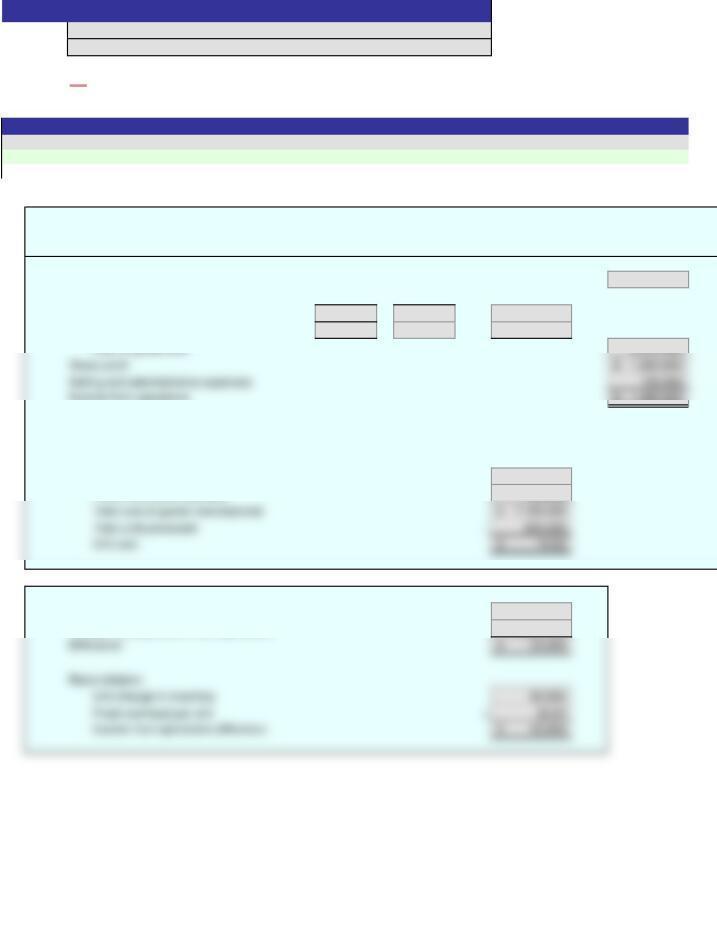
Sales 2,880,000$
Cost of goods sold:
Direct materials 600,000$
Gross profit 1,498,000$
Expenses:
Selling expenses
Sales salaries and commissions 388,000$
Advertising 116,000
Total selling expenses 522,300$
Administrative expenses:
Office and officers’ salaries
325,000$
2,880,000
2.
Contribution margin ratio:
Sales 2,880,000$
Variable costs 12,000 $96 1,152,000
3.
Break-even sales:
Fixed costs 1,152,000$
Unit contribution margin $240 $96
$144
4. For each unit level of sales, enter the total sales dollars and total costs. The chart at right will be plotted as you enter the amounts.
After all points are plotted, grab and move the labels provided at the left to identify each area.
Units Sales $ Costs $
0 –$ 1,152,000$
2,000 480,000 1,344,000
4,000 960,000 1,536,000
6,000 1,440,000 1,728,000
8,000 1,920,000 1,920,000
Units Unit Variable Cost
Problem 19(4)-6B
Solution
ON
Key Code:
Sale Price – Unit Variable Cost
Name:
Section:
BELMAIN CO.
Estimated Income Statement
For the Year Ended December 31, 2016
Cells with non-gray backgrounds are protected and cannot be edited.
Score:
Instructions
Answers are entered in the cells with gray backgrounds.
$-
$500,000
$1,000,000
$5,000,000
Cost-Volume-Profit Chart
5.
Margin of safety:
Sale Price Units
Expected sales $240 12,000 2,880,000$
Break-even point $240 8,000 1,920,000
6.
Operating leverage:
Unit CM $ Units
Contribution margin $144 12,000 1,728,000$
$-
Units
An asterisk (*) will appear to the right of an incorrect entry.
a.
–
–
–
–
=
Based on highest level:
Total cost
Units produced
x Variable cost per unit
Total variable cost
Total fixed cost
b.
Based on 12,000 units:
Total variable cost
Total fixed cost (from above)
Total cost
0%
Score:
Key Code:
Cells with non-gray backgrounds are protected and cannot be edited.
[Key code here]
Answers are entered in the cells with gray backgrounds.
Variable Cost per Unit
=
Difference in Total Costs
Difference in Production
Instructions
Exercise 19(4)-7
Name:
Section:
=
=
=
An asterisk (*) will appear to the right of an incorrect entry.
a.
–
–
b.
Based on 12,000 units:
Total variable cost $408,000
Total fixed cost (from above) 136,000
Variable Cost per Unit
=
Difference in Total Costs
=
Exercise 19(4)-7
Name:
Solution
Section:
Cells with non-gray backgrounds are protected and cannot be edited.
Score:
Instructions
Answers are entered in the cells with gray backgrounds.
ON
Units Produced at Low Point
Cost at Low Point
Difference in Production
Cost at High Point
Units Produced at High Point
–
=
=
An asterisk (*) will appear to the right of an incorrect entry.
a.
–
–
= million (rounded) accounts
Supporting calculations:
Revenue per account (in millions):
Total revenue (in millions)
Total accounts (in millions)
Revenue per account (in millions)
Variable cost per account (in millions): Variable
Full Amount Percentage
Cost of revenue (in millions)
Selling, gen., admin. exp. (in millions)
Total variable costs
Divided by number of accounts
Variable cost per account (in millions)
Total fixed costs (in millions): Fixed
Full Amount Percentage
Cost of revenue (in millions)
Selling, gen., admin. exp. (in millions)
Depreciation
Total fixed costs (in millions)
b.
Break-even (in $ revenue, in millions):
Total costs
Divided by number of accounts
Break-even million
[Key code here]
=
=
Instructions
Exercise 19(4)-16
Name:
Section:
0%
Score:
Key Code:
Answers are entered in the cells with gray backgrounds.
=
Break-Even (in accounts)
Cells with non-gray backgrounds are protected and cannot be edited.
An asterisk (*) will appear to the right of an incorrect entry.
a.
–
Supporting calculations:
Revenue per account (in millions):
Total revenue (in millions) 35,345$
Total accounts (in millions)
32.5
Variable cost per account (in millions): Variable
Full Amount Percentage
Cost of revenue (in millions) 20,841$ 70% 14,588.7$
Selling, gen., admin. exp. (in millions)
Total fixed costs (in millions): Fixed
Full Amount Percentage
Cost of revenue (in millions) 20,841$ 30% 6,252.3$
Selling, gen., admin. exp. (in millions)
32.5
9,765 70% 6,835.5
Depreciation 2,239 100% 2,239.0
Total fixed costs (in millions) 15,326.8$
b.
Break-even (in $ revenue, in millions):
Total costs 32,845.0$
Exercise 19(4)-16
Name:
Solution
Section:
=
Revenue per Account
Total Fixed Costs
Variable Cost per Account
Break-Even (in accounts)
Answers are entered in the cells with gray backgrounds.
ON
Cells with non-gray backgrounds are protected and cannot be edited.
Score:
Instructions
=
=
An asterisk (*) will appear to the right of an incorrect entry.
a.
Sales (96,000 units)
Variable cost of goods sold:
Variable cost of goods manufactured
Less ending inventory (24,000 units)
Variable cost of goods sold
Manufacturing margin
Variable selling and administrative expenses
Contribution margin
Fixed costs:
Fixed manufacturing costs
Fixed selling and administrative expenses
Income from operations
Supporting calculations:
Variable cost of goods manufactured:
Total cost of goods manufactured
Fixed manufacturing costs
Variable cost of goods manufactured
Ending inventory:
Variable cost of goods manufactured
Units manufactured
Variable cost per unit
x Number of units remaining
Ending inventory
Fixed selling and administrative expenses:
Total selling and administrative expenses
Variable selling and administrative expenses
Fixed selling and administrative expenses
b.
Absorption costing income from operations
Variable costing income from operations
Difference
Cells with non-gray backgrounds are protected and cannot be edited.
[Key code here]
Answers are entered in the cells with gray backgrounds.
Score:
Key Code:
Instructions
RHYS COMPANY
Income Statement – Variable Costing
For the Month Ended July 31, 2016
Exercise 19(4)-27
Name:
Section:
0%

Reconciliation:
Unit change in inventory
Fixed overhead per unit
Income from operations difference
An asterisk (*) will appear to the right of an incorrect entry.
a.
Sales (96,000 units) 4,440,000$
Variable cost of goods sold:
Variable cost of goods manufactured 2,988,000$
Less ending inventory (24,000 units) 597,600
Variable cost of goods sold 2,390,400
Fixed costs:
Fixed manufacturing costs 132,000$
Fixed selling and administrative expenses 172,800 304,800
Income from operations 1,629,600$
Supporting calculations:
Variable cost of goods manufactured:
Ending inventory:
Variable cost of goods manufactured 2,988,000$
Units manufactured 120,000
Variable cost per unit 24.90$
Fixed selling and administrative expenses:
Total selling and administrative expenses 288,000$
b.
Absorption costing income from operations 1,656,000$
Exercise 19(4)-27
Name:
Solution
Section:
RHYS COMPANY
Income Statement – Variable Costing
For the Month Ended July 31, 2016
ON
Cells with non-gray backgrounds are protected and cannot be edited.
Score:
Instructions
Answers are entered in the cells with gray backgrounds.

Reconciliation:
Unit change in inventory 24,000
An asterisk (*) will appear to the right of an incorrect entry.
a.
Sales (420,000 units)
Cost of goods sold: Unit Cost ×Units
Cost of goods manufactured
Less ending inventory
Cost of goods sold
Gross profit
Selling and administrative expenses
Income from operations
Supporting calculation:
Unit cost:
Variable cost of goods manufactured
Fixed manufacturing costs
Total cost of goods manufactured
Total units produced
Unit cost
b.
Absorption costing income from operations
Variable costing income from operations
Difference
Reconciliation:
Unit change in inventory
Fixed overhead per unit
Income from operations difference
Cells with non-gray backgrounds are protected and cannot be edited.
[Key code here]
Answers are entered in the cells with gray backgrounds.
Score:
Key Code:
Instructions
TUDOR MANUFACTURING CO.
Income Statement – Absorption Costing
For the Month Ended June 30, 2016
Exercise 19(4)-28
Name:
Section:
0%
An asterisk (*) will appear to the right of an incorrect entry.
a.
Sales (420,000 units) 7,450,000$
Cost of goods sold: Unit Cost ×Units
Cost of goods manufactured $14.32 500,000 7,160,000$
Less ending inventory $14.32 80,000 1,145,600
Cost of goods sold 6,014,400
Income from operations 1,280,600$
Supporting calculation:
Unit cost:
Variable cost of goods manufactured 7,000,000$
Fixed manufacturing costs 160,000
b.
Absorption costing income from operations 1,280,600$
Variable costing income from operations 1,255,000
Exercise 19(4)-28
Name:
Solution
Section:
Income Statement – Absorption Costing
For the Month Ended June 30, 2016
ON
Cells with non-gray backgrounds are protected and cannot be edited.
Score:
Instructions
Answers are entered in the cells with gray backgrounds.
TUDOR MANUFACTURING CO.