Wild and Shaw, Financial & Managerial Accounting, 8e Solutions Manual: Chapter 18
1096
Problem 18-2B (20 minutes)
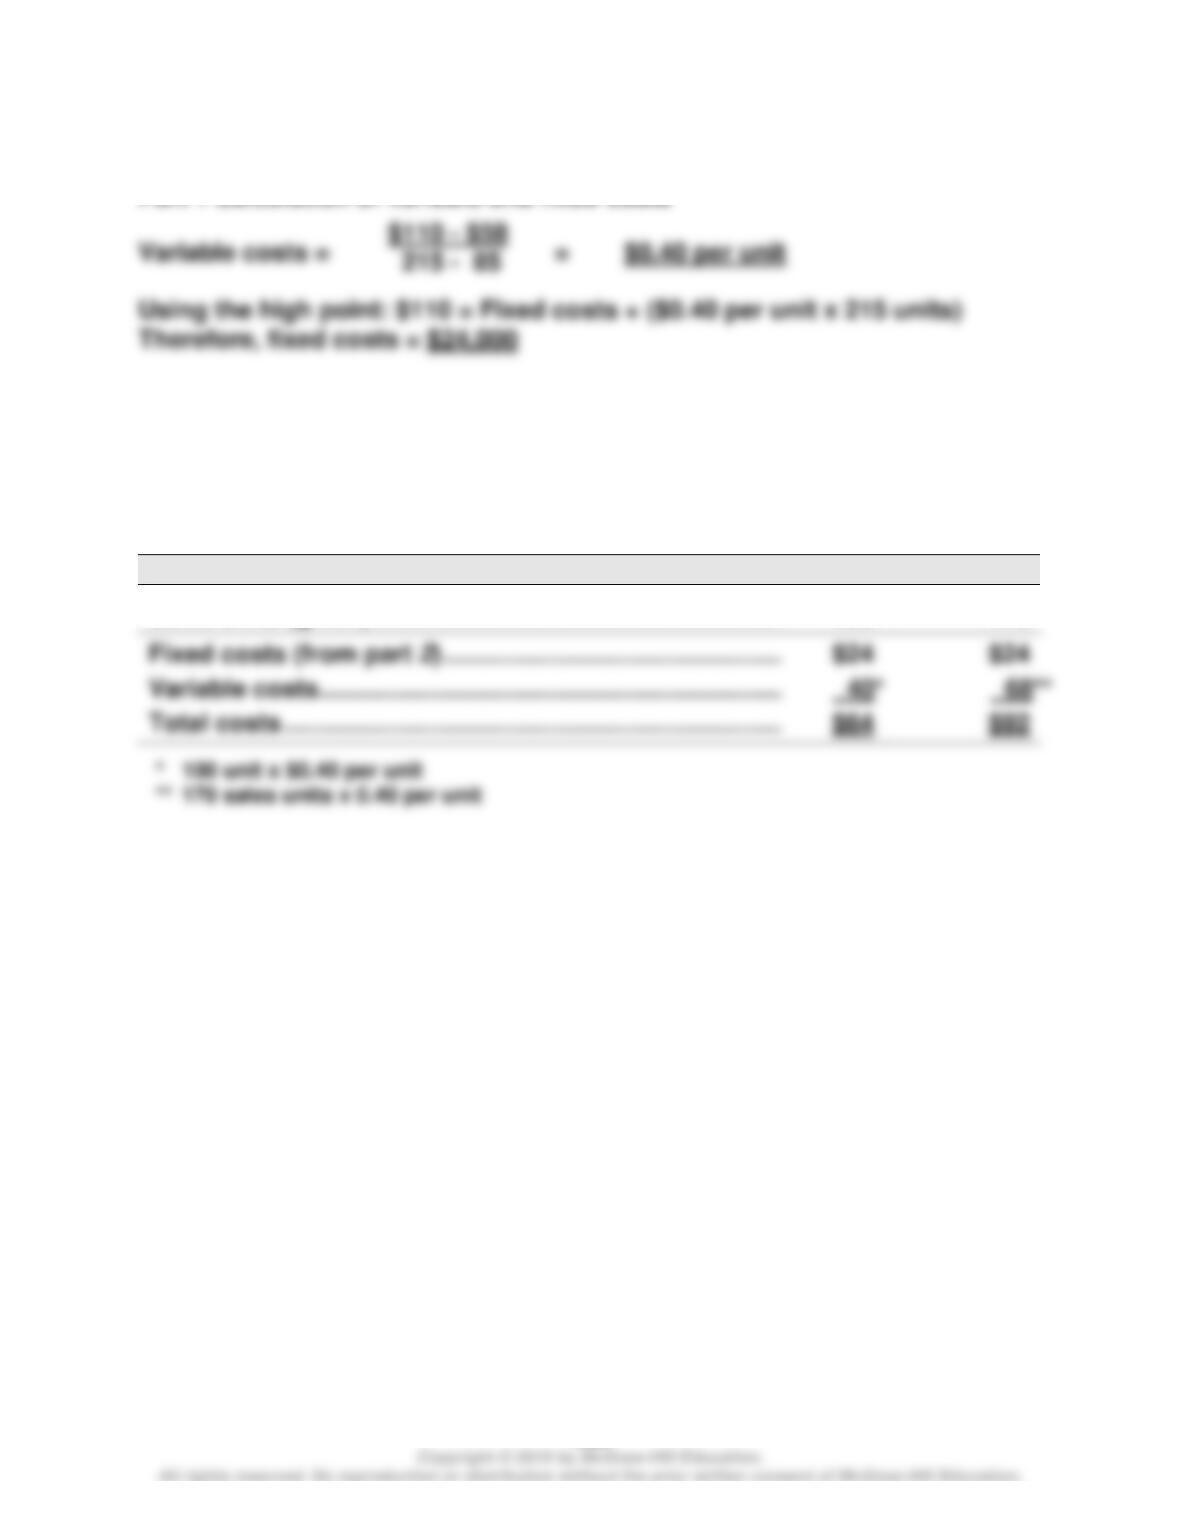
Part 1 Calculation of variable and fixed costs
Part 2
The estimates in Part 1 can be used to predict the total costs that will be
incurred at sales levels of 100 and 170 (both in thousands).
(‘000s)
Predictions
Sales units (given) ……………………………………………………….
100
170
Wild and Shaw, Financial & Managerial Accounting, 8e Solutions Manual: Chapter 18
1097
Problem 18-3B (40 minutes)
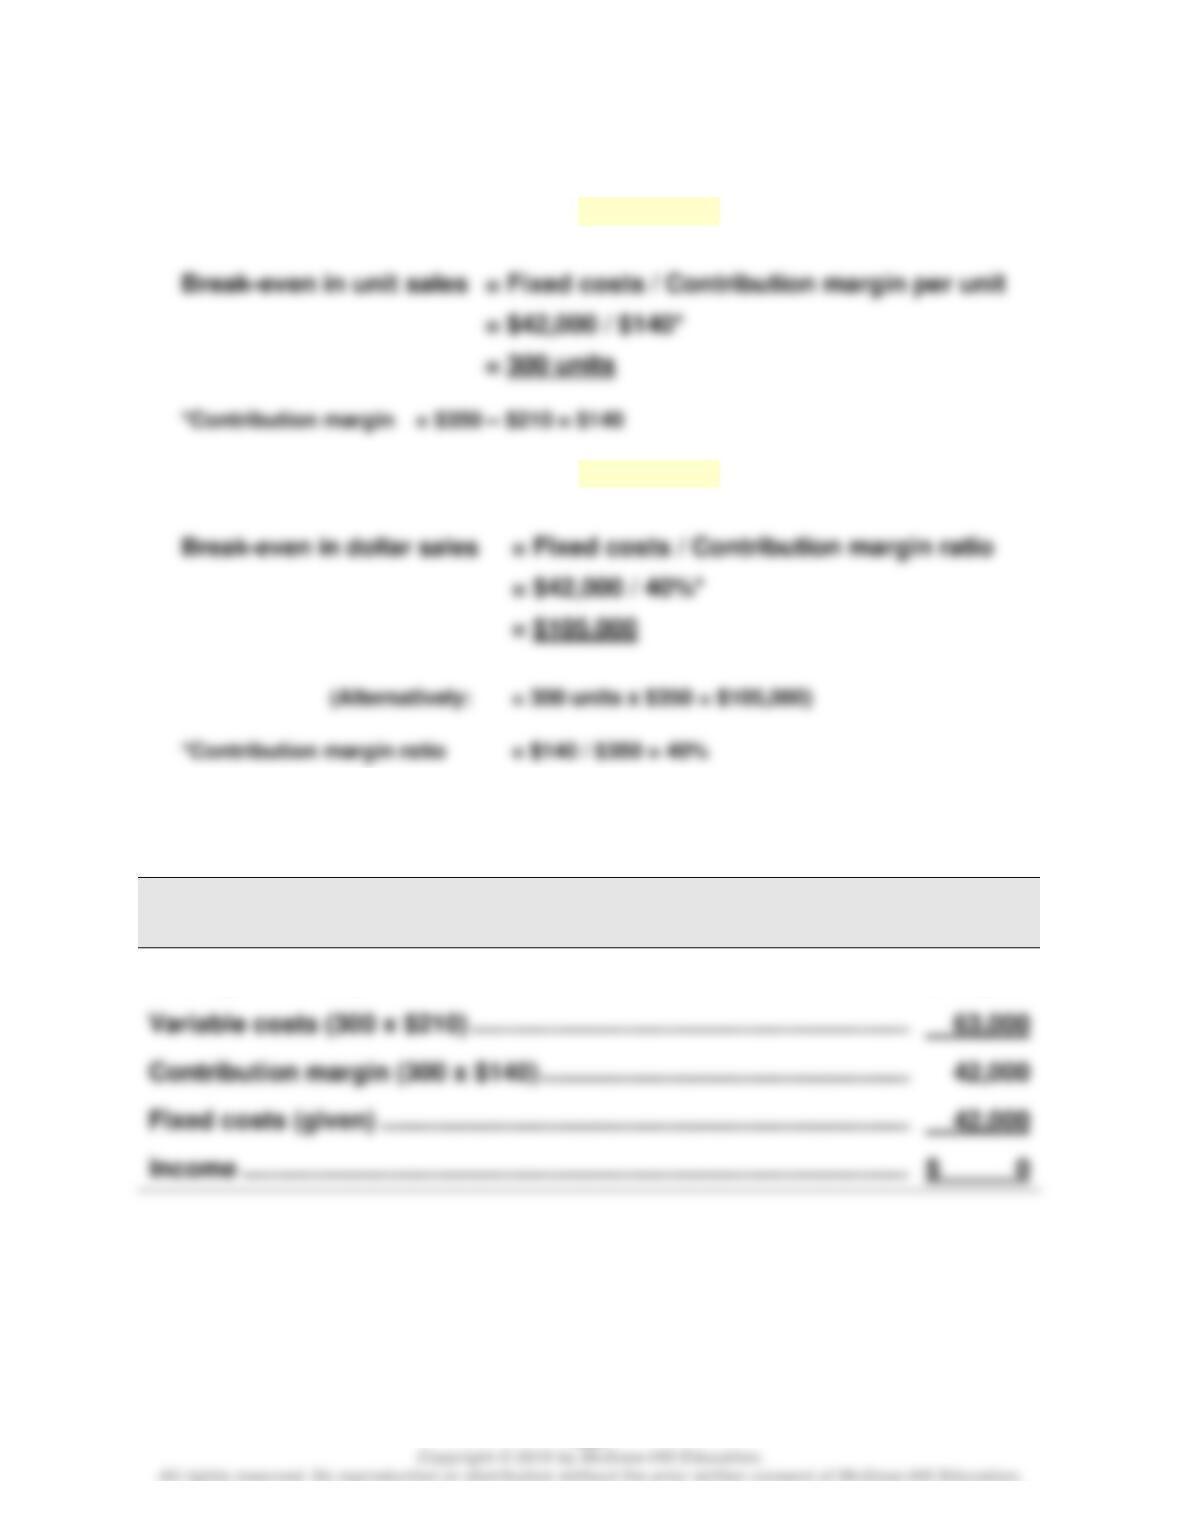
Part 1
(a) Instructor note: Use the equation in Exhibit 18.11
(b) Instructor note: Use the equation in Exhibit 18.12
Part 2
HIP-HOP CO.
Contribution Margin Income Statement (at Break-Even) — Keyboards
Sales (300 x $350) ……………………………………………………………………..
$105,000
Variable costs (300 x $210) ……………………………………………………….
Fixed costs (given) ……………………………………………………………………
1098
Problem 18-3B (Continued)
Part 3
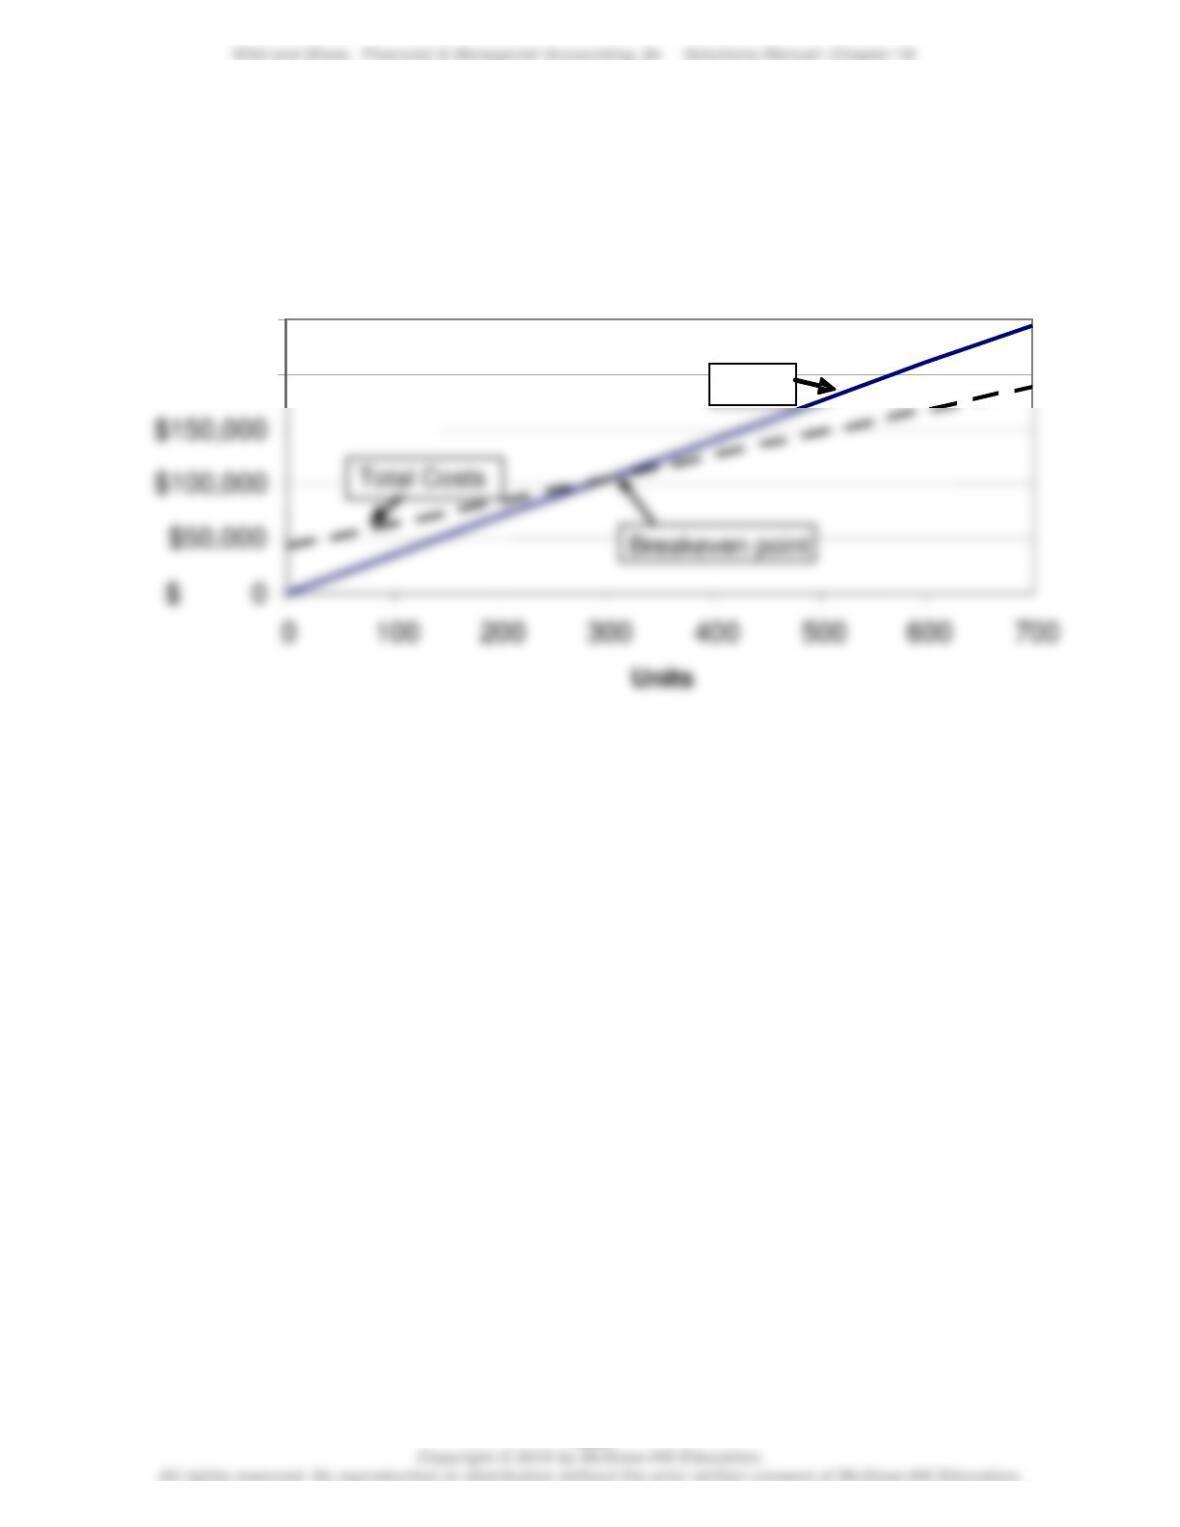
Hip-Hop Company CVP chart
$150,000
$200,000
$250,000
Sales
Wild and Shaw, Financial & Managerial Accounting, 8e Solutions Manual: Chapter 18
1099
Problem 18-4B (75 minutes)
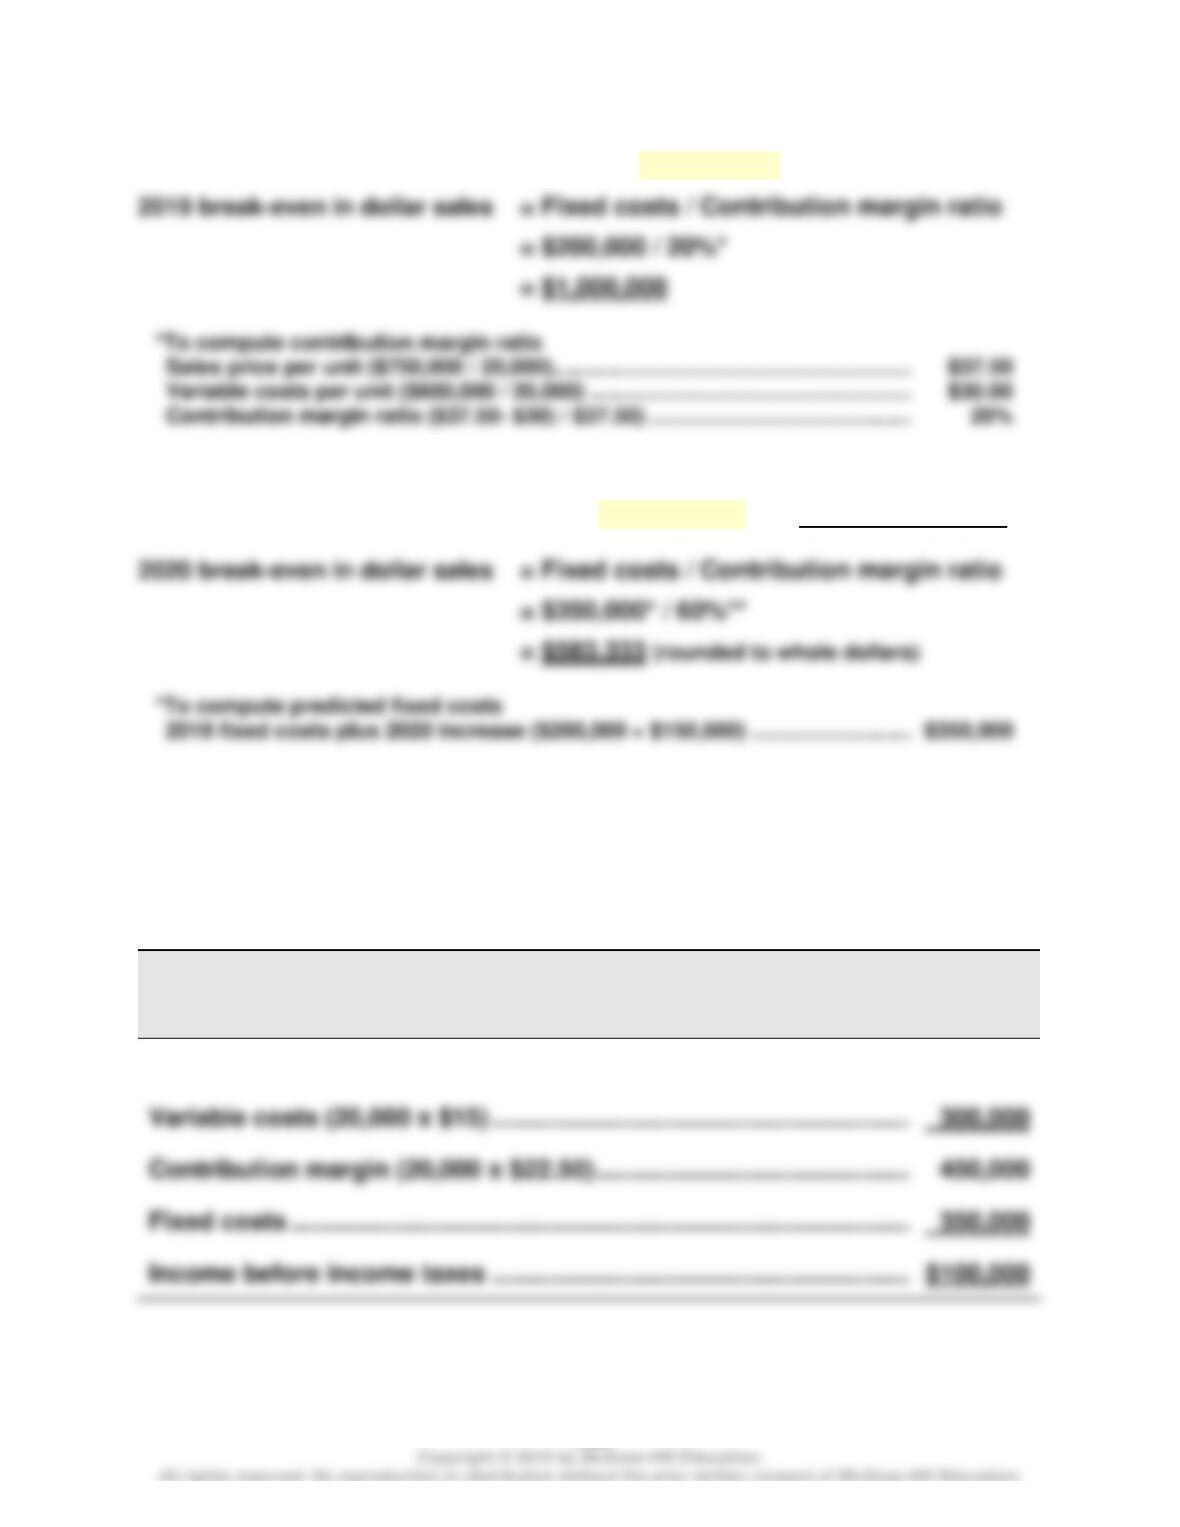
Part 1 Instructor note: Use the equation in Exhibit 18.12
Sales price per unit ($750,000 / 20,000)……………………………………………………….
$37.50
Variable costs per unit ($600,000 / 20,000) ……………………………………………………..
$30.00
Contribution margin ratio ($37.50- $30) / $37.50) …………………………………………….
20%
Part 2 Instructor note: Use equation in Exhibit 18.12 with predicted numbers
**To compute predicted contribution margin ratio
Predicted sales price per unit ($750,000 / 20,000) ……………………………………………
$37.50
Predicted variable costs per unit [($600,000 x 50%)/ 20,000) …………………………..
$15.00
Predicted contribution margin ratio ($37.50- $15) / $37.50) …………………………..
60%
Part 3
RIVERA COMPANY
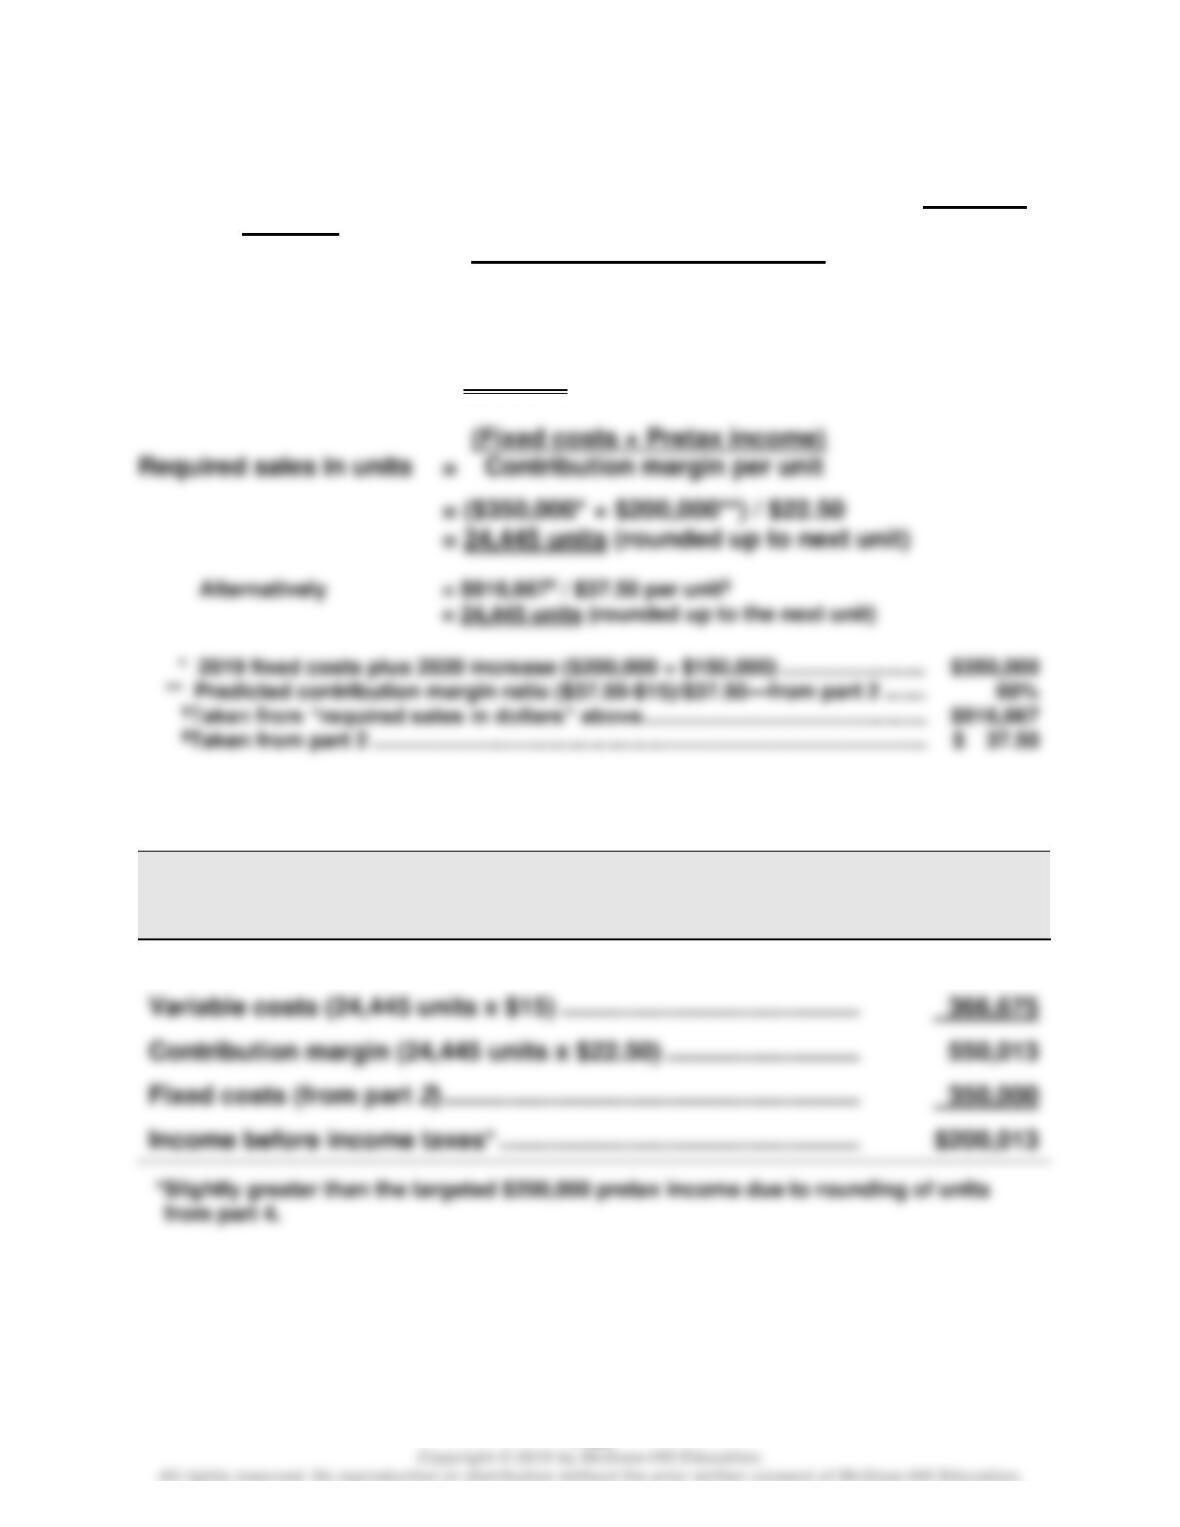
Forecasted Contribution Margin Income Statement
For Year Ended December 31, 2020
Sales (20,000 x $37.50) …………………………………………………………………
$750,000
Fixed costs ………………………………………………………………………………….
Wild and Shaw, Financial & Managerial Accounting, 8e Solutions Manual: Chapter 18
1100
Problem 18-4B (Continued)
Part 4 Instructor note: Use equations in Exhibit 18.22 and 18.23 with predicted
numbers
(Fixed costs + Pretax income)
Required sales in dollars = Contribution margin ratio
= ($350,000* + $200,000) / 60%**
= $550,000 / 60%
= $916,667 (rounded to the next dollar)
Part 5
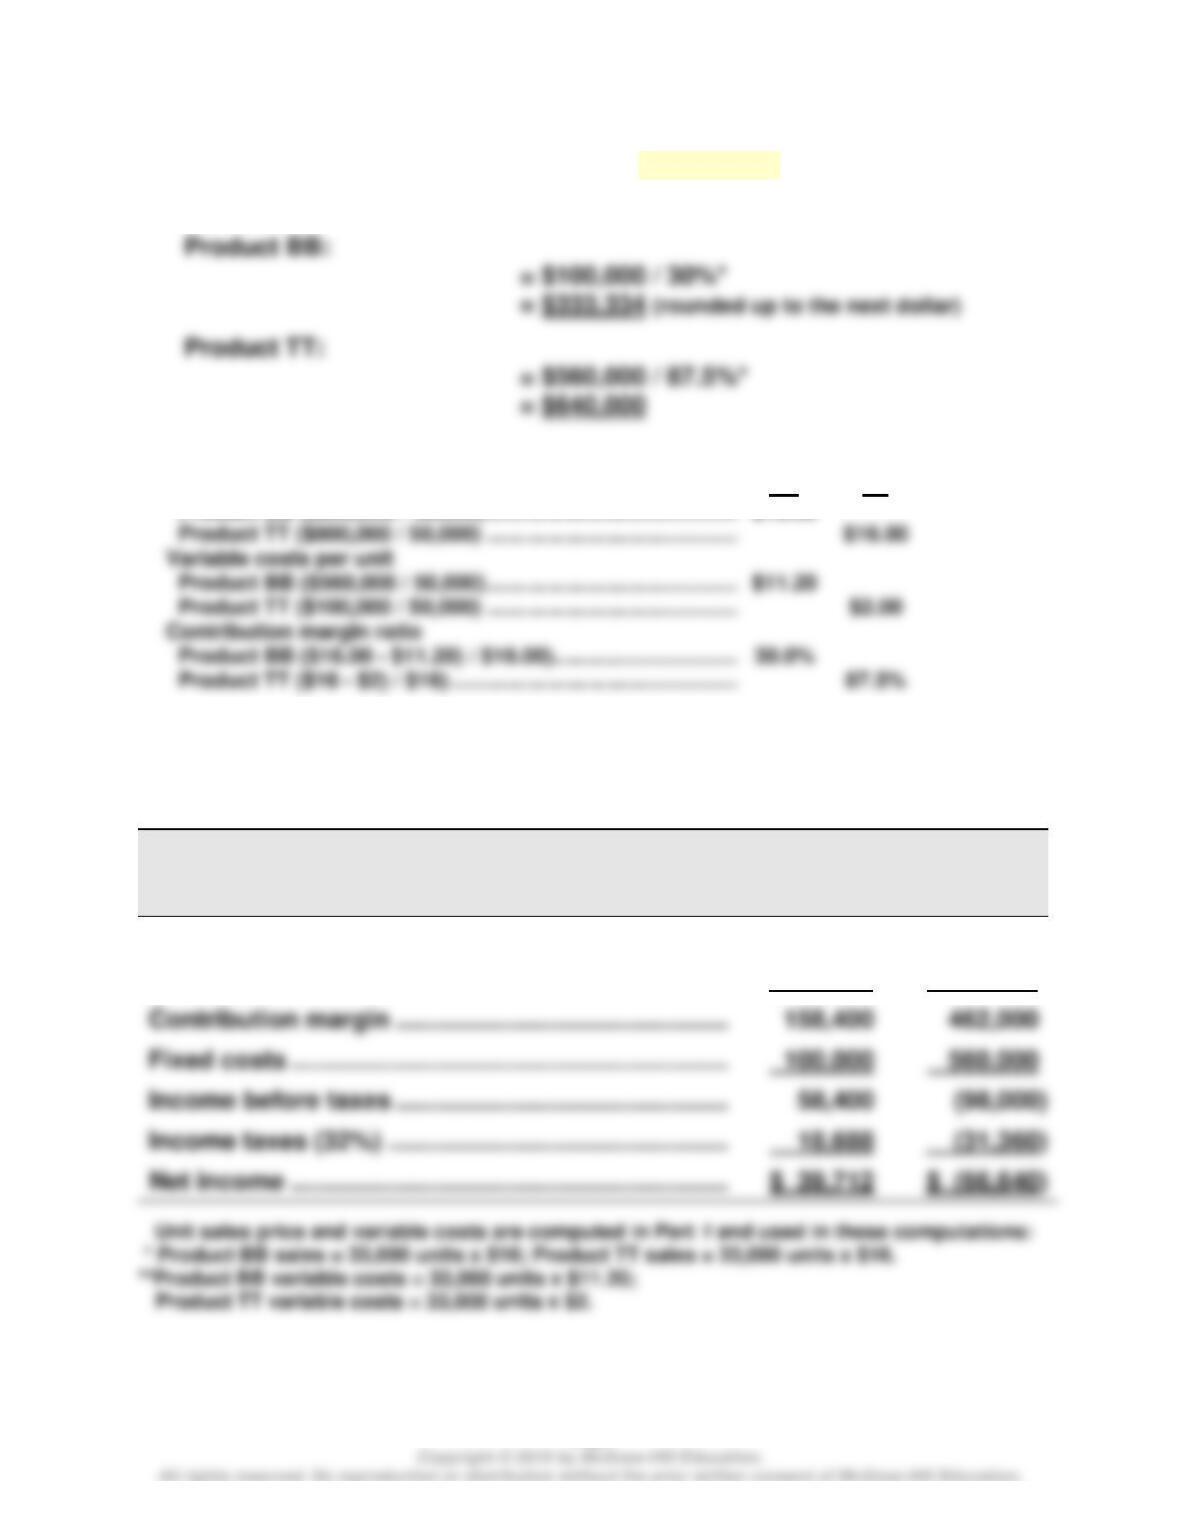
RIVERA COMPANY
Forecasted Contribution Margin Income Statement
For Year Ended December 31, 2020
Sales (24,445 units x $37.50) ……………………………………………….
$916,688
Fixed costs (from part 2) ……………………………………………………..
Income before income taxes* ………………………………………………
$200,013
Wild and Shaw, Financial & Managerial Accounting, 8e Solutions Manual: Chapter 18
1101
Problem 18-5B (65 minutes)
Part 1 Instructor note: Use the equation in Exhibit 18.12
Break-even in dollar sales = Fixed costs / Contribution margin ratio
*To compute contribution margin ratio
$11.20
Sales price per unit
Product BB ($800,000 / 50,000) ……………………………………………………….
BB
$16.00
TT
Part 2
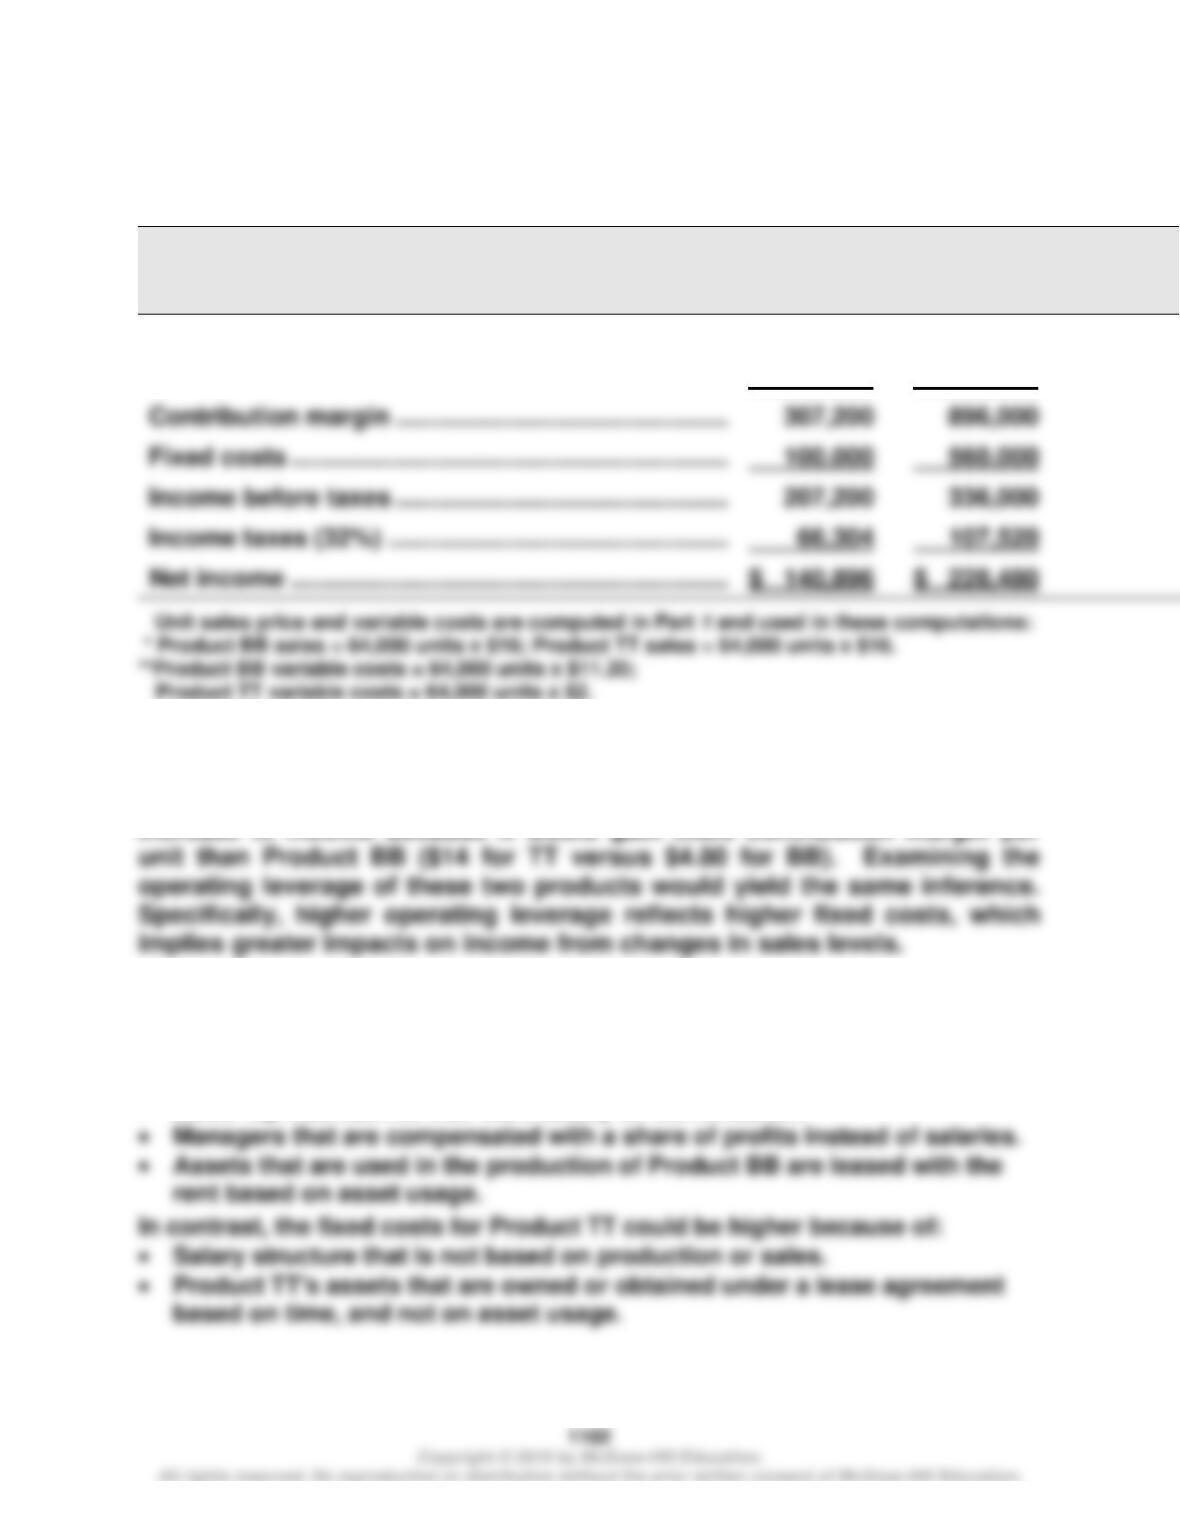
Forecasted contribution margin income statements for each product
assuming sales decline to 33,000 units with no change in unit sales price
STAM CO.
Forecasted Contribution Margin Income Statement
Product BB
Product TT
Sales* …………………………………………………………………
$528,000
$ 528,000
Variable costs** …………………………………………………..
369,600
66,000
Fixed costs ……………………………………………………….
100,000
560,000
18,688
(31,360)
$ 39,712
$ (66,640)
Wild and Shaw, Financial & Managerial Accounting, 8e Solutions Manual: Chapter 18
Problem 18–5B (Continued)
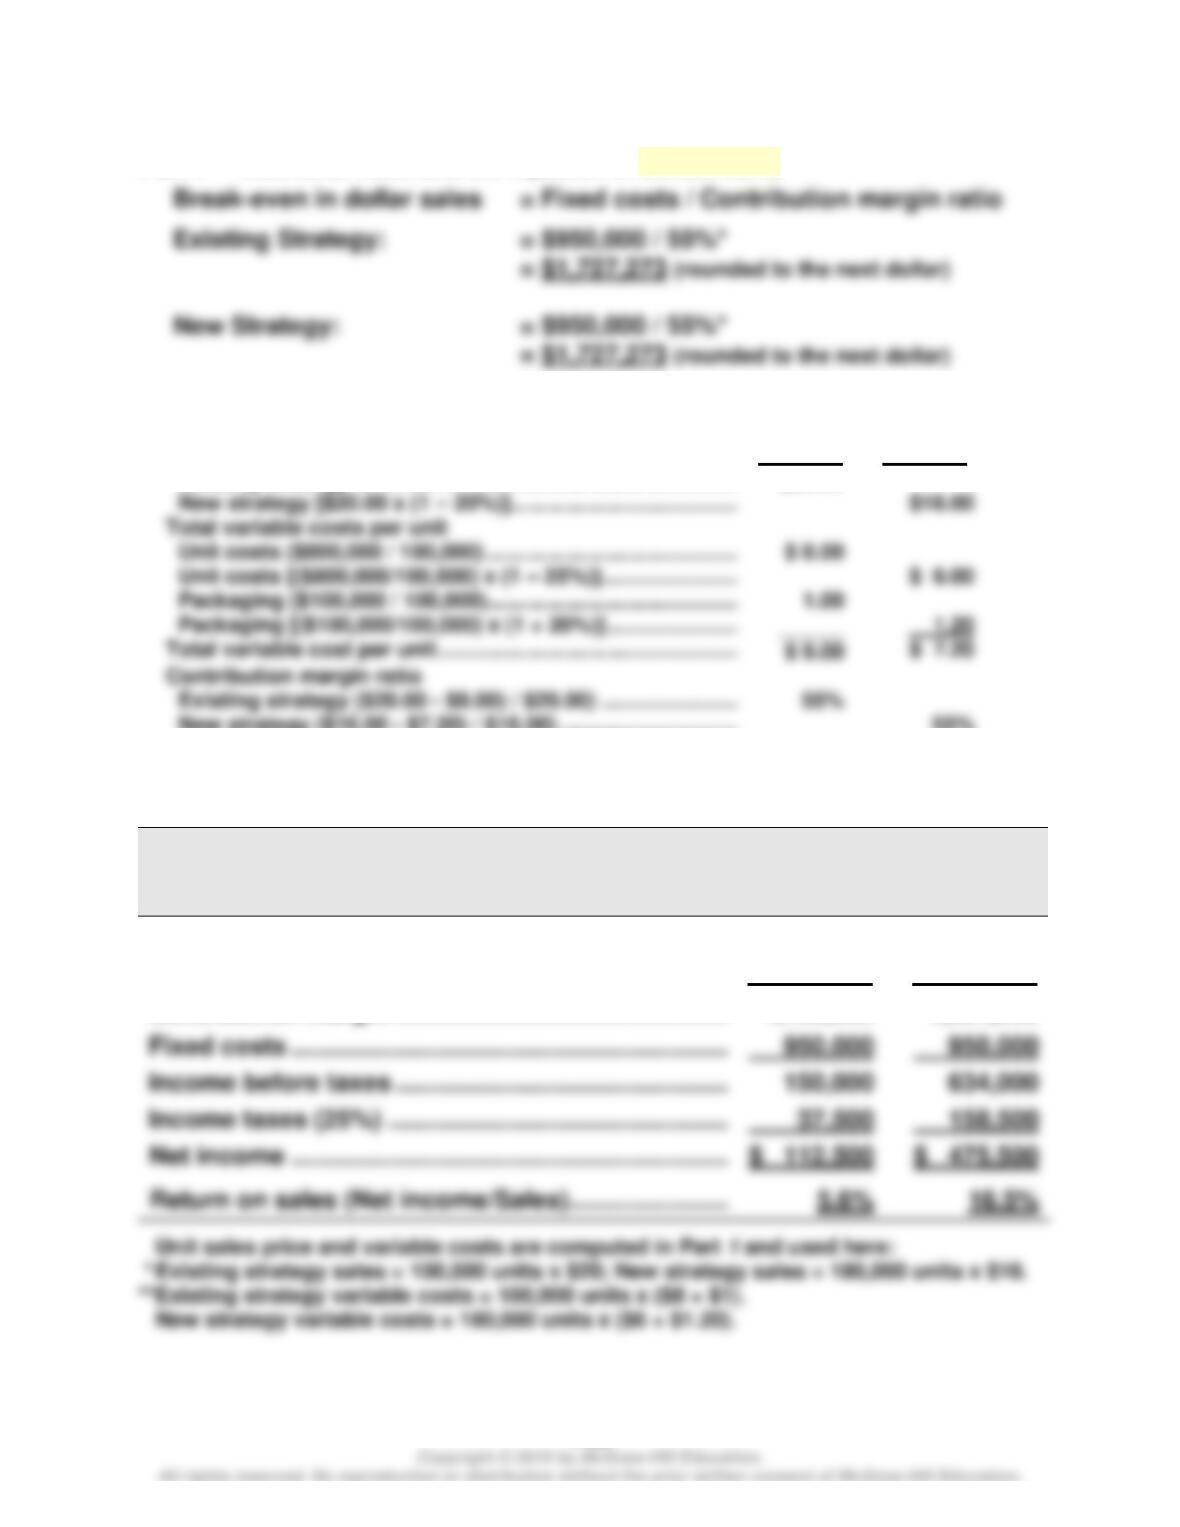
Forecasted contribution margin income statements for each product
assuming sales increase to 64,000 units with no change in unit sales price:
STAM CO.
Forecasted Contribution Margin Income Statement
Product BB
Product TT
Sales* …………………………………………………………………
$1,024,000
$1,024,000
Variable costs** …………………………………………………..
716,800
128,000
66,304
107,520
Part 4
If sales were to greatly increase, Product TT would experience the greater
increase in income because it would gain more contribution margin per
Part 5
Factors that could cause Product BB to have lower fixed costs include:
• Labor arrangement that pays workers for units produced.
• Sales representatives that work totally on commission.
Wild and Shaw, Financial & Managerial Accounting, 8e Solutions Manual: Chapter 18
1103
Problem 18-6B (45 minutes)
Part 1 Instructor note: Use the equation in Exhibit 18.12
*To compute contribution margin ratio
Existing strategy ($20.00 – $9.00) / $20.00) …………………………..
Sales price per unit
Existing strategy ……………………………………………………….
Existing
Strategy
$20.00
New
Strategy
New strategy ($16.00 – $7.20) / $16.00) …………………………..
55%
Part 2
BEST COMPANY
Forecasted Contribution Margin Income Statement
Existing Strategy
New Strategy
Sales* …………………………………………………………………
$2,000,000
$2,880,000
Variable costs** …………………………………………………..
900,000
1,296,000
Contribution margin ……………………………………………
1,100,000
1,584,000
Fixed costs ……………………………………………………….
950,000
950,000
Income before taxes ……………………………………………
37,500
158,500
Net income ……………………………………………………….
Problem 18-7B (50 minutes)
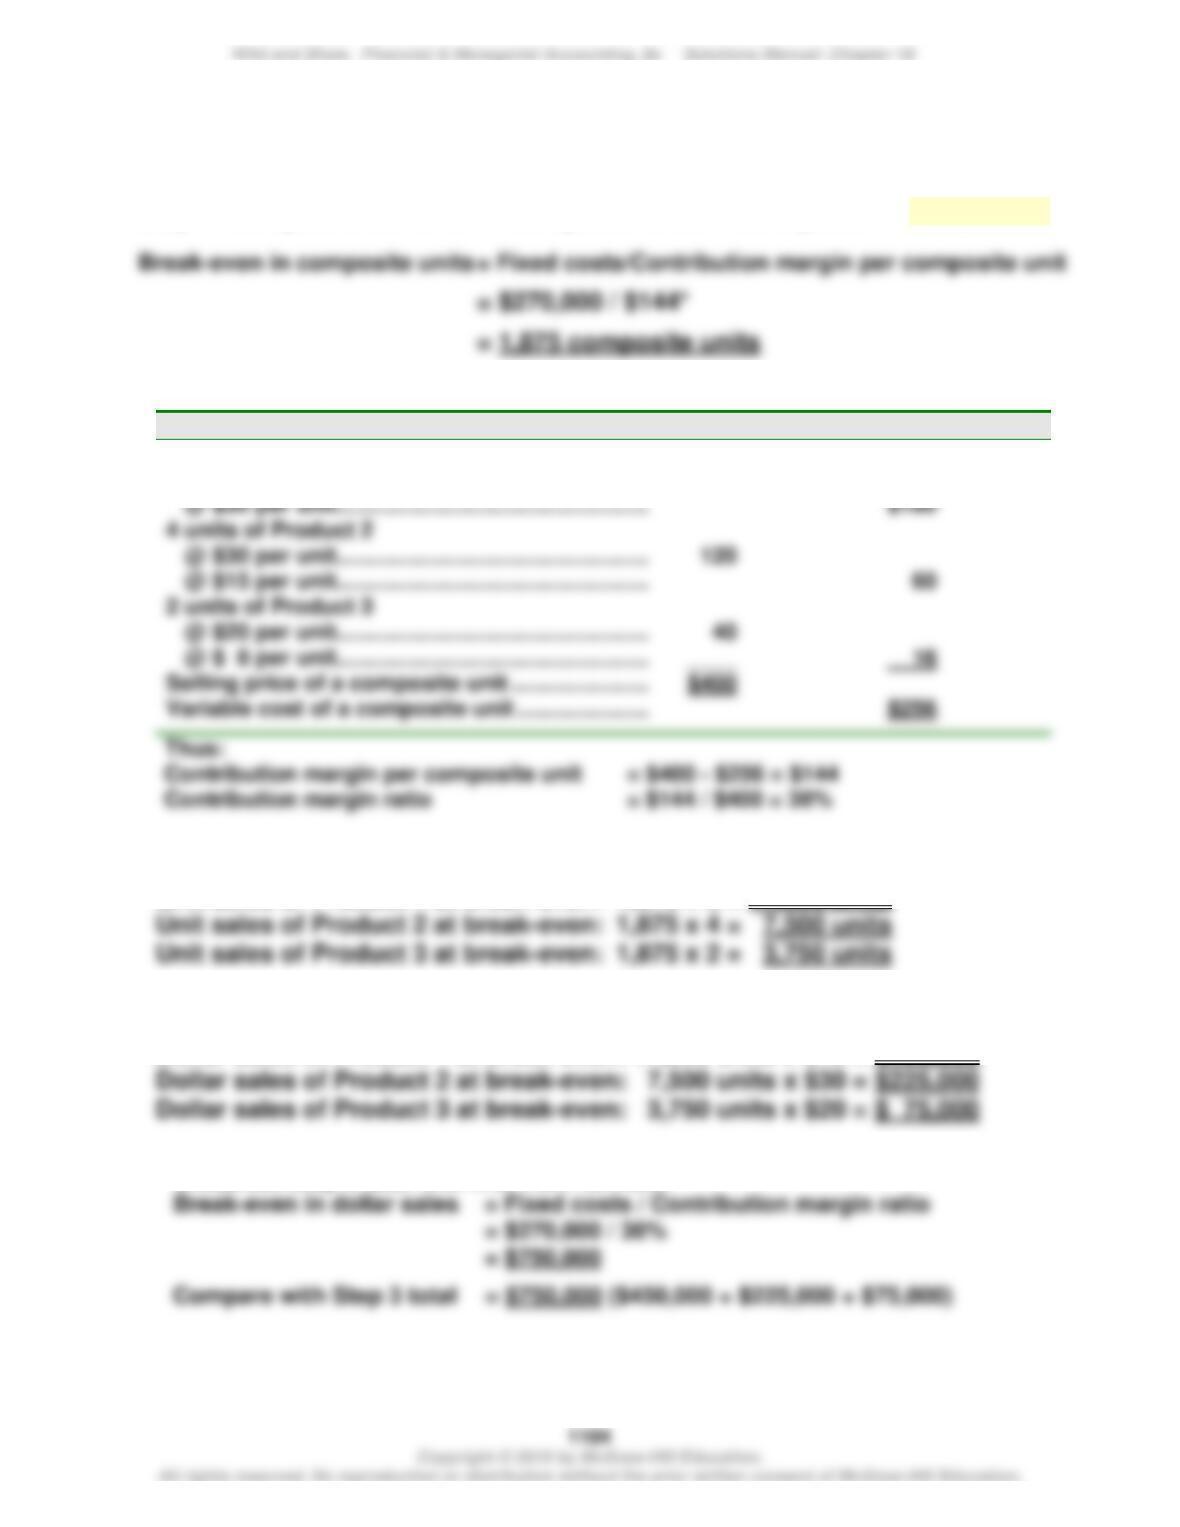
Part 1 BREAK–EVEN ANALYSIS ASSUMING USE OF SAME MATERIALS
Step 1: Compute break-even in composite units—Use equation in Exhibit 18.29
* To compute the contribution margin per composite unit
Unit Sales Price
Unit Variable Costs
6 units of Product 1
@ $40 per unit…………………………………………..
$240
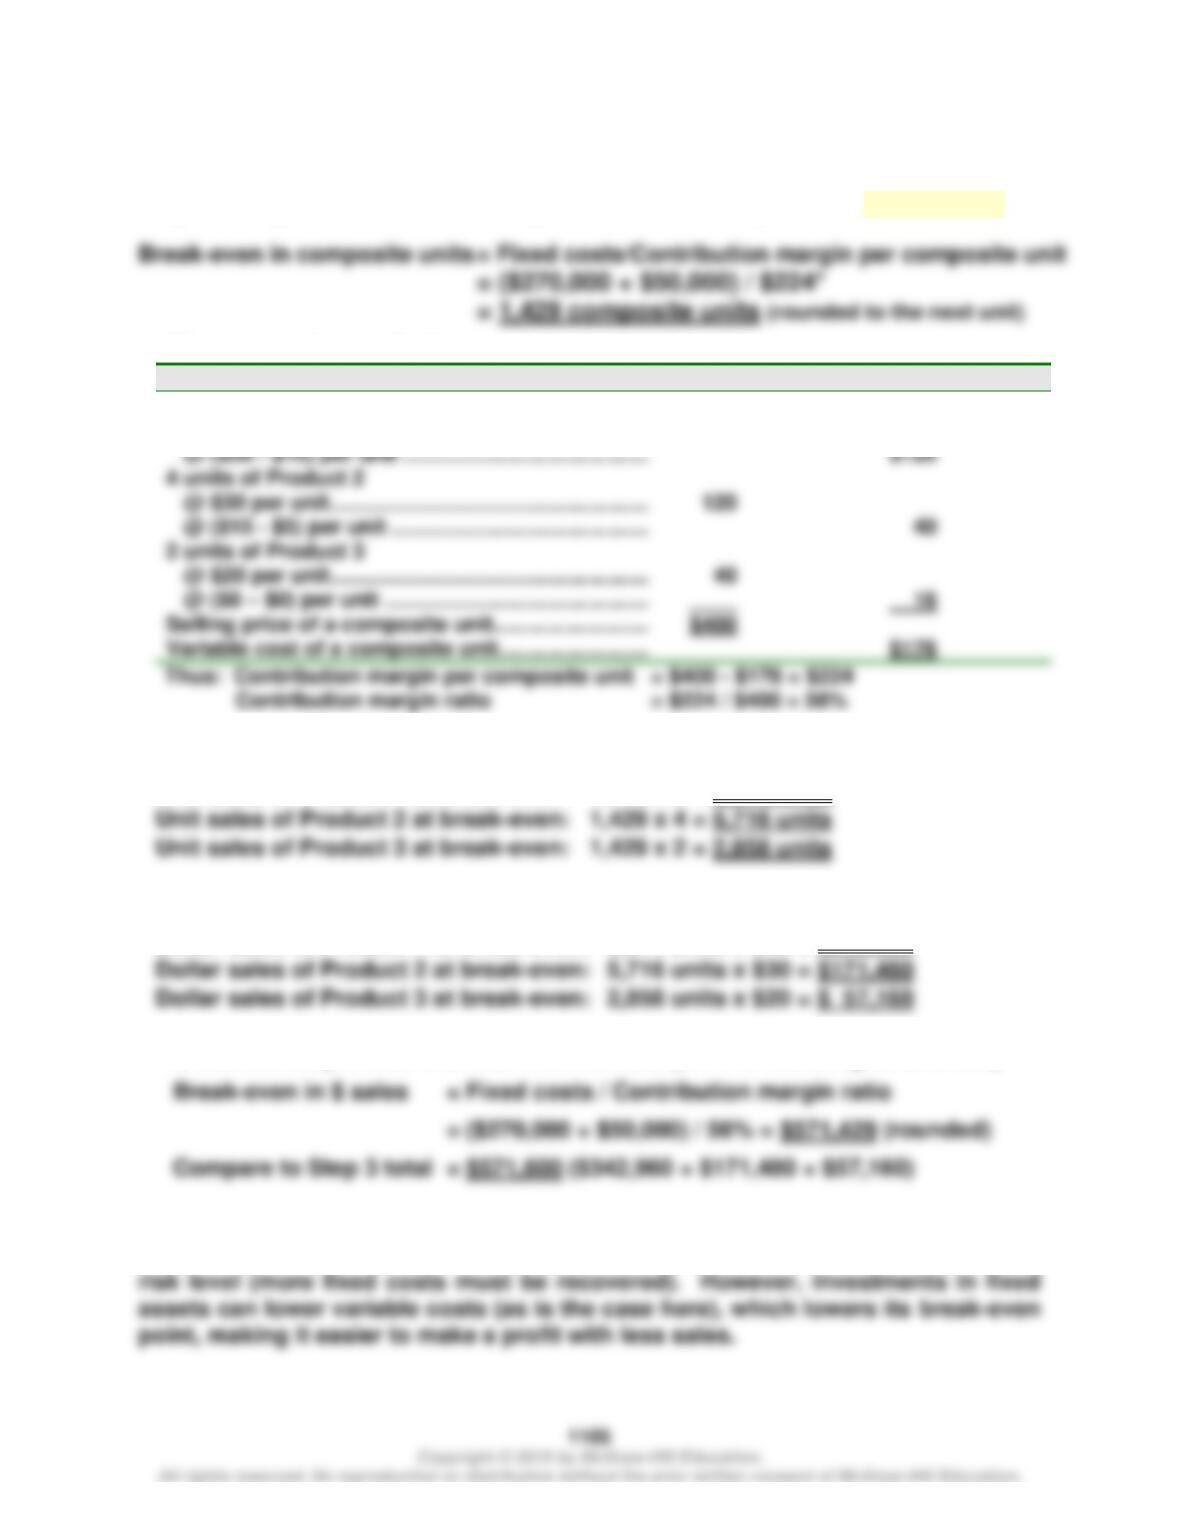
Step 2: Compute break-even in individual product unit sales
Unit sales of Product 1 at break–even: 1,875 x 6 = 11,250 units
Step 3: Compute break-even in individual product dollar sales
Dollar sales of Product 1 at break-even: 11,250 units x $40 = $450,000
Crossfoot Step 3 total with that from formula:
Wild and Shaw, Financial & Managerial Accounting, 8e Solutions Manual: Chapter 18
Problem 18–7B (Continued)
Part 2 BREAK–EVEN ANALYSIS ASSUMING USE OF NEW MATERIALS
Step 1: Compute break-even in composite units—Use equation in Exhibit 18.29
*To compute the contribution margin per composite unit
Unit Sales Price
Unit Variable Costs
4 units of Product 2
6 units of Product 1
@ $40 per unit ……………………………………………..
$240
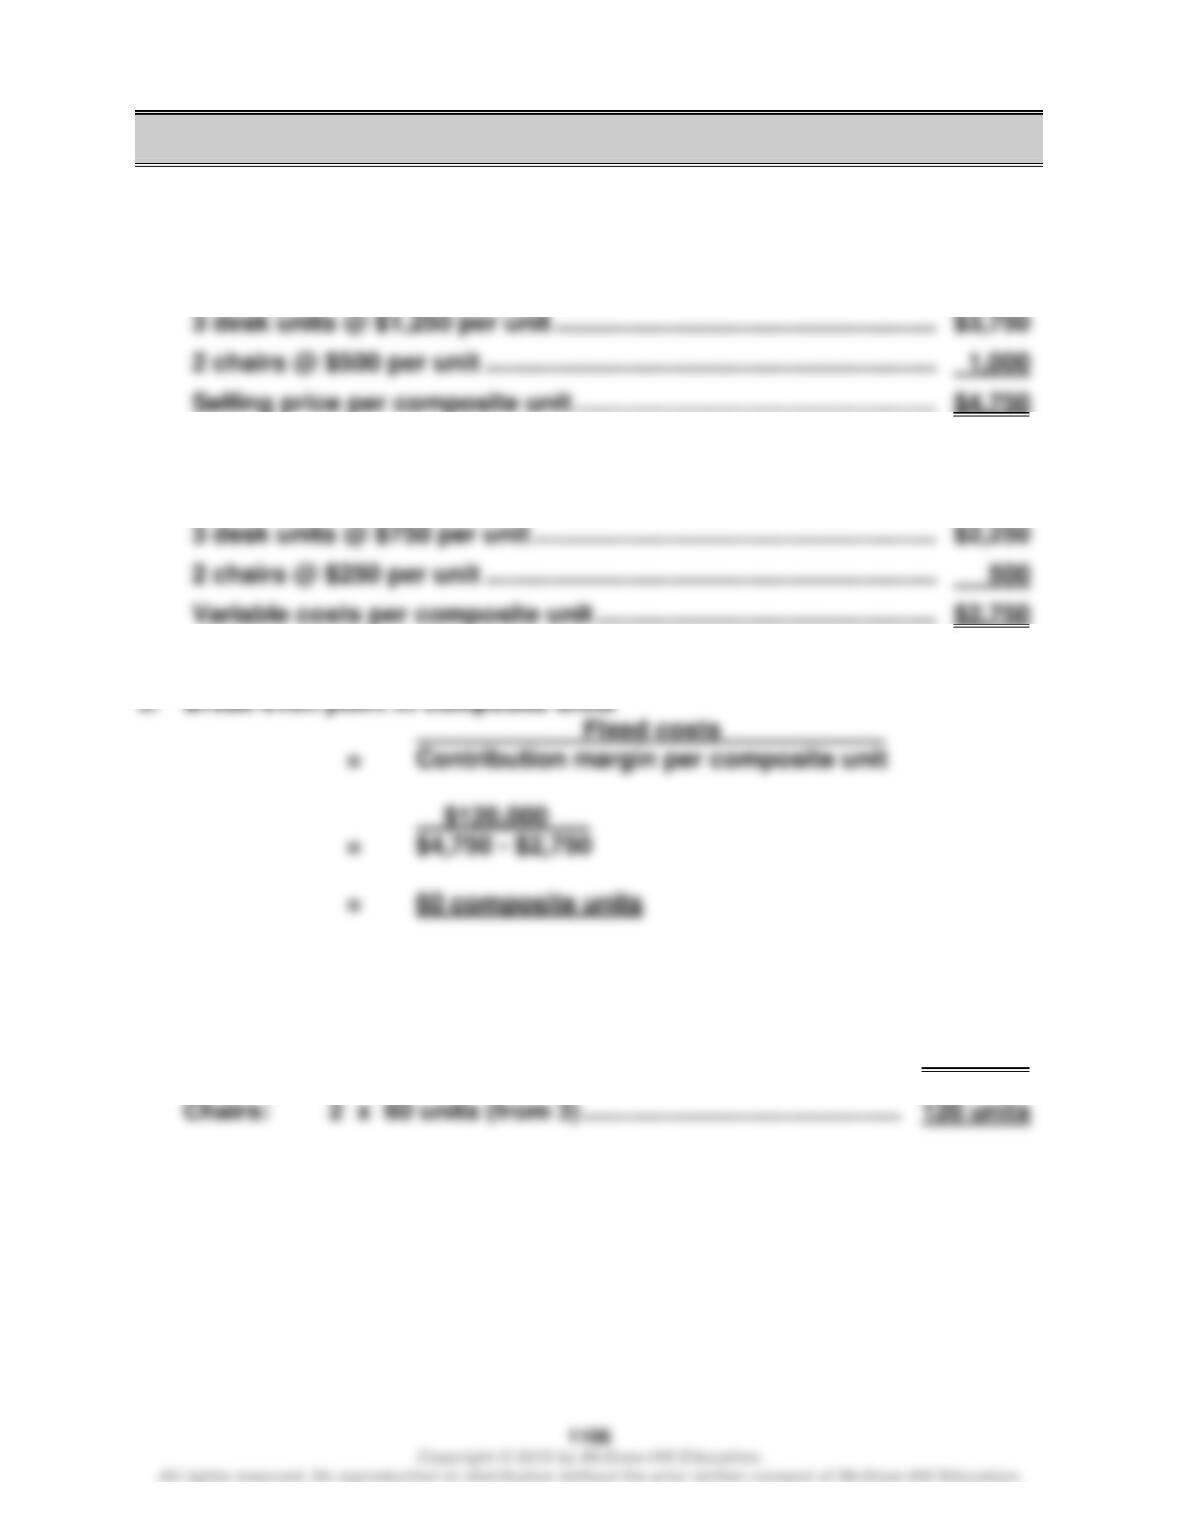
Step 2: Compute break-even in individual product unit sales
Unit sales of Product 1 at break-even: 1,429 x 6 = 8,574 units
Step 3: Compute break-even in individual product dollar sales
Dollar sales of Product 1 at break-even: 8,574 units x $40 = $342,960
Crossfoot Step 3 total with that from formula ($171 of rounding differences):
Part 3
When a business invests in fixed assets, as in this case, there is an increase in its
Wild and Shaw, Financial & Managerial Accounting, 8e Solutions Manual: Chapter 18
SERIAL PROBLEM — SP 18
Serial Problem, Business Solutions (50 minutes)
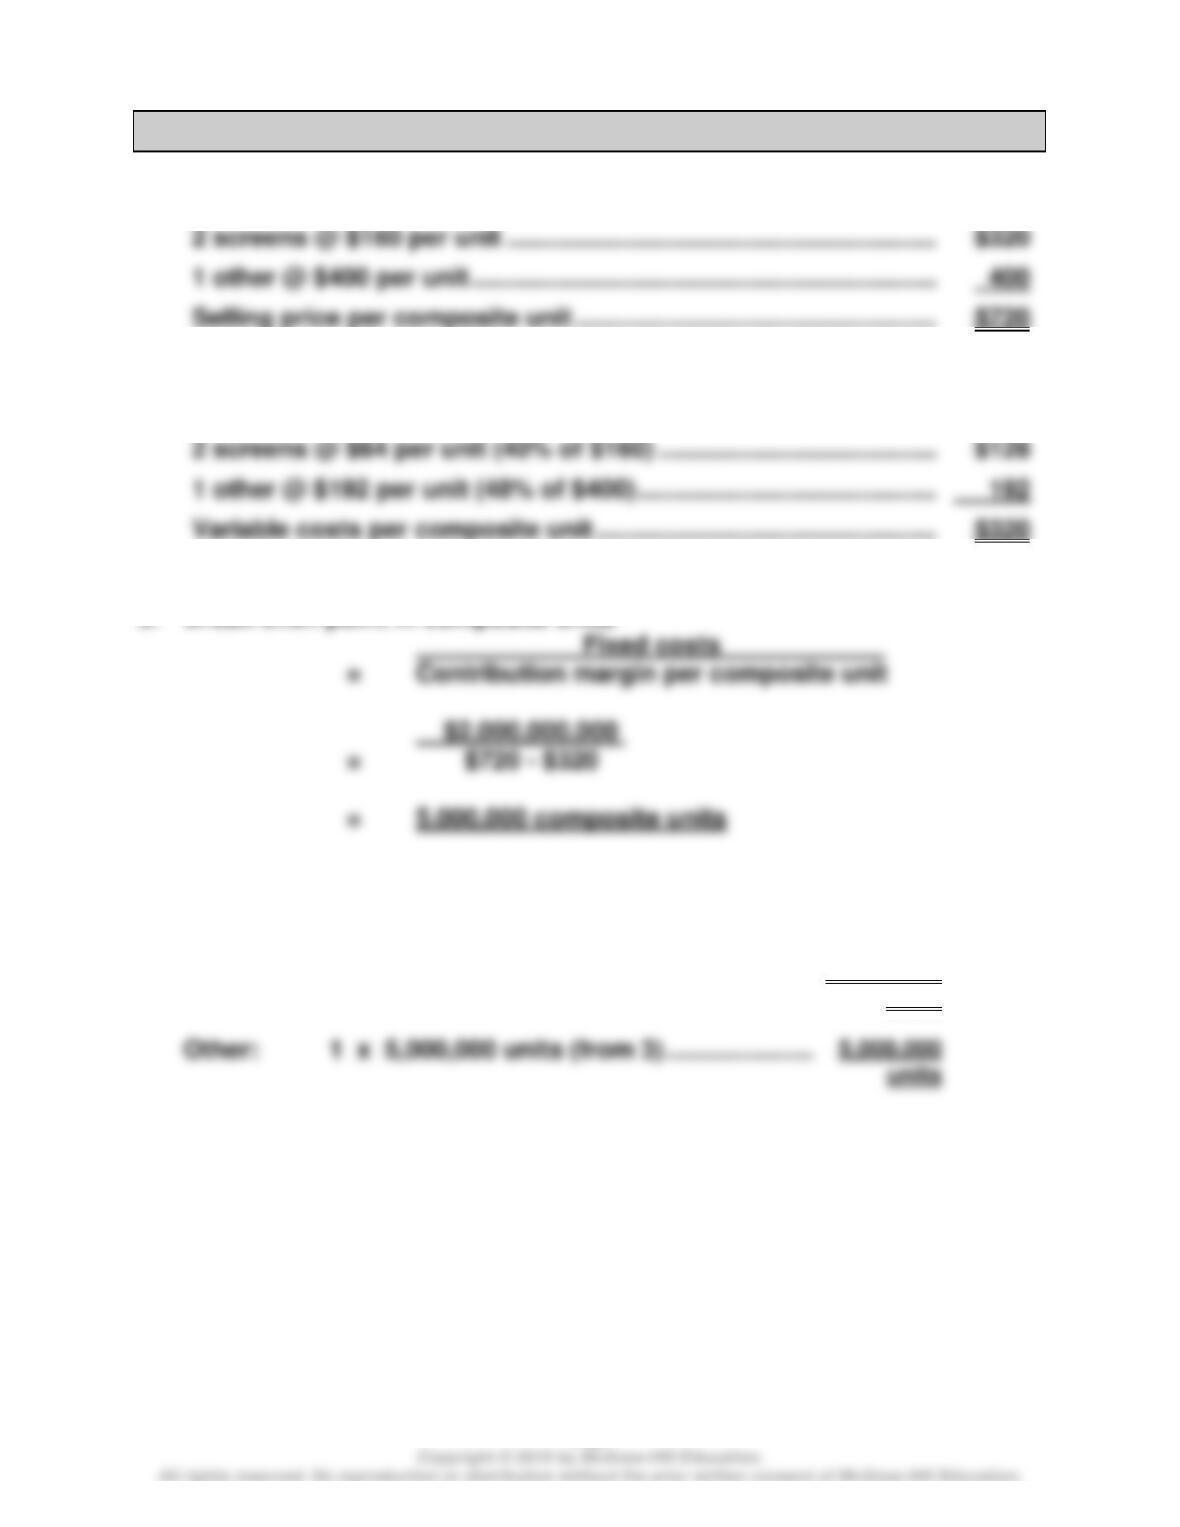
1. Selling price per composite unit
2. Variable costs per composite unit
4. Unit sales of desk units and chairs at break-even point
Desk units: 3 x 60 units (from 3) …………………………………………….
180 units
Wild and Shaw, Financial & Managerial Accounting, 8e Solutions Manual: Chapter 18
1107
Accounting Analysis — AA 18-1
1. Selling price per composite unit
2. Variable costs per composite unit
3. Break-even point in composite units
4. Unit sales of screen repairs and other repairs at break-even point
Screens: 2 x 5,000,000 units (from 3) …………………………..
10,000,000
units
units
Wild and Shaw, Financial & Managerial Accounting, 8e Solutions Manual: Chapter 18
1108
Comparative Analysis — AA 18-2
1.
Apple
Google
Average selling price per unit………….
$ 550
$ 470
Average variable cost per unit…………
Average contribution margin per unit..
$ 300
Total fixed costs ($ millions)……………
2. As unit sales decline, Apple’s operating profits will fall by $300 per unit
versus Google’s decline in operating profits of $200 per unit. Thus,
Global Analysis — AA 18-3
1.
Samsung
Apple
Average selling price per unit………….
$ 720
$ 650
Average variable cost per unit…………
2. Apple’s smartphone has a higher contribution margin ratio (66% versus
Wild and Shaw, Financial & Managerial Accounting, 8e Solutions Manual: Chapter 18
1109
Ethics Challenge — BTN 18-1
Instructor note: This question can serve to generate class discussion on
cost analysis and estimation. Discussion can focus on accounting,
business, and other ethical concerns.
MEMORANDUM
To: “Mechanics” and “Owners”
From: Your name
RE: Analysis of labor costs for survey
Date: Current date
The memorandum should include many of the following points:
Objectivity: A statement about the need to be objective in the analysis. Both
Cost Accounting Estimation: The memorandum should outline how cost
estimation is conducted. For example, you might describe how regression
Business Concerns: The memorandum should point out that the repair
business should follow established business practices for setting cost
Mechanic-Related Issues: The memorandum should also be concerned about
the quality of mechanical work. Is the work being done correctly and is
Wild and Shaw, Financial & Managerial Accounting, 8e Solutions Manual: Chapter 18
1110
Communicating in Practice — BTN 18-2
Instructor note: Reports will vary, but a typical report would likely include
assumptions similar to the following.
1. Revenue (salary) assumptions
• Find job that pays a specified amount.
2. Cost assumptions
• Find living accommodations at a specified amount.
Taking It to the Net — BTN 18-3
The site offers many tools for an entrepreneur in assessing costs, sales,
and profits. Specifically, a spreadsheet file is provided that allows an
entrepreneur to identify the start-up costs of the business. A new business
Wild and Shaw, Financial & Managerial Accounting, 8e Solutions Manual: Chapter 18
Teamwork in Action — BTN 18-4
(a) Questions for school administrators (others are possible)
(b) Questions for owners (others are possible)
• List of other potential markets for theater showings during school
days.
Entrepreneurial Decision — BTN 18-5
1. Costs that won’t change regardless of how much tea Ellis Island
3. Nailah can use CVP techniques to manage her company. Focusing on
contribution margins enables the company to set selling prices that
cover fixed costs and enable a target profit level. Nailah can use
Wild and Shaw, Financial & Managerial Accounting, 8e Solutions Manual: Chapter 18
Hitting the Road — BTN 18-6
1. There is no set solution for this problem. Answers will vary because each
student will make different estimates for groups, costs, and volume. The
One simple example with crucial facts:
Product
Estimated
Selling
Price per
unit
Estimated
CM ratio
Estimated
CM
per unit
Estimated
Sales
Mix
Estimated CM
for each
component in
composite unit
Burgers …………………………..
$2.00
0.75
$1.50
3.5
$ 5.25
Drinks …………………………..
$1.00
0.90
$0.90
3.5
Other …………………………..
$0.80
0.30
$0.24
1.0
0.24
Estimated fixed costs per year: $500,000
Break-even point in composite unit sales: $500,000/$12.38 = 40,388
Unit sales of individual products per year required to break-even:
Burgers …………………………..
40,388 x 3.5 =
141,358 units
Drinks …………………………..
40,388 x 3.5 =
141,358 units
Other …………………………..
40,388 x 1.0 =
In general, when evaluating a student’s solutions, look for:
• Estimated selling price of products
2. The report should properly interpret the analysis from part 1. This
question is also designed to show students that a fast food restaurant