EXERCISE 18-2
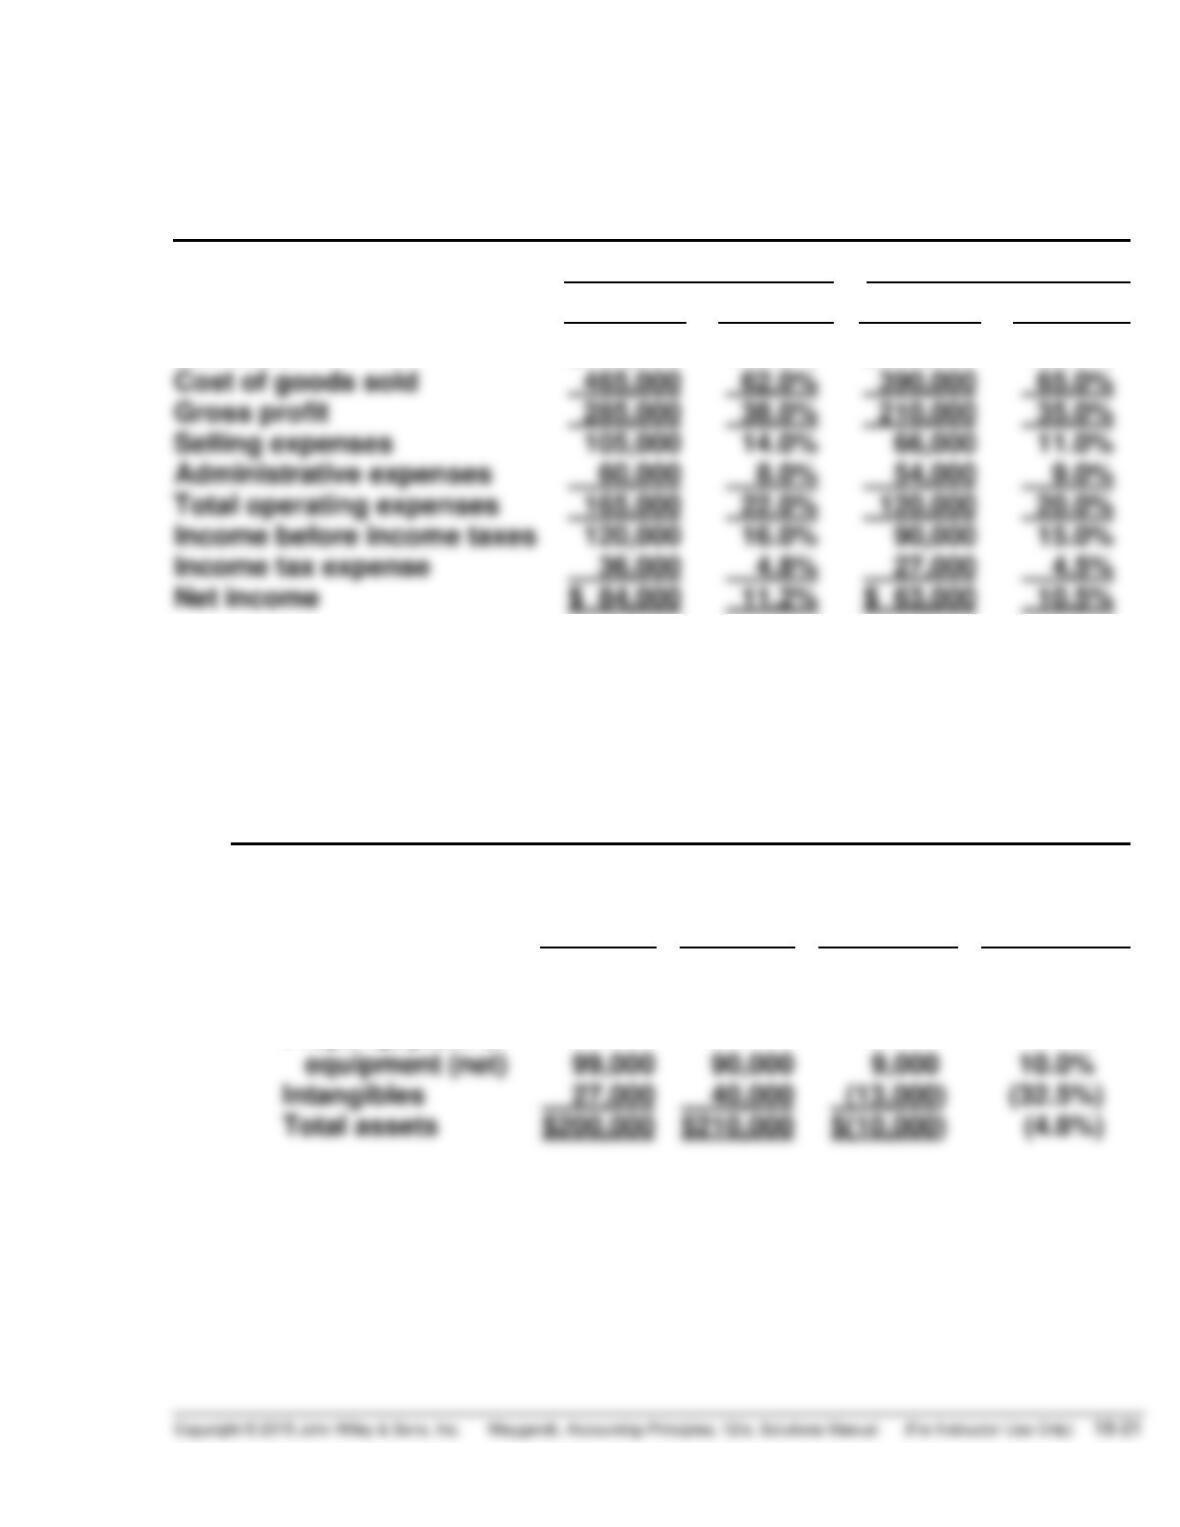
NAVARRO CORPORATION
Condensed Income Statements
For the Years Ended December 31
2017
2016
Amount
Percent
Amount
Percent
Net sales
$750,000
100.0%
$600,000
100.0%
EXERCISE 18-3
(a) GURLEY CORPORATION
Condensed Balance Sheets
December 31
2017
2016
Increase
(Decrease)
Percentage
Change
from 2016
Assets
Current assets
Property, plant &
$ 74,000
$ 80,000
$ (6,000)
(7.5%)
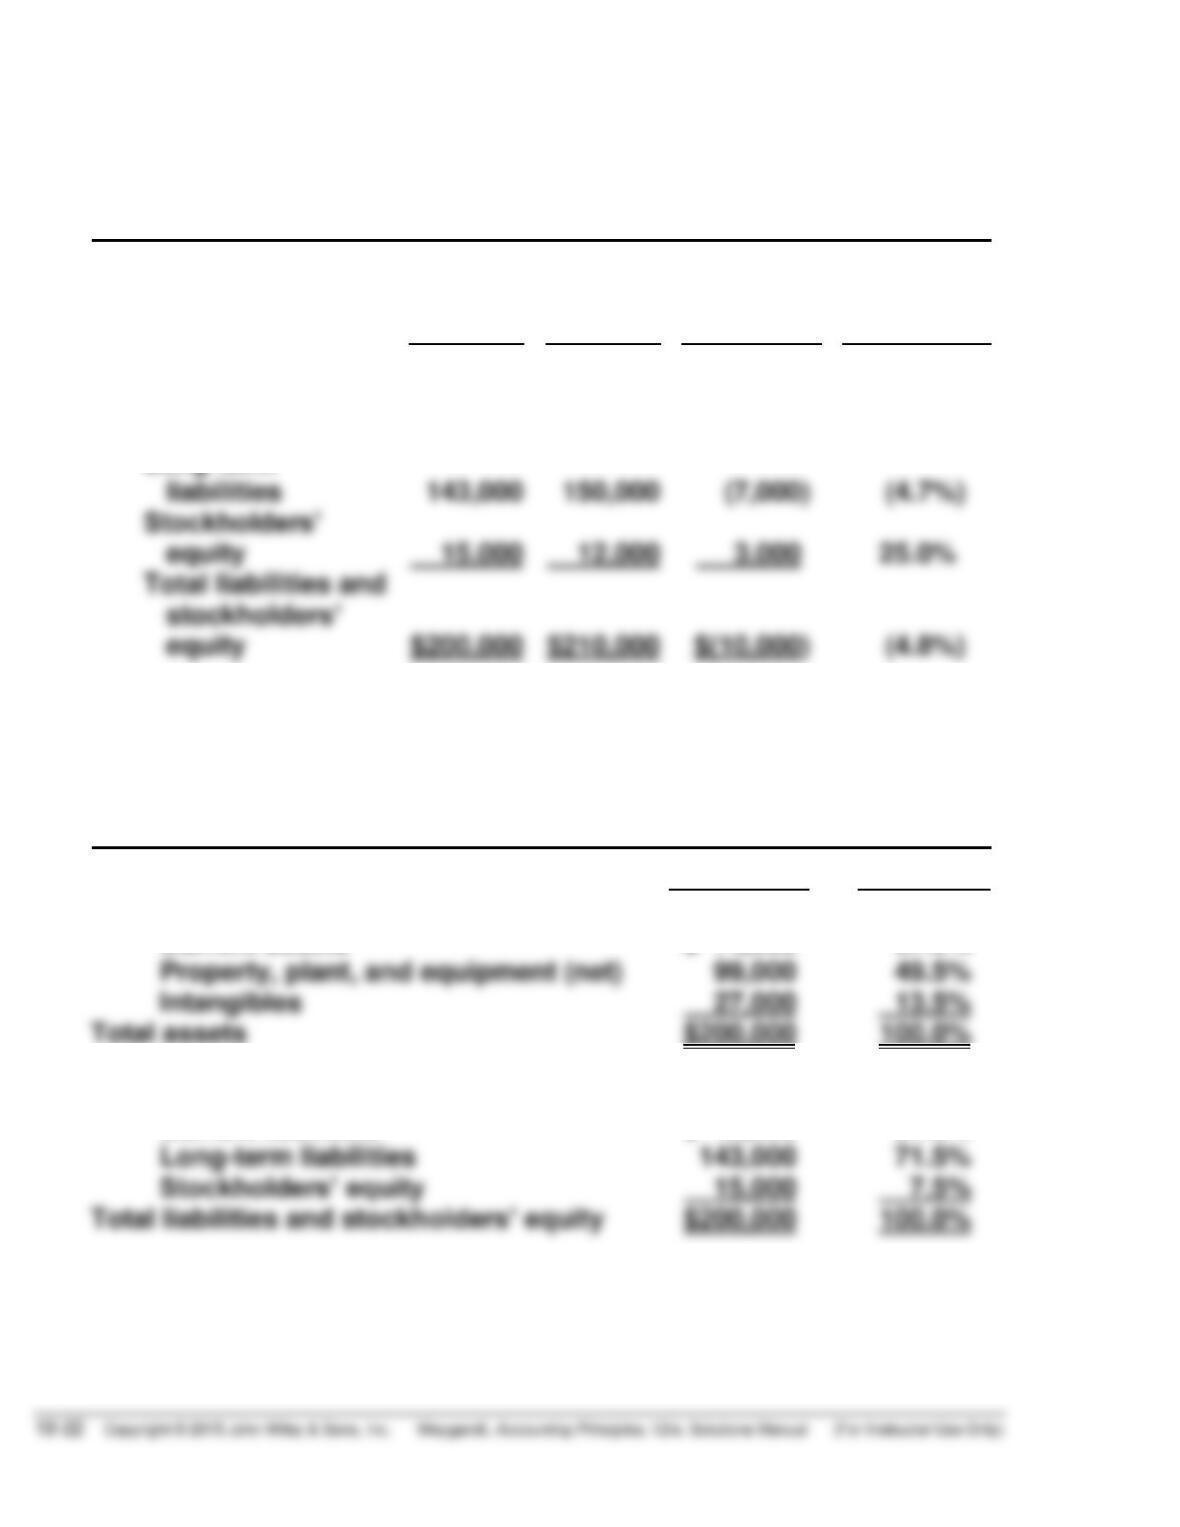
EXERCISE 18-3 (Continued)
GURLEY CORPORATION
Condensed Balance Sheets (Continued)
December 31
2017
2016
Increase
(Decrease)
Percentage
Change
from 2016
Liabilities and stock-
holders’ equity
Current liabilities
Long-term
$ 42,000
$ 48,000
$ (6,000)
(12.5%)
(b) GURLEY CORPORATION
Condensed Balance Sheet
December 31, 2017
Amount
Percent
Assets
Current assets
Liabilities and stockholders’ equity
Current liabilities
$ 74,000
$ 42,000
37.0%
21.0%
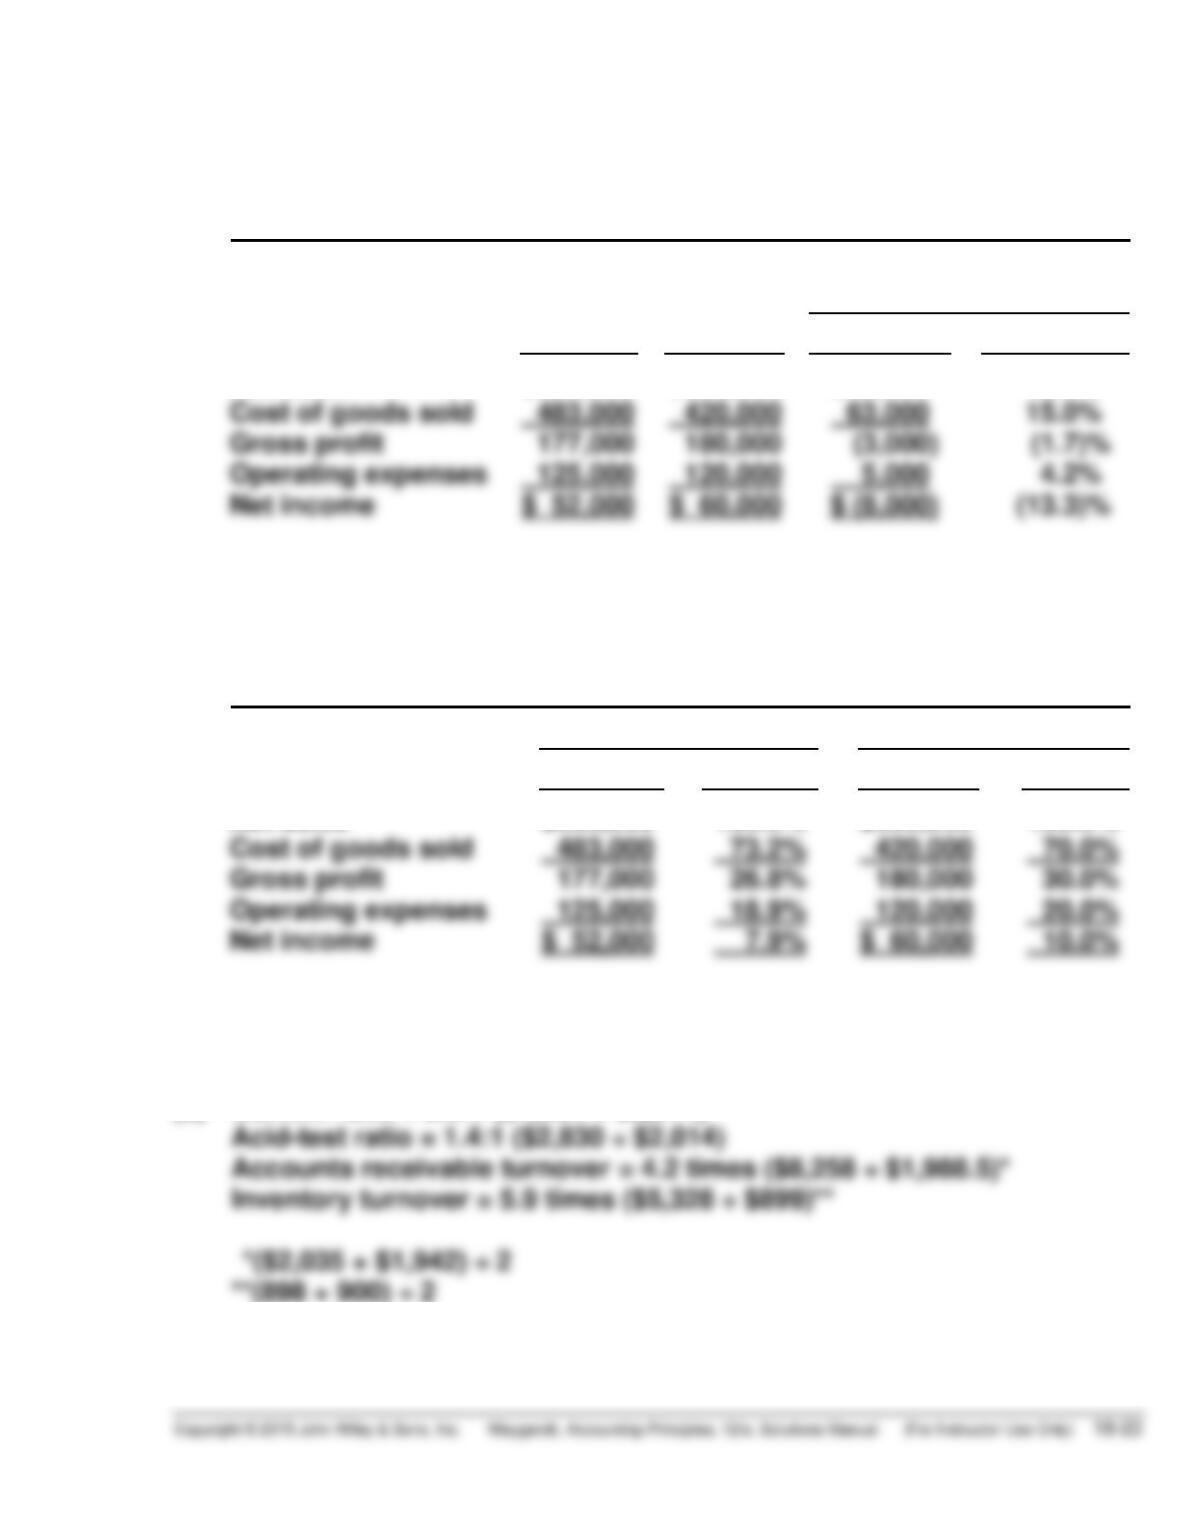
EXERCISE 18-4
(a) EMLEY CORPORATION
Condensed Income Statements
For the Years Ended December 31
Increase or (Decrease)
During 2017
2017
2016
Amount
Percentage
Net sales
$660,000
$600,000
$60,000
10.0%
(b) EMLEY CORPORATION
Condensed Income Statements
For the Years Ended December 31
2017
2016
Amount
Percent
Amount
Percent
Net sales
$660,000
100.0%
$600,000
100.0%
EXERCISE 18-5
(a) Current ratio = 2.0:1 ($4,054 ÷ $2,014)
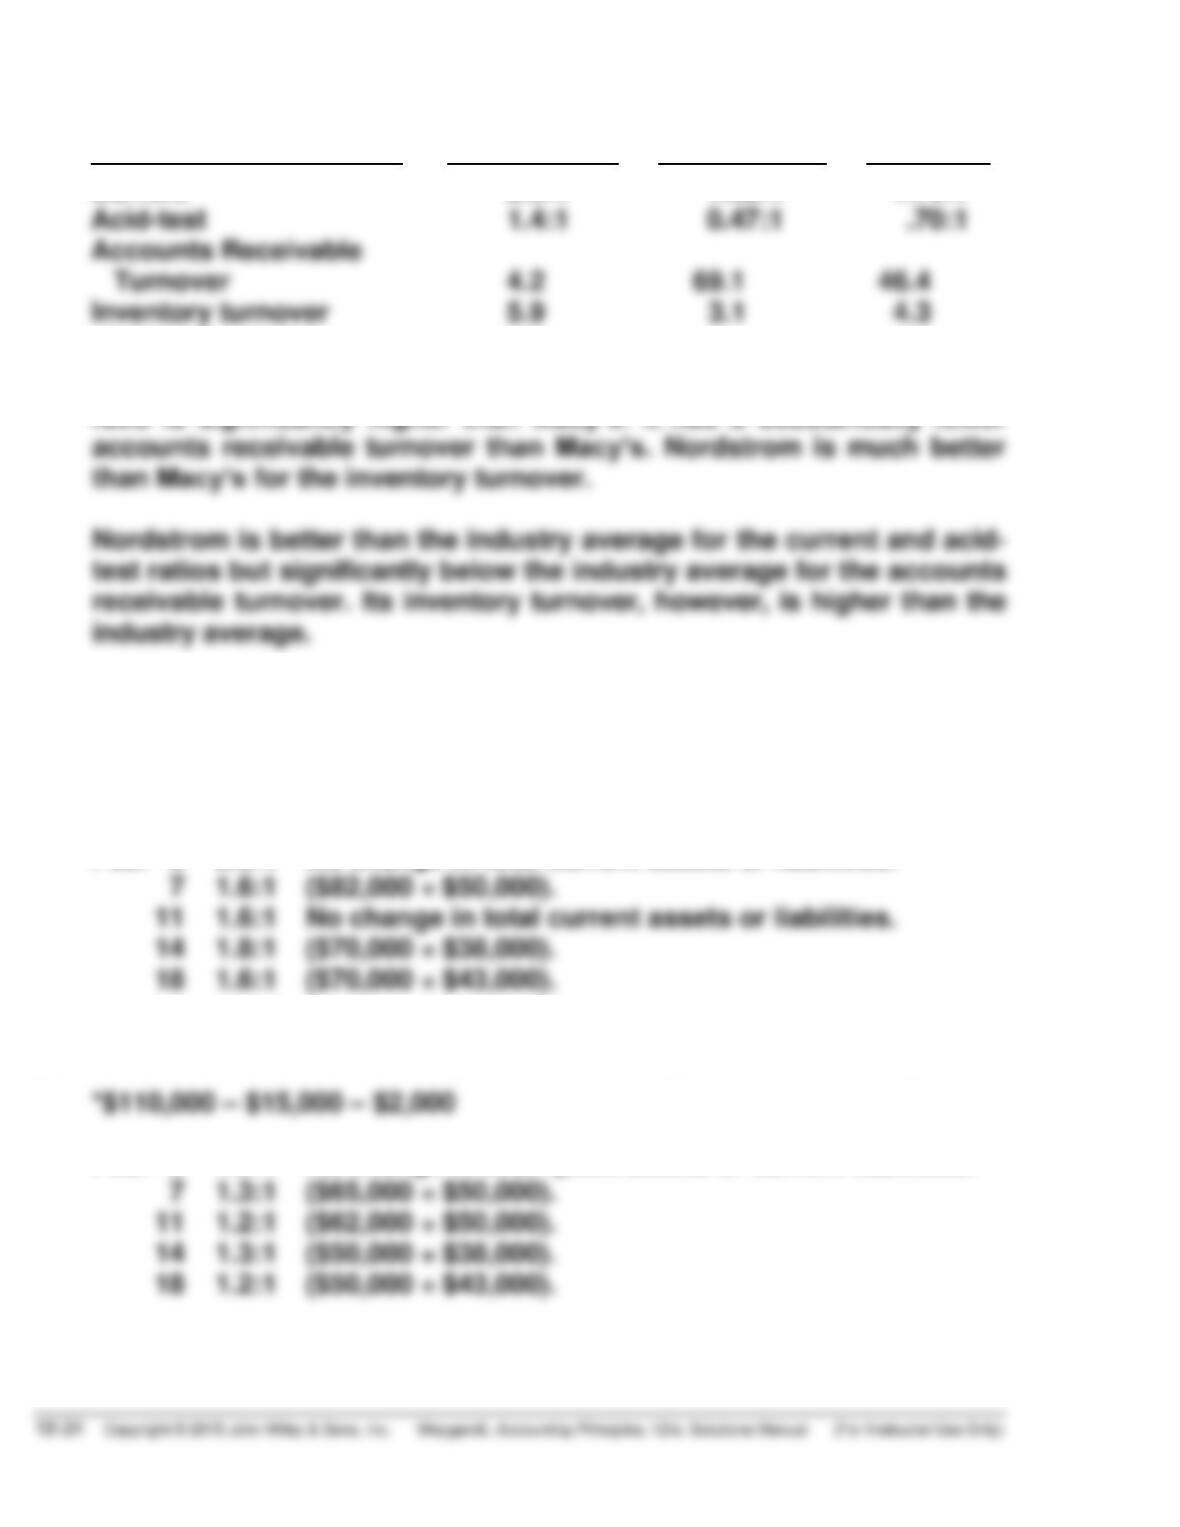
EXERCISE 18-5 (Continued)
(b)
Ratio
Nordstrom
Macy’s
Industry
Current
2.0:1
1.52:1
1.70:1
Nordstrom is better than Macy’s for the current ratio and its acid-test
ratio is significantly higher than Macy’s. It has a substantially lower
EXERCISE 18-6
(a) Current ratio as of February 1, 2017 = 2.2:1 ($110,000 ÷ $50,000).
Feb. 3 2.2:1 No change in total current assets or liabilities.
(b) Acid-test ratio as of February 1, 2017 = 1.9:1 ($93,000* ÷ $50,000).
Feb. 3 1.9:1 No change in total quick assets or current liabilities.
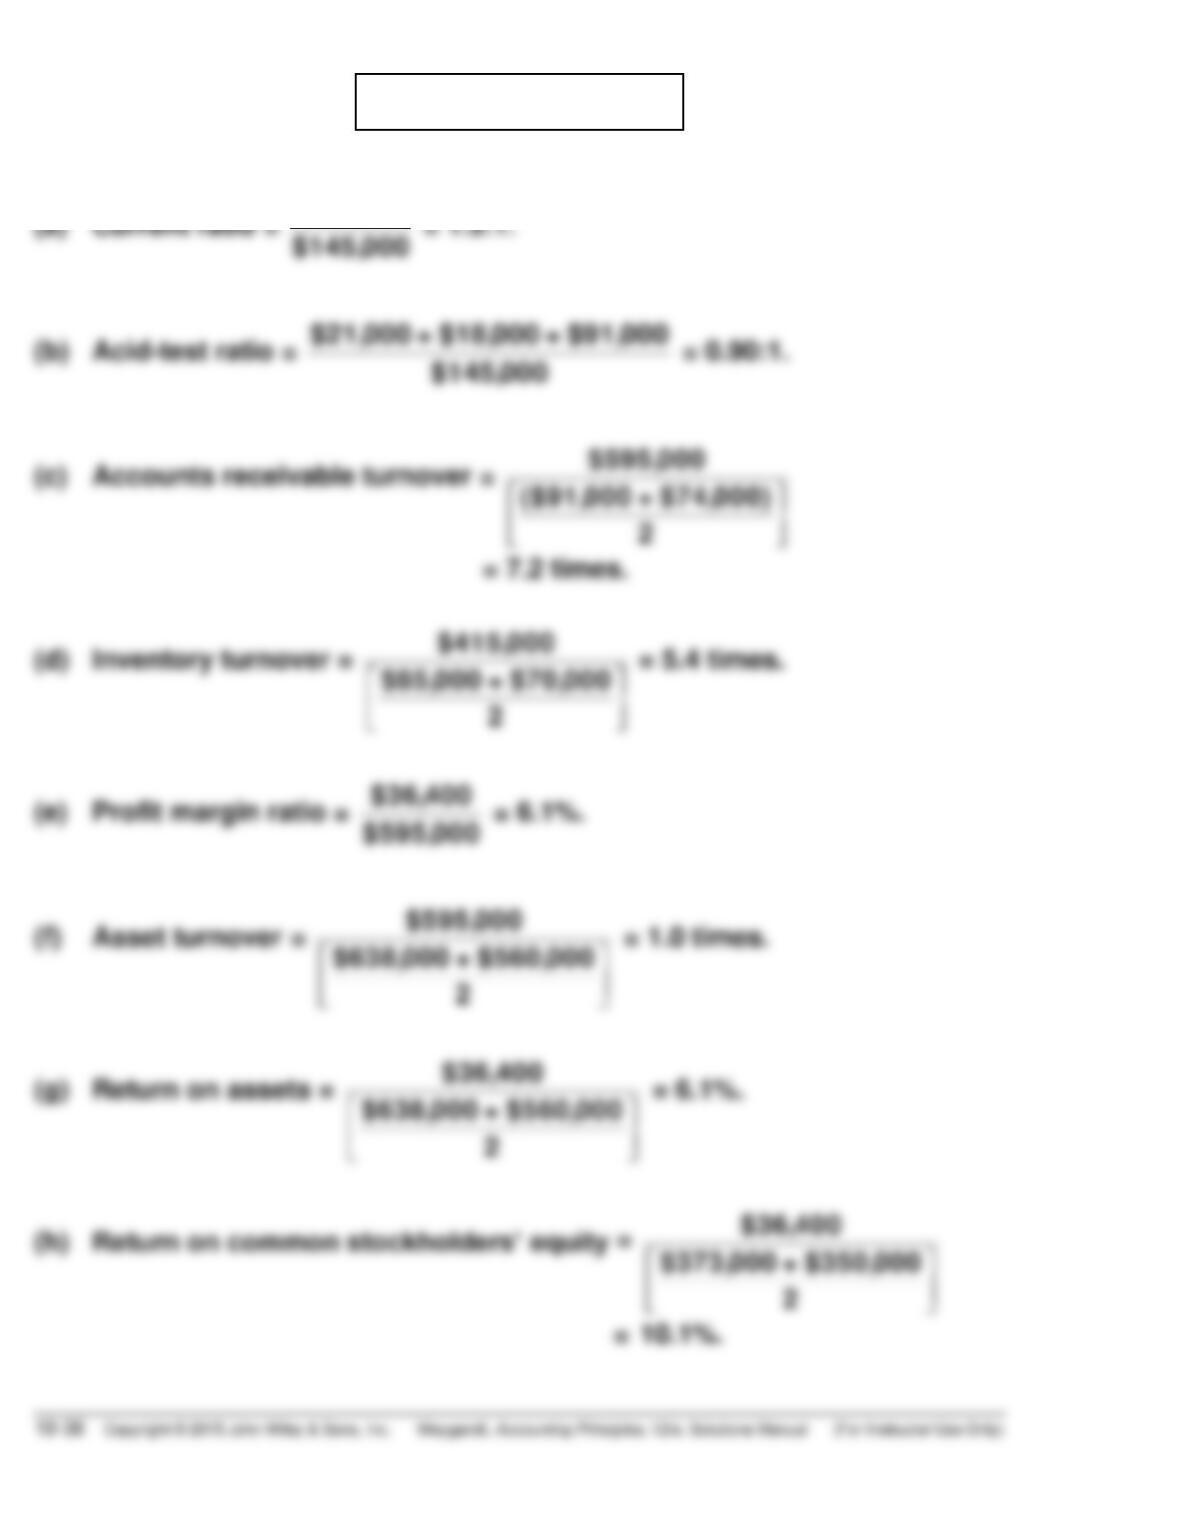
EXERCISE 18-7
(a)
$145,000
$50,000
= 2.9:1.
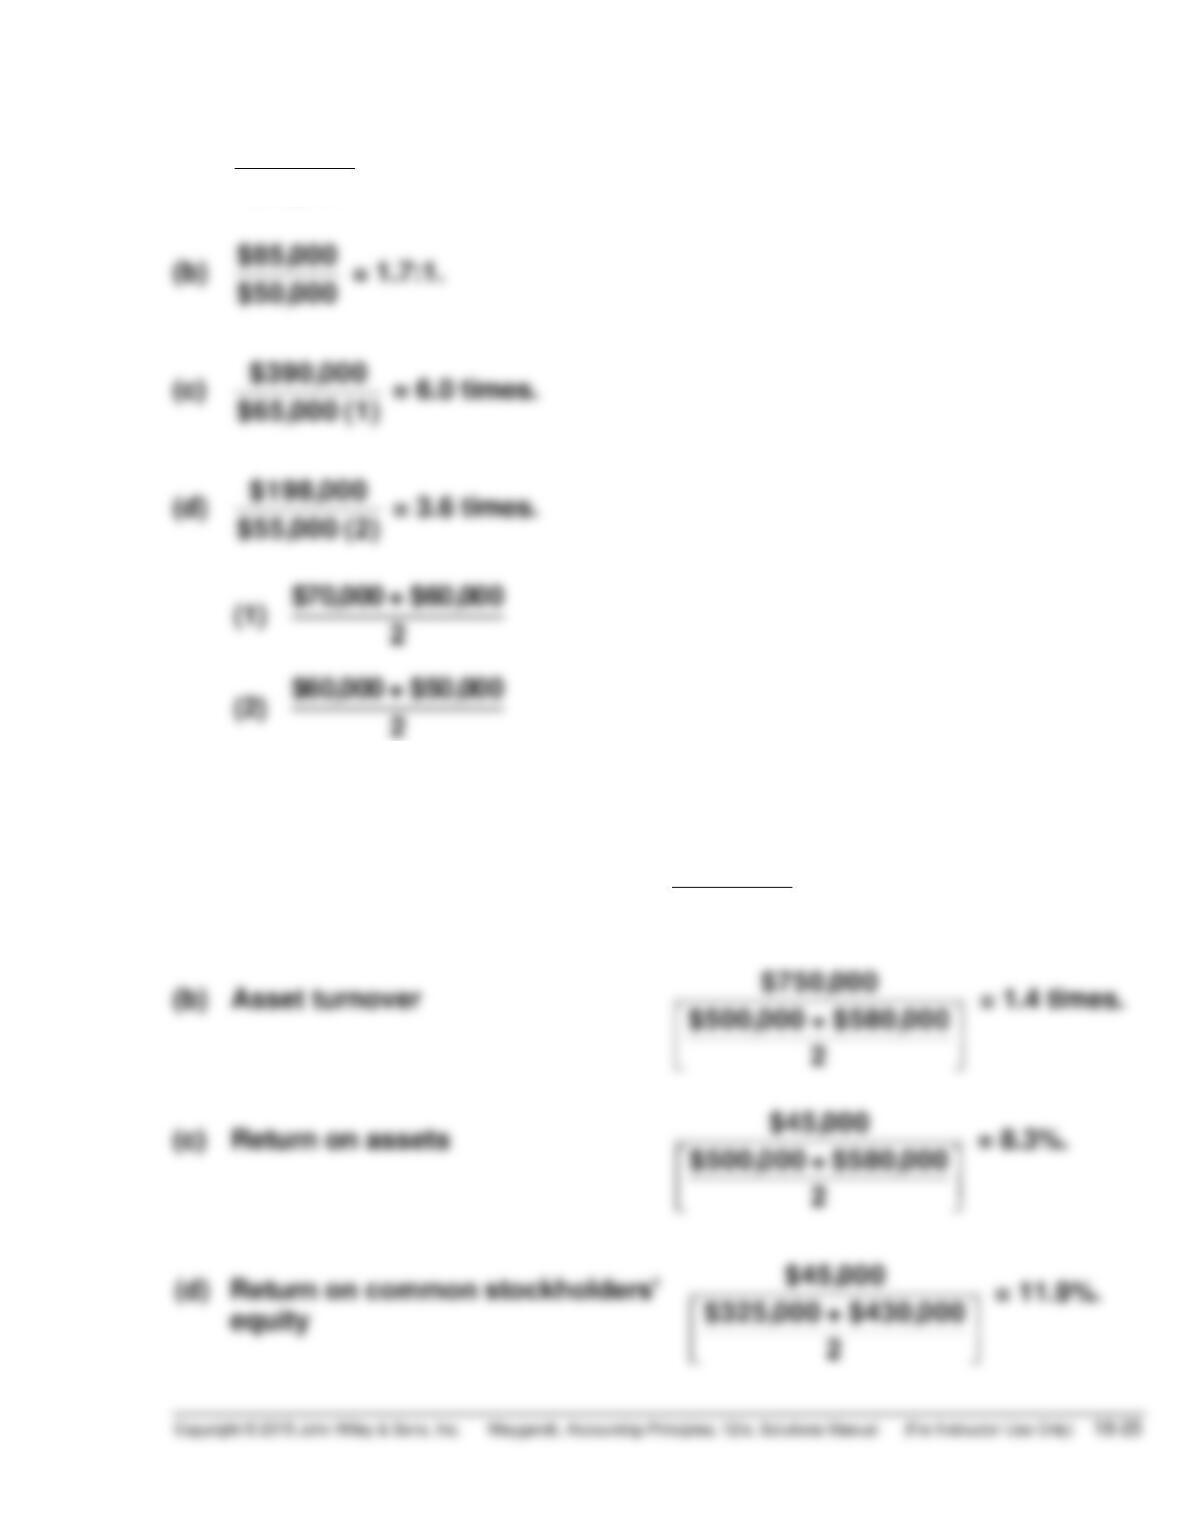
EXERCISE 18-8
(a) Profit margin
$45,000
$750,000
= 6.0%.
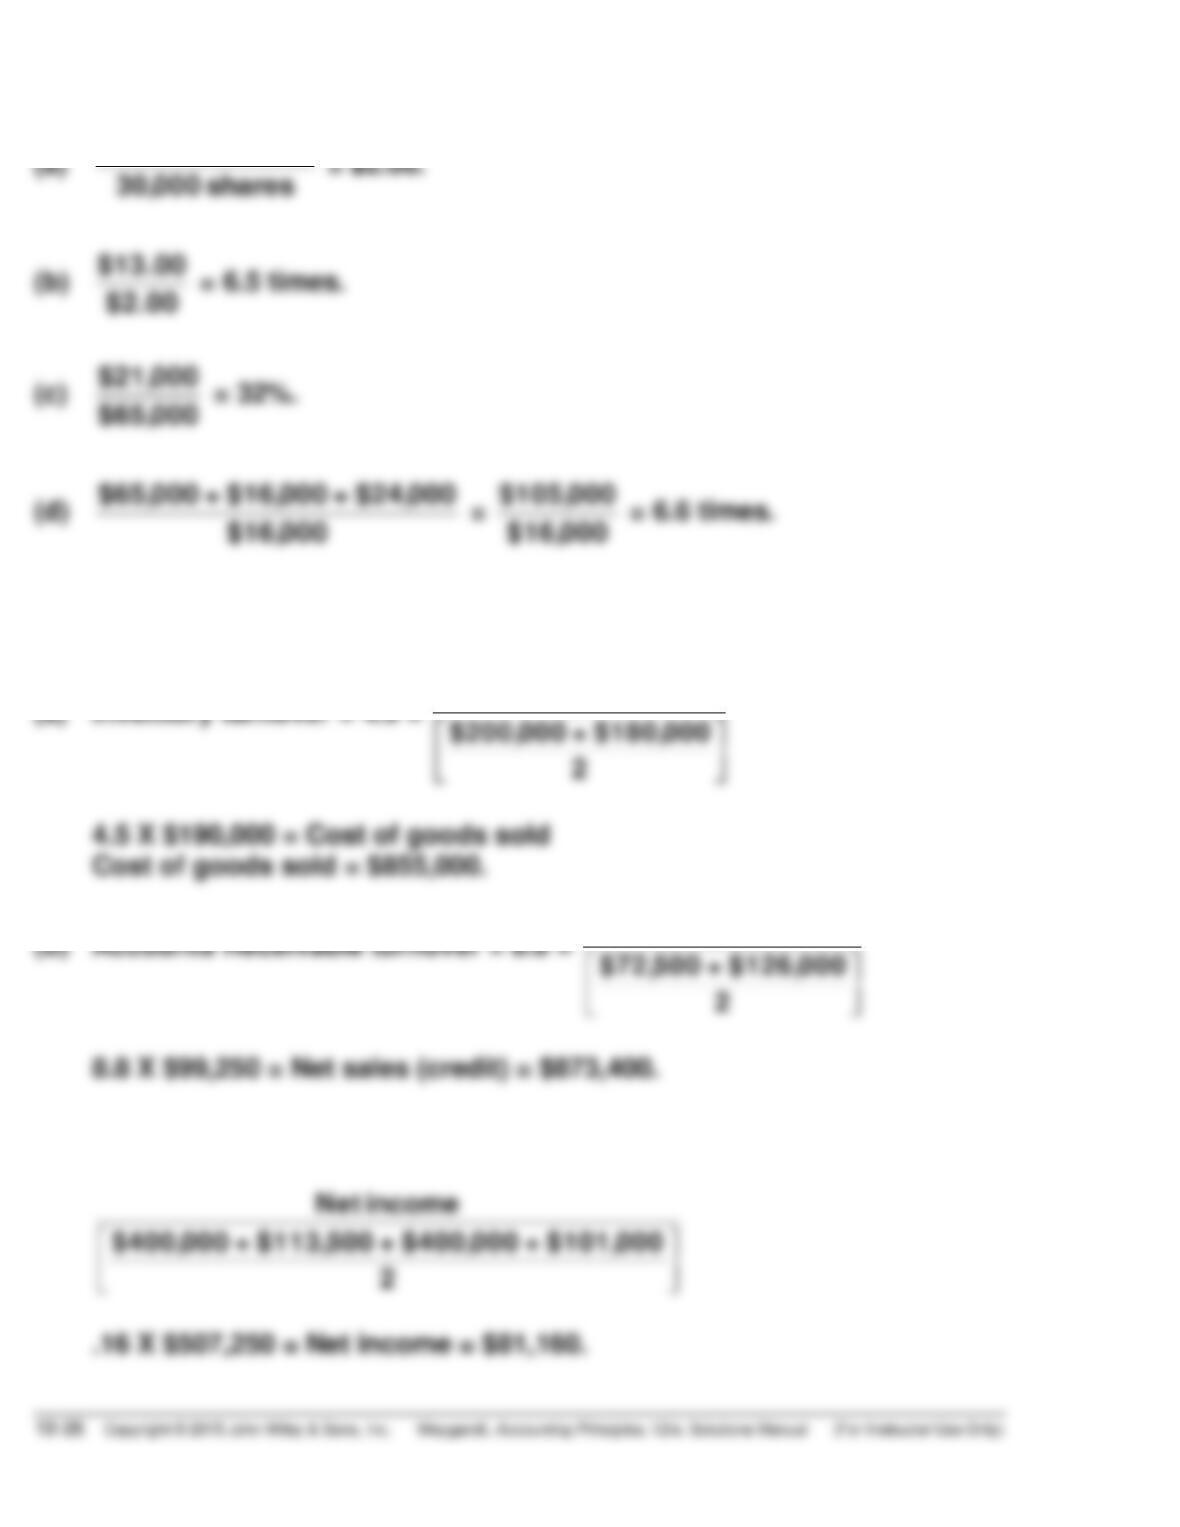
EXERCISE 18-9
$65,000 – $5,000
EXERCISE 18–10
Cost of goods sold
Net sales (credit)
(c) Return on common stockholders’ equity = 16% =
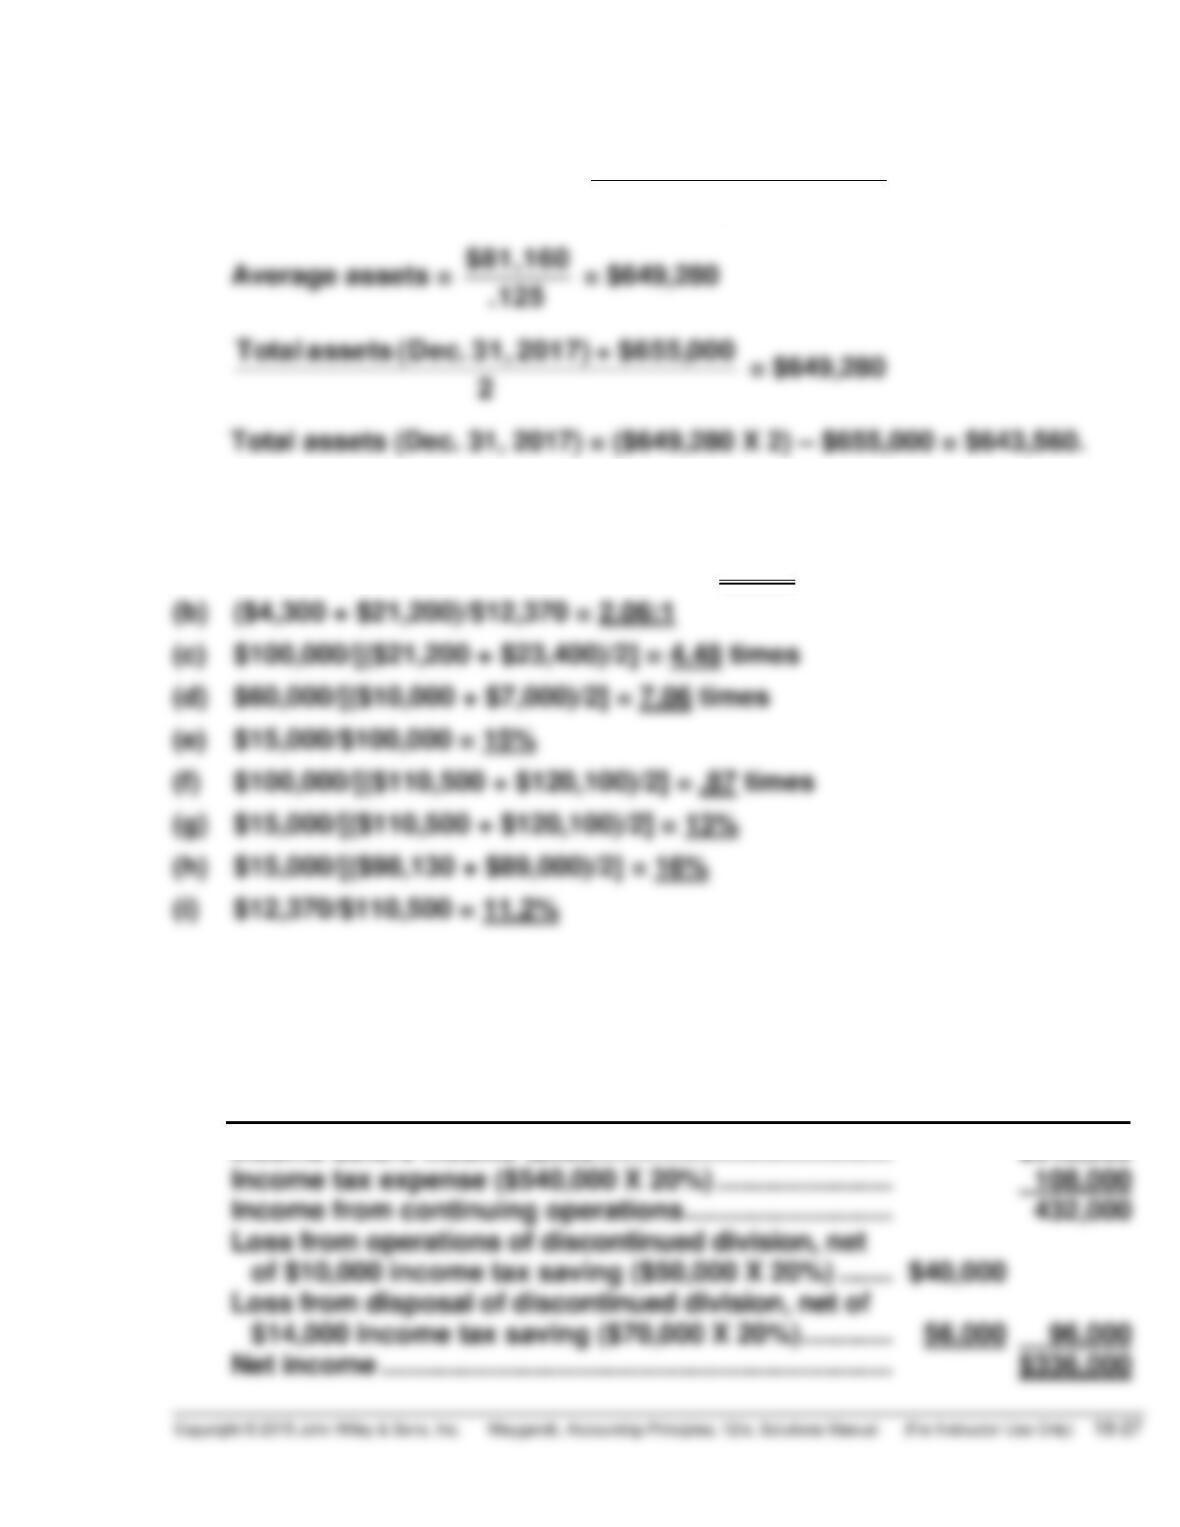
EXERCISE 18-10 (Continued)
(d) Return on assets = 12.5% =
$81,160 [see (c) above]
Average assets
EXERCISE 18–11
(a) ($4,300 + $21,200+ $10,000)/$12,370 = 2.87:1
EXERCISE 18–12
(a) HAAS CORPORATION
Partial Income Statement
For the Year Ended October 31, 2017
Income before income taxes ………………………………… $540,000
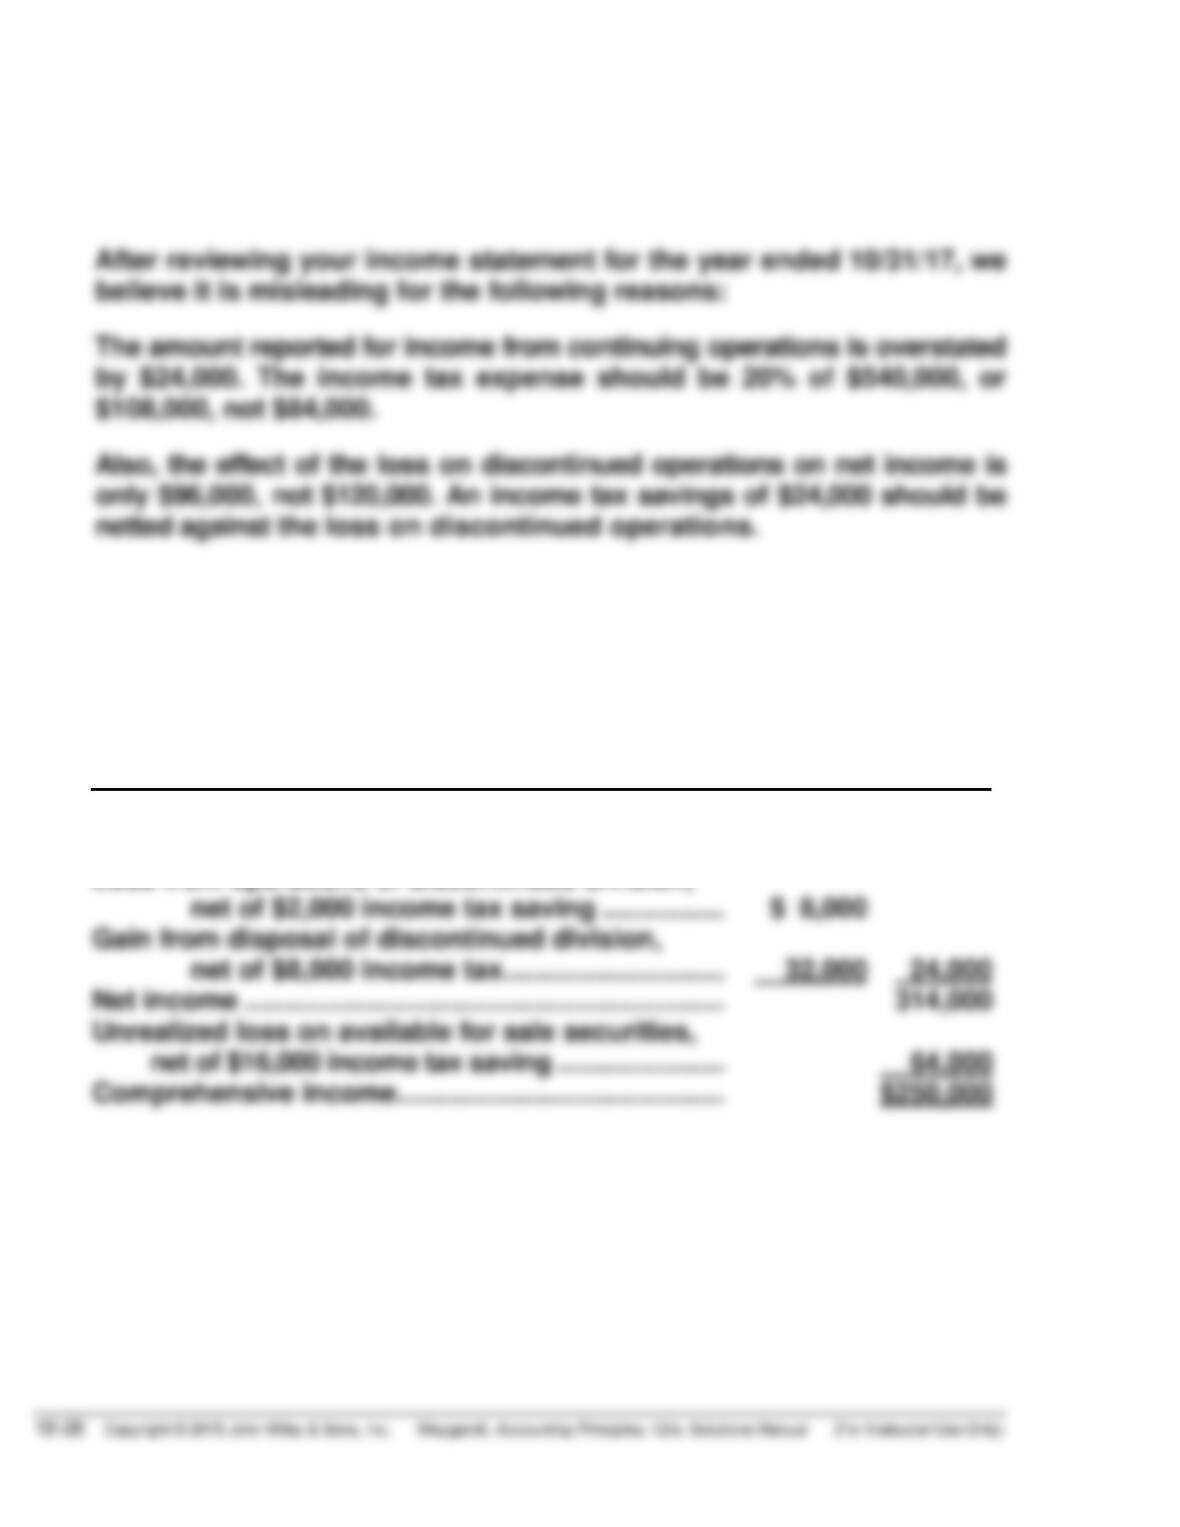
EXERCISE 18-12 (Continued)
(b) To: Chief Accountant
From: Your name, Independent Auditor
EXERCISE 18–13
TRAYER CORPORATION
Partial Statement of Comprehensive Income
For the Year Ended December 31, 2017
Income from continuing operations ………………….. $290,000
Discontinued operations
Loss from operations of discontinued division,
SOLUTIONS TO PROBLEMS
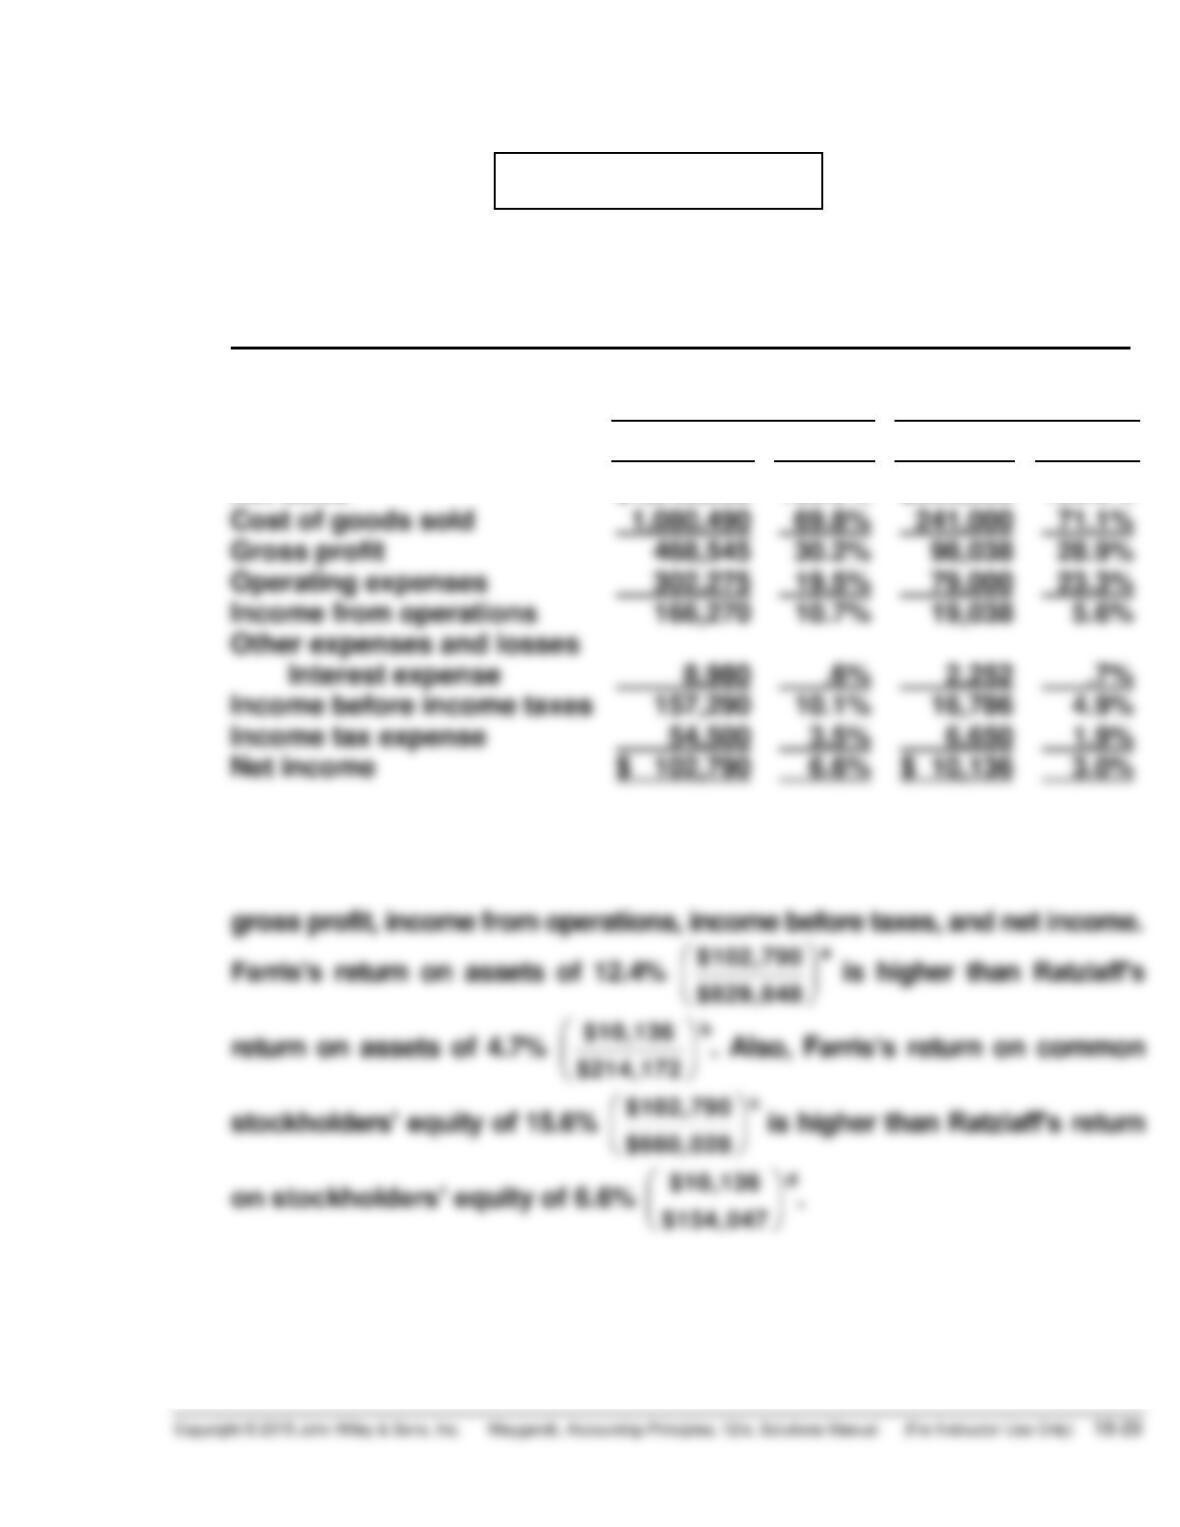
PROBLEM 18-1
(a) Condensed Income Statement
For the Year Ended December 31, 2017
Farris Company
Ratzlaff
Company
Dollars
Percent
Dollars
Percent
Net sales
$1,549,035
100.0%
$339,038
100.0%
(b) Farris Company appears to be more profitable. It has higher relative
PROBLEM 18-1 (Continued)
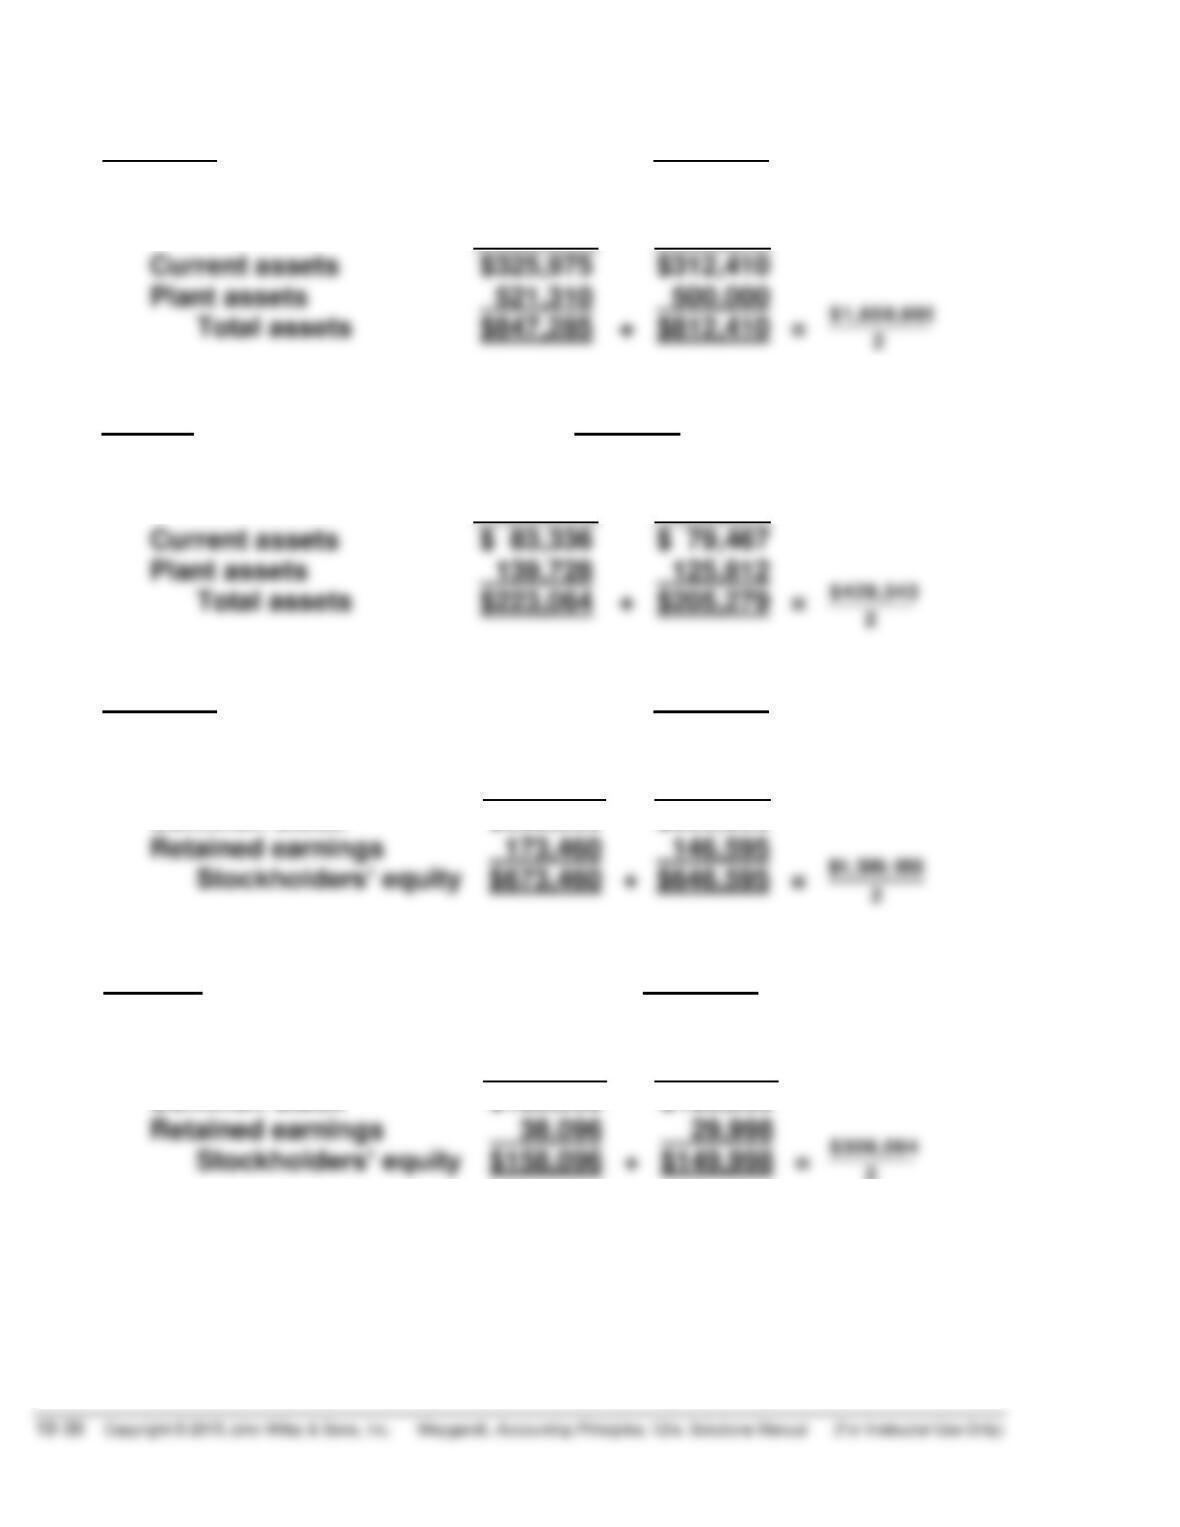
a$102,790 is Farris’s 2017 net income. $829,848 is Farris’s 2017
average assets:
2017
2016
b$10,136 is Ratzlaff’s 2017 net income. $214,172 is Ratzlaff’s 2017 average
assets:
2017
2016
2
c$102,790 is Farris’s 2017 net income. $660,028 is Farris’s 2017
average stockholders’ equity:
2017
2016
Common stock
$500,000
$500,000
d$10,136 is Ratzlaff’s 2017 net income. $154,047 is Ratzlaff’s 2017
average stockholders’ equity:
2017
2016
Common stock
$120,000
$120,000
2
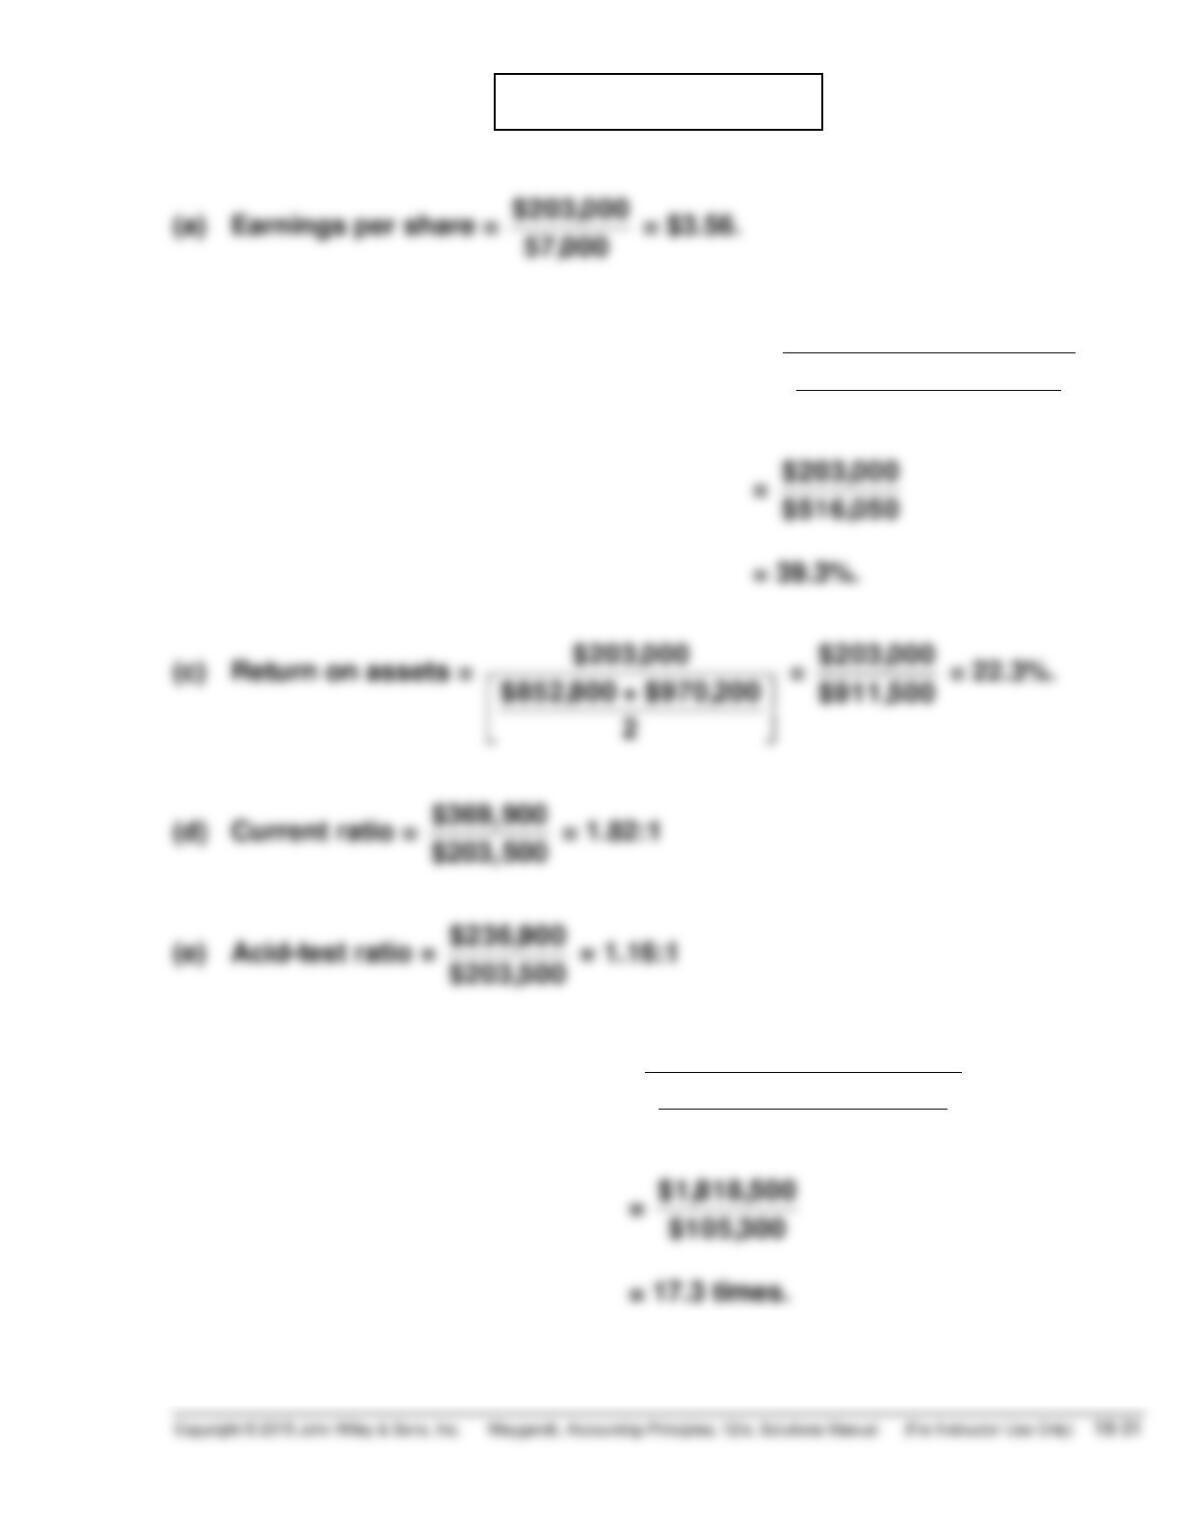
PROBLEM 18-2
(b) Return on common stockholders’ equity =
$203,000
$465,400 + $566,700
2
(f) Accounts receivable turnover =
$1,818,500
($102,800 + $107,800 )
2
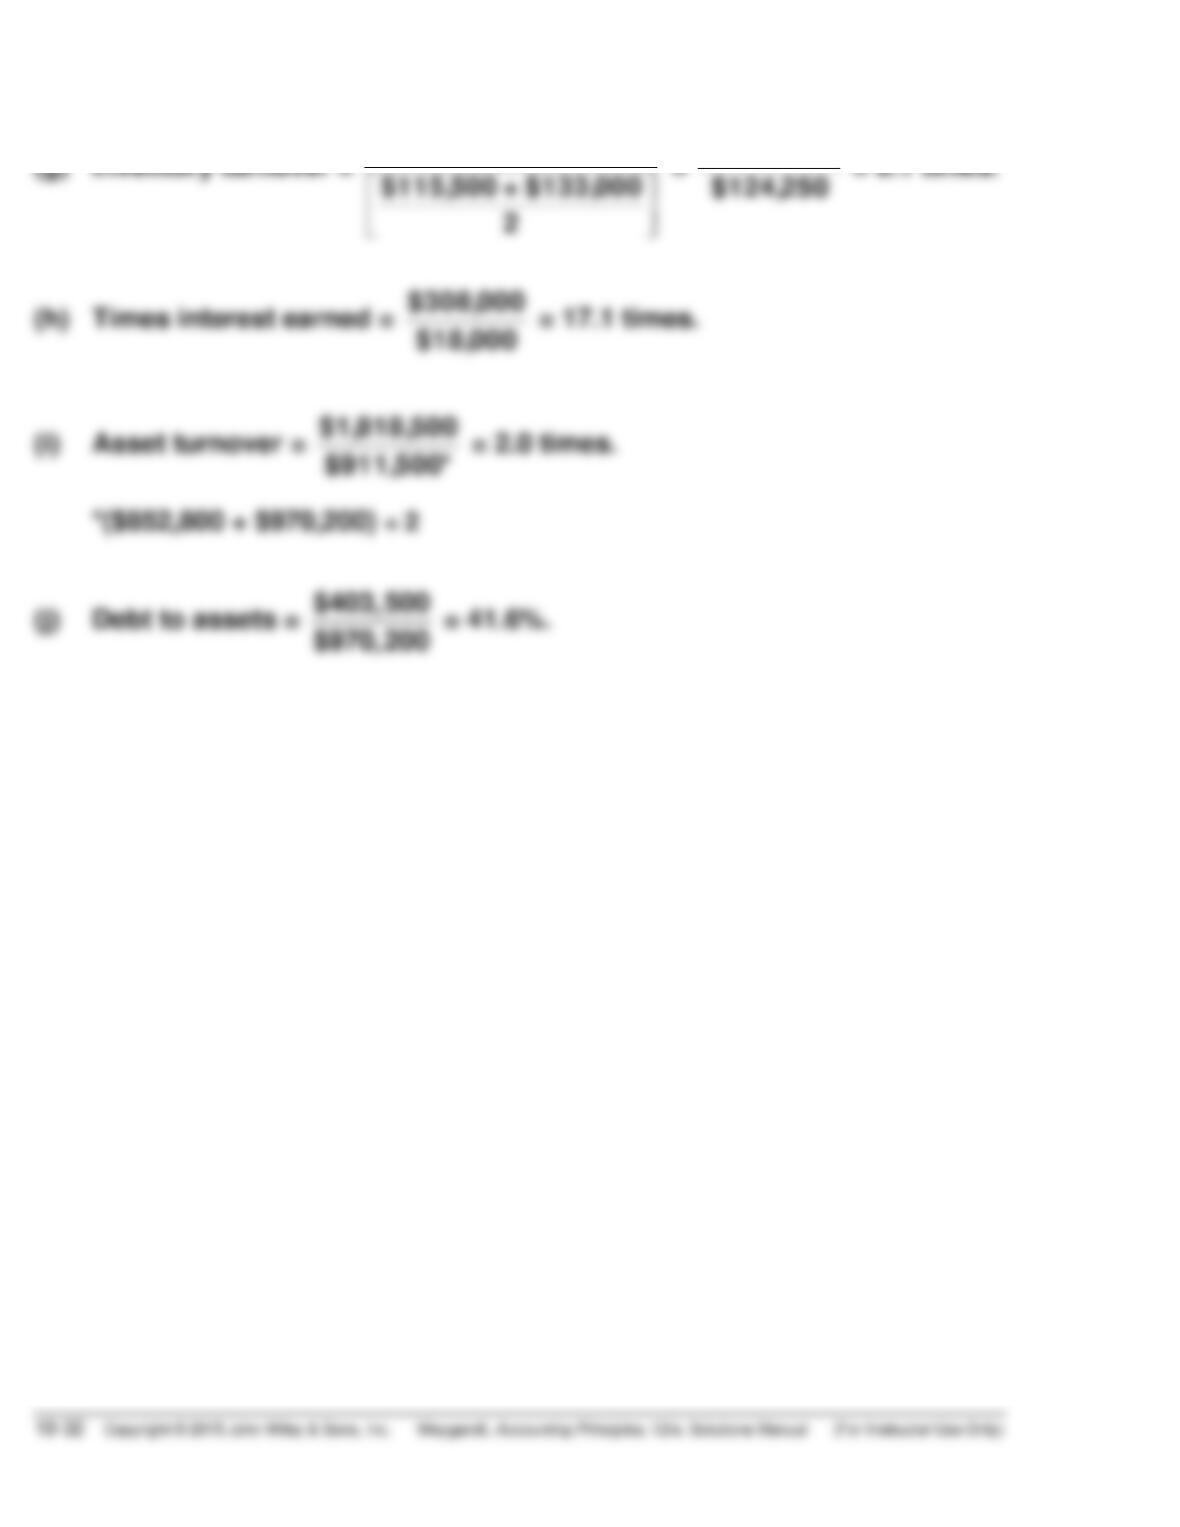
PROBLEM 18-2 (Continued)
$1,818,500
$1,011,500
$1,011,500
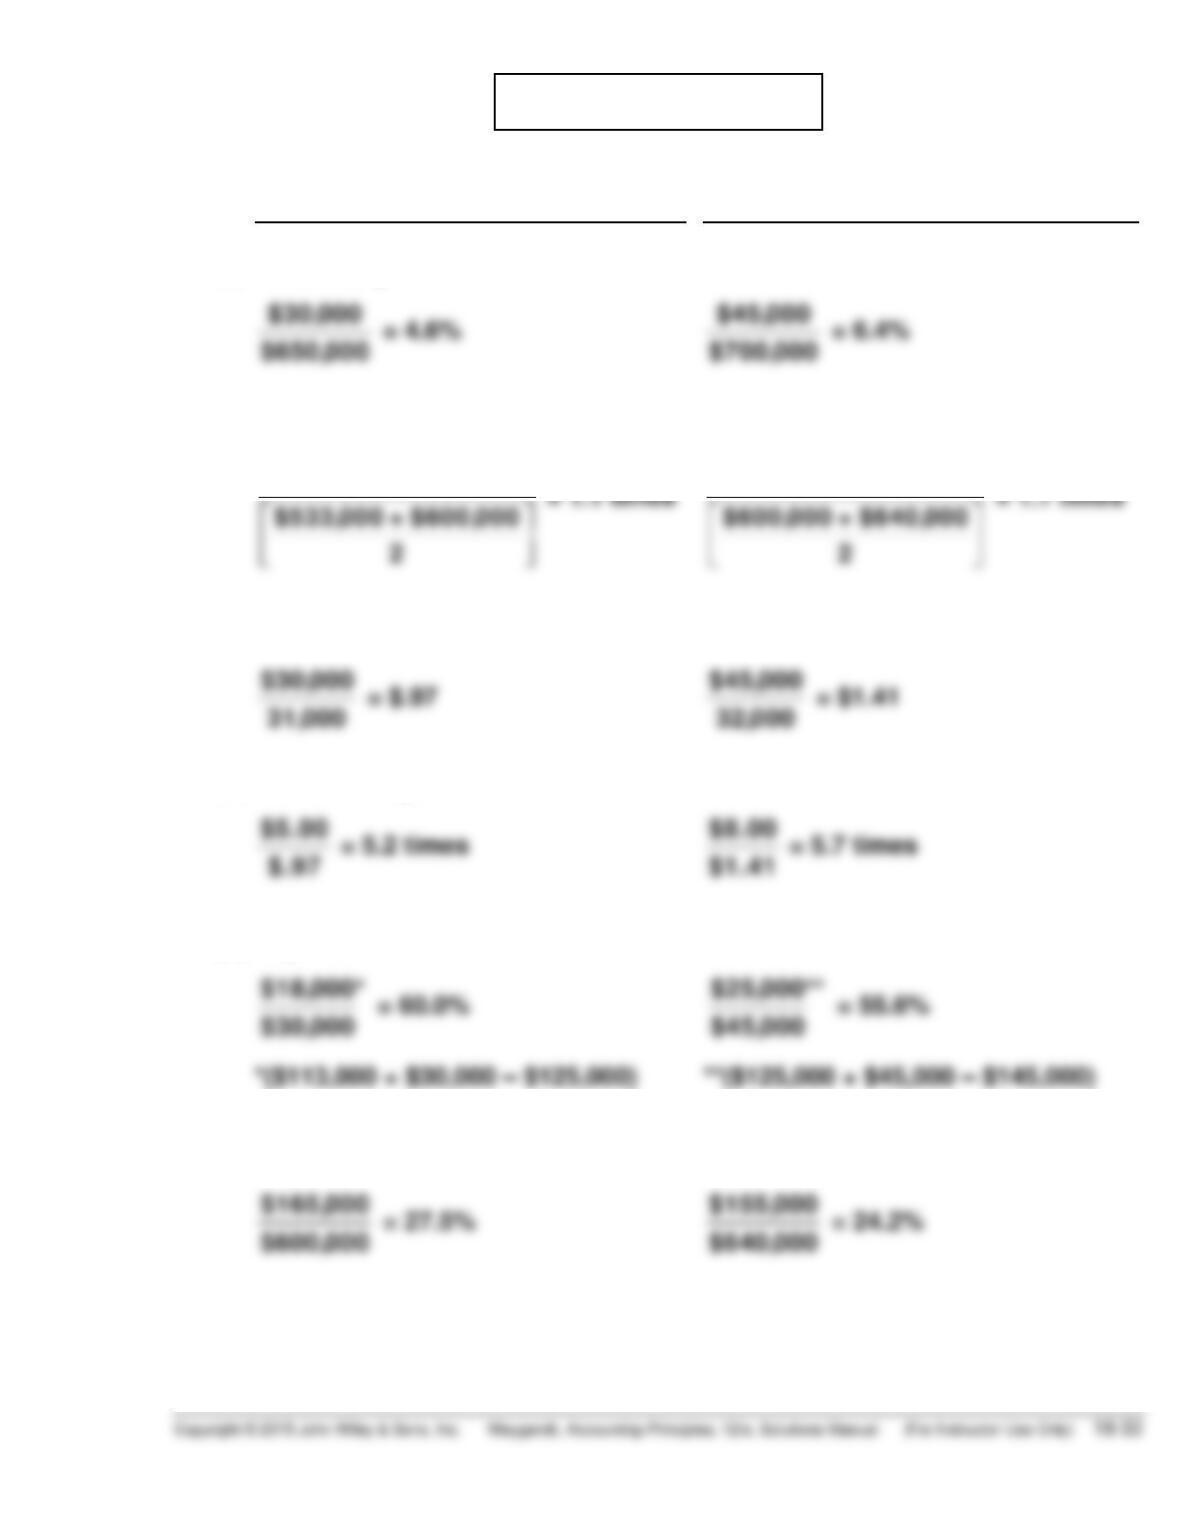
PROBLEM 18-3
(a)
2017
2018
(1)
Profit margin.
(2)
Asset turnover.
$650,000
$700,000
(3)
Earnings per share.
(4)
Price-earnings ratio.
(5)
Payout ratio.
(6)
Debt to assets.
PROBLEM 18-3 (Continued)
(b) The underlying profitability of the corporation appears to have improved.
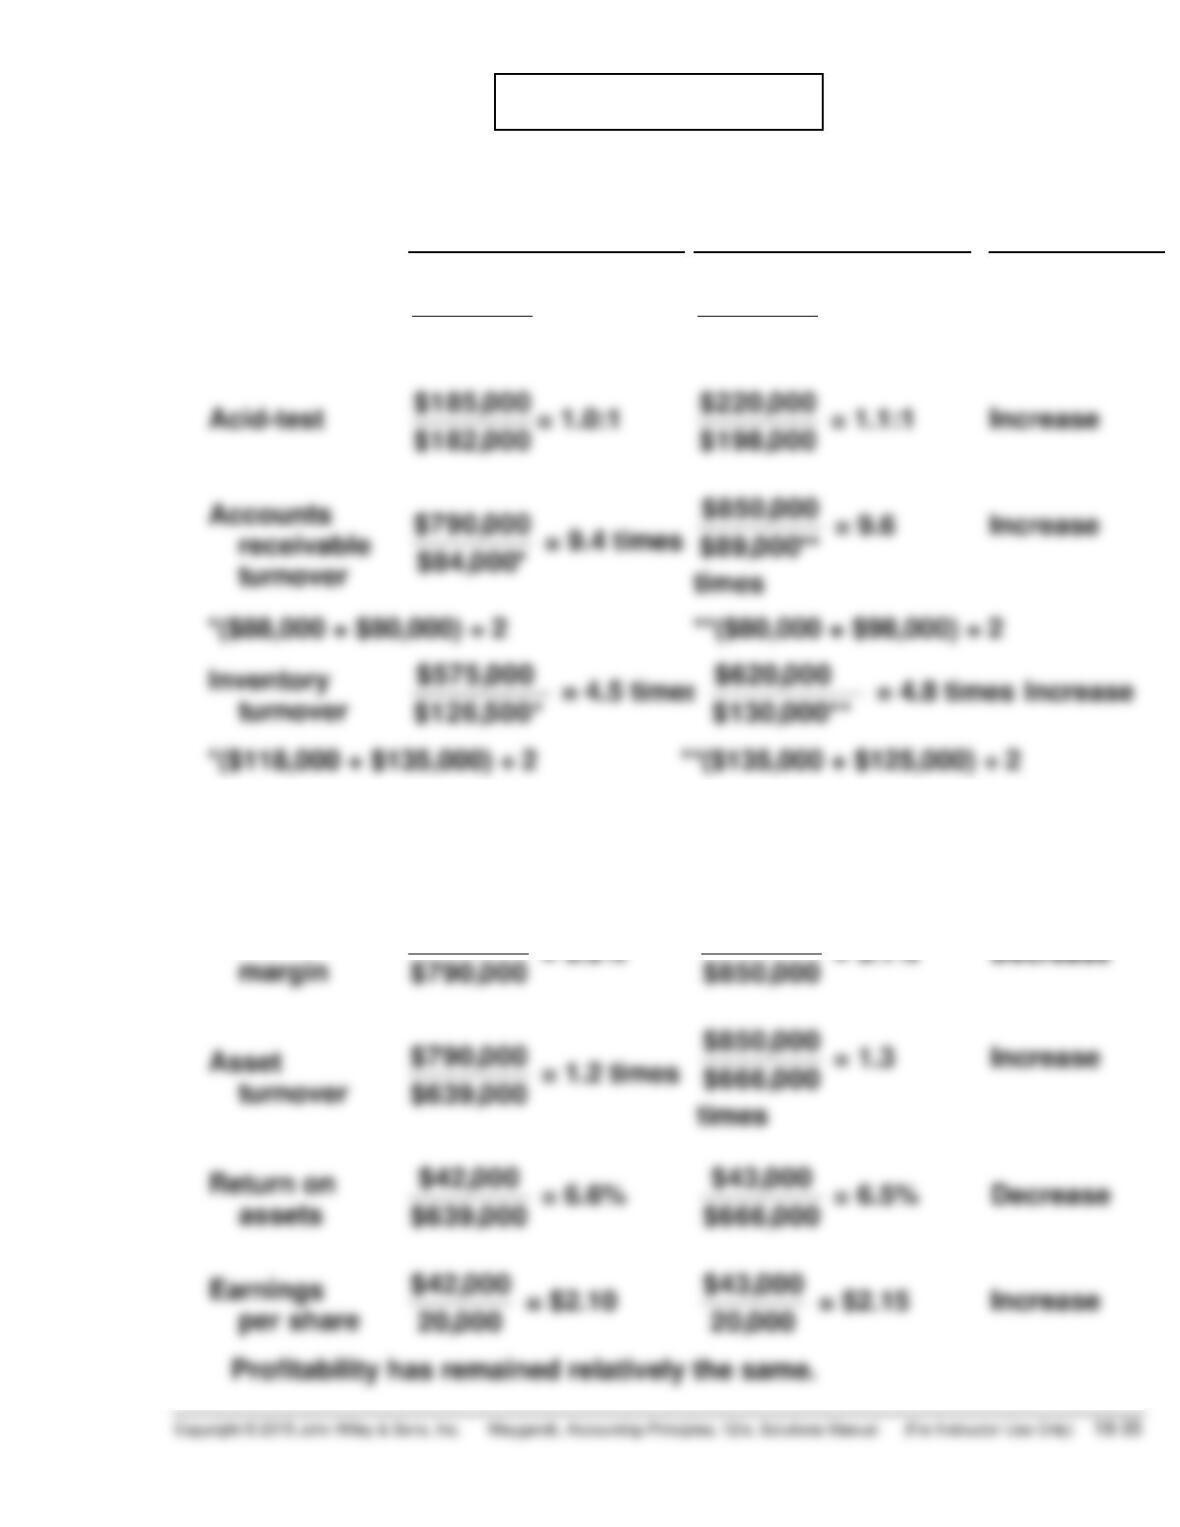
PROBLEM 18-4
(a) LIQUIDITY
2016
2017
Change
Current
$343,000
$182,000
= 1.9:1
$374,000
$198,000
=1.9:1
No change
Acid-test
$185,000
$182,000
= 1.0:1
$220,000
$198,000
= 1.1:1
Increase
$790,000
Inventory
Increase
An overall increase in short-term liquidity has occurred.
PROFITABILITY
$790,000
= 5.3%
$850,000
= 5.1%
Decrease
$790,000
$639,000
$850,000
$666,000
Return on
$42,000
$639,000
= 6.6%
$43,000
$666,000
= 6.5%
Decrease
Profit
$42,000
$43,000
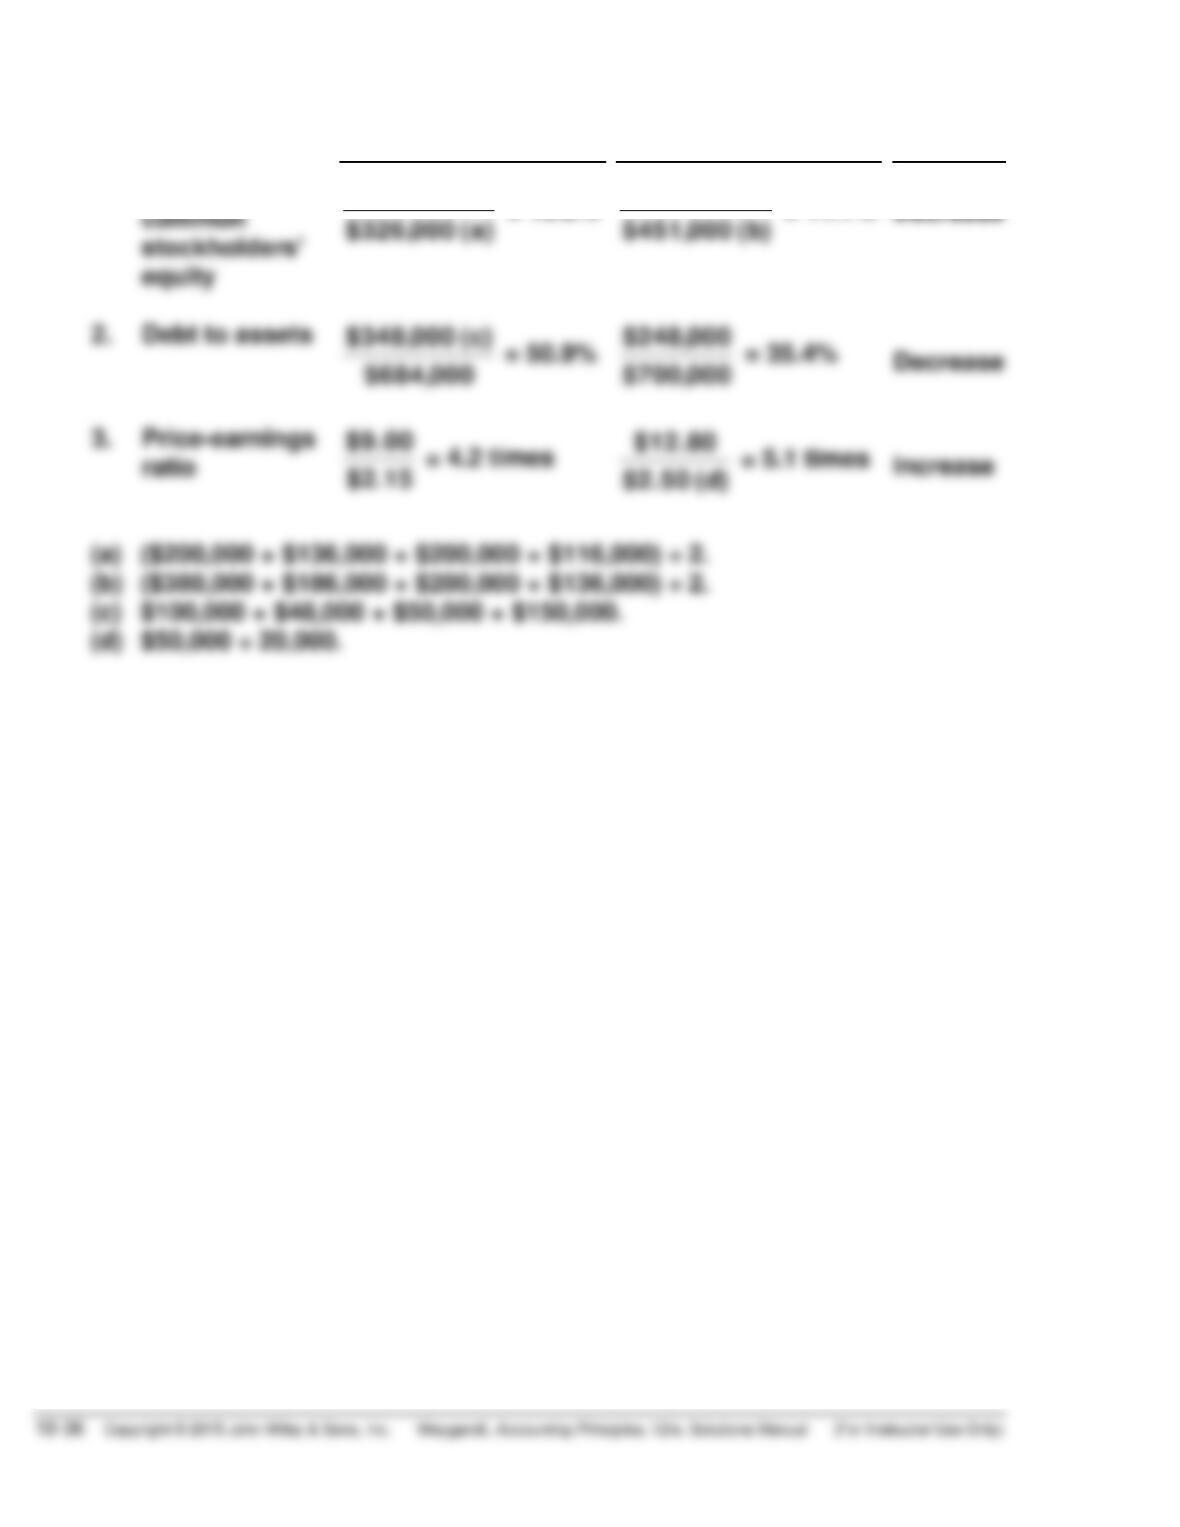
PROBLEM 18-4 (Continued)
(b)
2017
2018
Change
1.
Return on
$43,000
= 13.2%
$50,000
= 11.1%
PROBLEM 18-5
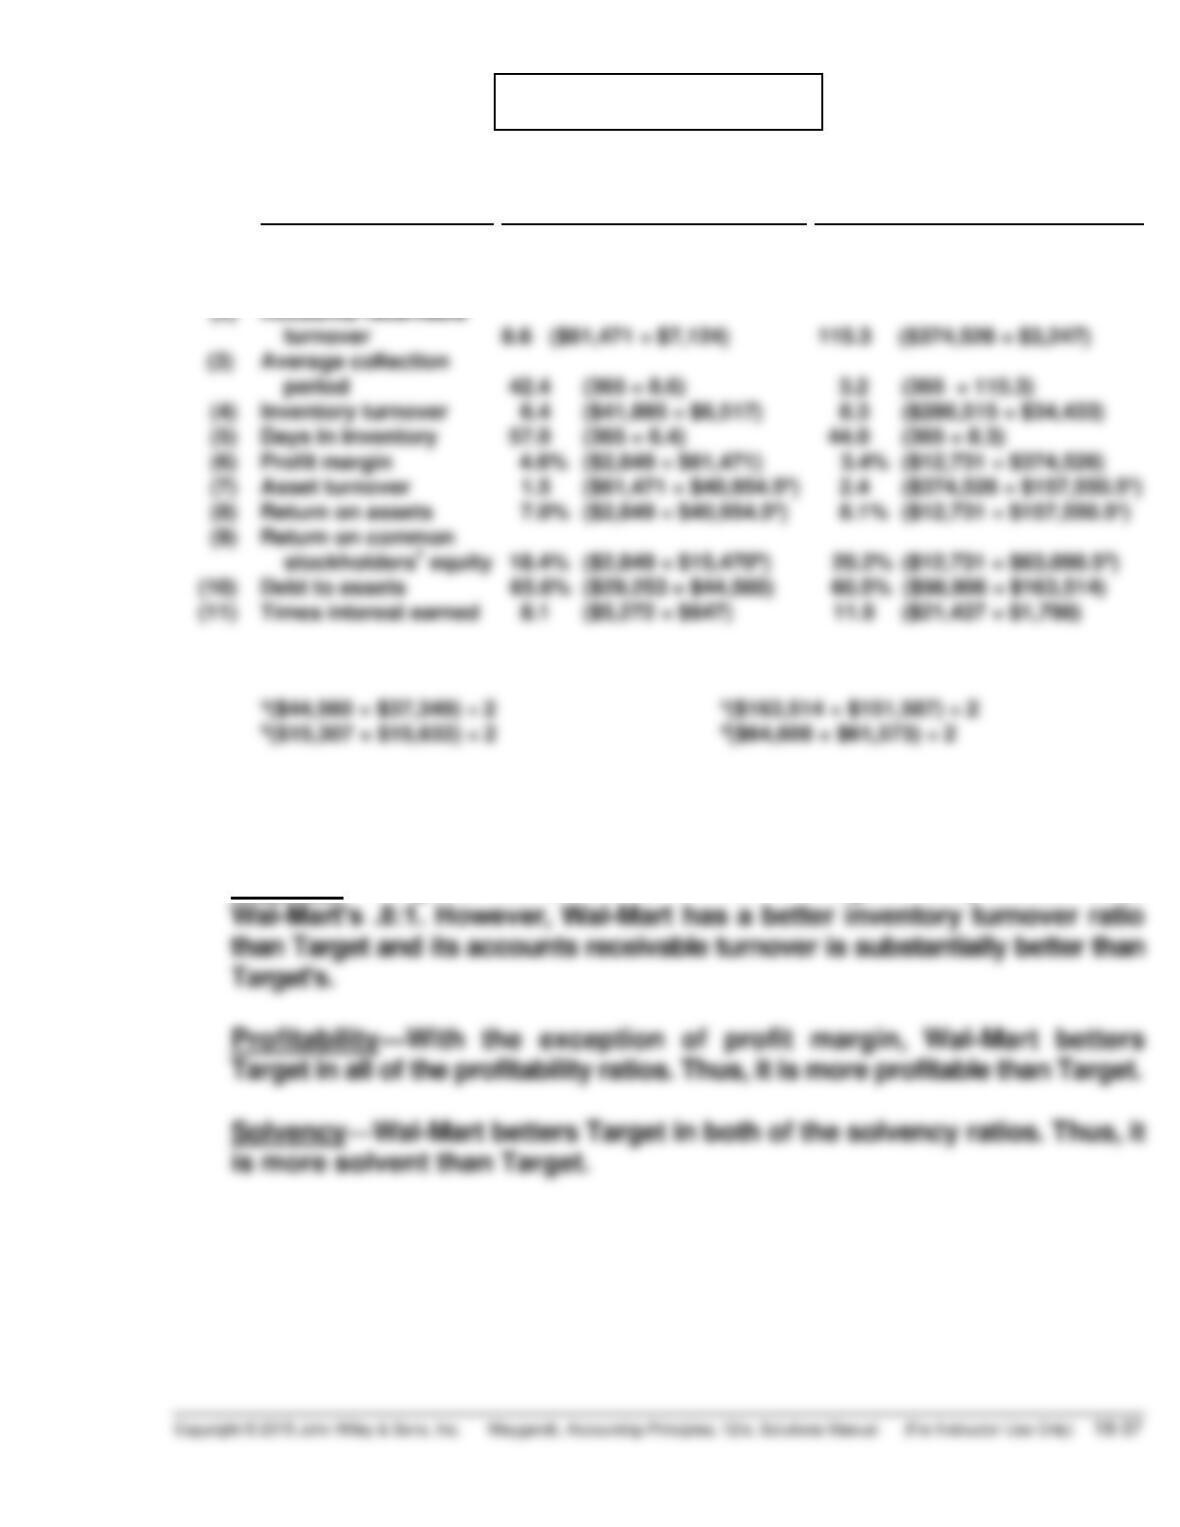
(a)
Ratio
Target
Wal-Mart
(All Dollars Are in Millions)
(1)
Current
1.6:1 ($18,906 ÷ $11,782)
.8:1 ($47,585 ÷ $58,454)
(b) The comparison of the two companies shows the following:
Liquidity—Target’s current ratio of 1.6:1 is significantly better than
PROBLEM 18-6
$215,000