Chapter 18
Cost Behavior and
Cost-Volume-Profit Analysis
QUESTIONS
1. A variable cost is one that varies proportionately with the volume of activity. For
example, direct materials and direct labor (when the workers are paid for completed
units) are treated as variable costs with respect to the number of units produced.
2. Variable costs per unit stay the same (remain constant) when output volume
changes. This is because each unit consumes the same amount of variable costs
within the relevant range of activity.
3. Fixed costs per unit decrease when output volume increases. This is because the
total amount of fixed costs remains the same while it is being divided among more
units within the relevant range of activity.
4. Cost-volume-profit analysis is especially useful in the planning phase for a
business. This phase involves predicting the volume of sales activity, the costs to
be incurred, revenues to be received, and profits to be earned. It is also useful in
what-if (sensitivity) analysis.
10. The first is that although individual costs classified as fixed or variable might not
behave precisely in those patterns, some variations of individual components in the
group of fixed or variable costs may tend to offset each other. The second is that
management might reasonably assume that costs are either fixed or variable within
the relevant range of operations (or at least the period under analysis).
11. By assuming a relevant range for operating activity, management can more
justifiably assume either fixed or variable relations between costs and volume, and
between revenue and volume. The assumption also helps limit the consideration of
alternative strategies to those that call for volume levels that fall within the relevant
range.
12. Three common methods for measuring cost behavior are: the scatter diagram, the
high-low method, and least-squares regression.
13. A scatter diagram is used to display the relation between past costs and sales
volumes. Management then uses the scatter diagram to identify and measure the
fixed and variable components of the cost being graphed.
14. At break-even, profits are zero. Break-even is the point where sales equals fixed
plus variable costs.
15. This line represents total cost, which equals the sum of the fixed and variable costs
at all volume levels within the company’s current capacity (relevant range). (Note:
The total cost line consists of mixed costs.)
16. Fixed costs are depicted as a horizontal line on a CVP chart because they remain the
same (constant) at all volume levels within the relevant range.
17. Company A has a contribution margin of 50% [($20,000 – $10,000) / ($20,000)] and
Company B has a contribution margin of 80% [($20,000 – $4,000) / ($20,000)]. This
means Company B will make more profit on each additional dollar of sales
compared to Company A. This is also seen by looking at operating leverage (fixed
costs/total costs). Company B’s operating leverage is higher.
18. Margin of safety reflects the expected sales in excess of the level of break-even
sales.
22. If units produced equals units sold, no conversion is necessary. If production
exceeds sales, absorption costing income can be determined by adding [increase in
QUICK STUDIES
Quick Study 18-1 (10 minutes)
Series 1 Variable cost Series 3 Step-wise cost
Series 2 Fixed cost Series 4 (Mixed) Curvilinear cost
Quick Study 18-2 (10 minutes)
1. Variable 4. Variable 7. Fixed
Quick Study 18-3 (10 minutes)
Variable costs = = $25 per unit produced
Using the low point, $3,600 = ($25/unit x 60 units) + fixed cost
Therefore, fixed cost = $2,100
Quick Study 18-4 (15 minutes)
2. If 3,000 units are produced, total maintenance costs would be about
$8,000, thus more than $6,000.
Quick Study 18-5 (10 minutes)
$8,100 – $3,600
240 – 60
1. Contribution margin per unit = $90 – $36 = $54
2. Break-even point in units = = 3,000 units
Quick Study 18-7 (10 minutes)
1. I 4. I
Quick Study 18-8 (10 minutes)
1. Contribution margin ratio = = 60%
Quick Study 18-9 (5 minutes)
Quick Study 18-10 (5 minutes)
Break-even point in units = $354,000 / ($175 – $116) = 6,000 units
$162,000
$54
$54
$90
Quick Study 18-11 (10 minutes)
Sales at expected level (10,000 x $175) ………………………………………
$1,750,000
Sales at break-even level (6,000 x $175) …………………………………….
1,050,000
Margin of safety (in dollars) ……………………………………………………..
Quick Study 18–12 (10 minutes)
ZHAO CO.
Contribution Margin Income Statement (at Expected Sales Level)
For Year Ended December 31, 2019
Sales (10,000 x $175) ………………………………………………………………..
$1,750,000
Variable costs (10,000 x $116) …………………………………………………..
1,160,000
Fixed costs ……………………………………………………………………………..
354,000
Quick Study 18-13 (5 minutes)
Unit sales at target income = $354,000 + $118,000 = 8,000 units
$59
Quick Study 18-14 (10 minutes)
Break-even point in composite units = $105,000 / $125 = 840 composite units
Number of products sold at break-even: 840 x 8 = 6,720 products
Quick Study 18-15 C (10 minutes)
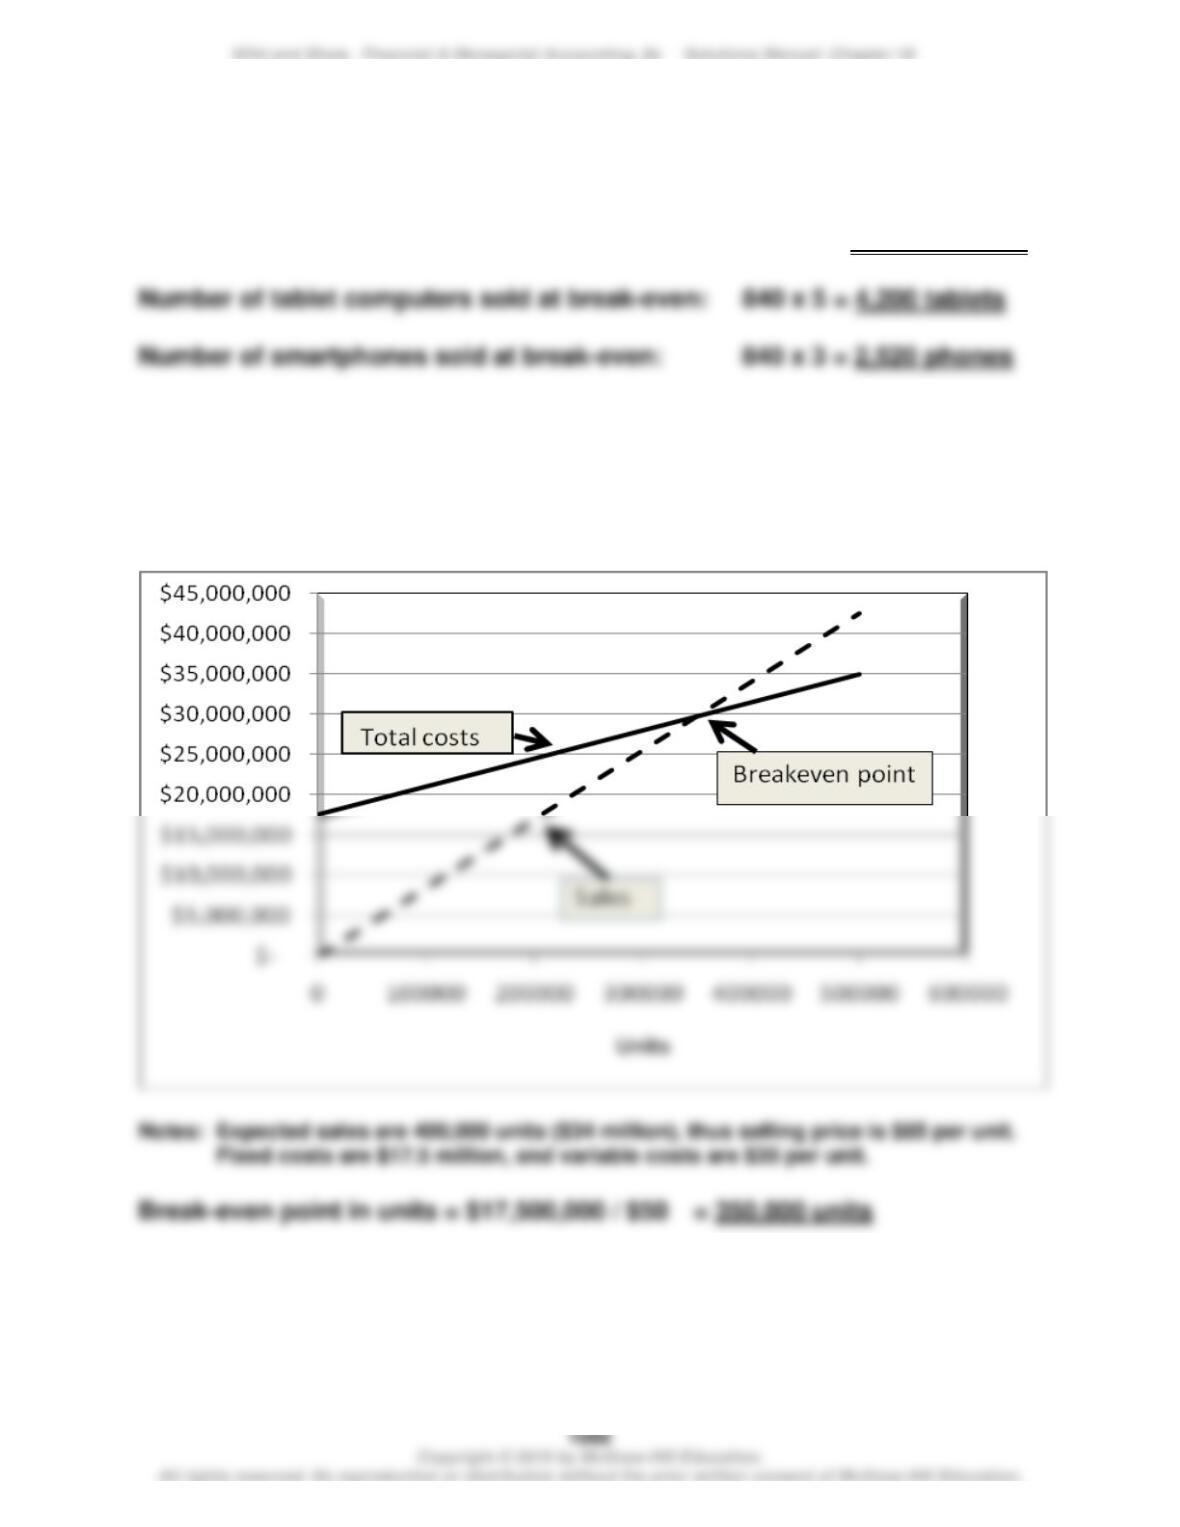
CVP Chart
Quick Study 18–16 (10 minutes)
1.
Contribution margin ………………………………………………………………..
$960,000
Fixed costs ……………………………………………………………………………..
720,000
Income (pretax) ……………………………………………………………………….
$240,000
Degree of operating leverage = $960,000/$240,000 = 4.0
Quick Study 18–17 B (10 minutes)
Cost per unit using absorption costing
Per unit
Direct materials…………………………………………
$10
20
Variable overhead………………………………………
10
Total product cost per unit………………………..…..
$48
Quick Study 18–18 B (10 minutes)
Cost per unit using variable costing
Per unit
Direct materials…………………………………………
$10
Direct labor………………………………………………
20
Variable overhead………………………………………
Total product cost per unit……………………………
$40
Quick Study 18–19B (15 minutes)
ACES INC.
Variable Costing Income Statement
Sales (4,900 units x $90 per unit)………………..
$441,000
Variable expenses
Var. production costs (4,900 units x $25)………
$122,500
Var. selling and admin. expense (4,900 x $2)…
9,800
Total variable expenses…………………………..
132,300
Fixed expenses
Fixed overhead…………………..
Fixed selling and administrative expenses……
65,200
Total fixed expenses……………………………….
143,200
Quick Study 18–20 B (10 minutes)
ACES INC.
Absorption Costing Income Statement
Sales (4,900 units x $90 per unit)………………………
$441,000
Cost of goods sold (4,900 units x $38 per unit*)…….
186,200
Gross margin……………………………………………….
$254,800
Selling and administrative expenses
Variable (4,900 units x $2 per unit)………………….
9,800
Fixed………………………………………………………
65,200
Quick Study 18-21 (10 minutes)
BMW Automotive Group
Contribution Margin Statement (in € millions)
Sales …………………………..……………………………………………………….
€92,175.00
Variable costs:
Variable cost of goods sold (€74,043 x 75%) …………………………..
55,532.25
EXERCISES
Exercise 18-1 (15 minutes)
1. Graph #1 Variable cost
Graph #2 Fixed cost
2. a. Graph #5
b. Graph #2
Exercise 18-2 (10 minutes)
1. A
2. E
3. B
Exercise 18-3 (15 minutes)
Series A Variable cost
Series B Mixed cost
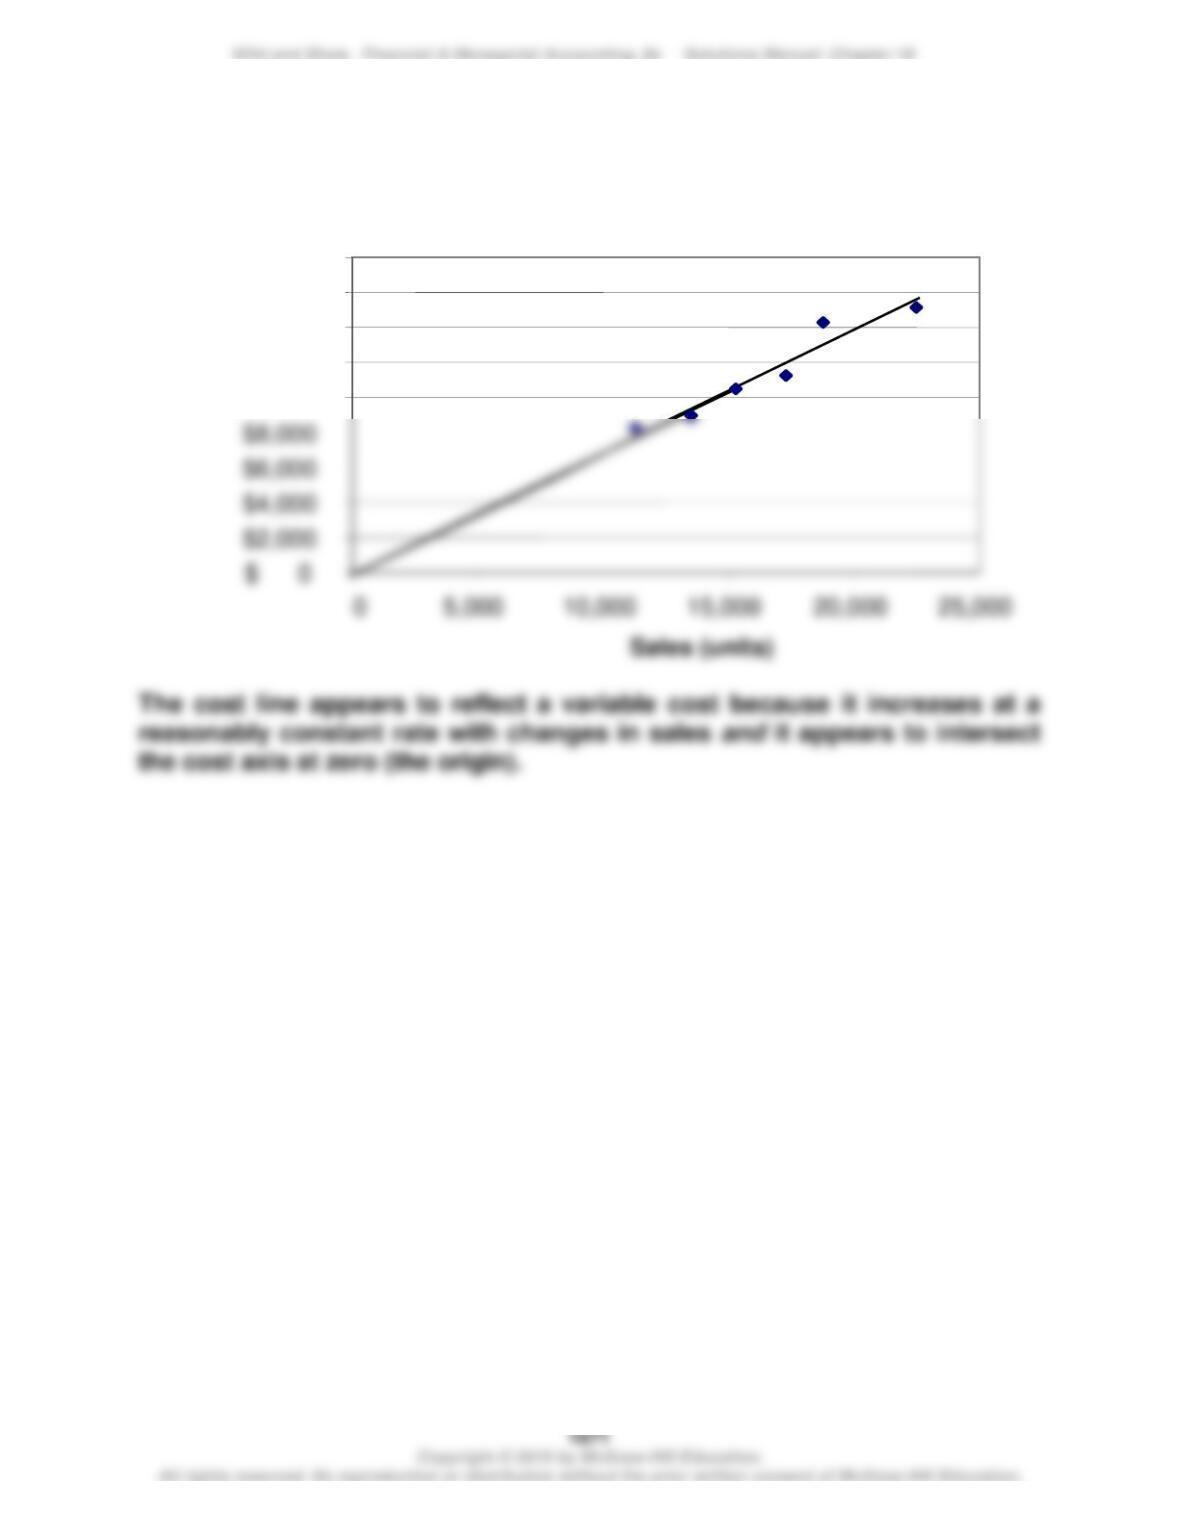
Exercise 18-4A (20 minutes)
The scatter diagram and its estimated line of cost behavior appear below.
$8,000
$10,000
$12,000
$14,000
$16,000
$18,000
Cost of sales
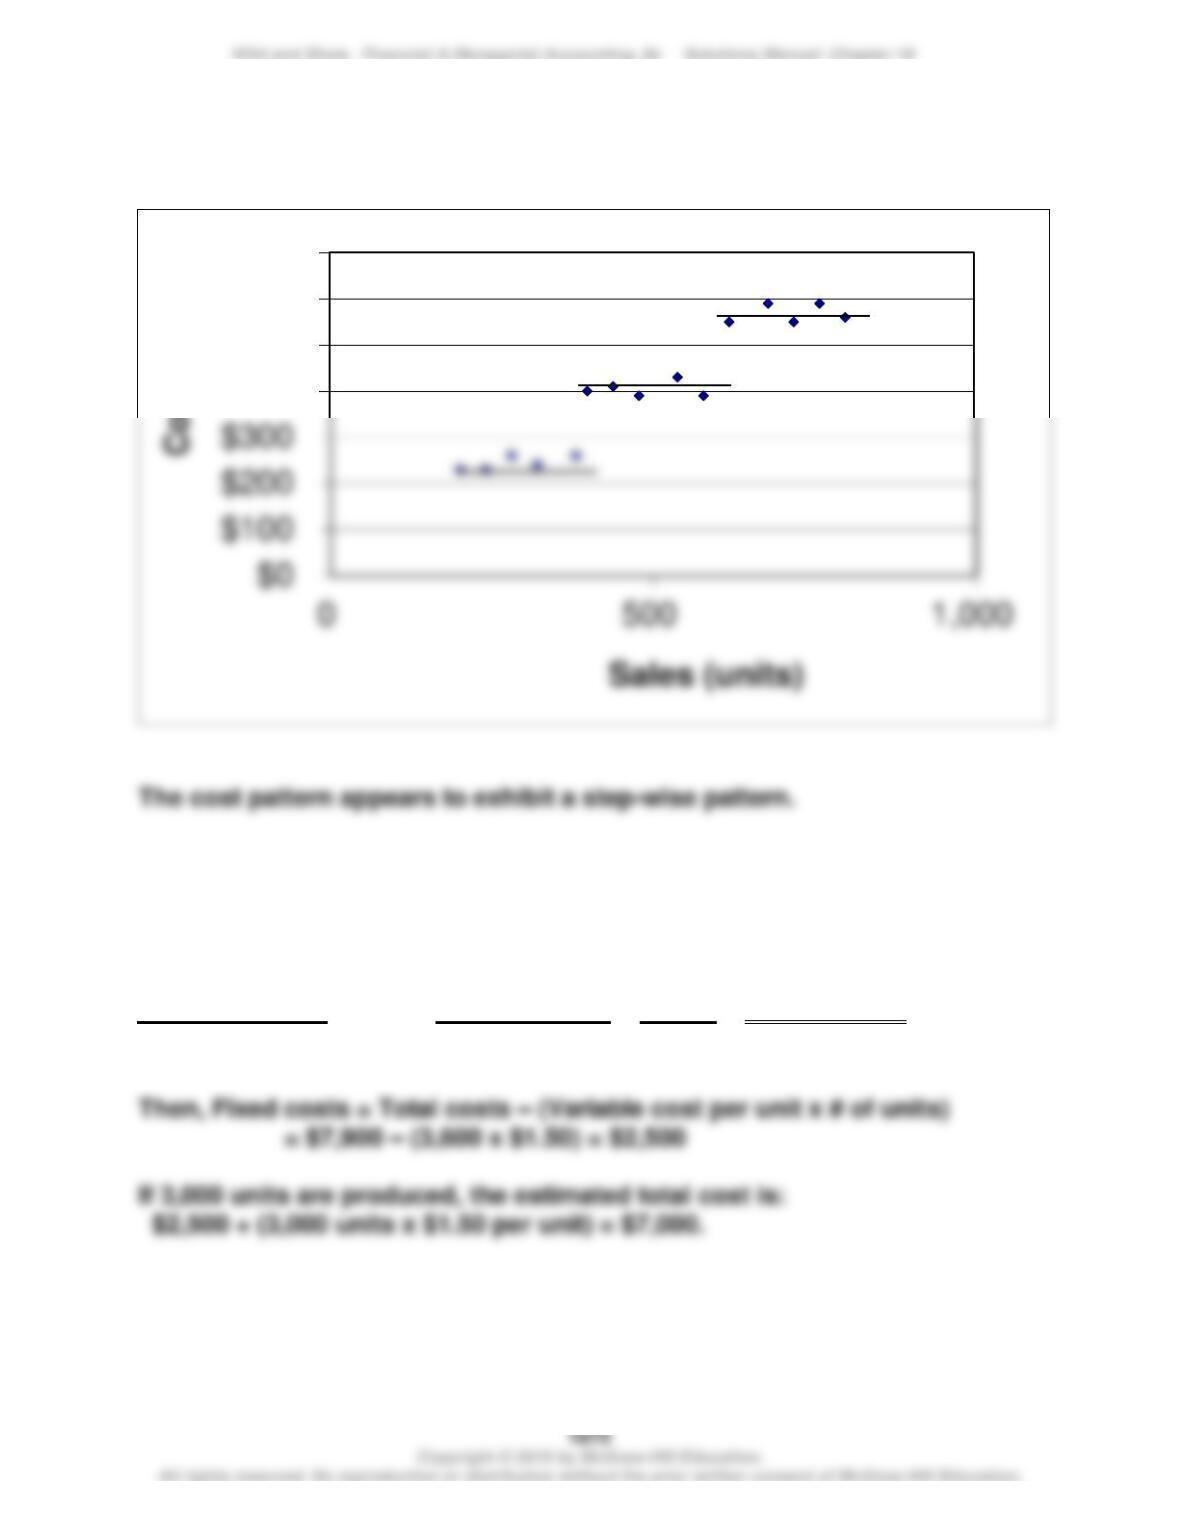
Exercise 18-5A (20 minutes)
The scatter diagram and its estimated line of cost behavior appear below.
Exercise 18-6 (20 minutes)
Using the high-low method yields variable costs per unit of:
Change in cost = $7,900 – $2,500 = $5,400 = $1.50 per unit
Change in units 3,600 – 0 3,600
$400
$500
$600
$700
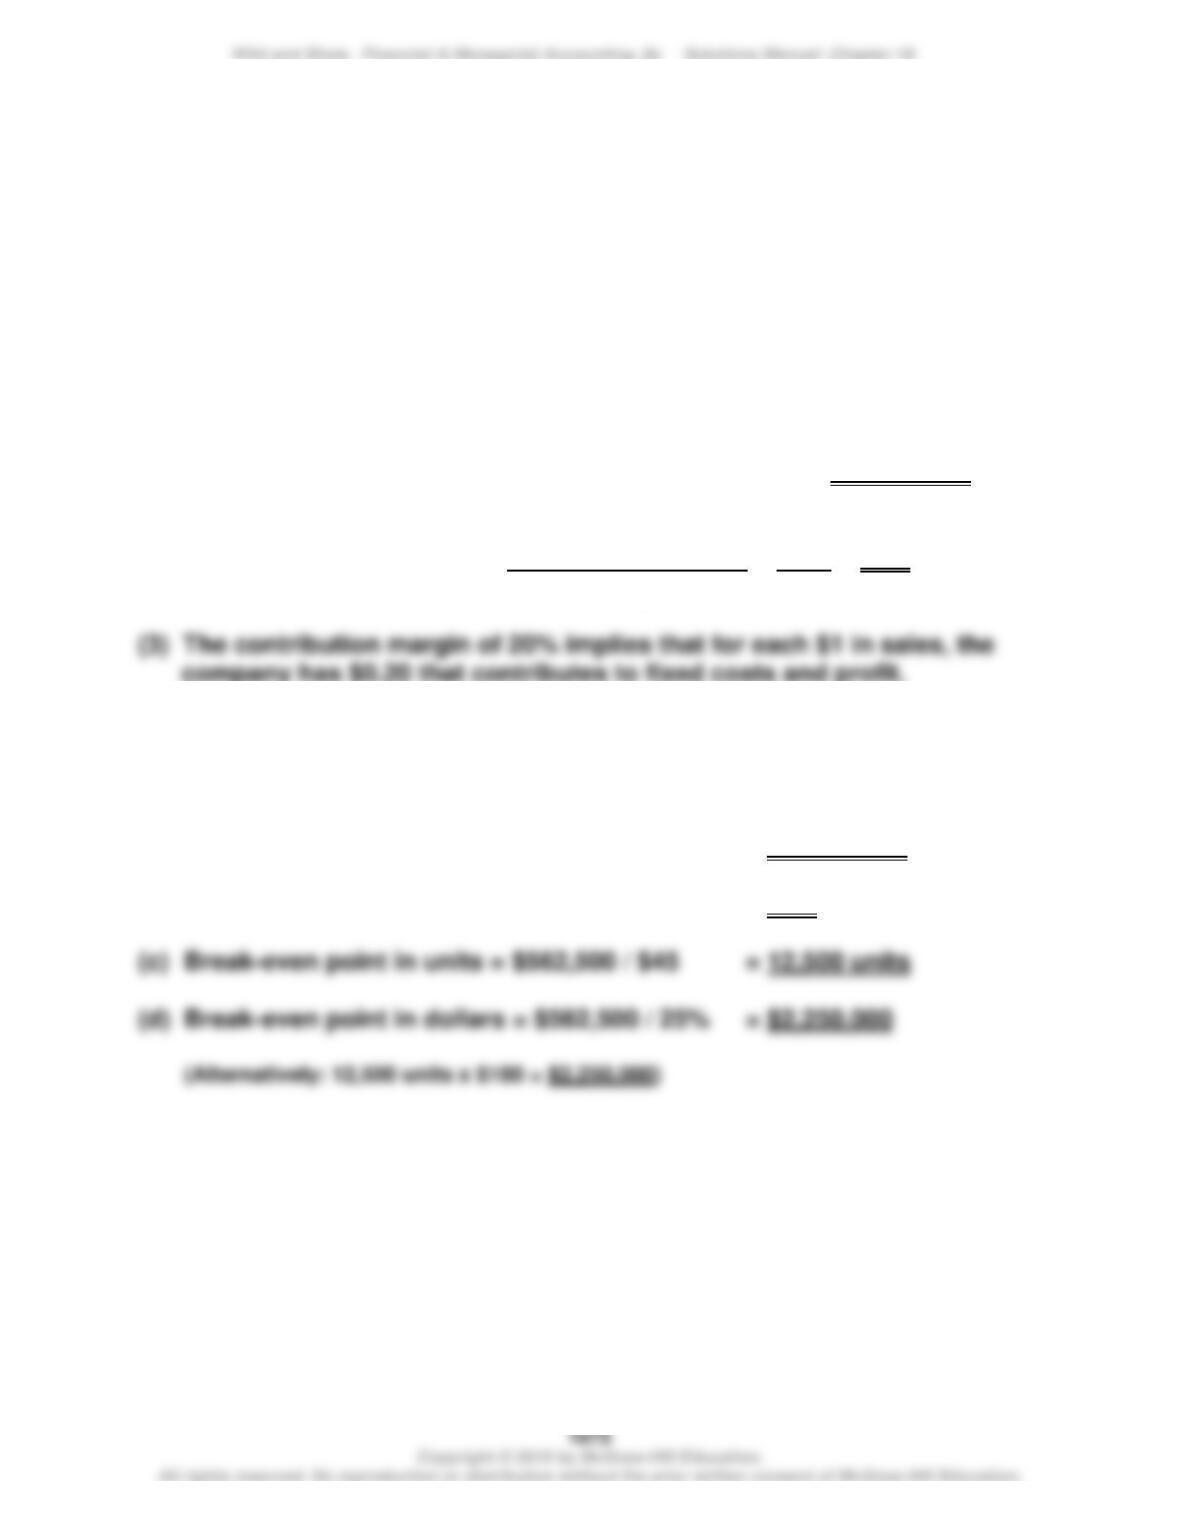
Exercise 18-7A (20 minutes)
Using Excel® to estimate an ordinary least squares regression yields an
intercept of $2,500 and a slope of $1.50.
The cost equation is thus $2,500 plus $1.50 per unit produced.
Exercise 18-8 (10 minutes)
(1) Contribution margin = Selling price – Variable costs
= $205 – $164 = $41 per unit
(2) Contribution margin ratio = Contribution margin = $41 = 20%
Sales price $205
Exercise 18-9 (30 minutes)
(a) Contribution margin per unit = $180 – $135 = $45 per unit
(b) Contribution margin ratio = $45 / $180 = 25%
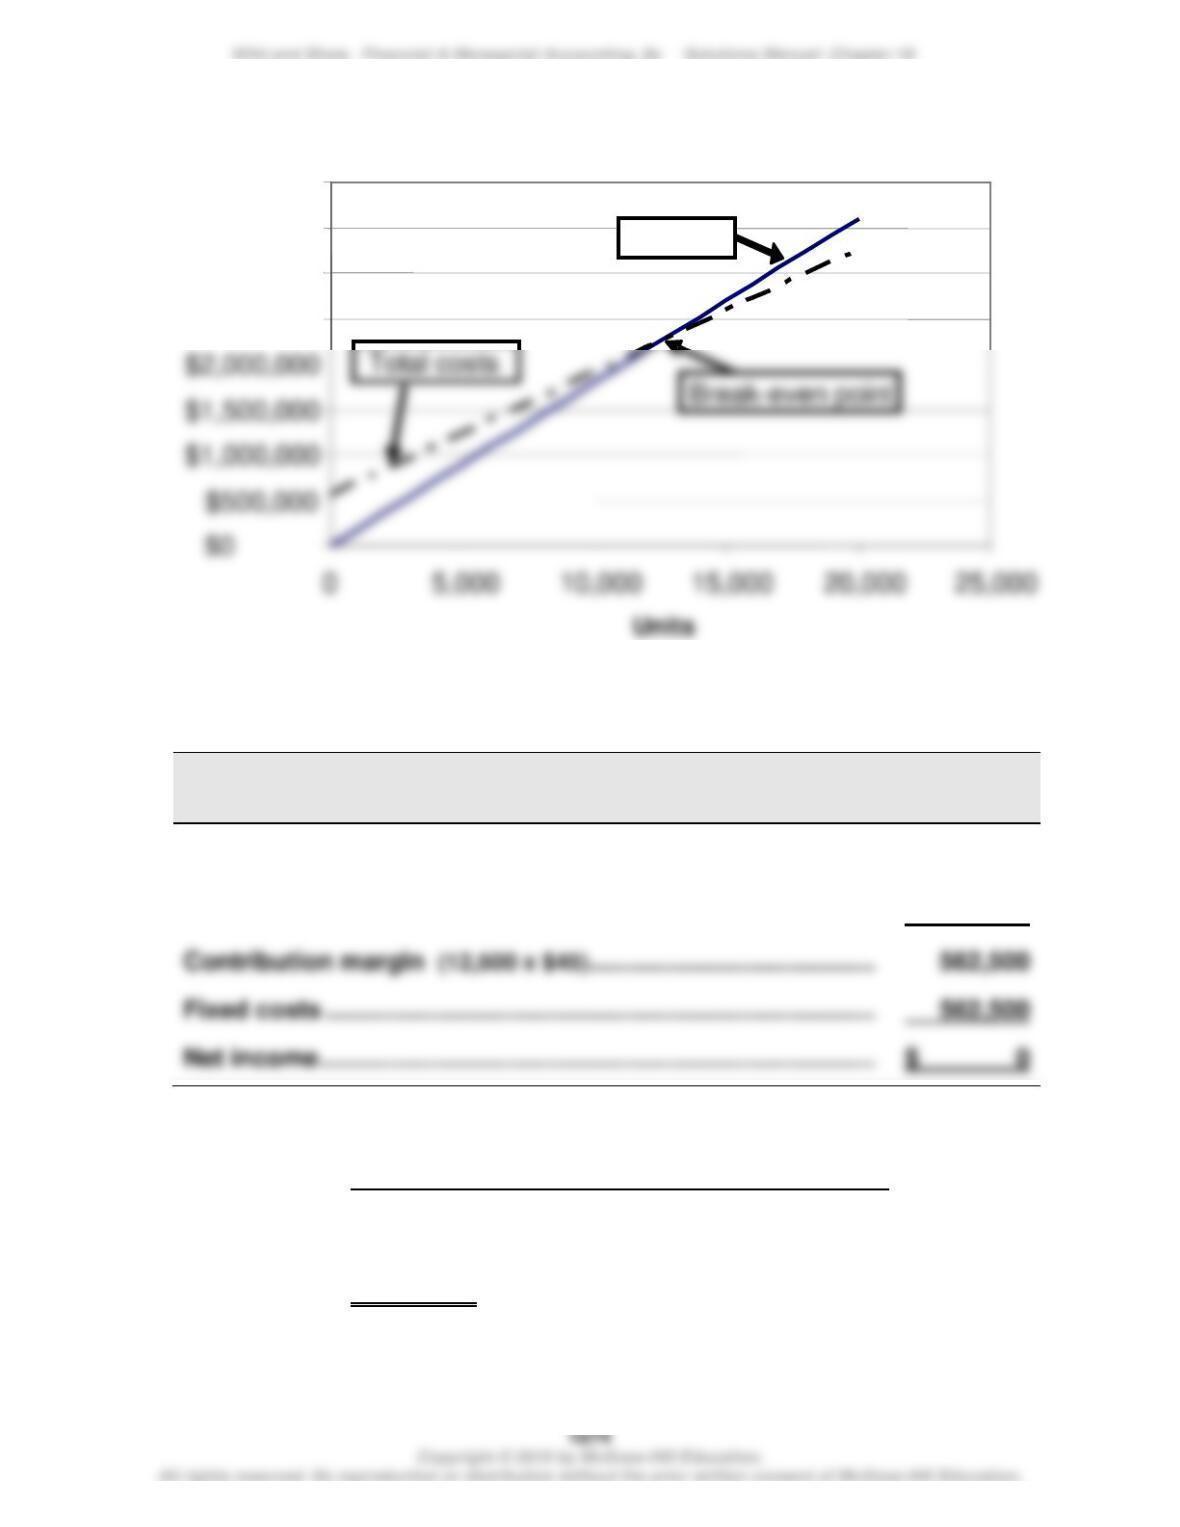
Exercise 18–10C (15 minutes)
Exercise 18-11 (20 minutes)
1.
BLANCHARD COMPANY
Contribution Margin Income Statement (at Break-Even)
Sales (12,500 x $180) ………………………………………………………………..
$2,250,000
Variable costs (12,500 x $135) …………………………………………………..
1,687,500
Fixed costs ……………………………………………………………………………..
562,500
2. Sales (in dollars) to break even with increased fixed costs
Break–even = (Original fixed costs + Additional fixed costs)
Contribution margin ratio
= ($562,500 + $135,000) / 25%
= $2,790,000
$1,500,000
$2,000,000
$2,500,000
$3,000,000
$3,500,000
$4,000,000
Sales
Exercise 18-12 (25 minutes)
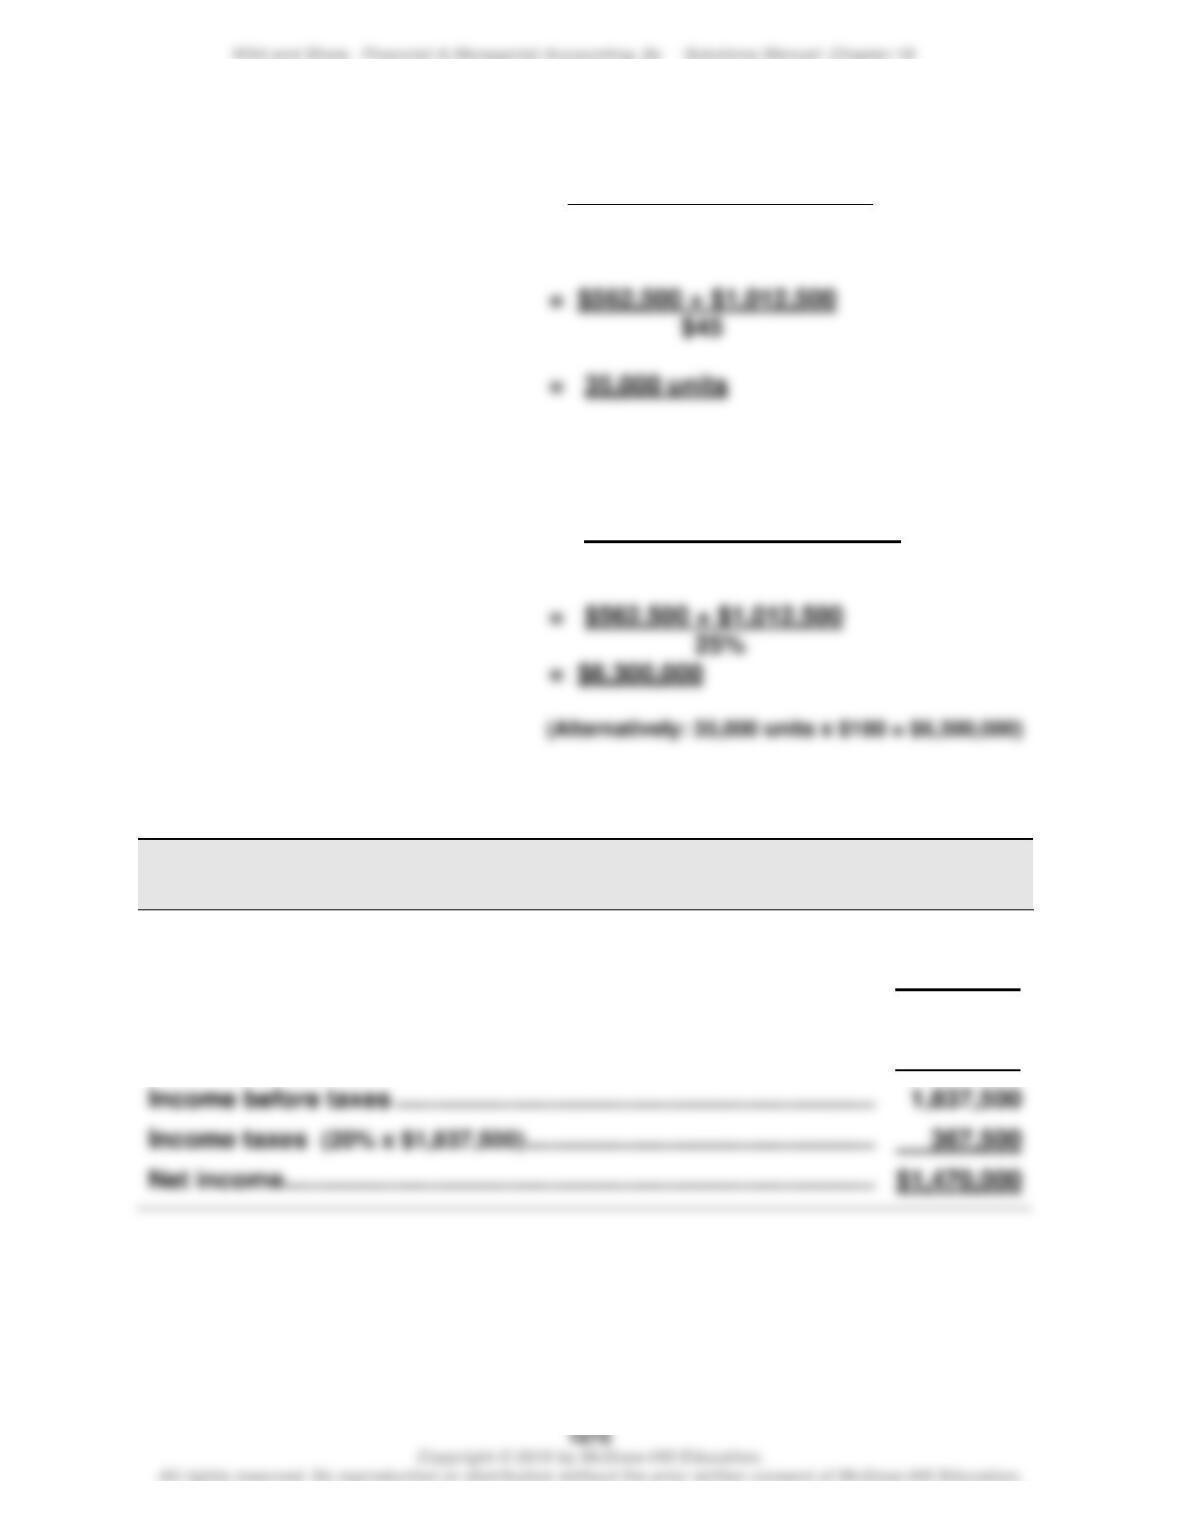
1. Unit sales at target income =
Fixed + Target
2. Dollar sales at target income = costs income
Contribution margin ratio
Exercise 18-13 (20 minutes)
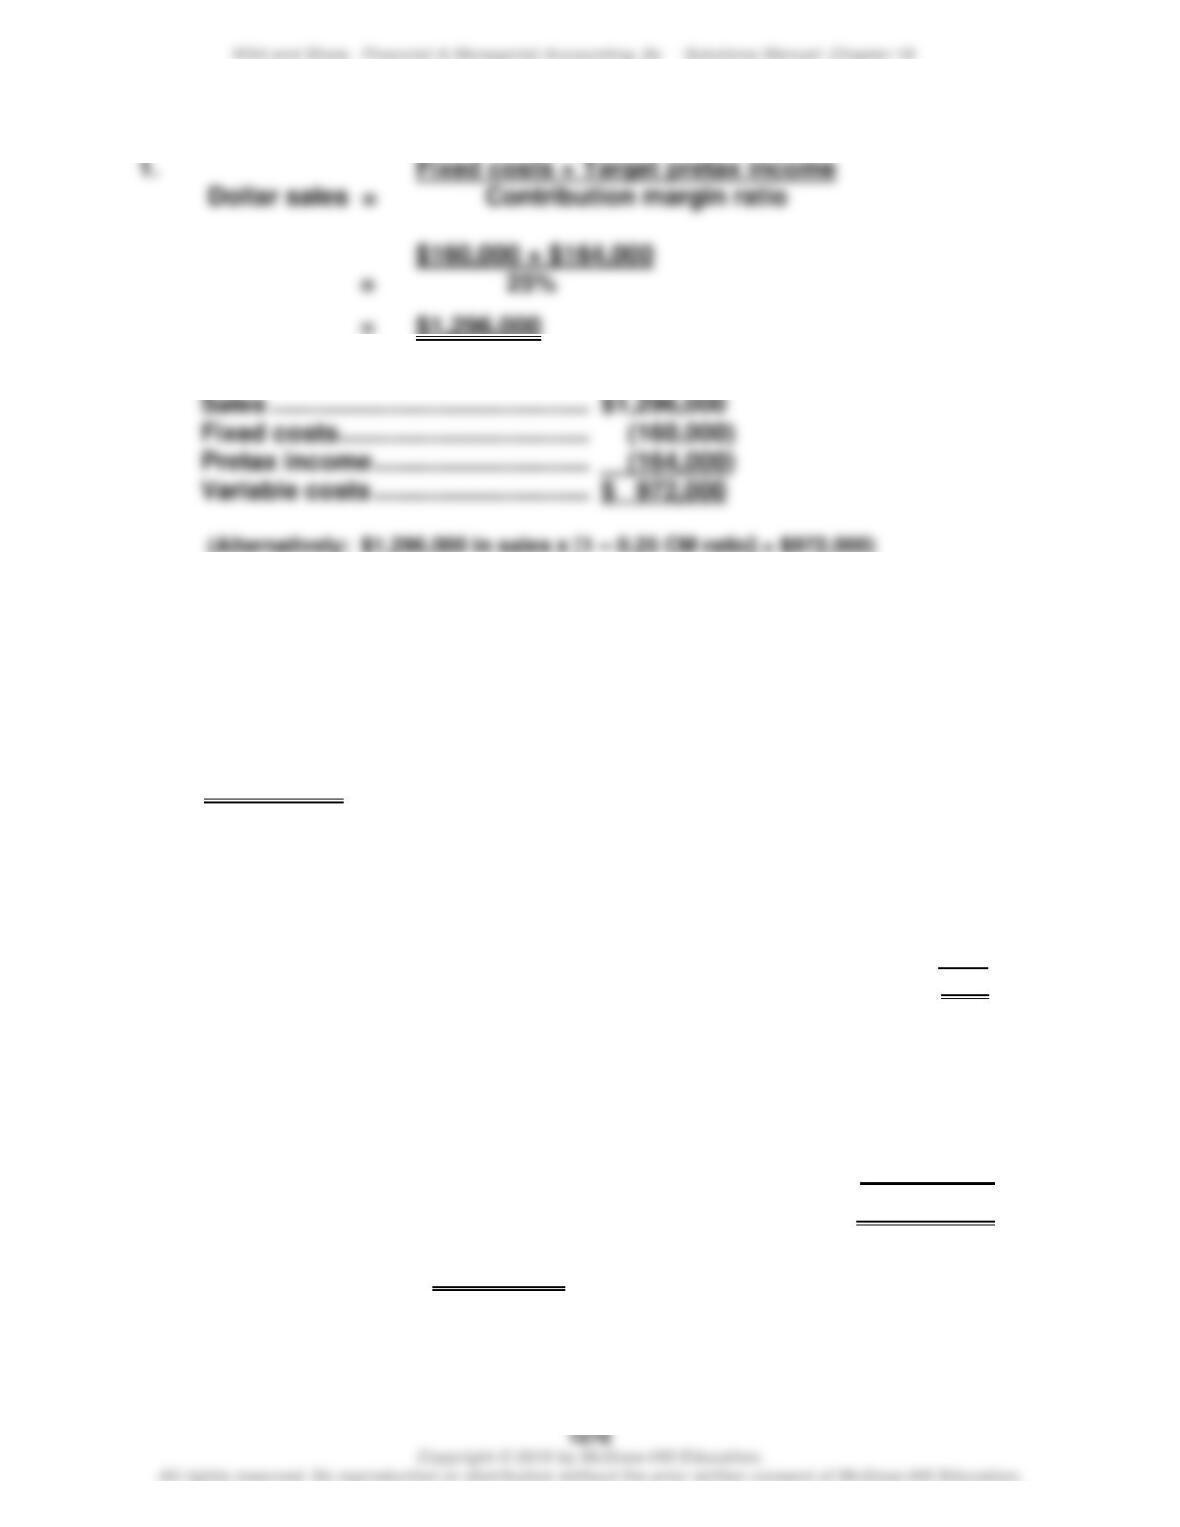
BLANCHARD COMPANY
Forecasted Contribution Margin Income Statement
Sales (40,000 x $200) ………………………………………………………………..
$8,000,000
Variable costs (40,000 x $140) …………………………………………………..
5,600,000
Contribution margin (40,000 x $60) ……………………………………………
2,400,000
Fixed costs ……………………………………………………………………………..
562,500
1,837,500
367,500
Fixed Target
costs income
Contribution margin/unit
+
Exercise 18–14 (10 minutes)
2.
Fixed costs …………………………..……….
Pretax income …………………………..
Variable costs …………………………..
Exercise 18-15 (30 minutes)
(a) Total expected variable costs
= Variable costs per unit x units produced and sold
= $60* x 200,000 units
= $12,000,000
*The $60 variable costs per unit is computed by determining (i) sales
price per unit and (ii) subtracting contribution margin per unit:
Sales price per unit ($17,000,000 / 200,000 units) …………………..
$ 85
Less: Contribution margin per unit (given) …………………………..
(25)
Variable costs per unit ………………………………………………………….
$ 60
(b) To solve, set up a brief contribution margin income statement
Sales (given) …………………………………………………………………..
$17,000,000
Variable costs (from part a) …………………………………………….
(12,000,000)
Fixed costs …………………………..………………………………………..
( ? )
Pretax income (given) …………………………………………………….
$ 1,250,000
Thus: Fixed costs = $ 3,750,000
Exercise 18-16 (10 minutes)
1. Break-even in units = Fixed costs / Contribution margin per unit
= $324,000 / ($225 – $180) = 7,200 units
2. Break-even point in dollars = Fixed costs / Contribution margin ratio
= $324,000 / 20%* = $1,620,000
*Computed as $45/$225
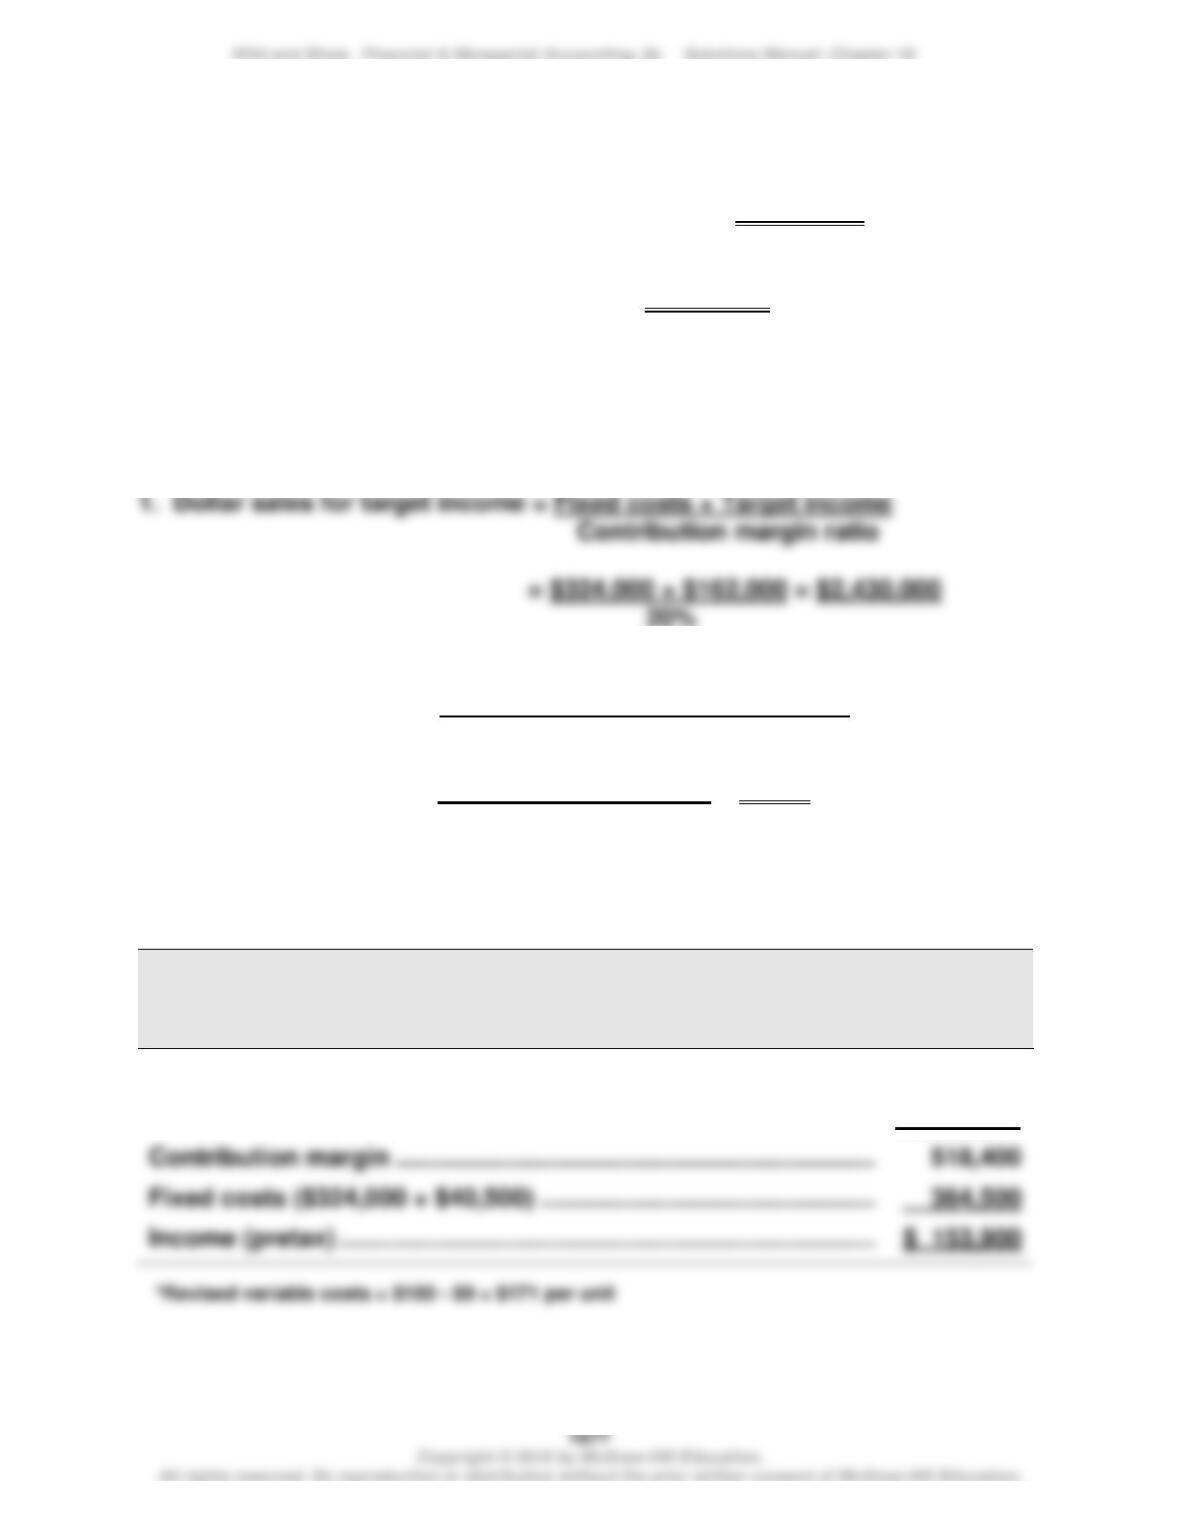
Exercise 18-17 (15 minutes)
2. Margin of safety (%) = Expected sales – break-even sales
Expected sales
= $2,430,000 – $1,620,000 = 33.3% (rounded)
$2,430,000
Exercise 18-18 (15 minutes)
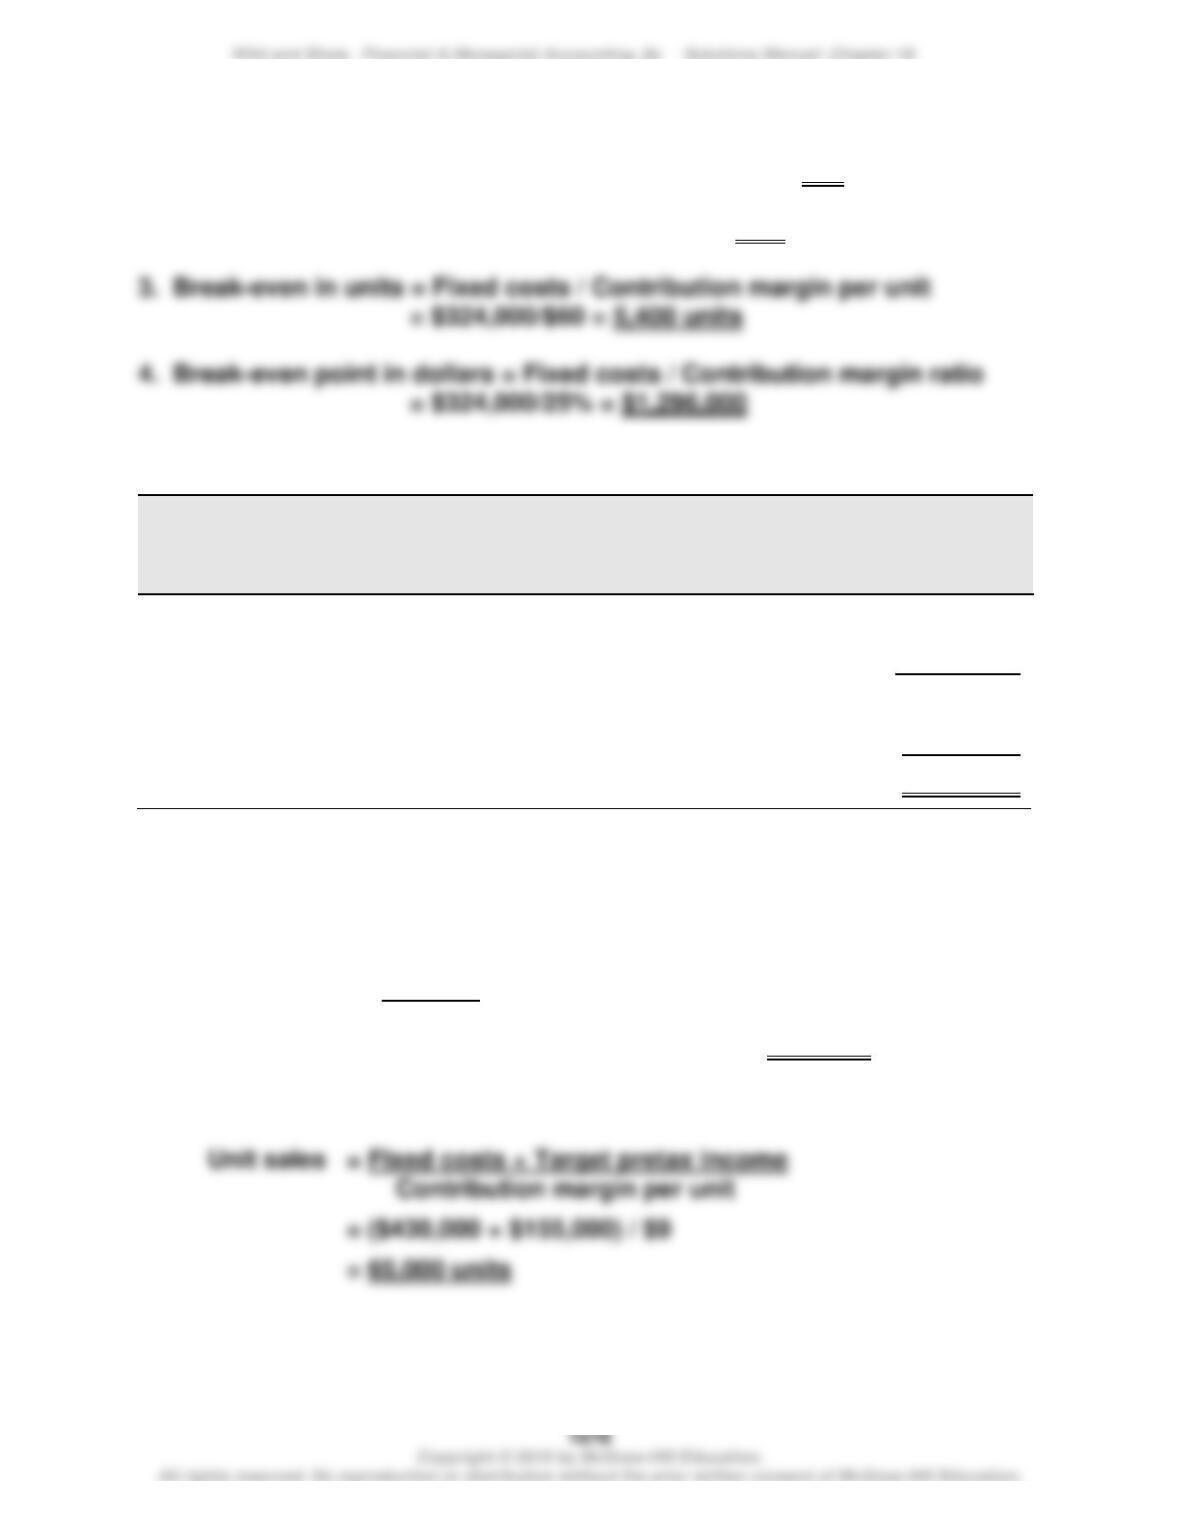
HUDSON CO.
Forecasted Contribution Margin Income Statement
For Year Ended December 31, 2020
Sales (9,600 x $225) …………………………………………………………………
$2,160,000
Variable costs (9,600 x $171*) …………………………………………………..
1,641,600
Exercise 18-19 (10 minutes)
1. Revised contribution margin per unit = $240 – $180 = $60
2. Revised contribution margin ratio = $60/$240 = 25%
Exercise 18–20 (15 minutes)
HUDSON CO.
Forecasted Contribution Margin Income Statement
For Year Ended December 31, 2020
Sales (11,000 x $225) ……………………………………………………………….
$2,475,000
Variable costs (11,000 x $180) ………………………………………………….
1,980,000
Contribution margin ………………………………………………………………..
495,000
Fixed costs ($324,000 + $81,000) ……………………………………………..
405,000
Income (pretax) ……………………………………………………………………….
$ 90,000
Exercise 18-21 (20 minutes)
1. Pretax income = Sales – Variable costs – Fixed costs
$155,000 = $___?___ – $390,000 – $430,000
→ Sales = $155,000 + $390,000 + $430,000 = $975,000
2. Instructor note: Use equation in Exhibit 18.23;