Problem 18-2B (20 minutes)
Part 1 Calculation of variable and fixed costs
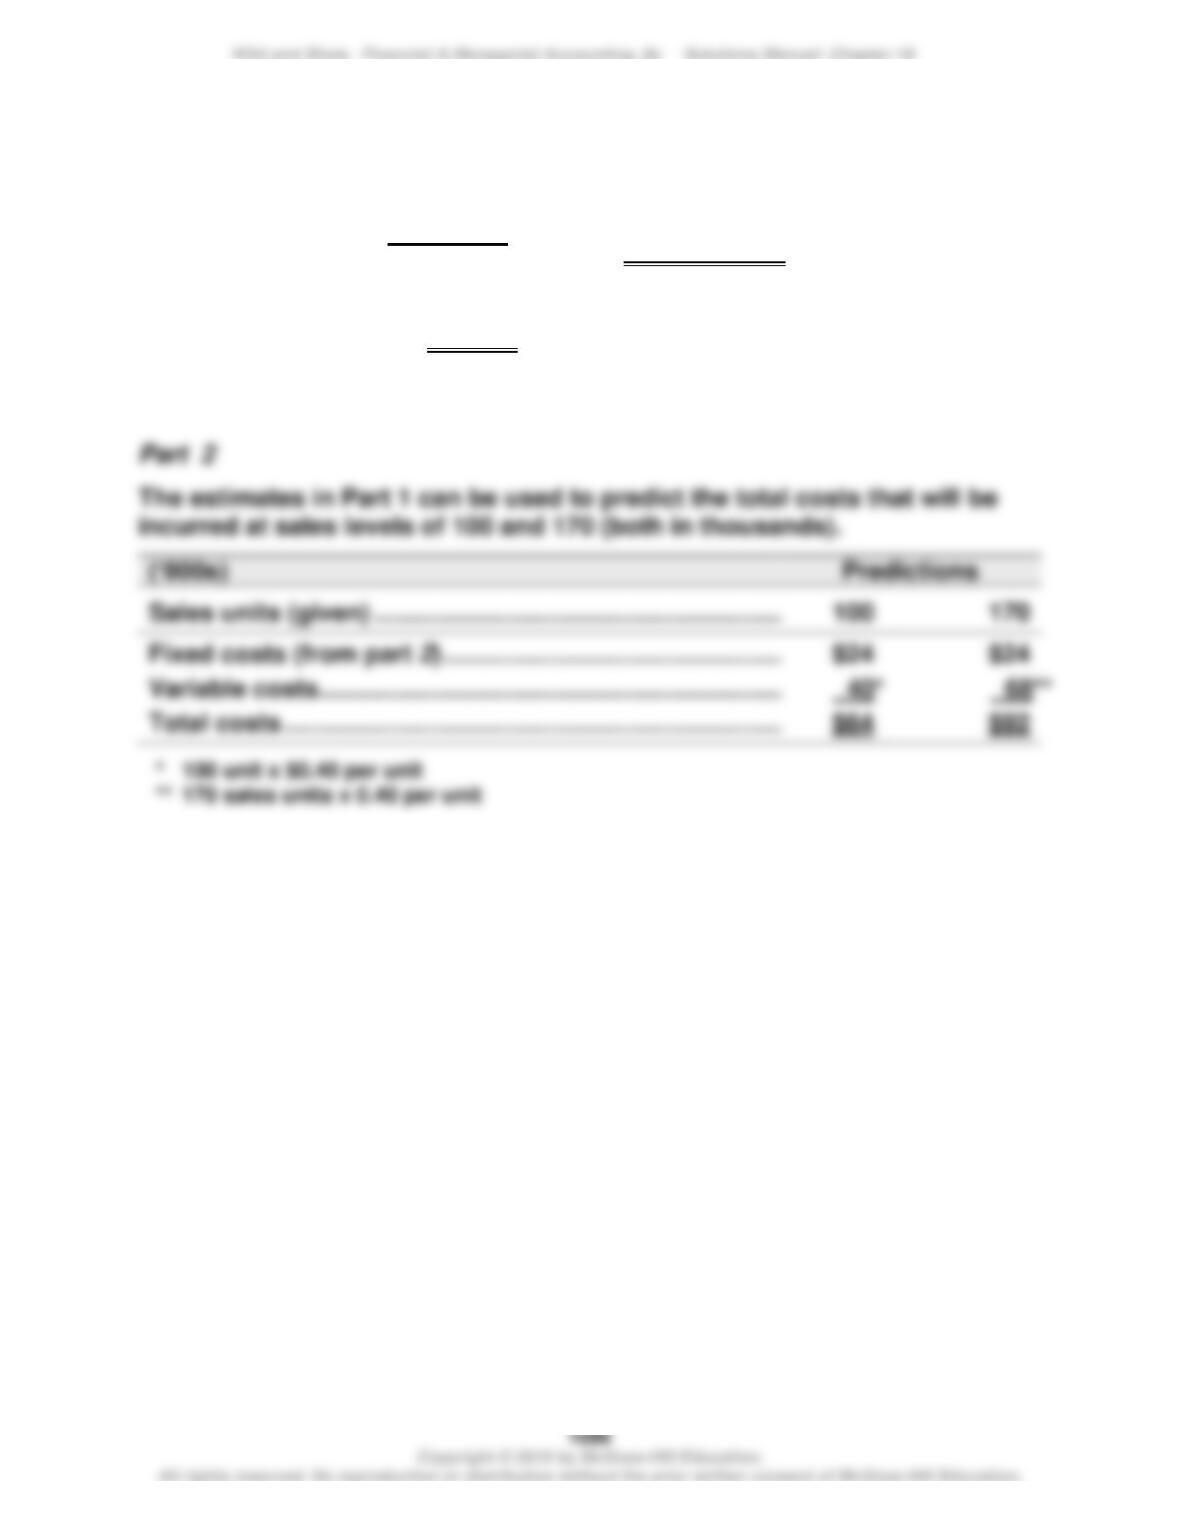
Variable costs = = $0.40 per unit
Using the high point: $110 = Fixed costs + ($0.40 per unit x 215 units)
Therefore, fixed costs = $24,000
$110 – $58
215 – 85
Problem 18-3B (40 minutes)
Part 1
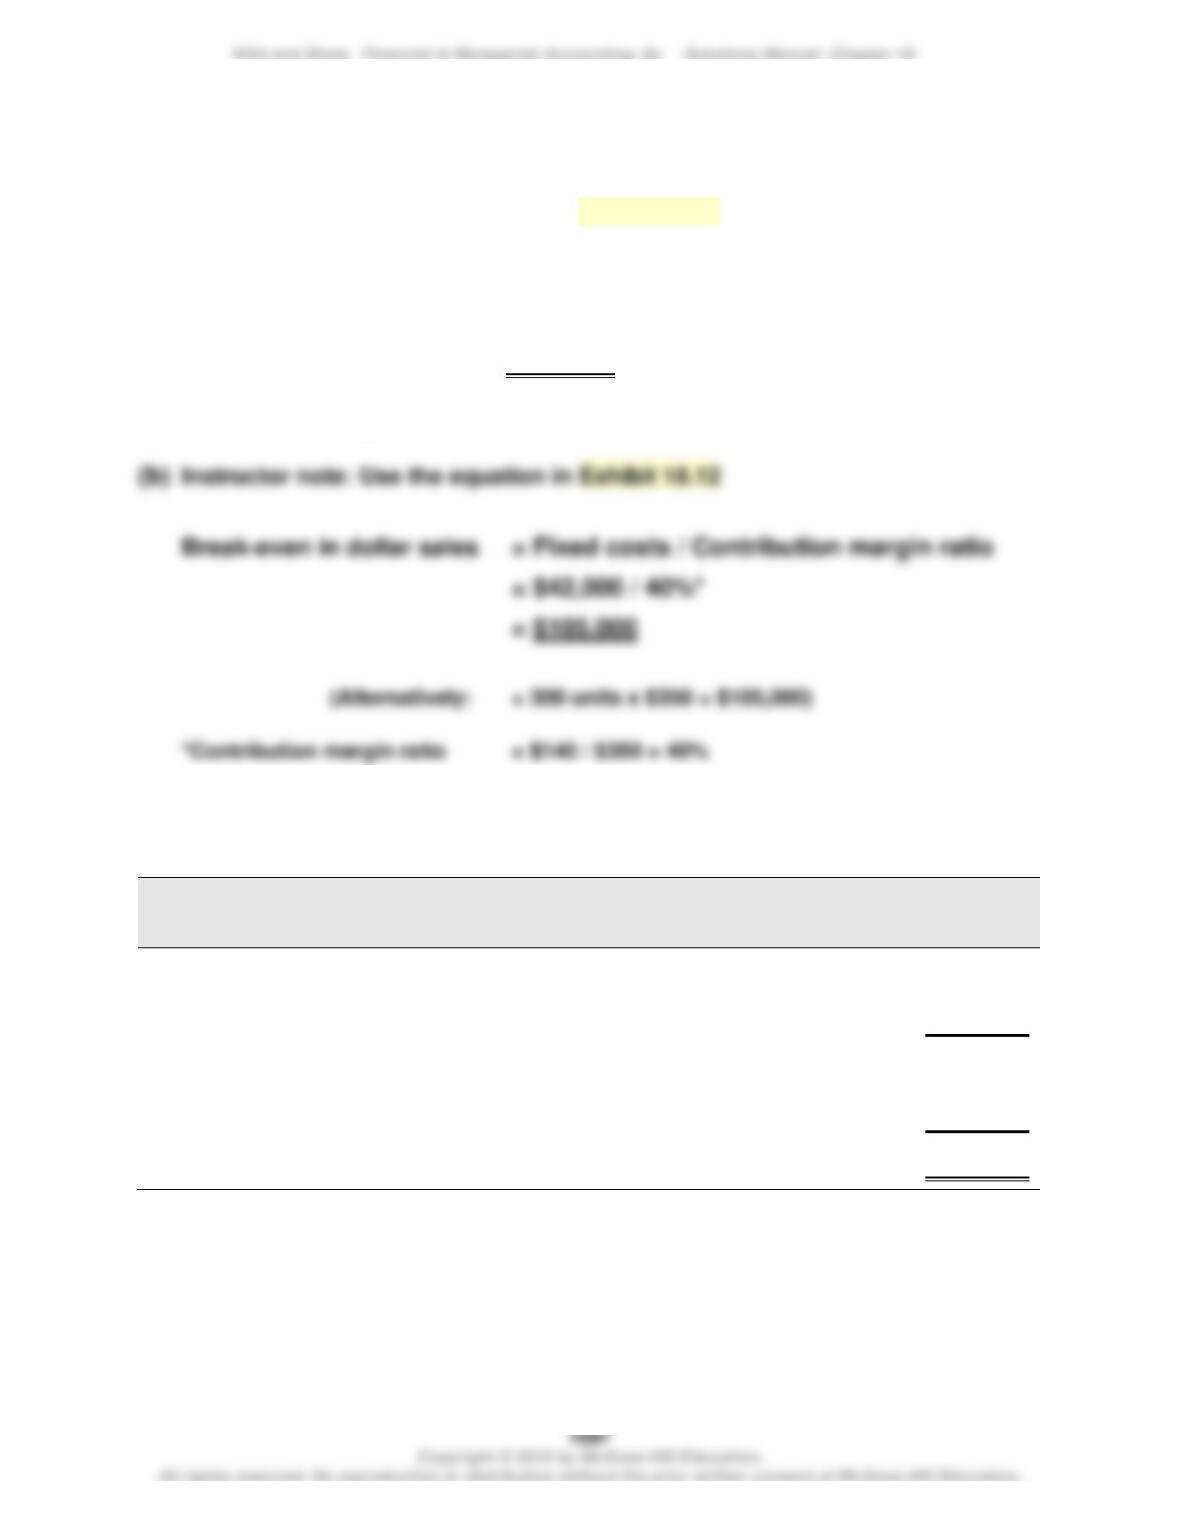
(a) Instructor note: Use the equation in Exhibit 18.11
Break-even in unit sales = Fixed costs / Contribution margin per unit
= $42,000 / $140*
= 300 units
*Contribution margin = $350 – $210 = $140
Part 2
HIP-HOP CO.
Contribution Margin Income Statement (at Break-Even) — Keyboards
Sales (300 x $350) ……………………………………………………………………..
$105,000
Variable costs (300 x $210) ……………………………………………………….
63,000
Contribution margin (300 x $140) ……………………………………………….
42,000
Fixed costs (given) ……………………………………………………………………
42,000
Income ……………………………………………………………………………………..
$ 0
Problem 18-3B (Continued)
Part 3
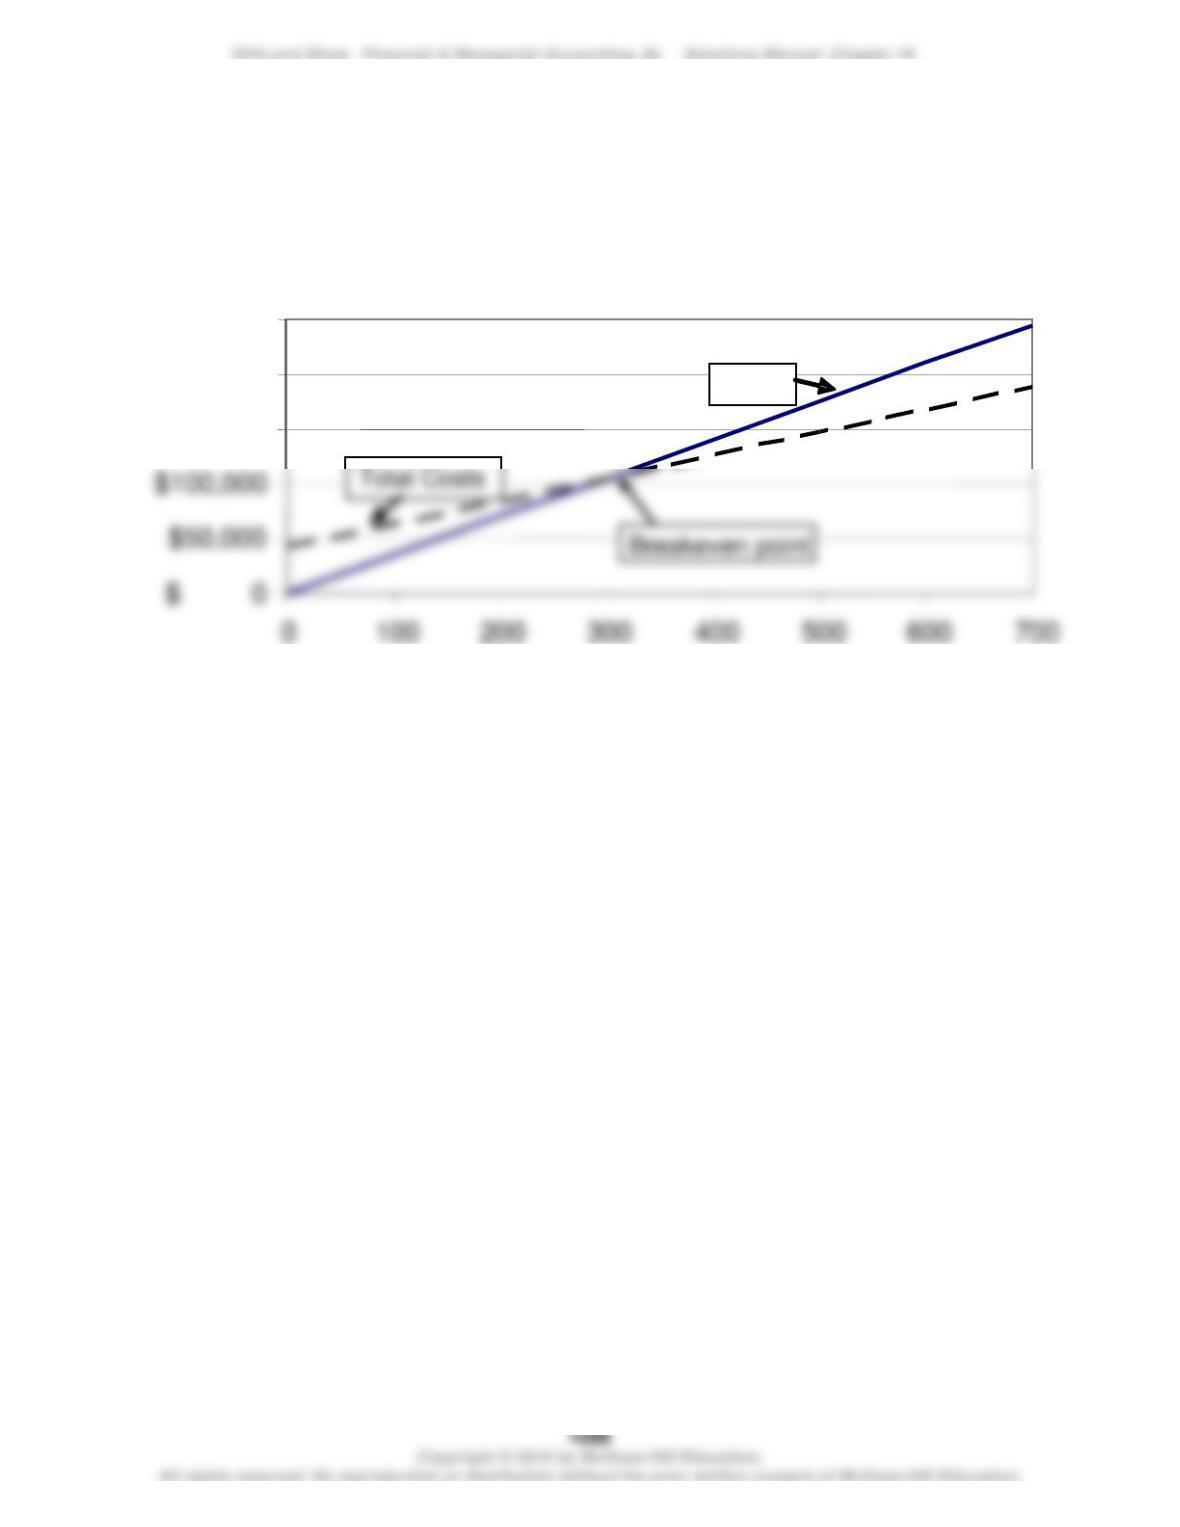
Hip-Hop Company CVP chart
$150,000
$200,000
$250,000
Units
Sales
Problem 18-4B (75 minutes)
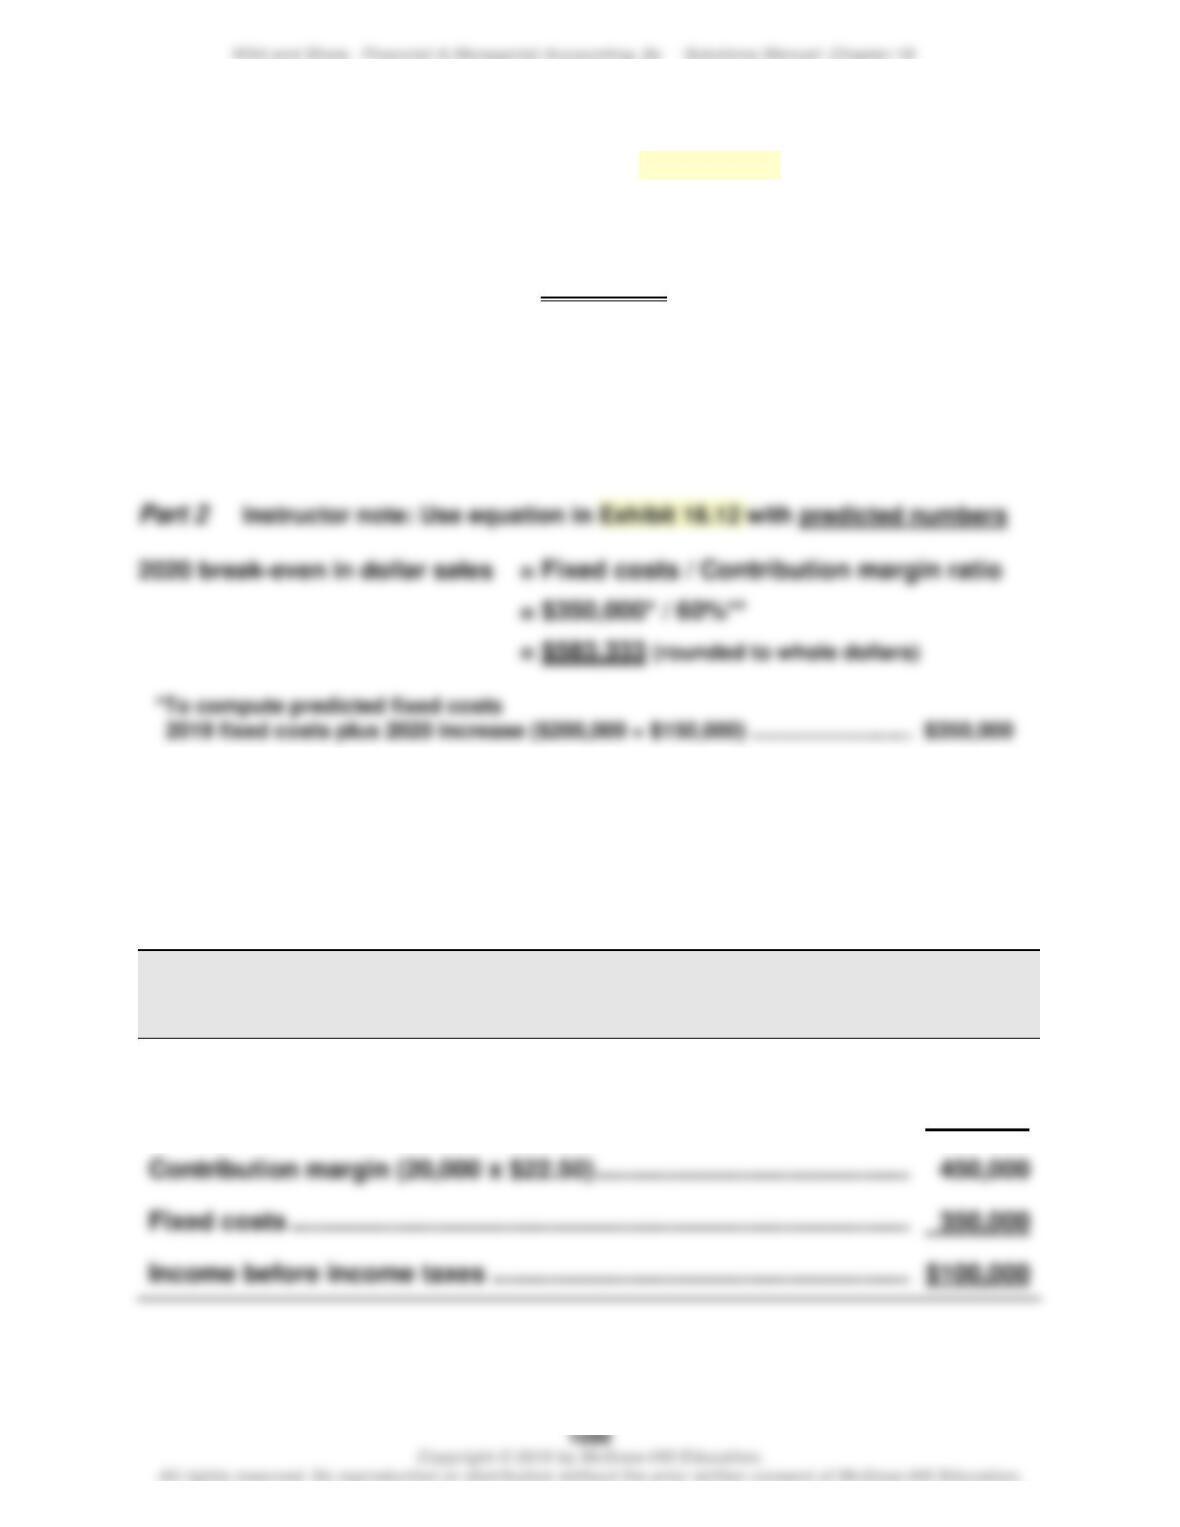
Part 1 Instructor note: Use the equation in Exhibit 18.12
2019 break-even in dollar sales = Fixed costs / Contribution margin ratio
= $200,000 / 20%*
= $1,000,000
*To compute contribution margin ratio
Sales price per unit ($750,000 / 20,000)……………………………………………………….
$37.50
Variable costs per unit ($600,000 / 20,000) ……………………………………………………..
$30.00
Contribution margin ratio ($37.50- $30) / $37.50) …………………………………………….
20%
**To compute predicted contribution margin ratio
Predicted sales price per unit ($750,000 / 20,000) ……………………………………………
$37.50
Predicted variable costs per unit [($600,000 x 50%)/ 20,000) …………………………..
$15.00
Predicted contribution margin ratio ($37.50- $15) / $37.50) …………………………..
60%
Part 3
RIVERA COMPANY
Forecasted Contribution Margin Income Statement
For Year Ended December 31, 2020
Sales (20,000 x $37.50) …………………………………………………………………
$750,000
Variable costs (20,000 x $15) ……………………………………………………….
300,000
Fixed costs ………………………………………………………………………………….
Problem 18-4B (Continued)
Part 4 Instructor note: Use equations in Exhibit 18.22 and 18.23 with predicted
numbers
(Fixed costs + Pretax income)
Required sales in dollars = Contribution margin ratio
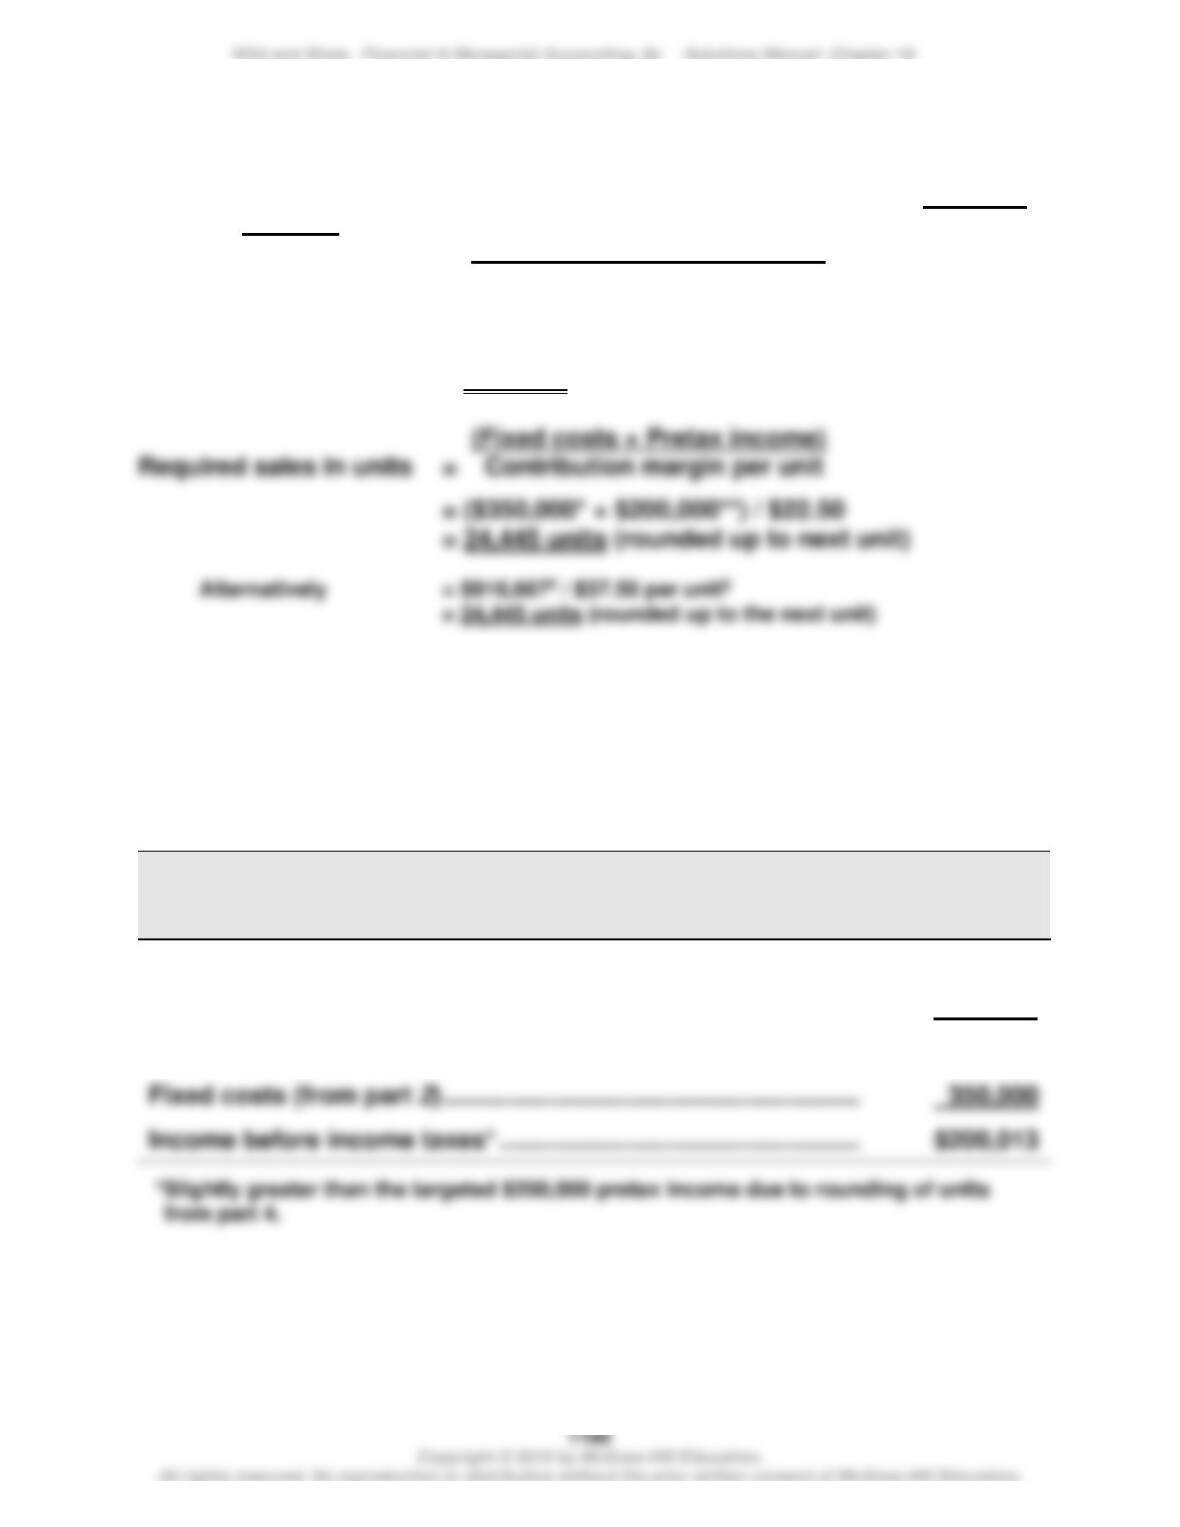
= ($350,000* + $200,000) / 60%**
= $550,000 / 60%
= $916,667 (rounded to the next dollar)
* 2019 fixed costs plus 2020 increase ($200,000 + $150,000) …………………………
$350,000
** Predicted contribution margin ratio ($37.50-$15)/$37.50—from part 2 ………….
60%
†Taken from “required sales in dollars” above ……………………………………………..
$916,667
‡Taken from part 2 ……………………………………………………………………………………
$ 37.50
Part 5
RIVERA COMPANY
Forecasted Contribution Margin Income Statement
For Year Ended December 31, 2020
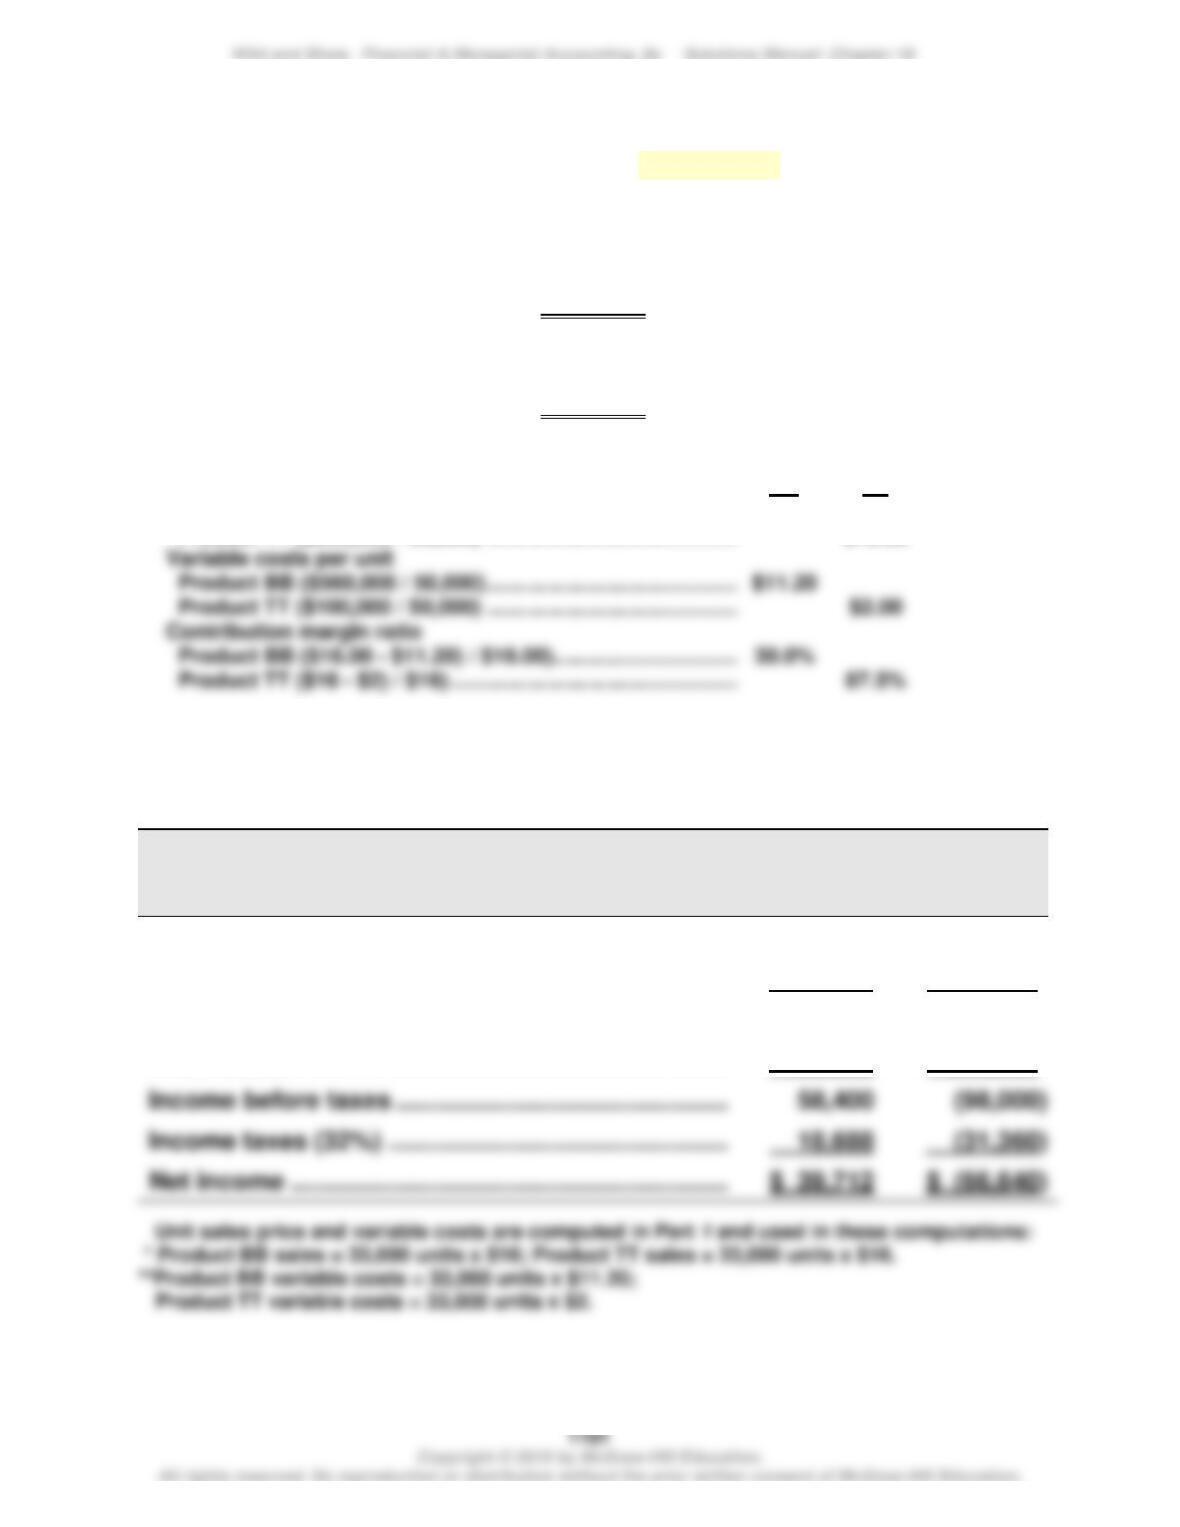
Sales (24,445 units x $37.50) ……………………………………………….
$916,688
Variable costs (24,445 units x $15) ………………………………………
366,675
Contribution margin (24,445 units x $22.50) …………………………
550,013
Fixed costs (from part 2) ……………………………………………………..
Income before income taxes* ………………………………………………
$200,013
Problem 18-5B (65 minutes)
Part 1 Instructor note: Use the equation in Exhibit 18.12
Break-even in dollar sales = Fixed costs / Contribution margin ratio
Product BB:
= $100,000 / 30%*
= $333,334 (rounded up to the next dollar)
Product TT:
= $560,000 / 87.5%*
= $640,000
*To compute contribution margin ratio
Sales price per unit
Product BB ($800,000 / 50,000) ……………………………………………………….
$11.20
BB
$16.00
TT
Part 2
Forecasted contribution margin income statements for each product
assuming sales decline to 33,000 units with no change in unit sales price
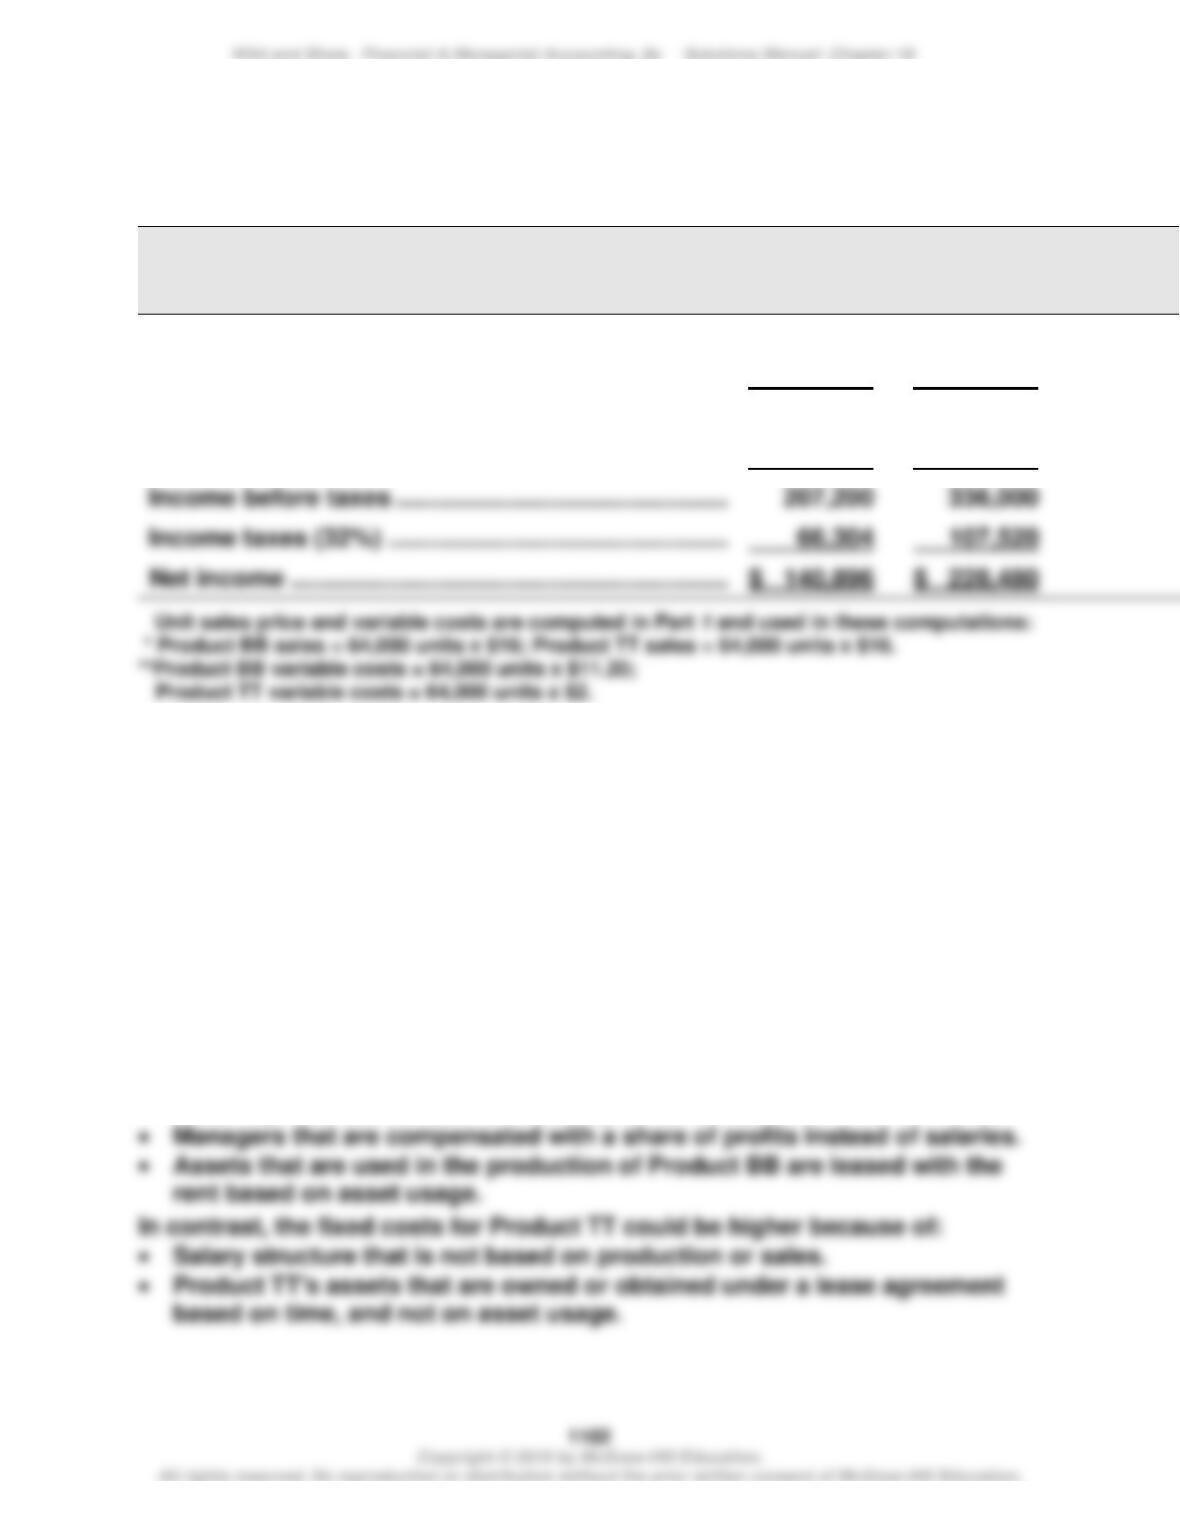
STAM CO.
Forecasted Contribution Margin Income Statement
Product BB
Product TT
Sales* …………………………………………………………………
$528,000
$ 528,000
Variable costs** …………………………………………………..
369,600
66,000
Contribution margin ……………………………………………
158,400
462,000
Fixed costs ……………………………………………………….
100,000
560,000
18,688
(31,360)
Net income ……………………………………………………….
$ 39,712
$ (66,640)
Problem 18–5B (Continued)
Forecasted contribution margin income statements for each product
assuming sales increase to 64,000 units with no change in unit sales price:
STAM CO.
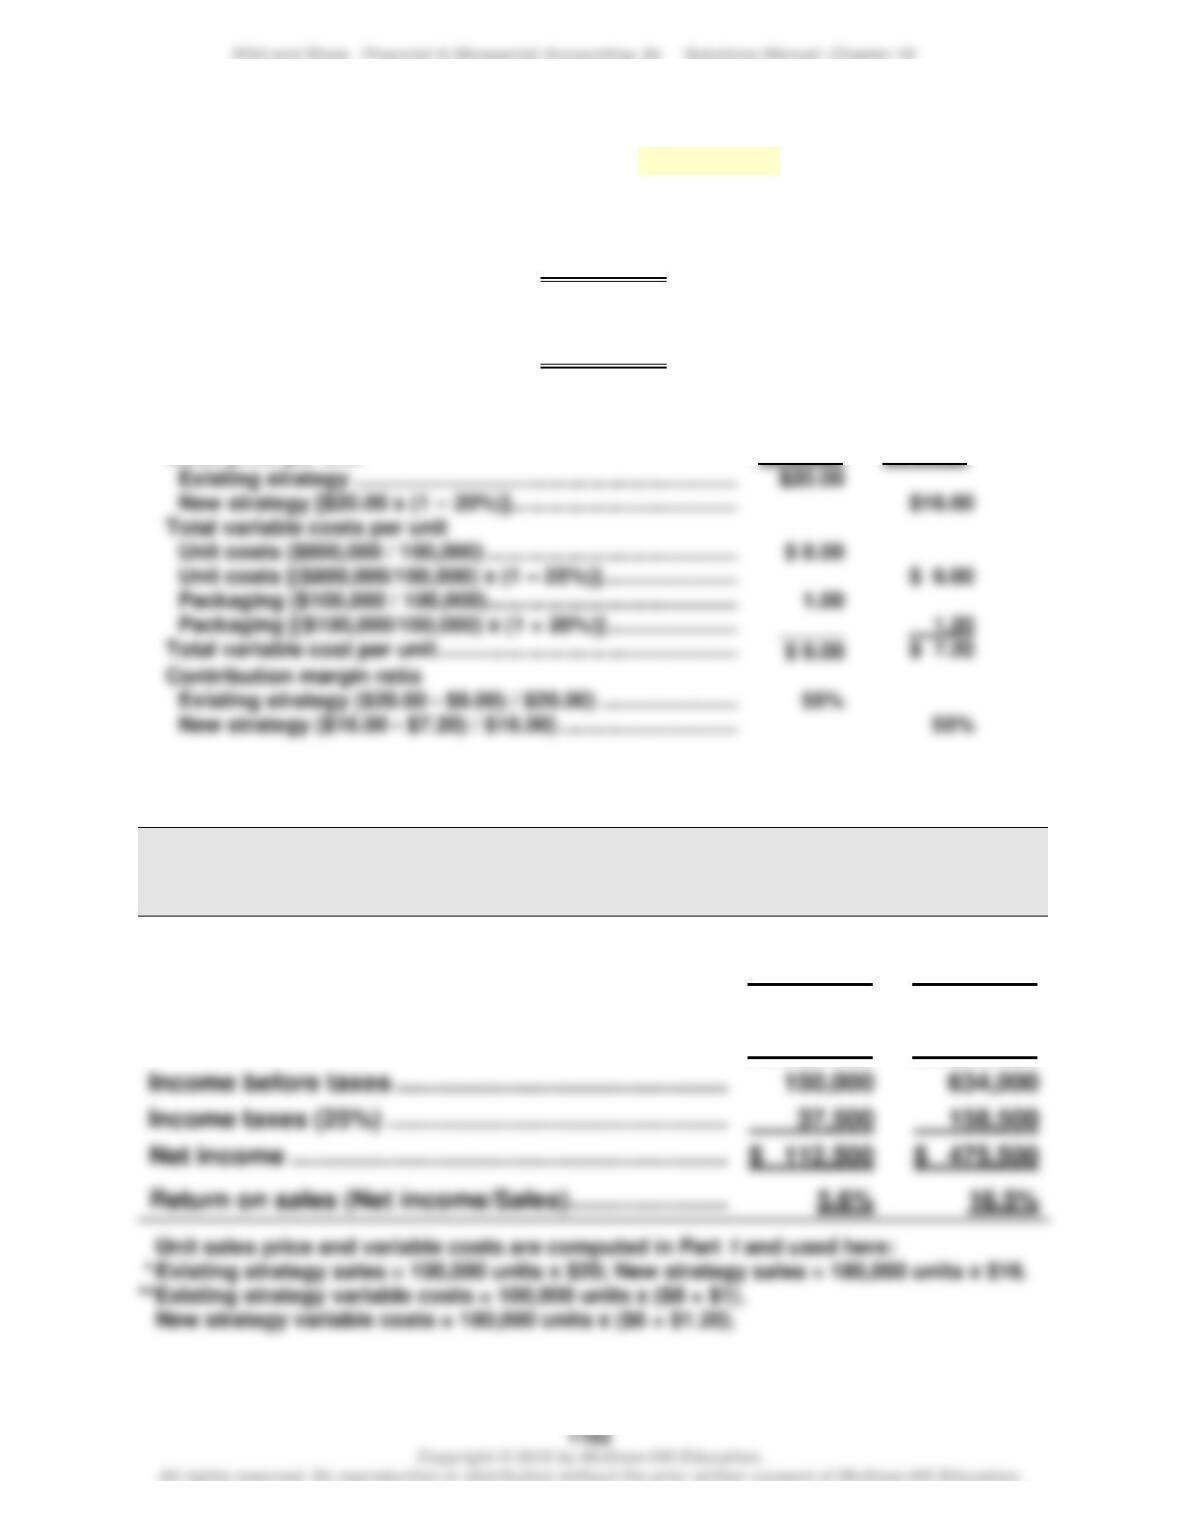
Forecasted Contribution Margin Income Statement
Product BB
Product TT
Sales* …………………………………………………………………
$1,024,000
$1,024,000
Variable costs** …………………………………………………..
716,800
128,000
Contribution margin ……………………………………………
307,200
896,000
Fixed costs ……………………………………………………….
100,000
560,000
207,200
336,000
66,304
107,520
Net income ……………………………………………………….
Part 4
If sales were to greatly increase, Product TT would experience the greater
increase in income because it would gain more contribution margin per
unit than Product BB ($14 for TT versus $4.80 for BB). Examining the
operating leverage of these two products would yield the same inference.
Specifically, higher operating leverage reflects higher fixed costs, which
implies greater impacts on income from changes in sales levels.
Part 5
Factors that could cause Product BB to have lower fixed costs include:
• Labor arrangement that pays workers for units produced.
• Sales representatives that work totally on commission.
Problem 18-6B (45 minutes)
Part 1 Instructor note: Use the equation in Exhibit 18.12
Break-even in dollar sales = Fixed costs / Contribution margin ratio
Existing Strategy: = $950,000 / 55%*
= $1,727,273 (rounded to the next dollar)
New Strategy: = $950,000 / 55%*
= $1,727,273 (rounded to the next dollar)
*To compute contribution margin ratio
Existing
New
Part 2
BEST COMPANY
Forecasted Contribution Margin Income Statement
Existing Strategy
New Strategy
Sales* …………………………………………………………………
$2,000,000
$2,880,000
Variable costs** …………………………………………………..
900,000
1,296,000
Contribution margin ……………………………………………
1,100,000
1,584,000
Fixed costs ……………………………………………………….
950,000
950,000
Income before taxes ……………………………………………
Net income ……………………………………………………….
Problem 18-7B (50 minutes)
Part 1 BREAK–EVEN ANALYSIS ASSUMING USE OF SAME MATERIALS
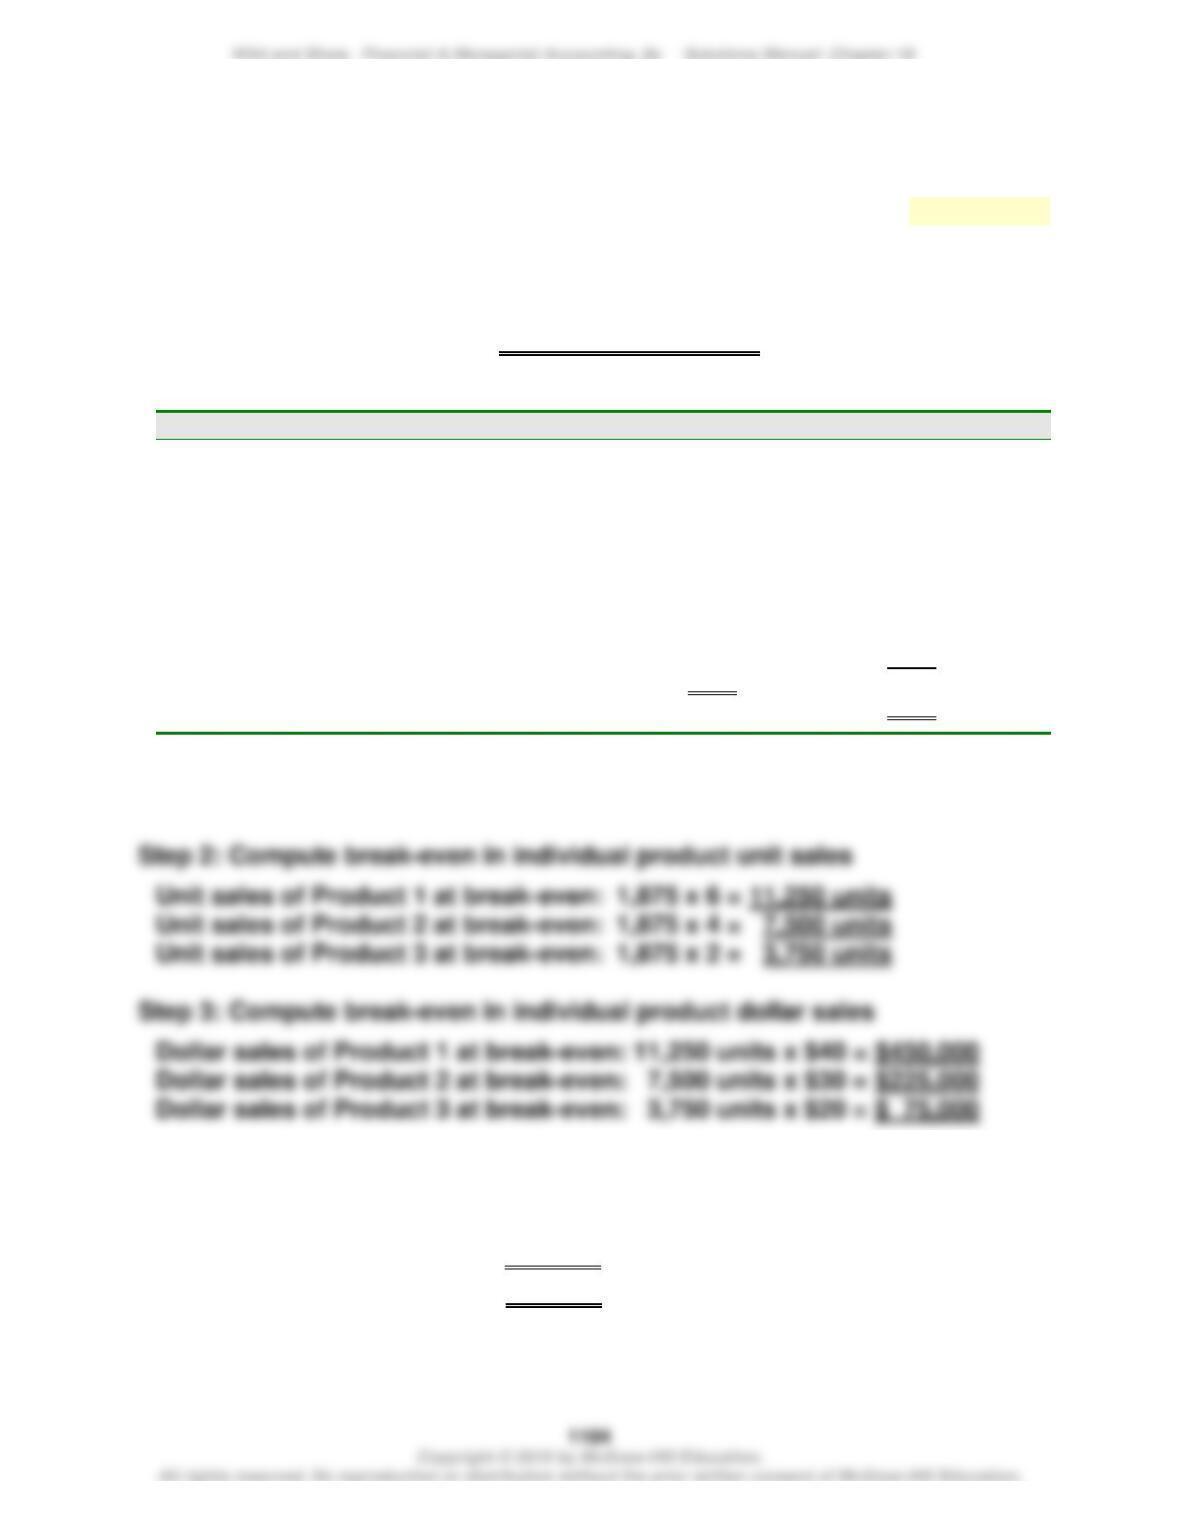
Step 1: Compute break-even in composite units—Use equation in Exhibit 18.29
Break-even in composite units = Fixed costs/Contribution margin per composite unit
= $270,000 / $144*
= 1,875 composite units
* To compute the contribution margin per composite unit
Unit Sales Price
Unit Variable Costs
6 units of Product 1
@ $40 per unit…………………………………………..
@ $30 per unit…………………………………………..
$240
$180
4 units of Product 2
@ $30 per unit…………………………………………..
@ $15 per unit…………………………………………..
120
60
2 units of Product 3
@ $20 per unit…………………………………………..
@ $ 8 per unit…………………………………………..
40
____
16
Selling price of a composite unit ………………….
Variable cost of a composite unit …………………
$400
$256
Thus:
Contribution margin per composite unit = $400 – $256 = $144
Contribution margin ratio = $144 / $400 = 36%
Crossfoot Step 3 total with that from formula:
Break-even in dollar sales = Fixed costs / Contribution margin ratio
= $270,000 / 36%
= $750,000
Compare with Step 3 total = $750,000 ($450,000 + $225,000 + $75,000)
Problem 18–7B (Continued)
Part 2 BREAK–EVEN ANALYSIS ASSUMING USE OF NEW MATERIALS
Step 1: Compute break-even in composite units—Use equation in Exhibit 18.29
Break-even in composite units = Fixed costs/Contribution margin per composite unit
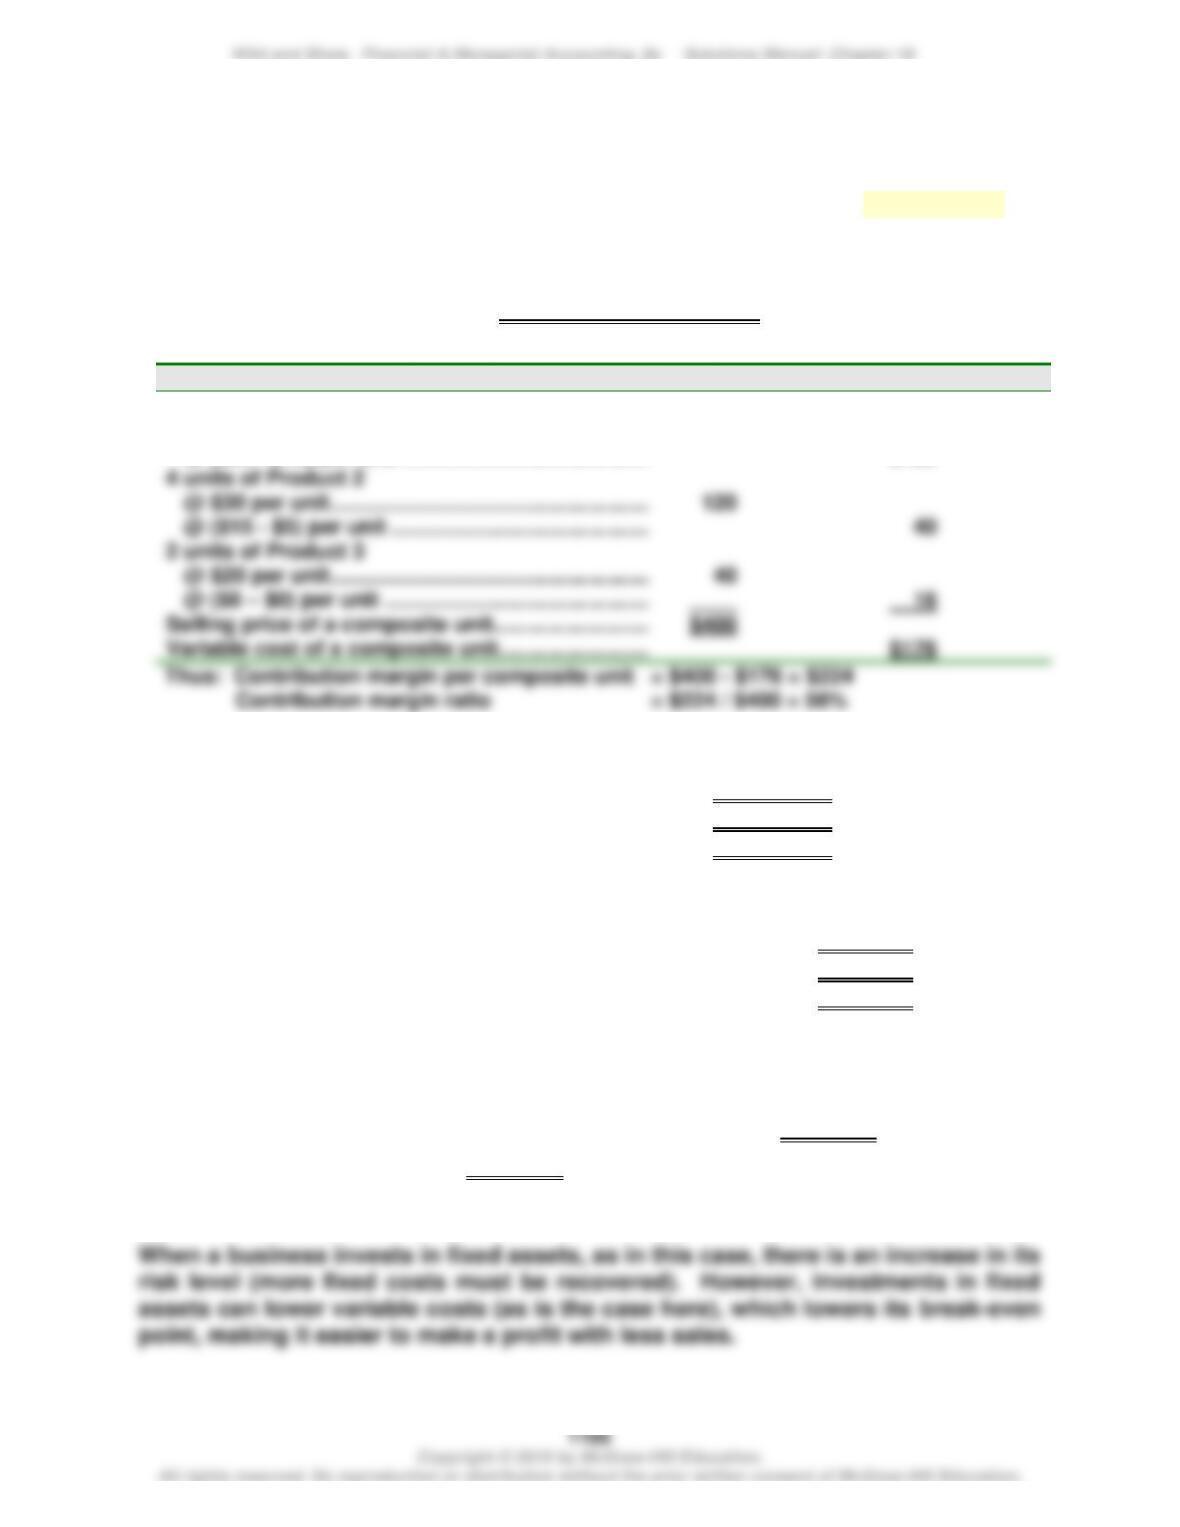
= ($270,000 + $50,000) / $224*
= 1,429 composite units (rounded to the next unit)
*To compute the contribution margin per composite unit
Unit Sales Price
Unit Variable Costs
6 units of Product 1
@ $40 per unit ……………………………………………..
@ ($30 – $10) per unit …………………………………..
$240
$120
4 units of Product 2
Step 2: Compute break-even in individual product unit sales
Unit sales of Product 1 at break-even: 1,429 x 6 = 8,574 units
Unit sales of Product 2 at break-even: 1,429 x 4 = 5,716 units
Unit sales of Product 3 at break-even: 1,429 x 2 = 2,858 units
Step 3: Compute break-even in individual product dollar sales
Dollar sales of Product 1 at break-even: 8,574 units x $40 = $342,960
Dollar sales of Product 2 at break-even: 5,716 units x $30 = $171,480
Dollar sales of Product 3 at break-even: 2,858 units x $20 = $ 57,160
Crossfoot Step 3 total with that from formula ($171 of rounding differences):
Break-even in $ sales = Fixed costs / Contribution margin ratio
= ($270,000 + $50,000) / 56% = $571,429 (rounded)
Compare to Step 3 total = $571,600 ($342,960 + $171,480 + $57,160)
Part 3
SERIAL PROBLEM — SP 18
Serial Problem, Business Solutions (50 minutes)
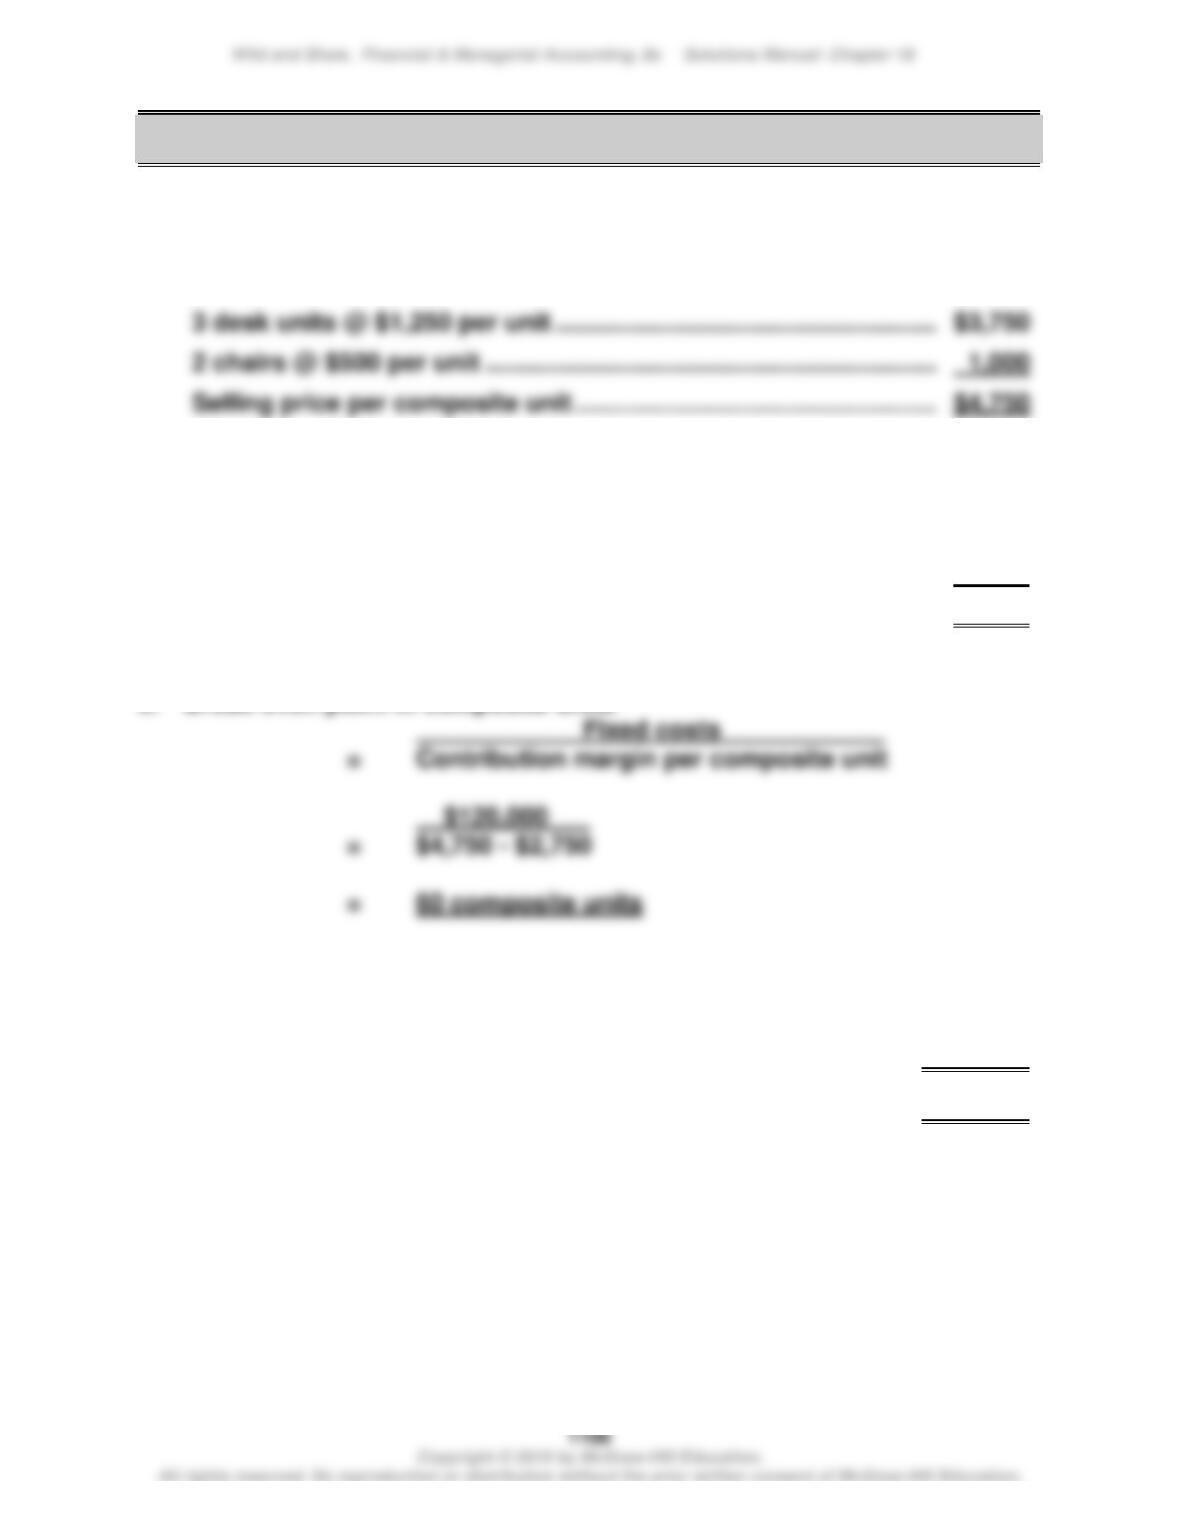
1. Selling price per composite unit
3 desk units @ $1,250 per unit …………………………..…………………….
$3,750
2 chairs @ $500 per unit ………………………………………………………….
1,000
2. Variable costs per composite unit
3 desk units @ $750 per unit …………………………..……………………….
$2,250
2 chairs @ $250 per unit ………………………………………………………….
500
Variable costs per composite unit …………………………..……………….
$2,750
4. Unit sales of desk units and chairs at break-even point
Desk units: 3 x 60 units (from 3) …………………………………………….
180 units
Chairs: 2 x 60 units (from 3) …………………………………………….
120 units
Accounting Analysis — AA 18-1
1. Selling price per composite unit
2 screens @ $160 per unit ……………………………………………………….
$320
1 other @ $400 per unit ……………………………………………………………
400
Selling price per composite unit ………………………………………………
$720
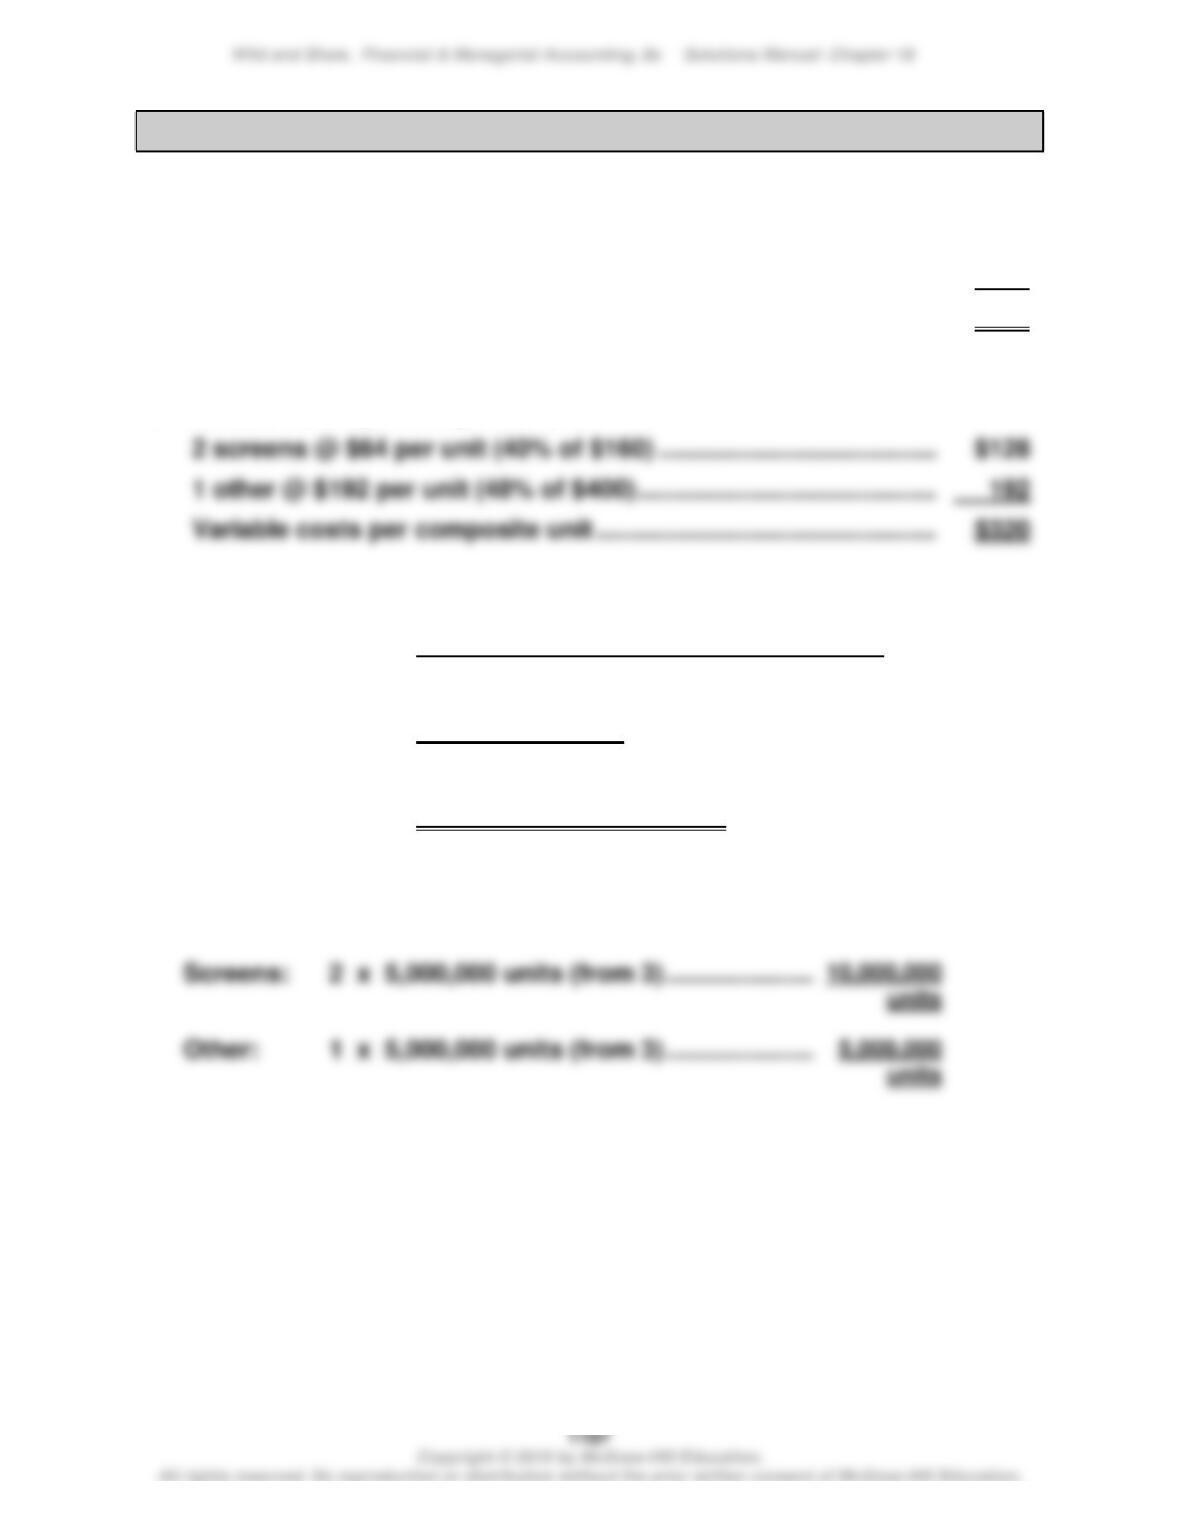
2. Variable costs per composite unit
2 screens @ $64 per unit (40% of $160) …………………………..……….
$128
1 other @ $192 per unit (48% of $400) ………………………………………
Variable costs per composite unit …………………………..……………….
$320
3. Break-even point in composite units
Fixed costs
= Contribution margin per composite unit
$2,000,000,000
= $720 – $320
= 5,000,000 composite units
4. Unit sales of screen repairs and other repairs at break-even point
Comparative Analysis — AA 18-2
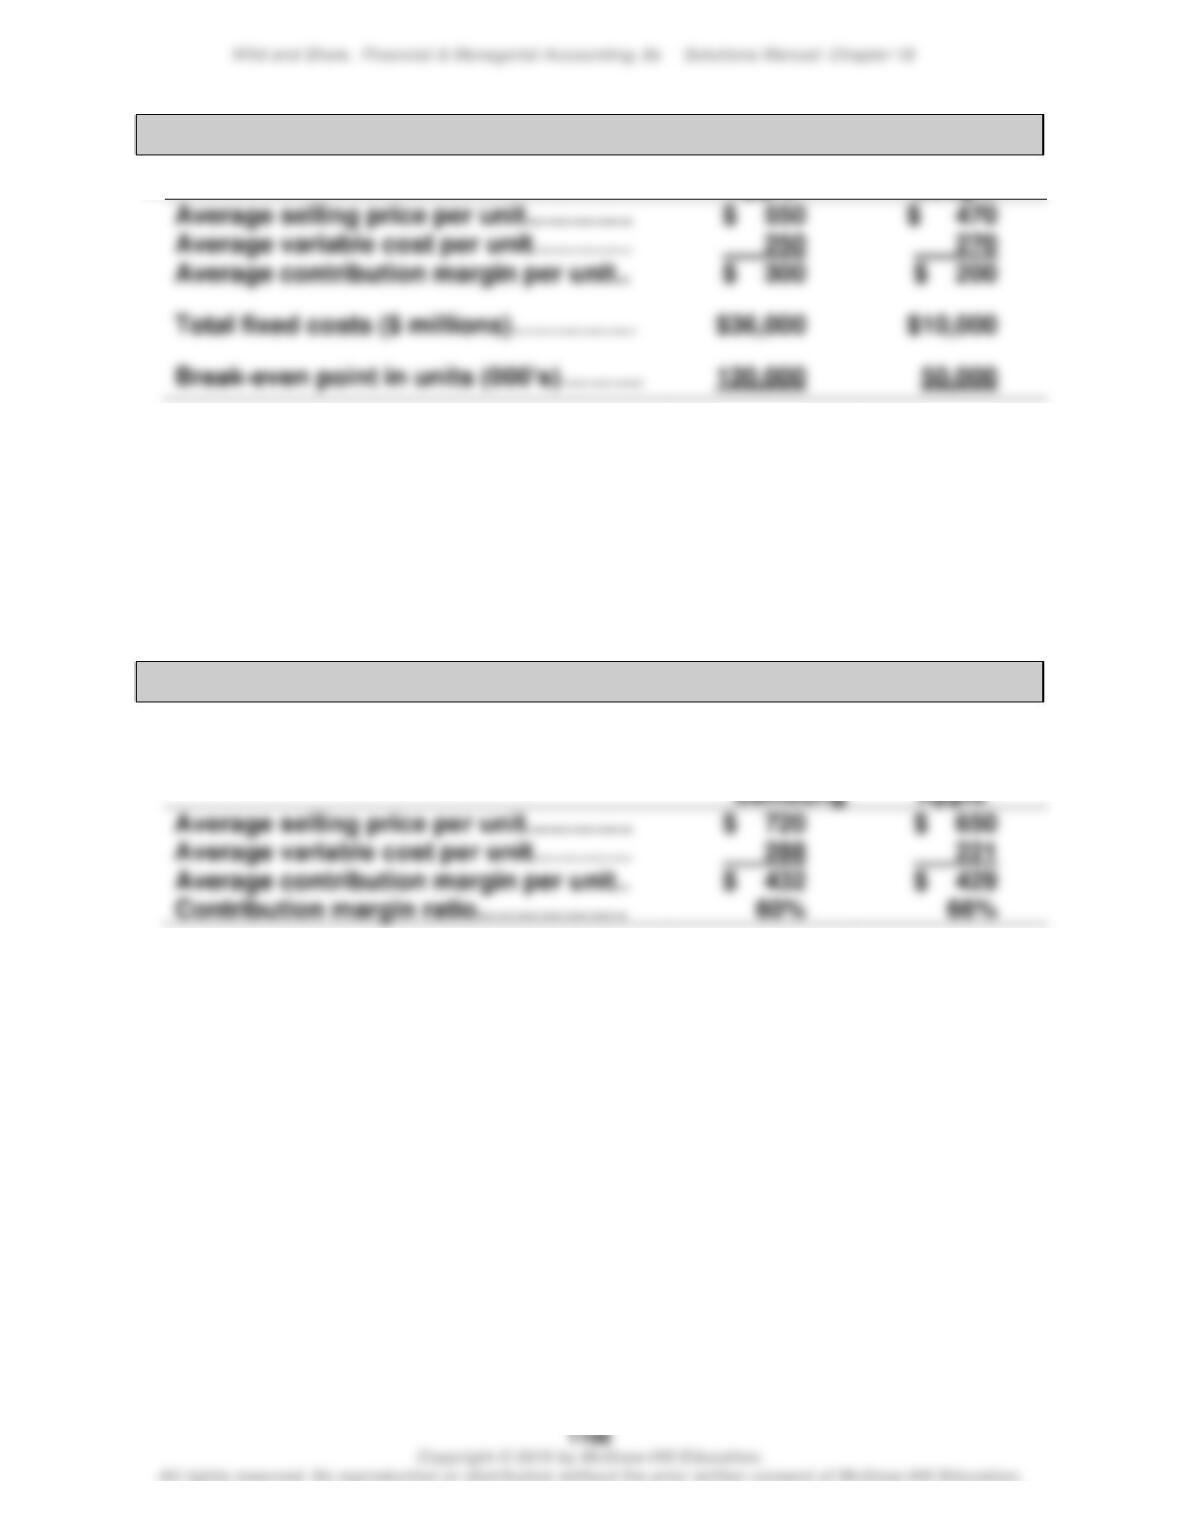
1.
Apple
Google
Average selling price per unit………….
Average variable cost per unit…………
Average contribution margin per unit..
Total fixed costs ($ millions)……………
2. As unit sales decline, Apple’s operating profits will fall by $300 per unit
versus Google’s decline in operating profits of $200 per unit. Thus,
operating profit will decline more for Apple than for Google as unit sales
decline.
Global Analysis — AA 18-3
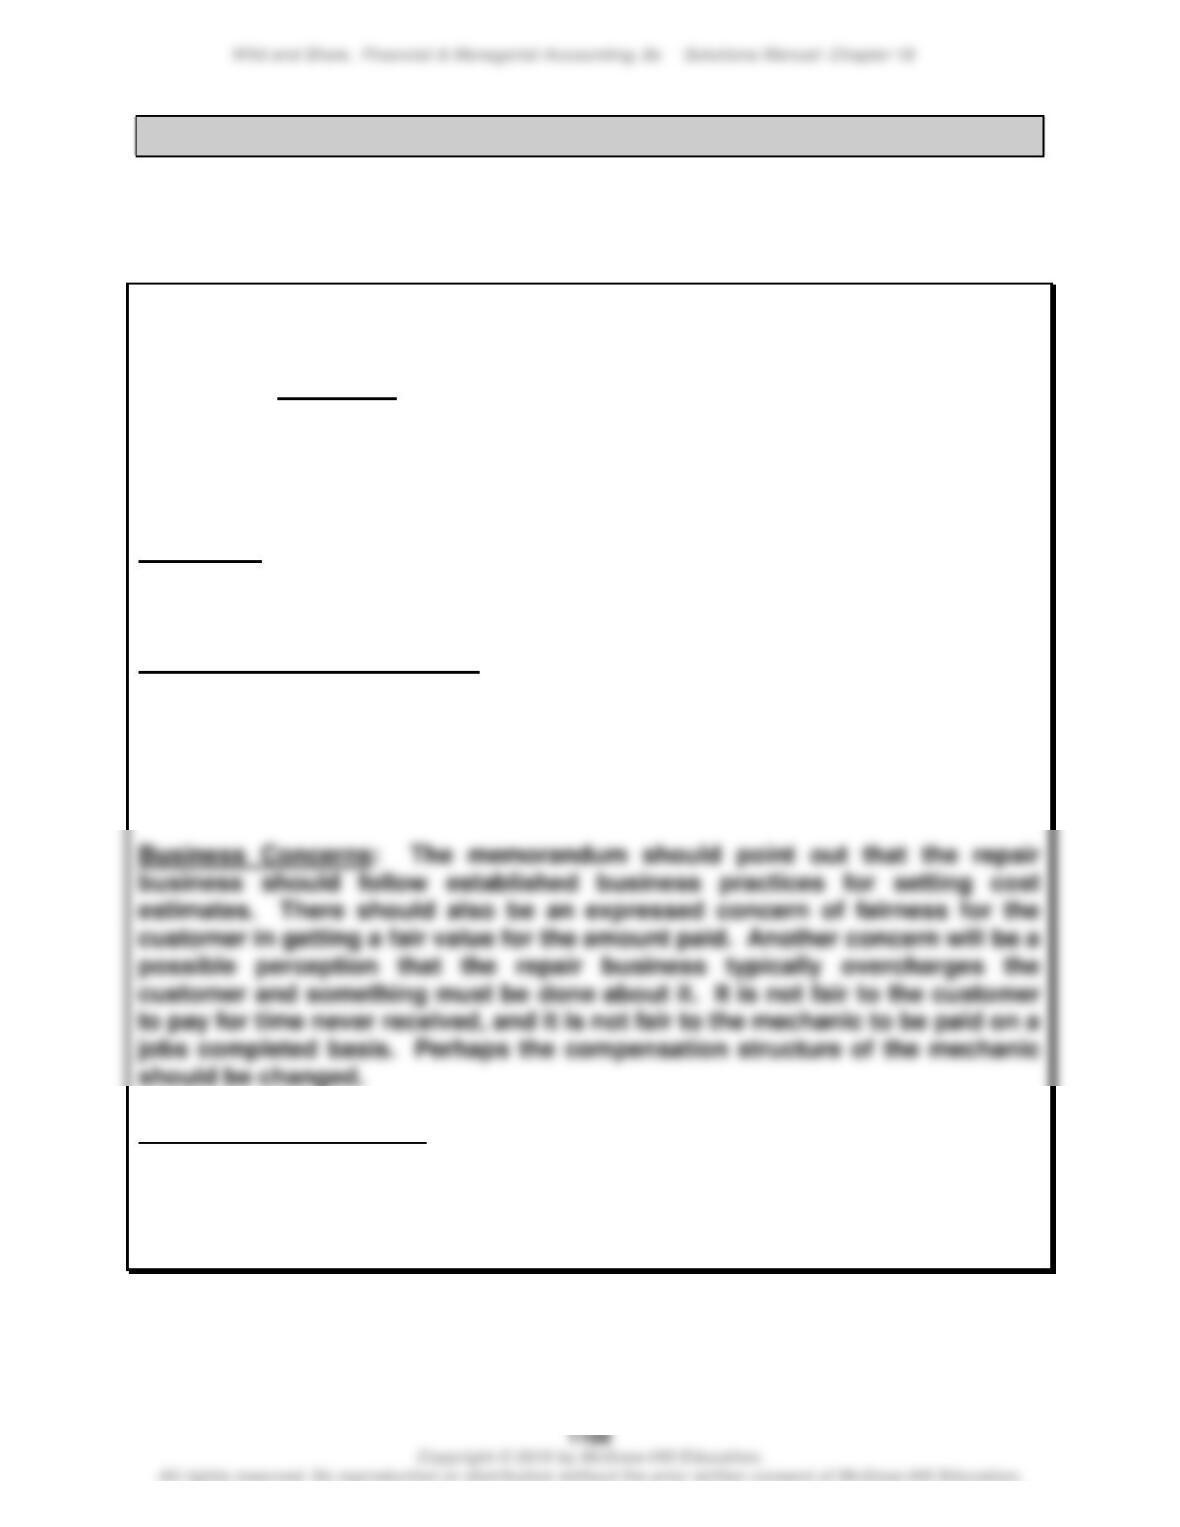
1.
2. Apple’s smartphone has a higher contribution margin ratio (66% versus
60% for Samsung. Thus, Apple’s smartphone sales contribute more
towards covering fixed costs.
Ethics Challenge — BTN 18-1
Instructor note: This question can serve to generate class discussion on
cost analysis and estimation. Discussion can focus on accounting,
business, and other ethical concerns.
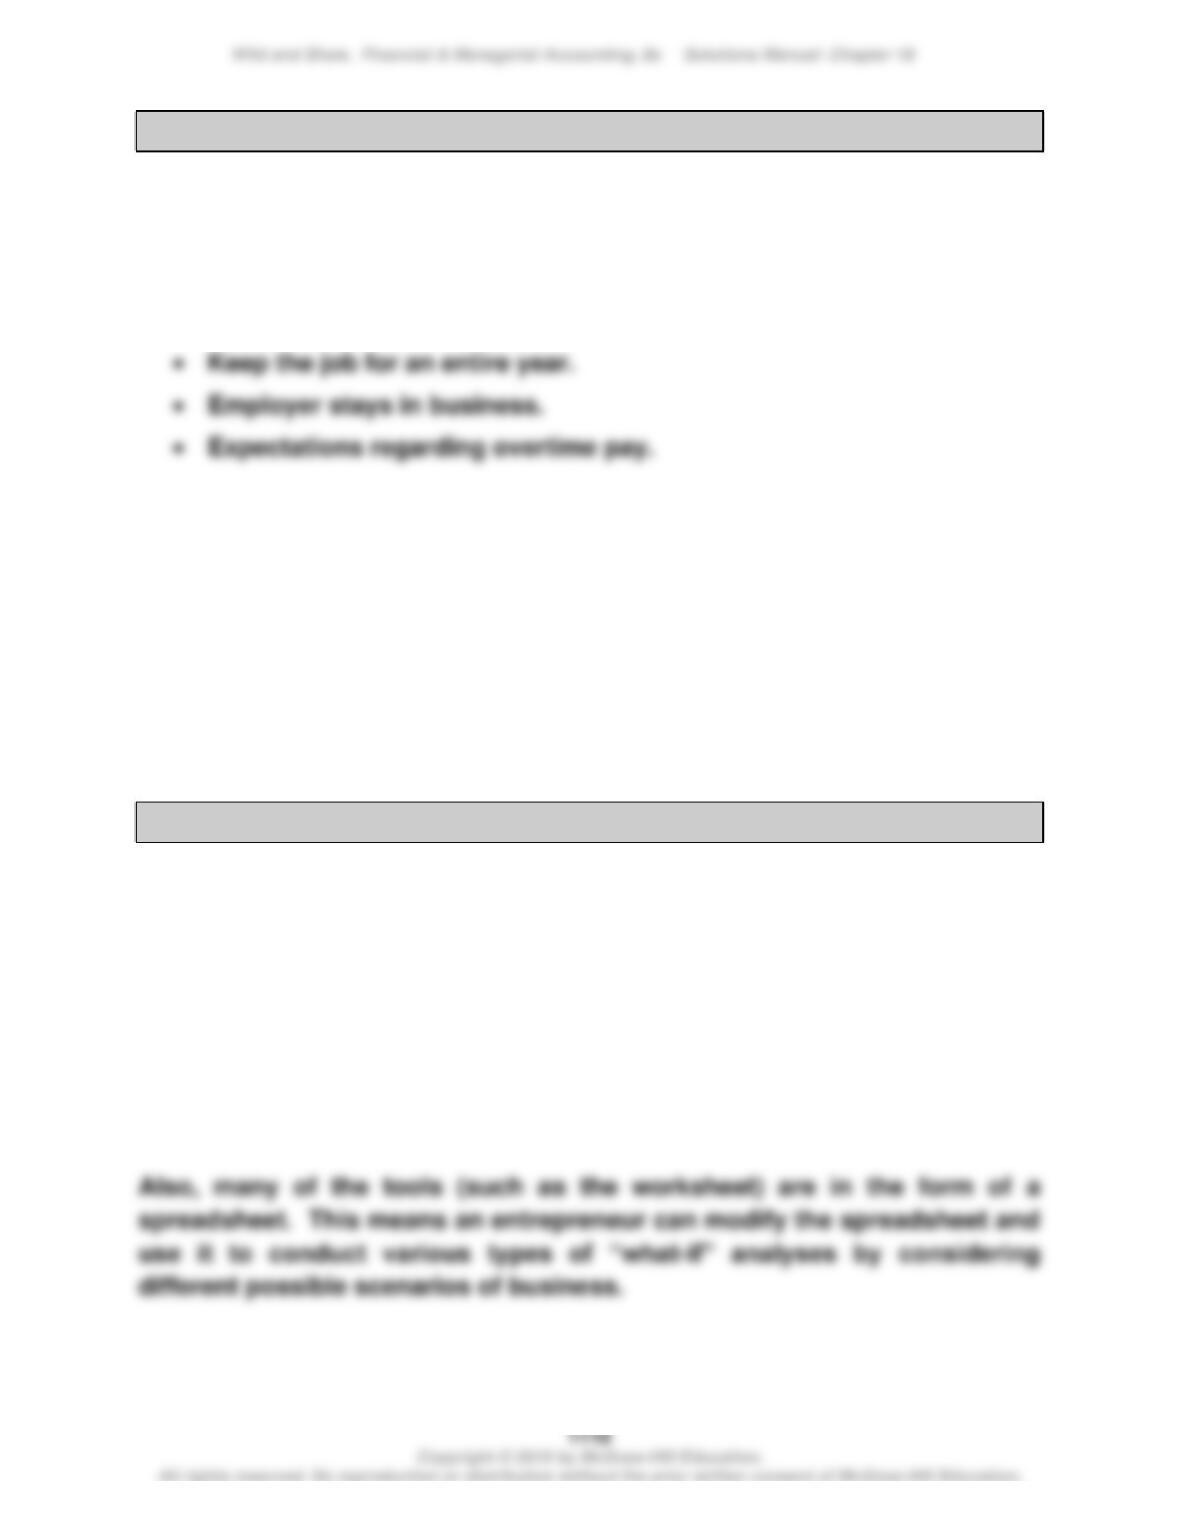
MEMORANDUM
To: “Mechanics” and “Owners”
From: Your name
RE: Analysis of labor costs for survey
Date: Current date
The memorandum should include many of the following points:
Objectivity: A statement about the need to be objective in the analysis. Both
ethical and professional concerns should motivate the preparer’s desire for
objectivity.
Cost Accounting Estimation: The memorandum should outline how cost
estimation is conducted. For example, you might describe how regression
analysis was used to estimate the average time to complete the most common
jobs. Explain why such an objective estimate is the time value that must be
reported. Reporting a greater time value would be in violation of the code of
professional ethics.
Mechanic-Related Issues: The memorandum should also be concerned about
the quality of mechanical work. Is the work being done correctly and is
customer safety in jeopardy by paying the mechanic on a job–by-job basis?
Who is responsible for establishing a fair compensation system? These
issues are likely topics for the memorandum.
Communicating in Practice — BTN 18-2
Instructor note: Reports will vary, but a typical report would likely include
assumptions similar to the following.
1. Revenue (salary) assumptions
• Find job that pays a specified amount.
2. Cost assumptions
• Find living accommodations at a specified amount.
• Avoid costly entertainment events.
• Stay healthy and do not incur excess medical expenses.
• Cost estimates for food, clothing, and other necessities.
Taking It to the Net — BTN 18-3
The site offers many tools for an entrepreneur in assessing costs, sales,
and profits. Specifically, a spreadsheet file is provided that allows an
entrepreneur to identify the start-up costs of the business. A new business
requires many different types of costs for the different resources to be
acquired (such as people, space, and equipment), which sometimes are
overlooked by less-experienced entrepreneurs. This worksheet can serve
as a “check–list,” prompting the entrepreneur to at least think about the
different costs and their amounts.
Wild and Shaw, Financial & Managerial Accounting, 8e Solutions Manual: Chapter 18
Teamwork in Action — BTN 18-4
(a) Questions for school administrators (others are possible)
• Number of students that would attend the theater.
• Frequency of class scheduled showings.
• Legal (liability) issues for field trips and associated costs.
• Costs of providing movies to students at school.
(b) Questions for owners (others are possible)
Entrepreneurial Decision — BTN 18-5
1. Costs that won’t change regardless of how much tea Ellis Island
Tropical Tea sells (i.e., fixed costs) likely include rent, depreciation on
equipment, insurance, and taxes.
2. Overly optimistic sales estimates could lead the company to expand
into markets or products that are unable to break-even or make profits.
Hitting the Road — BTN 18-6
1. There is no set solution for this problem. Answers will vary because each
student will make different estimates for groups, costs, and volume. The
instructor should make certain the student follows the correct steps in
preparing a multiproduct break-even analysis. This activity is designed to
show the student that several estimates are required in this type of CVP
analysis.
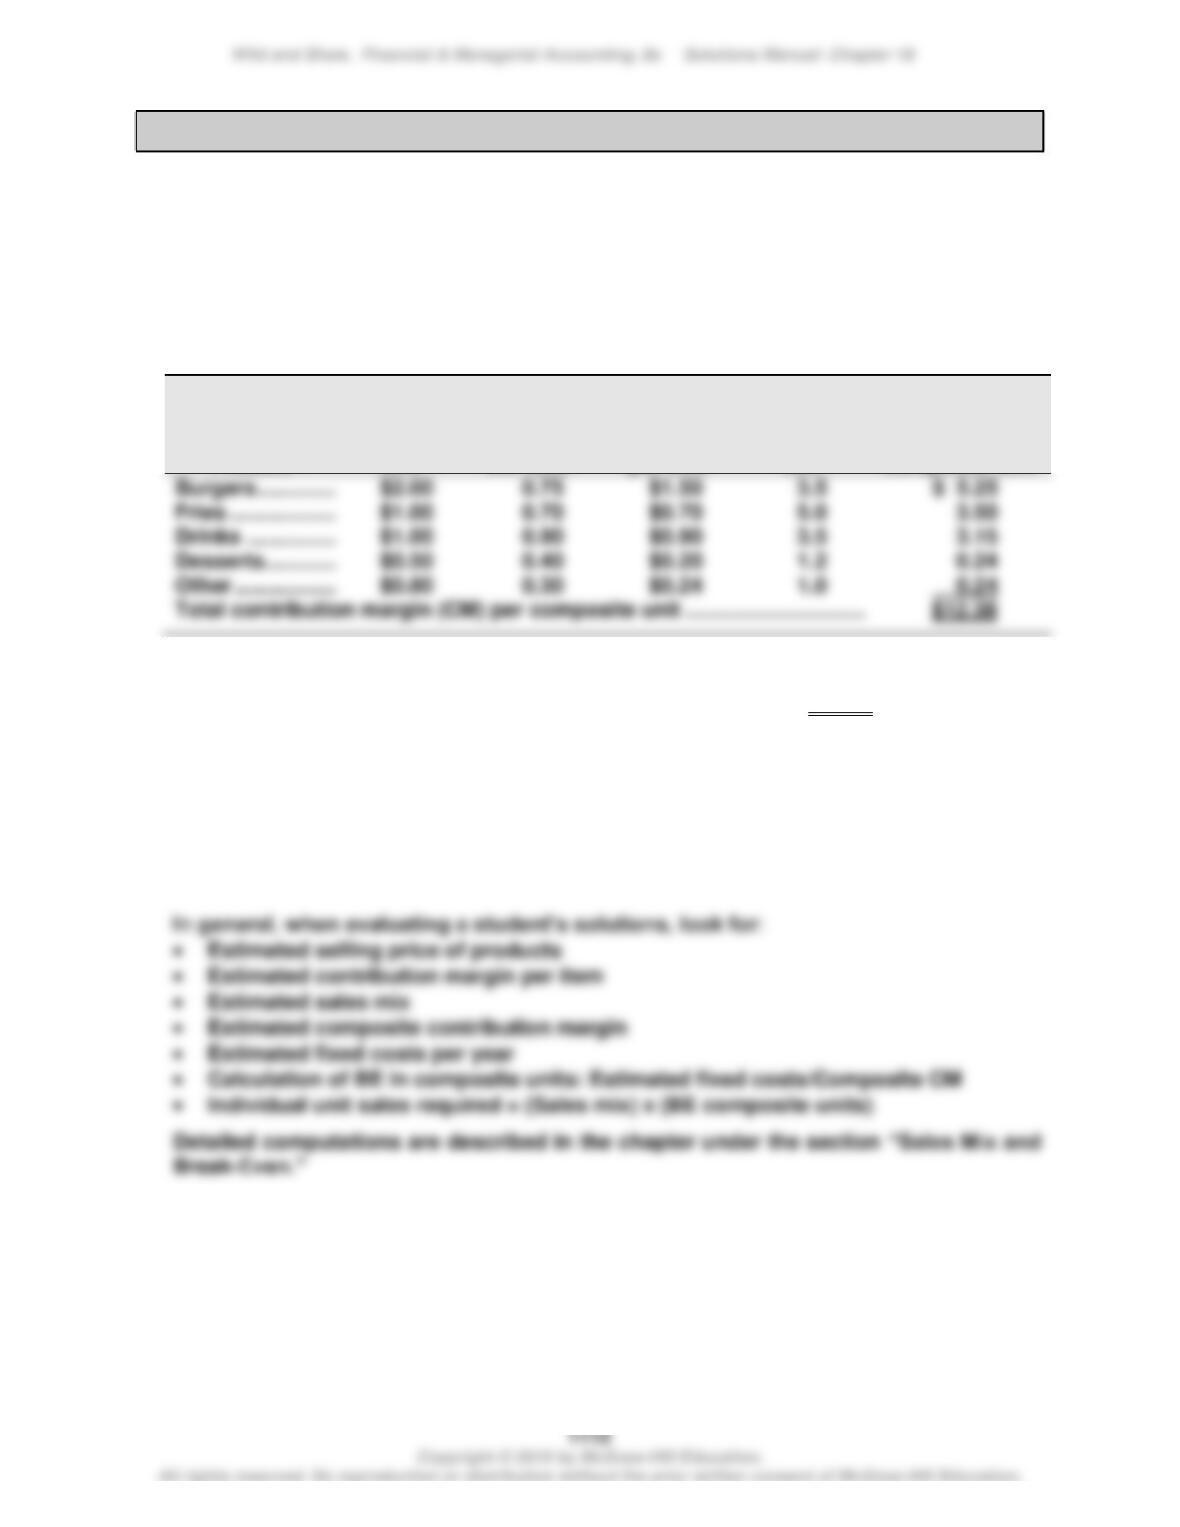
One simple example with crucial facts:
per unit
Burgers …………………………..
$1.50
Fries …………………………..
$0.70
Drinks …………………………..
$0.90
Desserts………………………….
$0.20
Other …………………………..
$0.24
Estimated
Selling
Price per
Estimated
Estimated
CM
Estimated
Sales
Estimated CM
for each
component in
Estimated fixed costs per year: $500,000
Break-even point in composite unit sales: $500,000/$12.38 = 40,388
Unit sales of individual products per year required to break-even:
Burgers …………………………..
40,388 x 3.5 =
141,358 units
Fries …………………………..
40,388 x 5.0 =
201,940 units
Drinks …………………………..
40,388 x 3.5 =
141,358 units
Desserts………………………….
40,388 x 1.2 =
48,466 units
Other …………………………..
40,388 x 1.0 =
40,388 units
2. The report should properly interpret the analysis from part 1. This
question is also designed to show students that a fast food restaurant
must sell high volumes of certain product categories to make a profit.
Students recognize that to generate this volume a restaurant must have
a reasonably consistent flow of customers.