CHAPTER 18 Process Cost Systems
Ex. 18–15 (FIN MAN); Ex. 3–15 (MAN)
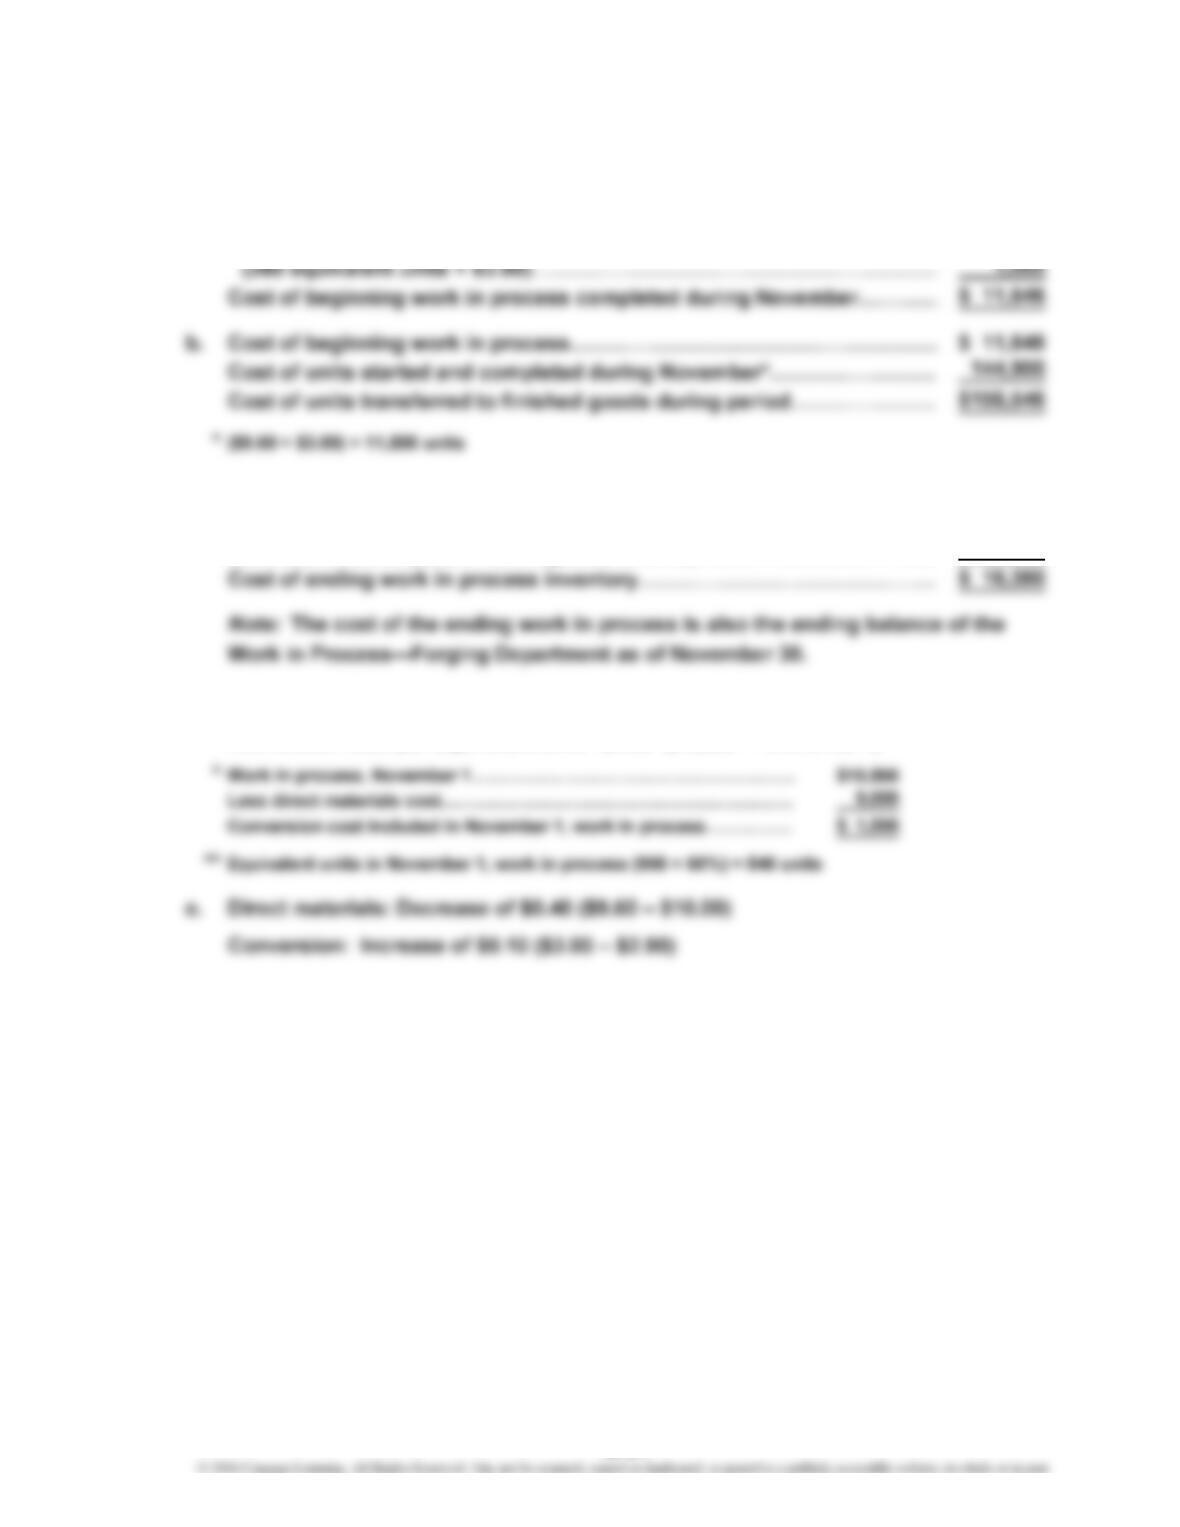
a. $11,646; determined as follows:
Beginning work in process balance……………………………………………
…
$ 10,566
Conversion costs incurred during November
c. $16,380; determined as follows:
Direct materials ($9.60 × 1,400 units)…………………………………………
…
$ 13,440
Conversion costs ($3.00 × 980 equivalent units)……………………………
…
2,940
d. Direct materials cost per equivalent unit: $10.00 ($9,000 ÷ 900 units)
Conversion cost per equivalent unit: $2.90 ($1,566* ÷ 540 units**)
18-21
…
CHAPTER 18 Process Cost Systems
Ex. 18–16 (FIN MAN); Ex. 3–16 (MAN)
Whole Direct
UNITS Units Materials Conversion
(1) (1)
Units charged to production:
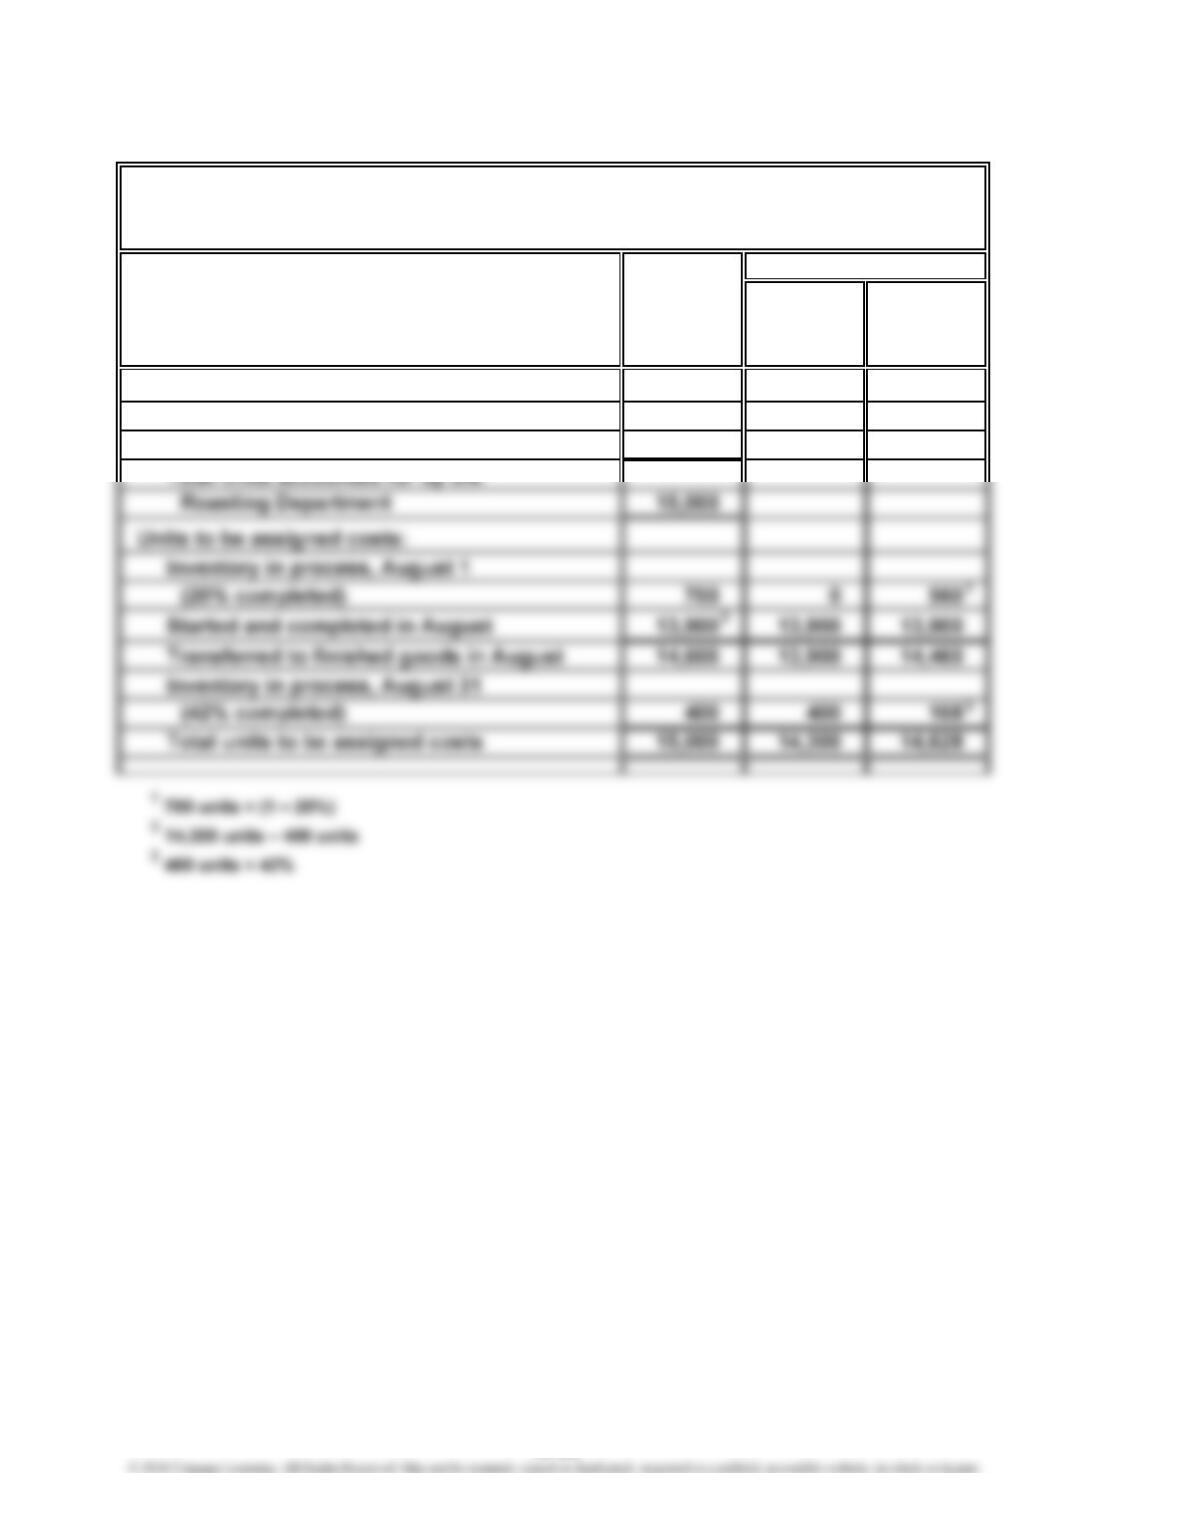
Inventory in process, August 1 700
Received from materials storeroom 14,300
MORNING BREW COFFEE COMPANY
Cost of Production Report—Roasting Department
For the Month Ended August 31, 2016
Equivalent Units
18-22
CHAPTER 18 Process Cost Systems
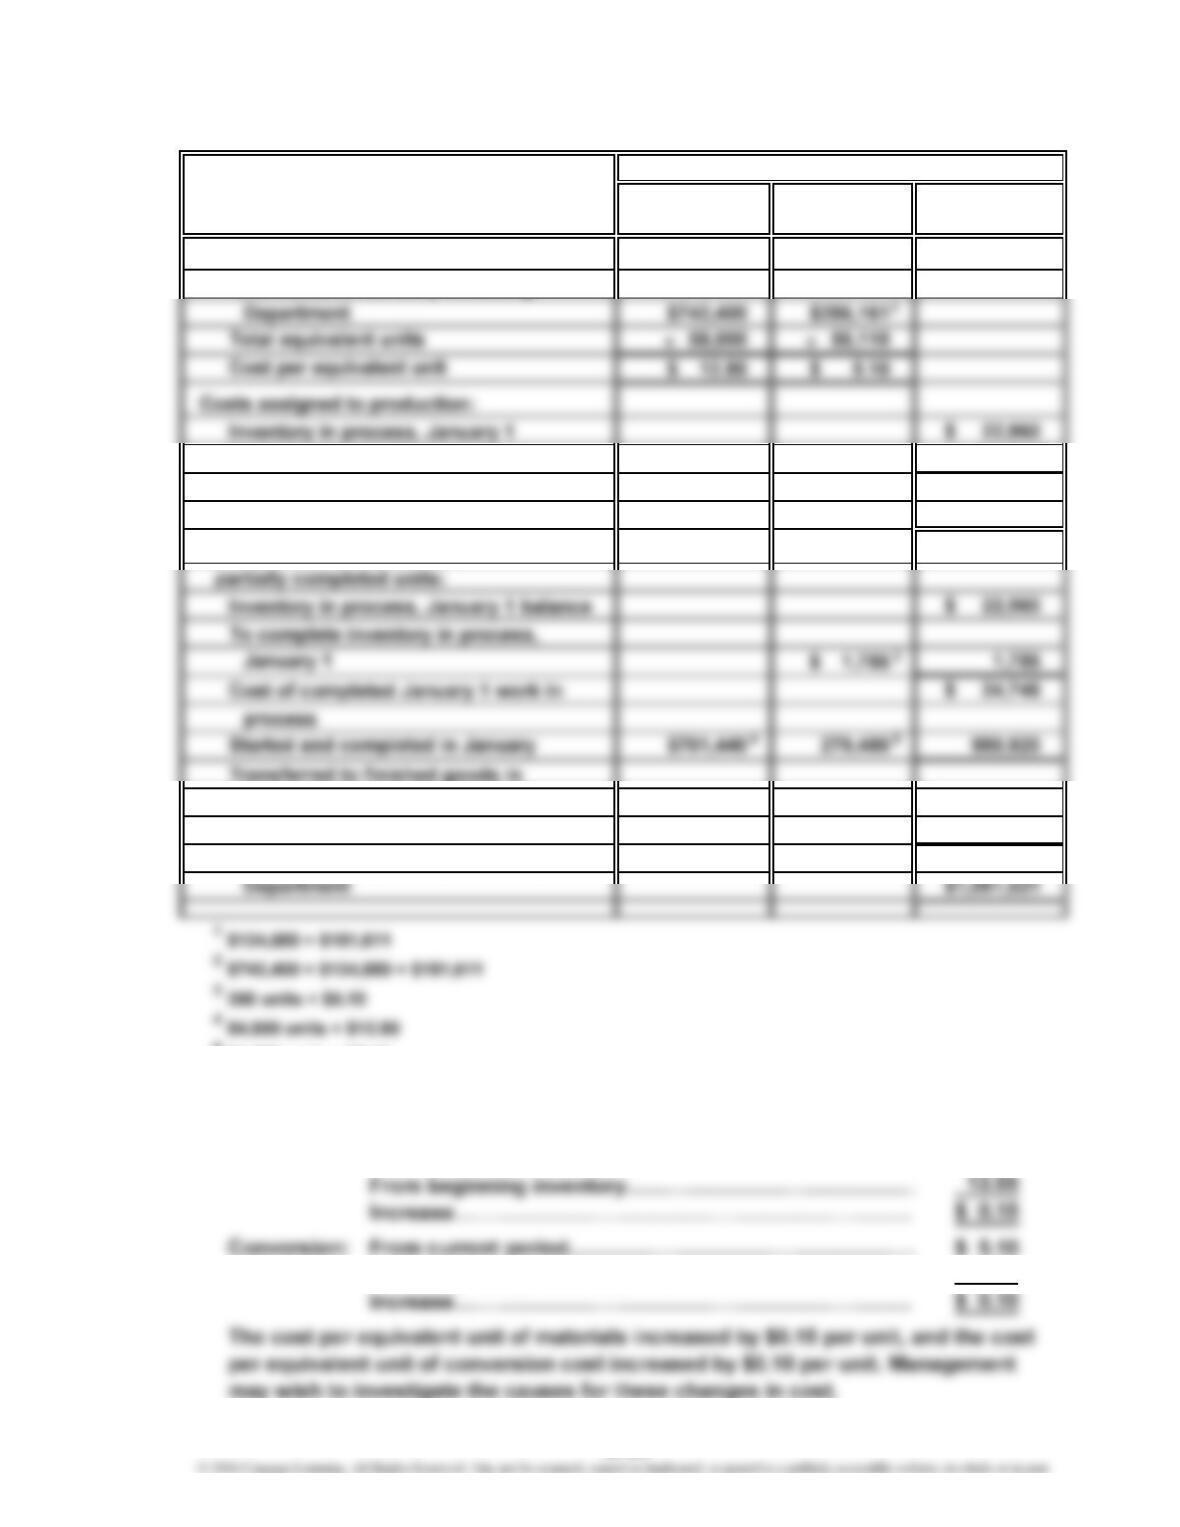
Ex. 18–16 (FIN MAN); Ex. 3–16 (MAN) (Concluded)
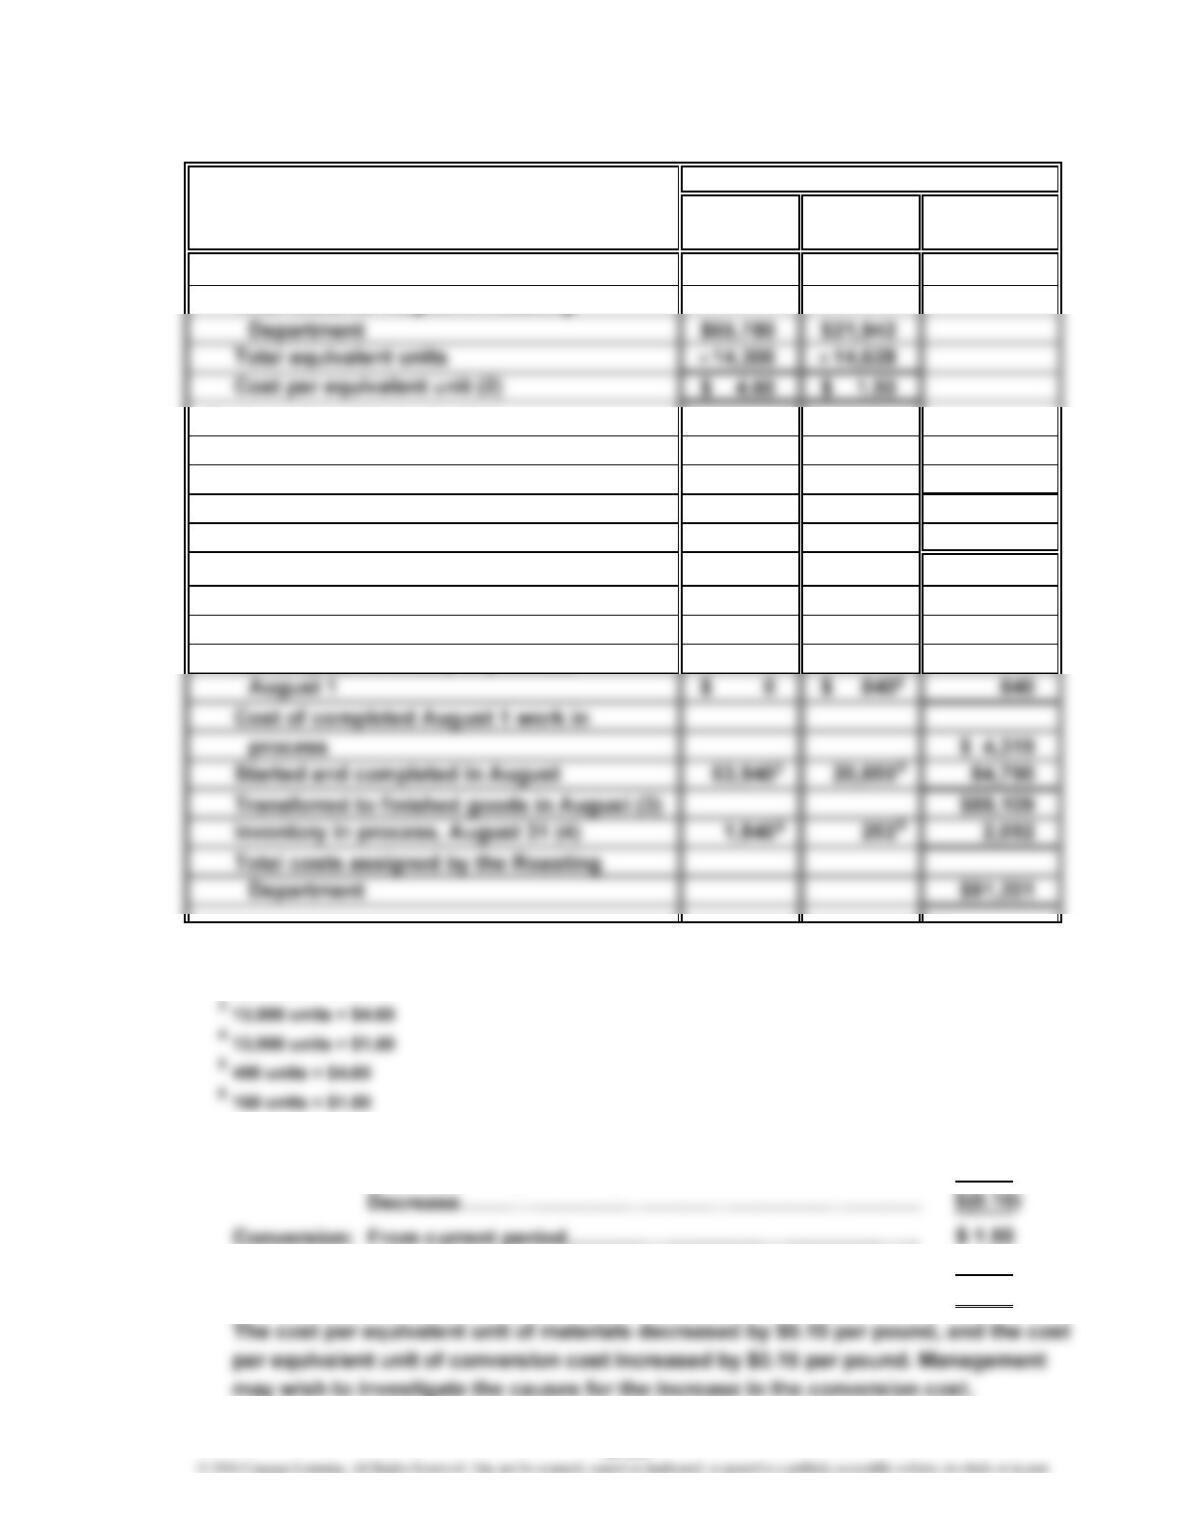
Direct
COSTS Materials Conversion Total
Costs per equivalent unit:
Total costs for August in Roasting
Costs assigned to production:
Inventory in process, August 1 $ 3,479
Costs incurred in August 87,722
Total costs accounted for by the
Roasting Department $91,201
Costs allocated to completed and
partially completed units:
Inventory in process, August 1 balance $ 3,479
To complete inventory in process,
1
$65,780 + $21,942
2
560 units × $1.50
b. Materials: From current period……………………………………………
From beginning inventory……………………………………
…
From beginning inventory……………………………………
…
Increase…………………………………………………………
…
1.35
$ 0.15
Costs
$ 4.60
4.70
1
18-23
CHAPTER 18 Process Cost Systems
Ex. 18–17 (FIN MAN); Ex. 3–17 (MAN)
a.
Whole Direct
UNITS
Units Materials Conversion
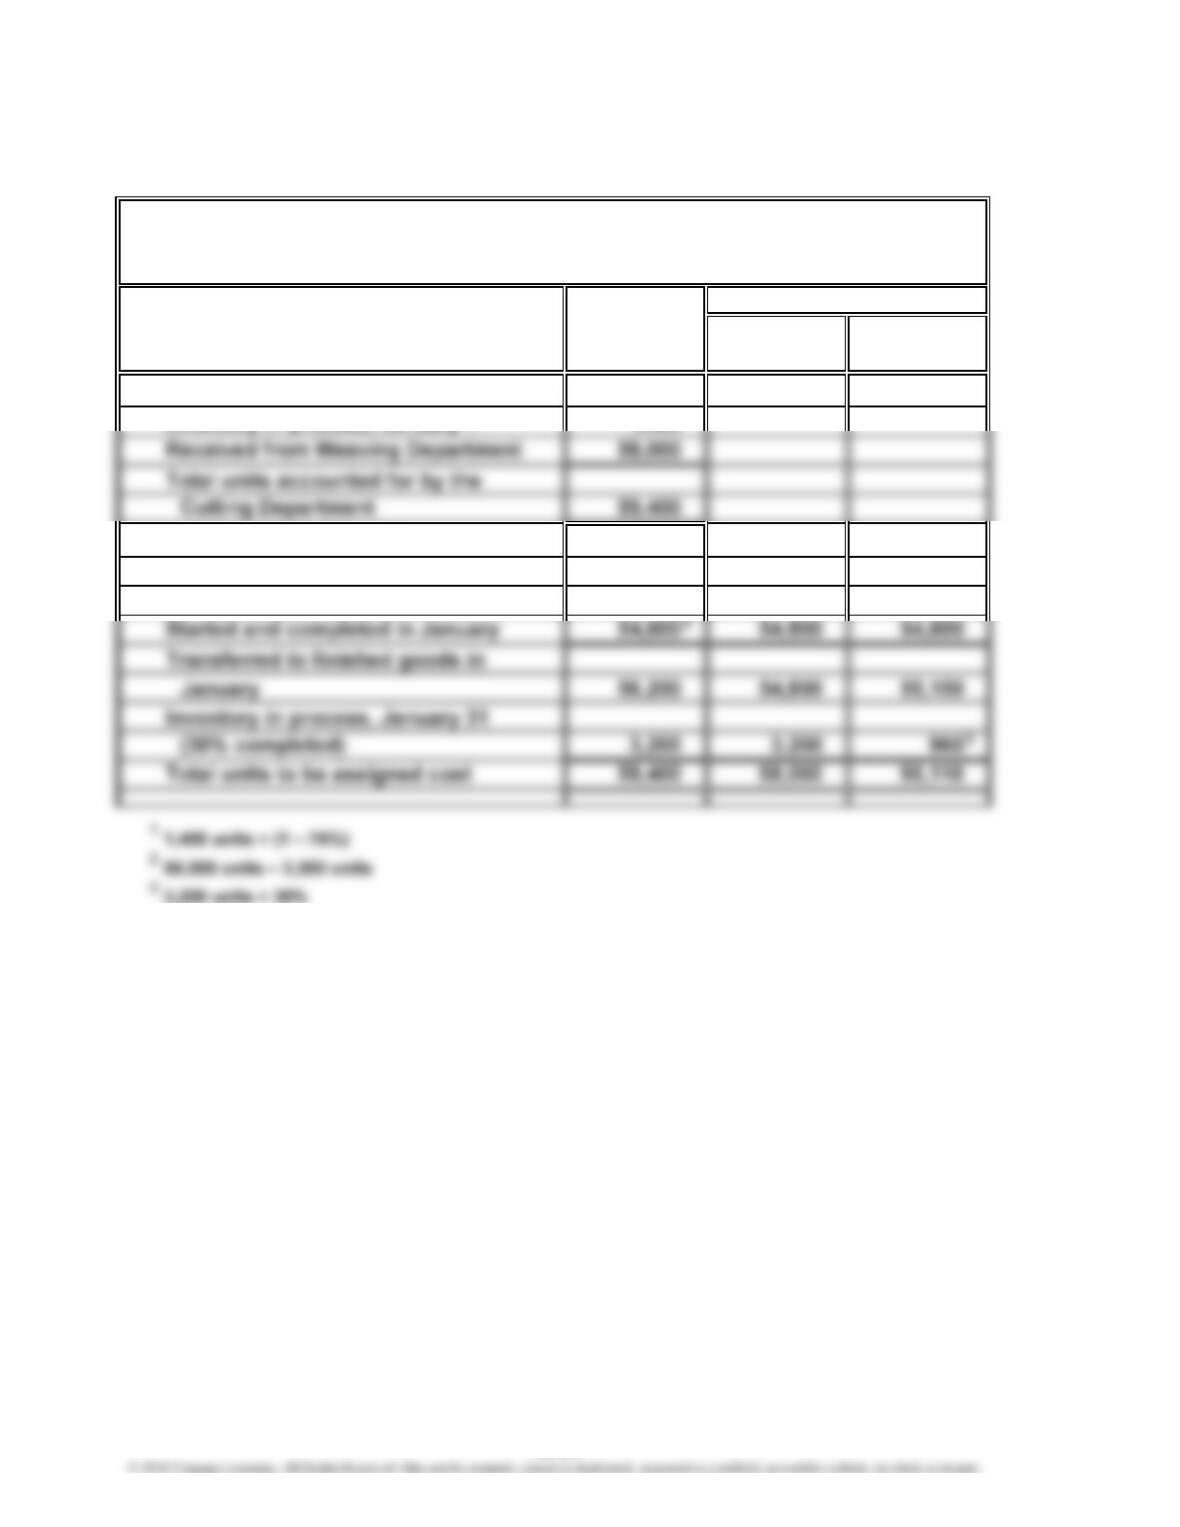
Units charged to production:
Inventory in process, January 1 1,400
Units to be assigned cost:
Inventory in process, January 1
(75% completed) 1,400 0350
KARACHI CARPET COMPANY
Cost of Production Report—Cutting Department
For the Month Ended January 31, 2016
Equivalent Units
1
18-24
CHAPTER 18 Process Cost Systems
Ex. 18–17 (FIN MAN); Ex. 3–17 (MAN) (Concluded)
Direct
COSTS Materials Conversion Total
Costs per equivalent unit:
Total costs for January in Cutting
Costs incurred in January 1,028,561
Total costs accounted for by the
Cutting Department $1,051,521
Cost allocated to completed and
January $1,005,665
Inventory in process, January 31 40,960 4,896 45,856
Total costs assigned by the Cutting
5
54,800 units × $5.10
6
3,200 units × $12.80
7
960 units × $5.10
b. Materials: From current period…………………………………………
…
…
…
From beginning inventory…………………………………
…
5.00
Costs
$12.80
67
2
18-25
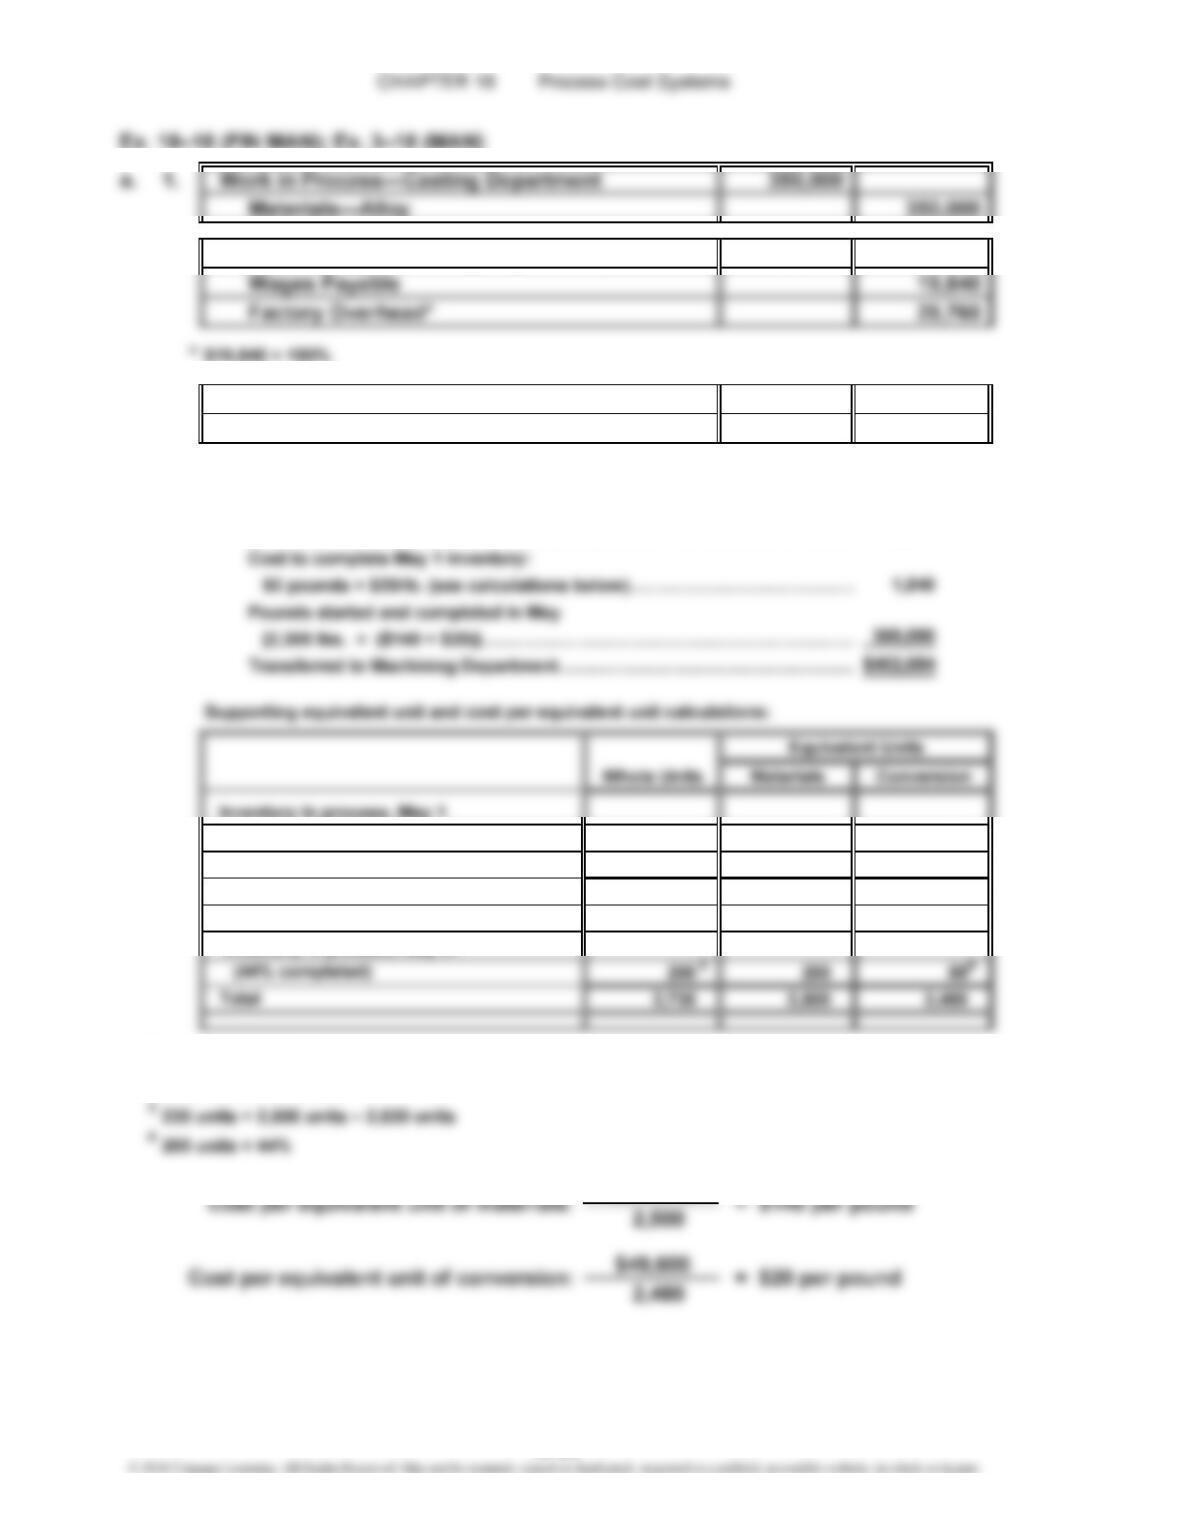
2. Work in Process—Casting Department 49,600
3. Work in Process—Machining Department* 402,684
Work in Process—Casting Department 402,684
*
Supporting calculations:
Cost of 2,530 transferred-out pounds:
Inventory in process, May 1………………………………………………………
…
$ 32,844
(60% completed) 230 0 92
Started and completed in May 2,300 2,300 2,300
Transferred to Machining Department
in May 2,530 2,300 2,392
Inventory in process, May 31
1
230 units × (1 – 60%)
2
2,530 units – 230 units
$350,000
1
2
18-26
CHAPTER 18 Process Cost Systems
Ex. 18–18 (FIN MAN); Ex. 3–18 (MAN) (Concluded)
b. $29,760; determined as follows:
Direct materials (200 × $140)……………………………
…
$28,000
or $29,760 = $32,844 + $350,000 + $49,600 – $402,684
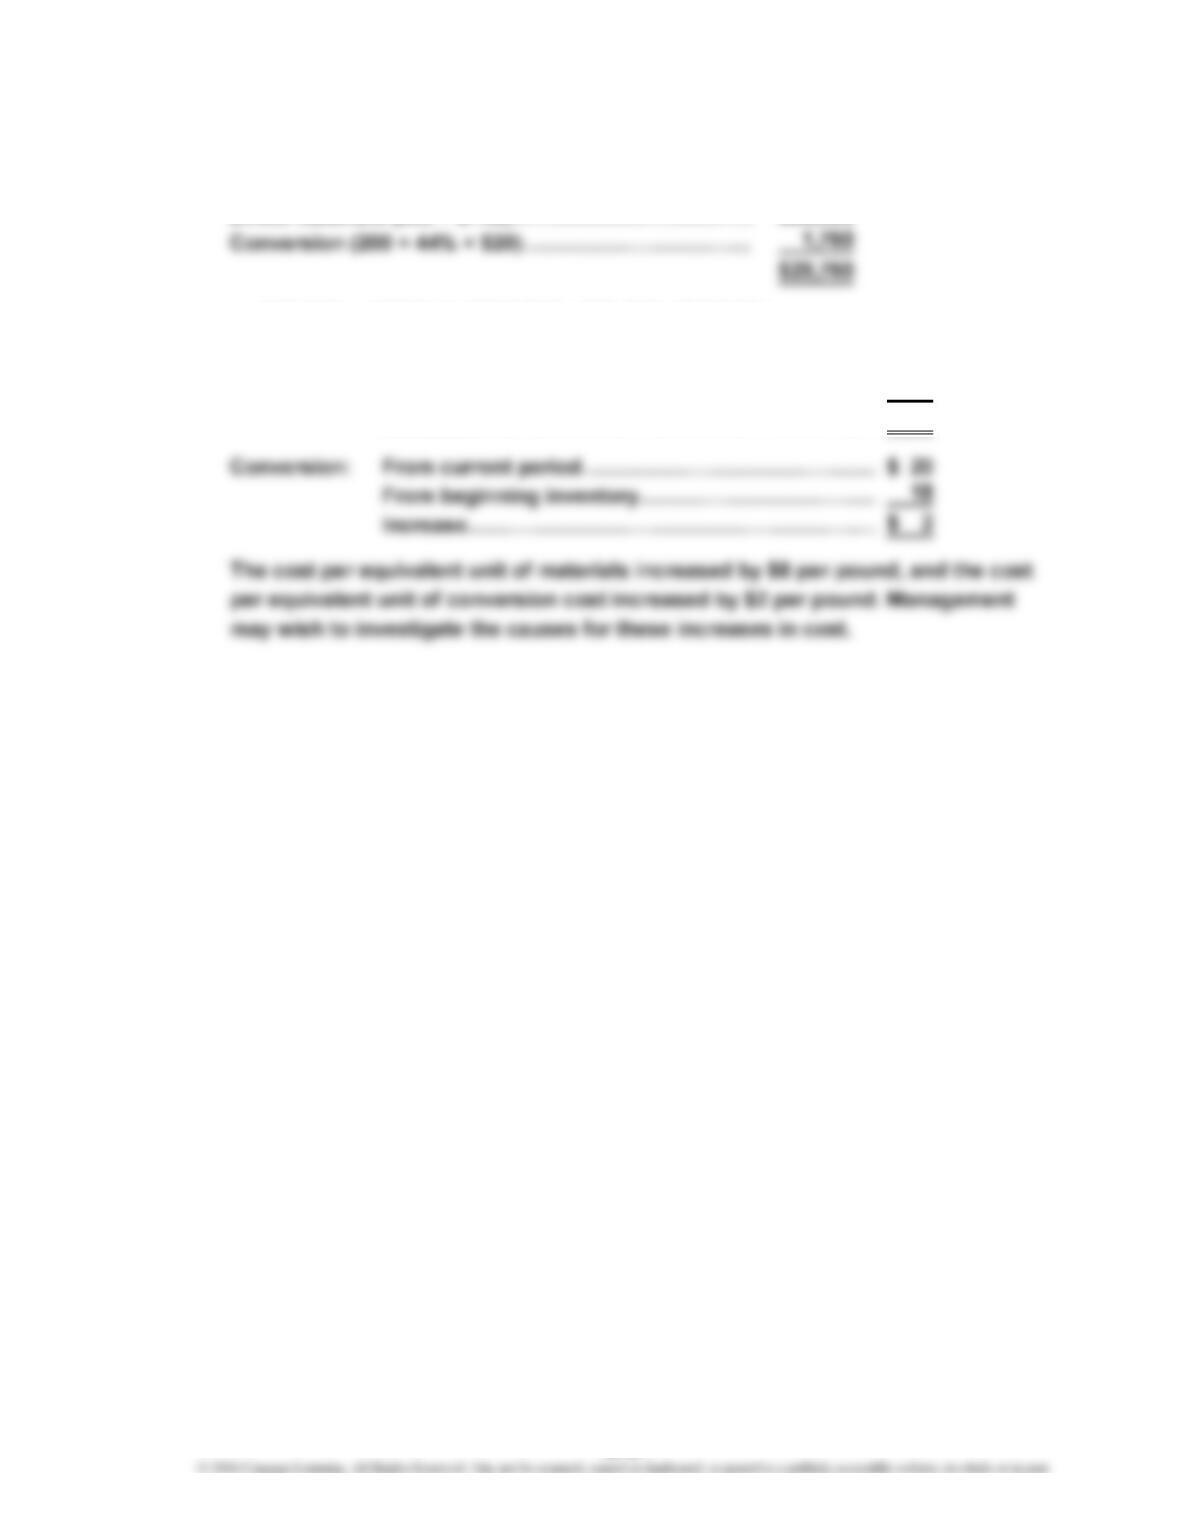
c. Materials: From current period……………………………………
…
$140
From beginning inventory……………………………
…
132
Increase…………………………………………………
…
$8
…
…
…
18-27
CHAPTER 18 Process Cost Systems
Ex. 18–19 (FIN MAN); Ex. 3–19 (MAN)
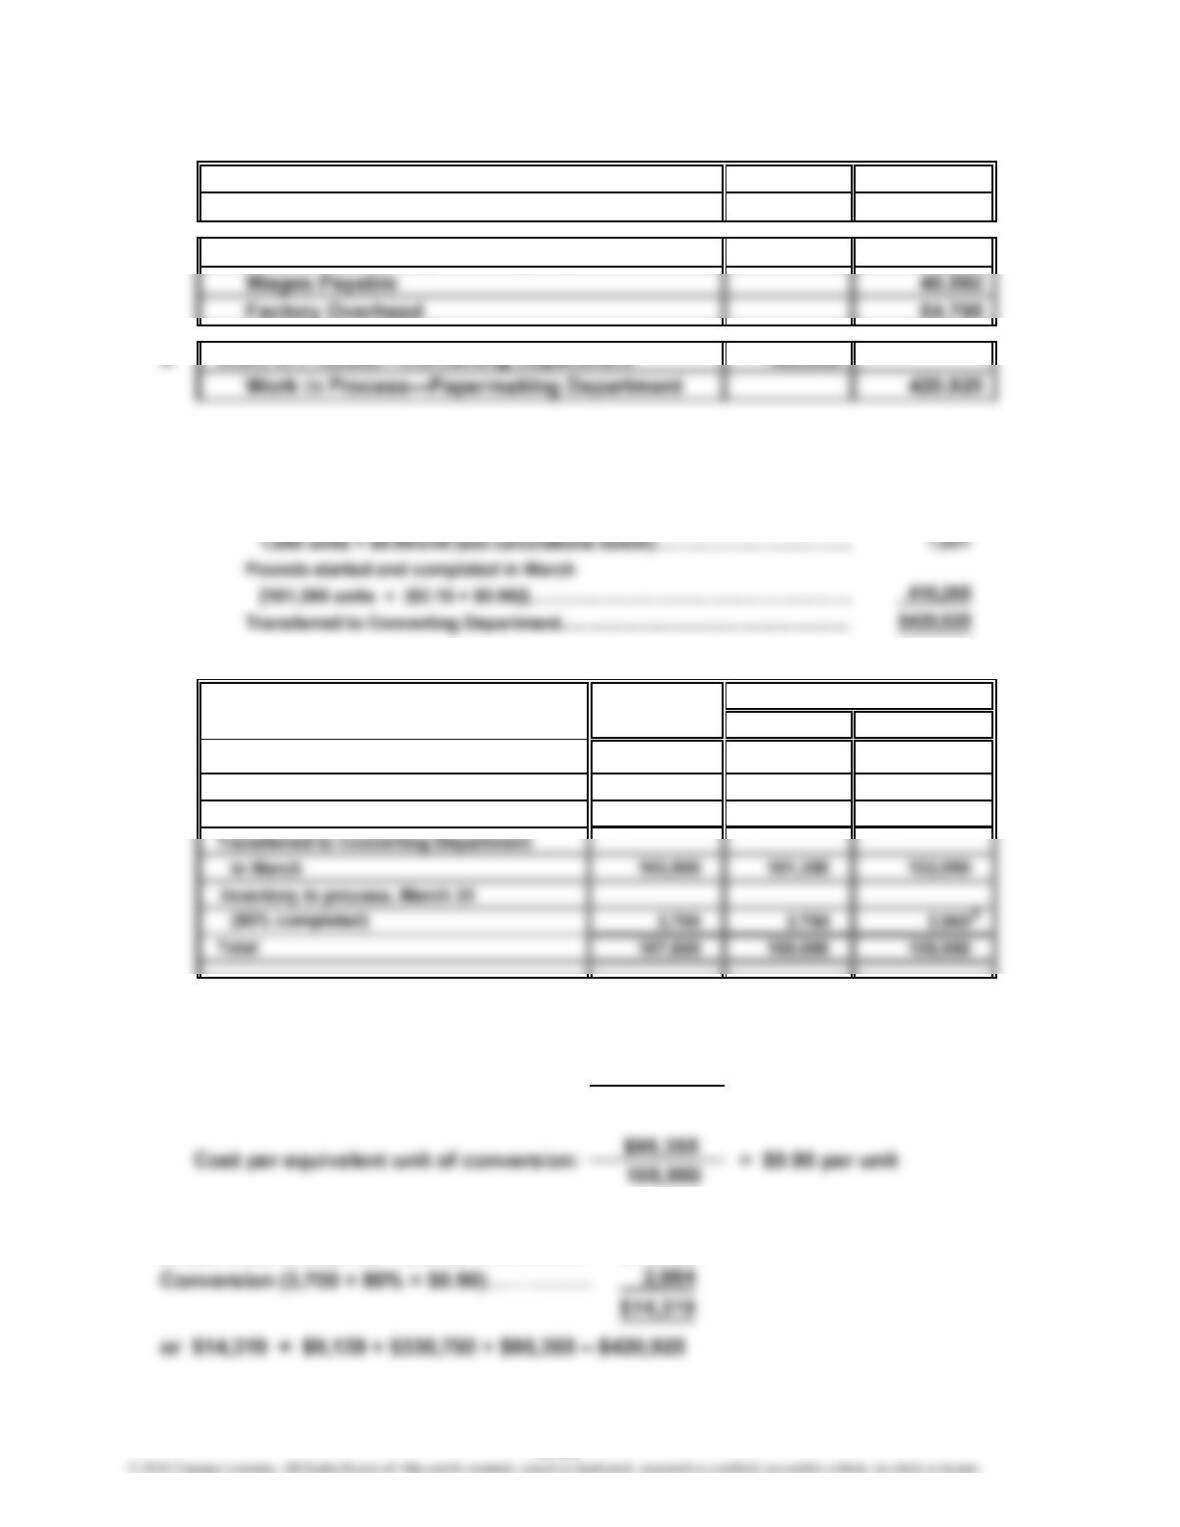
a. 1. Work in Process—Papermaking Department 330,750
Materials—Pulp 330,750
2. Work in Process—Papermaking Department 95,355
3. Work in Process—Converting Department* 420,925
*
Supporting calculations:
Cost of 103,900 transferred-out units:
Inventory in process, March 1……………………………………………………
…
$ 9,139
Cost to complete March 1 inventory:
Supporting equivalent unit and cost per equivalent unit calculations:
Whole Units Materials Conversion
Inventory in process, March 1
(35% completed) 2,600 0 1,690
Started and completed in March 101,300 101,300 101,300
1
2,600 units × (1 – 35%)
2
3,700 units × 80%
$330,750
105,000
b. $14,319; determined as follows:
Direct materials (3,700 × $3.15)……………… $11,655
Equivalent Units
= $3.15 per unitCost per equivalent unit of materials:
1
18-28
CHAPTER 18 Process Cost Systems
Ex. 18–20 (FIN MAN); Ex. 3–20 (MAN)
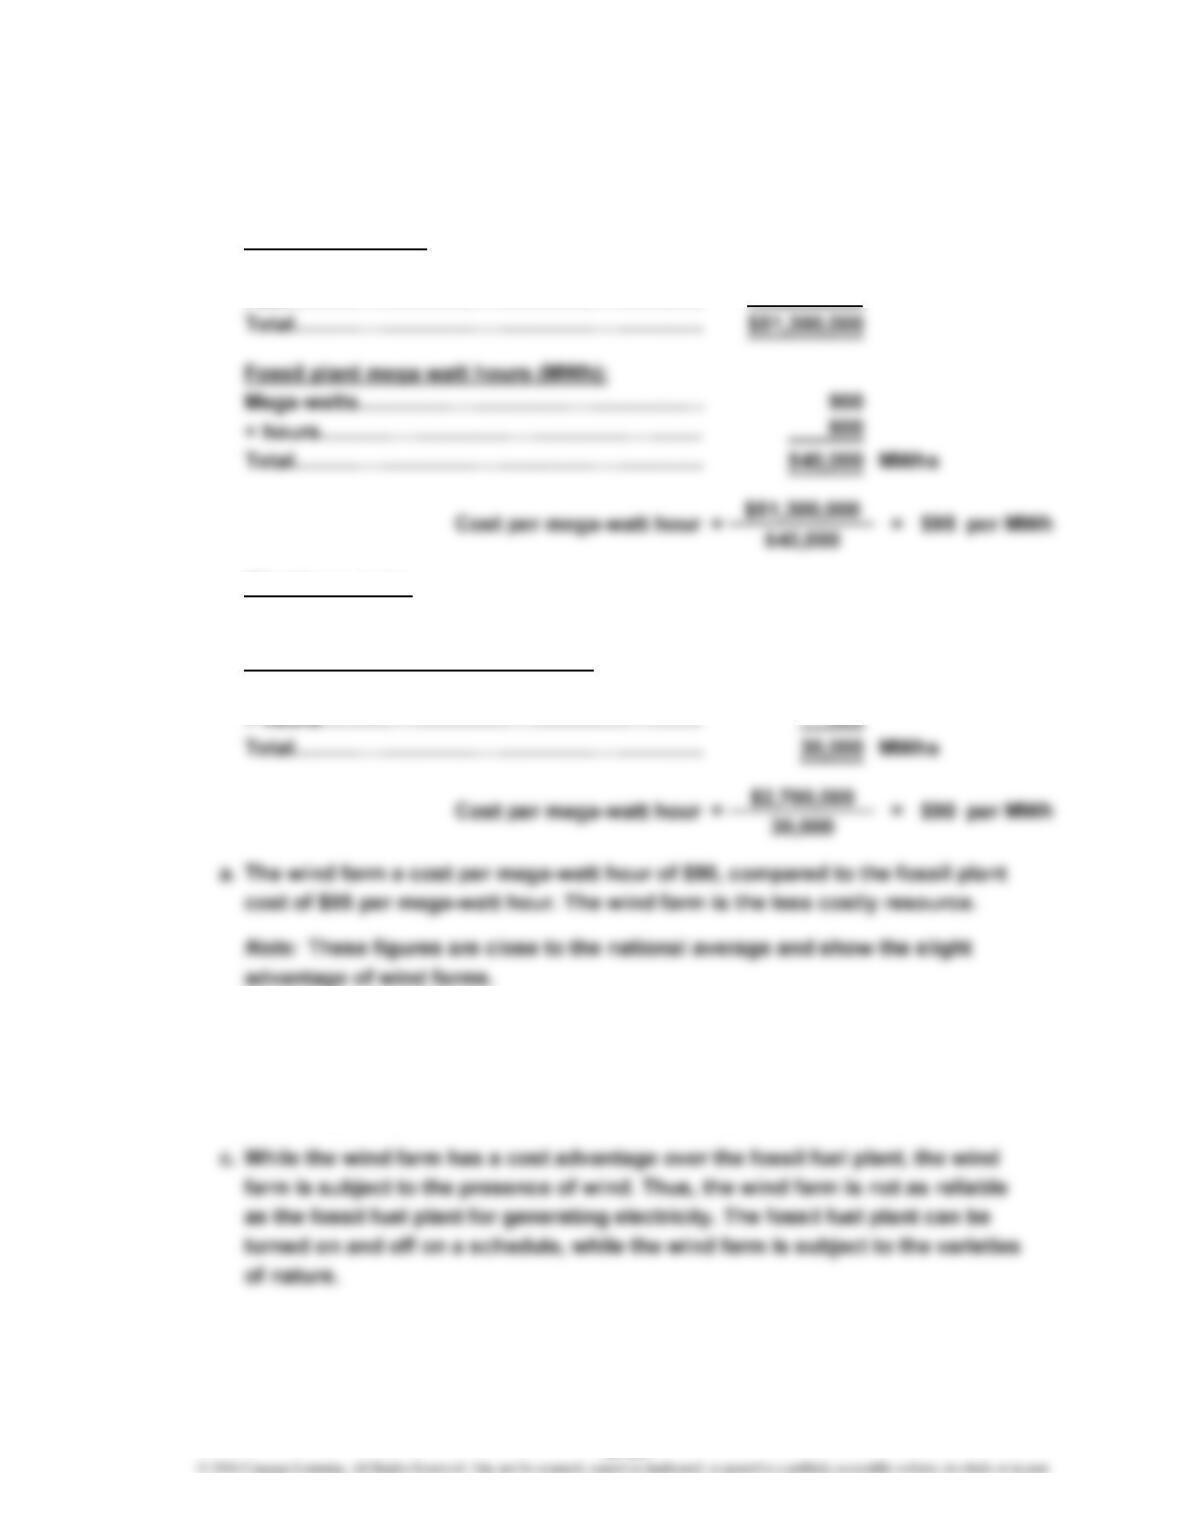
a. Cost per mega watt hour (MWh):
Fossil plant costs:
Conversion costs…………………………………
…
$40,500,000
Fuel…………………………………………………… 10,800,000
Wind farm costs:
Conversion costs…………………………………
…
$2,700,000
Wind farm mega watt hours (MWh):
Mega watts…………………………………………
…
100
…
b. Equivalent units of production are calculated when there are beginning or
ending inventories that are partially completed to either coversion costs or
materials. There are no beginning or ending inventories for generating
electricity; thus, there is no need to determine equivalent units of production.
18-29
…
…
CHAPTER 18 Process Cost Systems
Ex. 18–21 (FIN MAN); Ex. 3–21 (MAN)
Memo
To: Production Manager
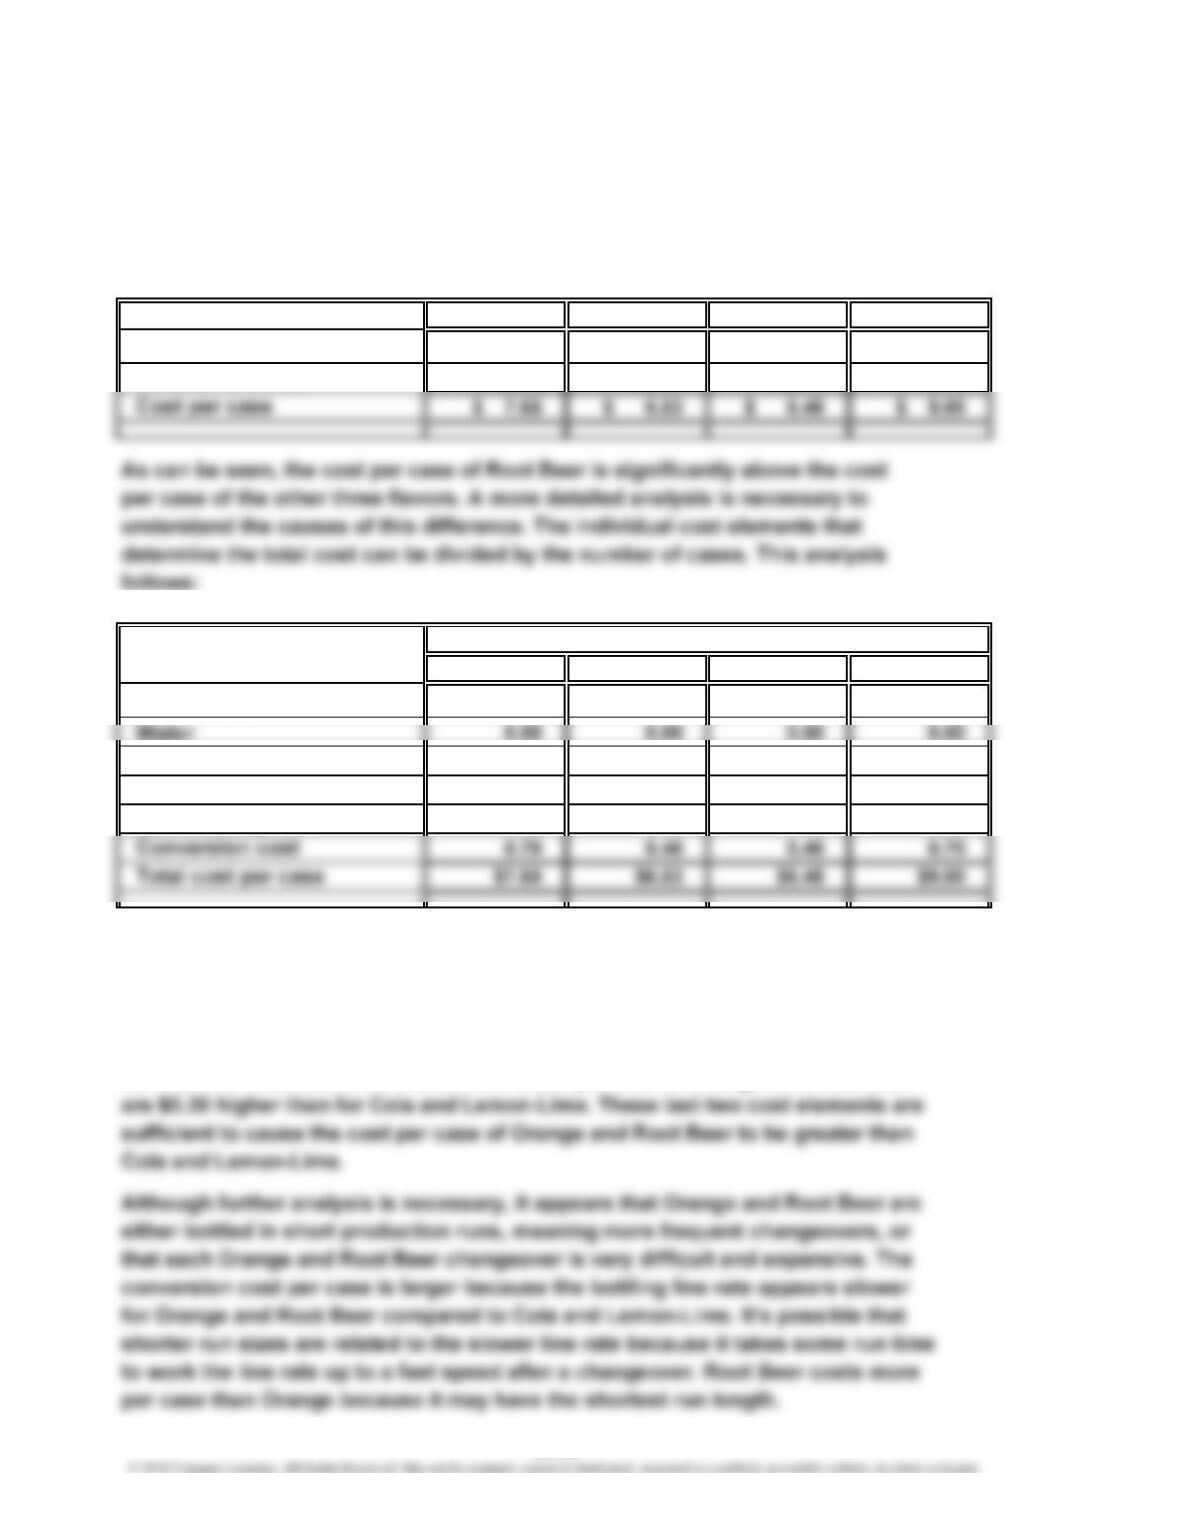
The cost of production report is used to identify the cost per case for each of the
four flavors as follows:
Orange Cola Lemon-Lime Root Beer
Total cost
$19,125 $391,800 $324,000 $36,000
Number of cases
2,500 60,000 50,000 4,000
Orange Cola Lemon-Lime Root Beer
Concentrate
$1.85 $2.15 $2.10 $1.90
Sugar
1.20 1.20 1.20 1.20
Bottles
2.20 2.20 2.20 2.20
Flavor changeover
1.20 0.08 0.08 2.50
This table indicates that the concentrate per case is actually less for Orange
and Root Beer than for Cola and Lemon-Lime. This is because the concentrate
supplier charges a higher price for the more popular flavors. The costs per case
for water, sugar, and bottles are the same for each flavor. However, the costs per
case for changeover are much greater for Orange and Root Beer than for the other
two flavors. In addition, the conversion costs per unit for Orange and Root Beer
Cost per Case by Cost Element
÷÷÷÷
18-30
CHAPTER 18 Process Cost Systems
Ex. 18–22 (FIN MAN); Ex. 3–22 (MAN)
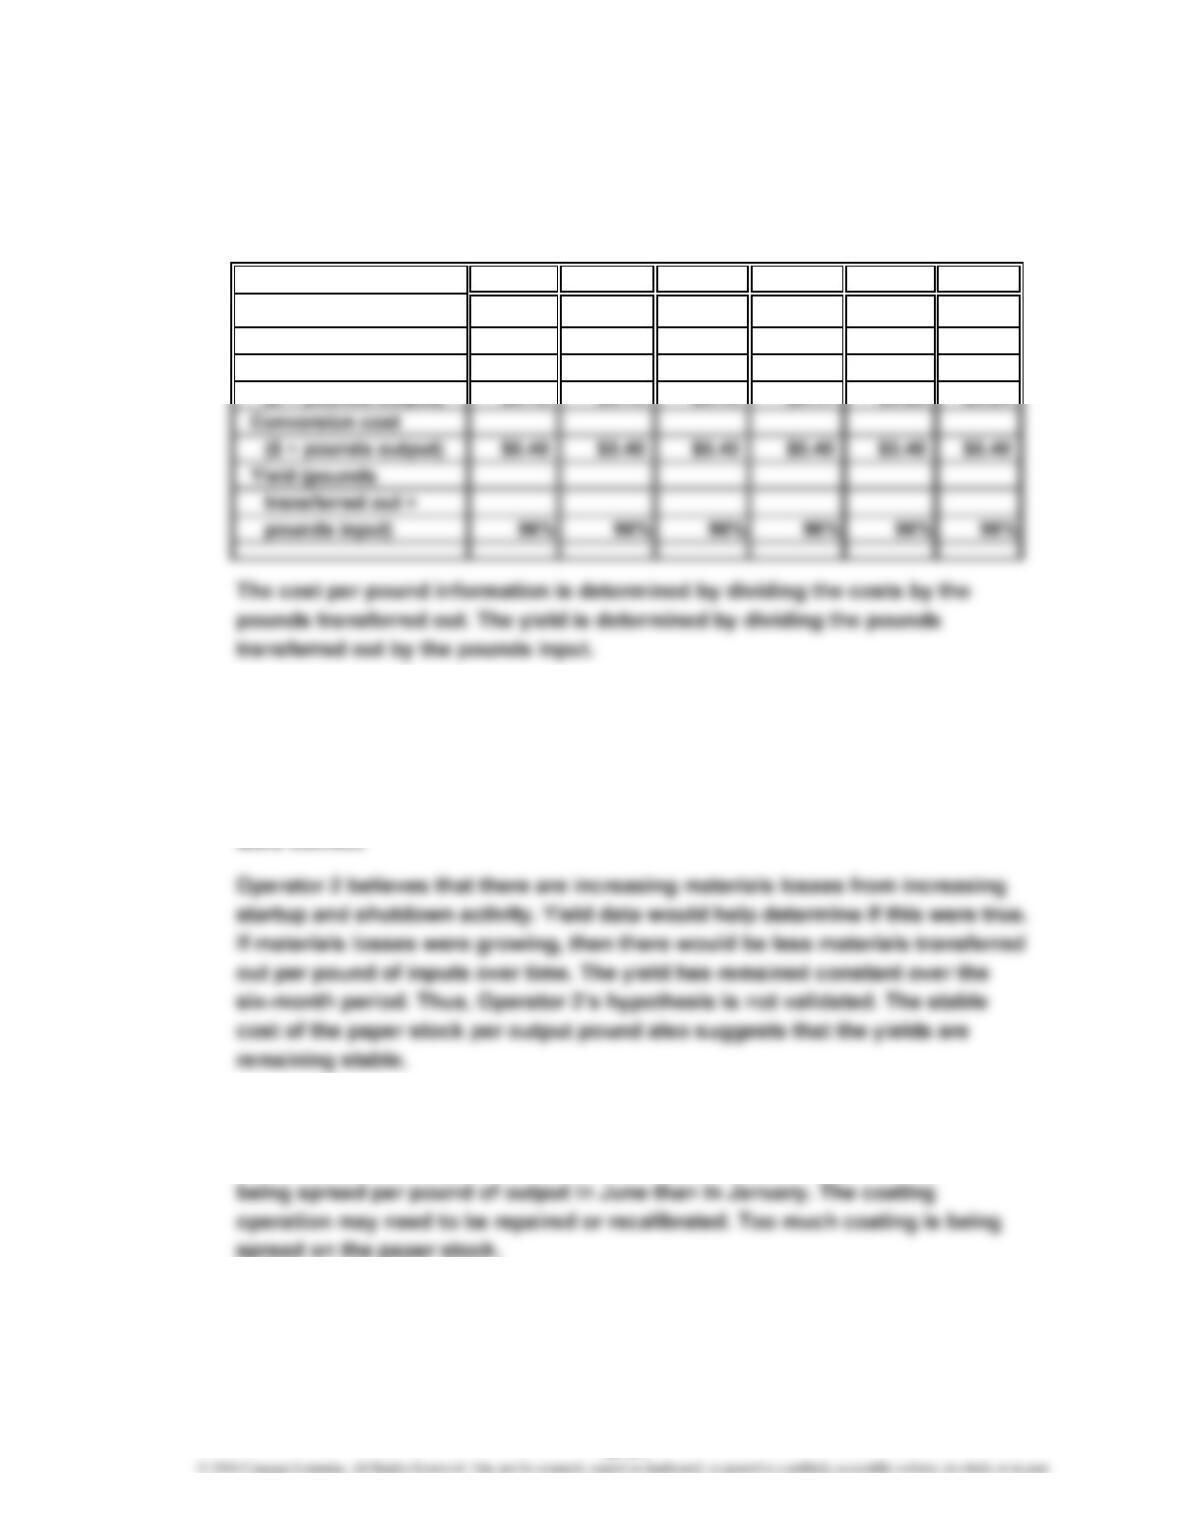
The solution to this exercise is to determine if the cost per pound trends in paper
stock, conversion, and coating costs are remaining stable over time. The
following table can be developed from the data:
a.
January February March April May June
Paper stock
($ ÷ pounds output) $0.70 $0.70 $0.70 $0.70 $0.70 $0.70
Coating
($ ÷ pounds output) $0.12 $0.13 $0.15 $0.17 $0.20 $0.24
b. Operator 1 believes that energy consumption is becoming less efficient. The
energy cost is part of the conversion cost. The conversion cost per output
pound has remained constant for the six months. If the energy efficiency were
declining, it would take more energy per pound of output over time. Thus, we
would expect to see the conversion rate per pound increasing if Operator 1
were correct.
Operator 3 is concerned about coating costs. The coating cost per output
pound is increasing over time. Thus, we can conclude that the coating
efficiency is declining over time. Apparently, twice the coating material was
18-31
CHAPTER 18 Process Cost Systems
Ex. 18–23 (FIN MAN); Ex. 3–23 (MAN)
The Hawkeye Machining managers are displaying typical fears to a lean processing
system. Lean manufacturing removes the safety provided by materials, in-process,
and finished goods inventory balances. Indeed, these types of comments reflect
conventional manufacturing philosophy, which views inventory as a necessary
buffer against surprises and other unwelcome events. Lean practices focus on
removing the causes that require a need for inventory.
The in-process inventories can be reduced significantly if the underlying
manufacturing processes are made reliable. The director of manufacturing is
correct in his observation, but his solution is wrong. The solution is not to
increase inventory but to improve the reliability of the machines so that they do
not experience emergency breakdowns. Thus, the manufacturing operation must
be improved to produce the right product, in the right quantities, at the right
quality, and at the right time. Only with this level of reliability can a plant
responsibly remove in-process inventories from the system.
18-32
CHAPTER 18 Process Cost Systems
Ex. 18–24 (FIN MAN); Ex. 3–24 (MAN)
a. and b.
a. Whole b. Equivalent Units
Units of Production
Units to be accounted for:
Beginning work in process 1,900
Units started during period 15,100
1
18-33
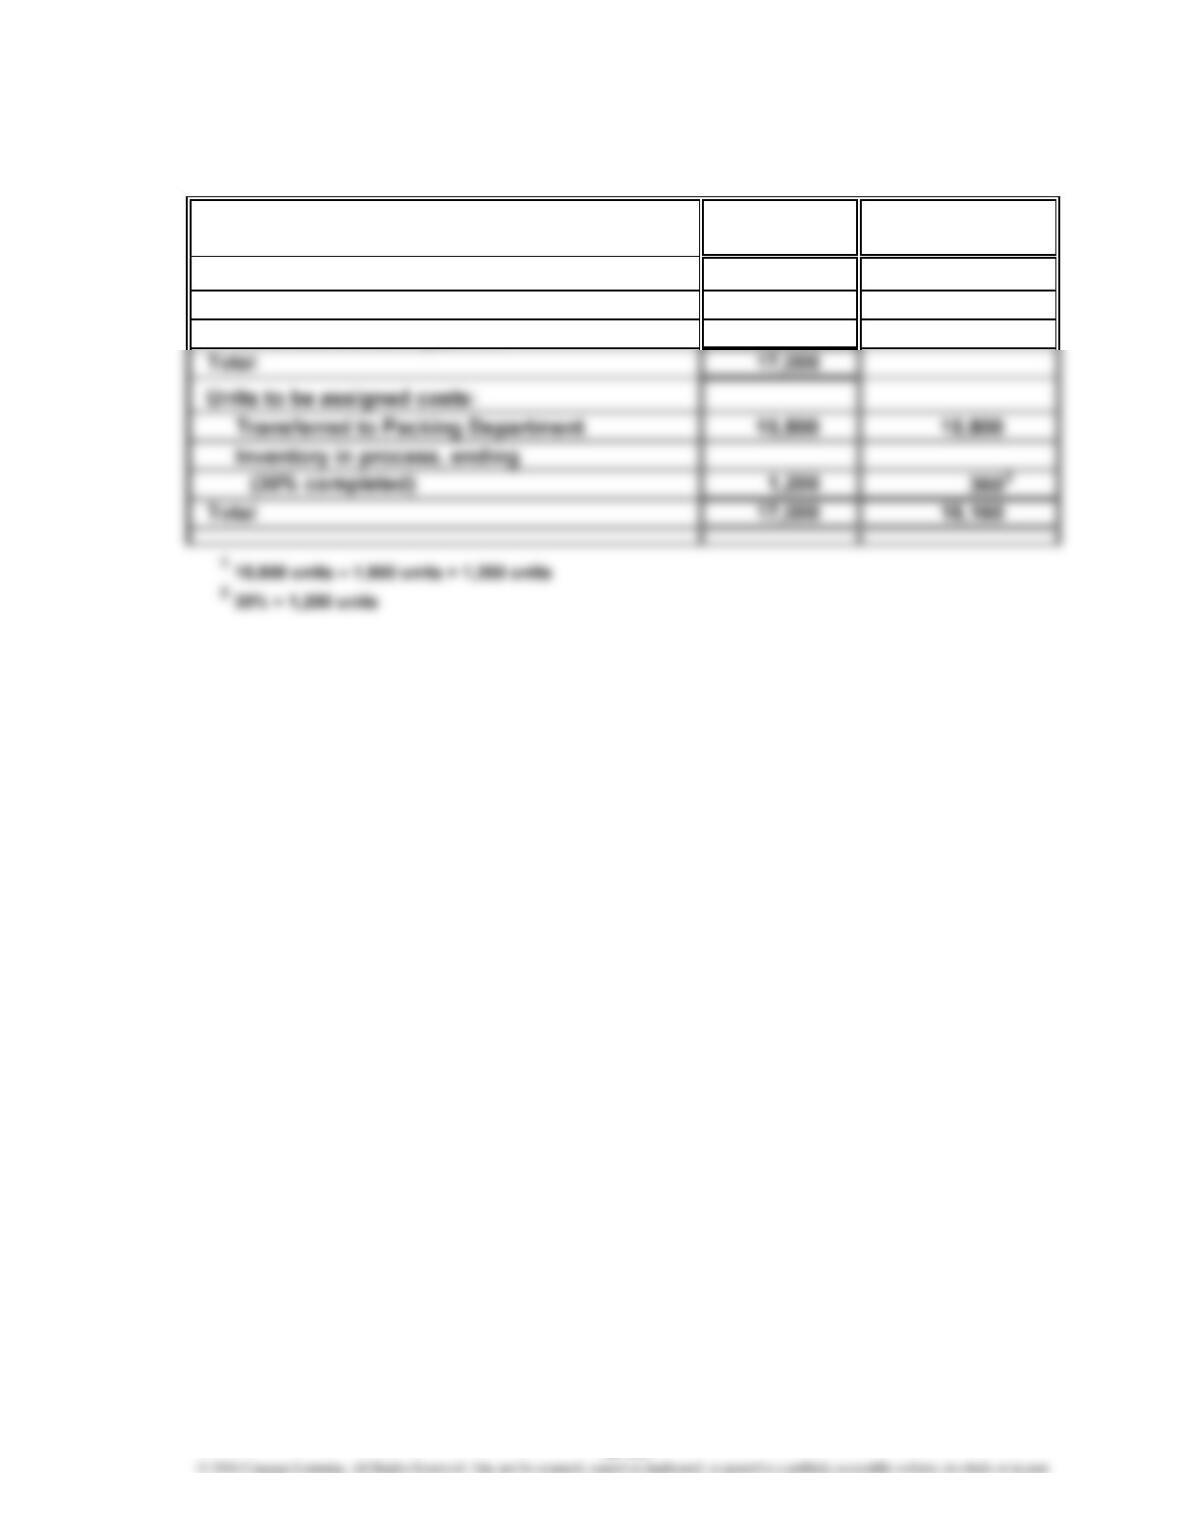
CHAPTER 18 Process Cost Systems
Ex. 18–25 (FIN MAN); Ex. 3–25 (MAN)
a. Drawing Department
Whole Equivalent Units
Units of Production
Units to be accounted for:
Beginning work in process 500
Units started during period 11,600
1
11,400 units – 500 units + 700 units
2
55% × 700 units
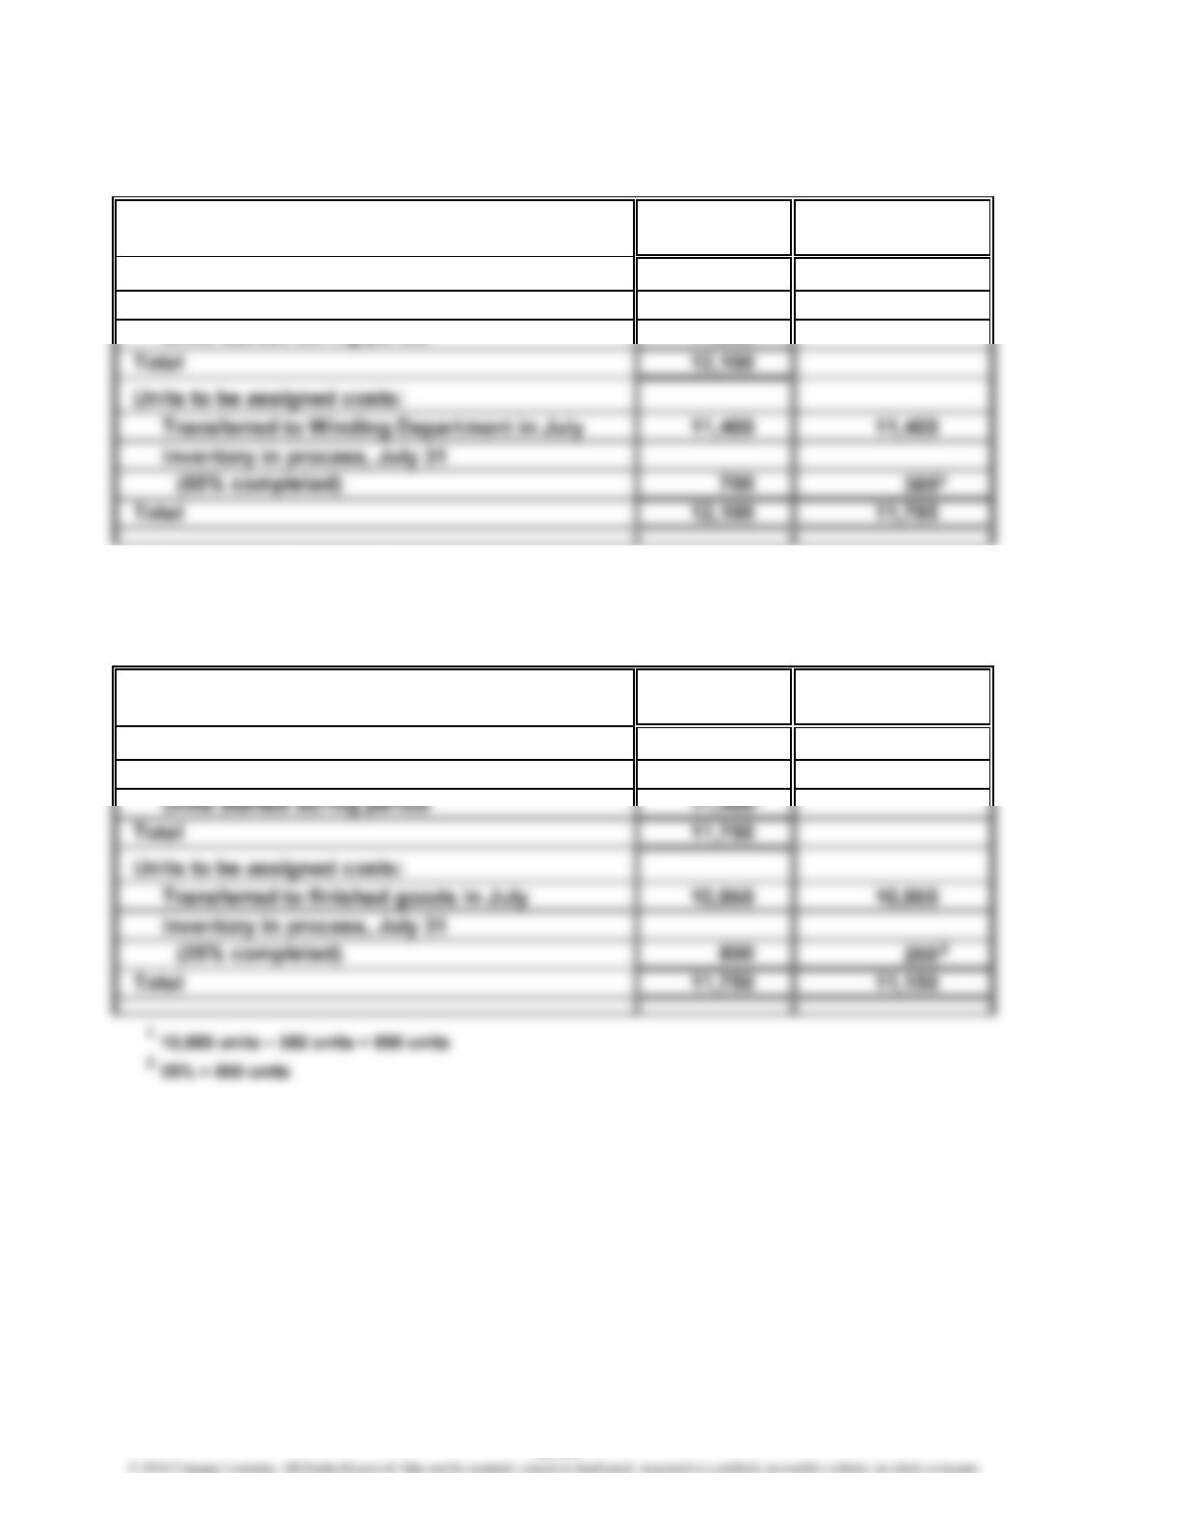
b. Winding Department
Whole Equivalent Units
Units of Production
Units to be accounted for:
Beginning work in process 350
1
1
18-34
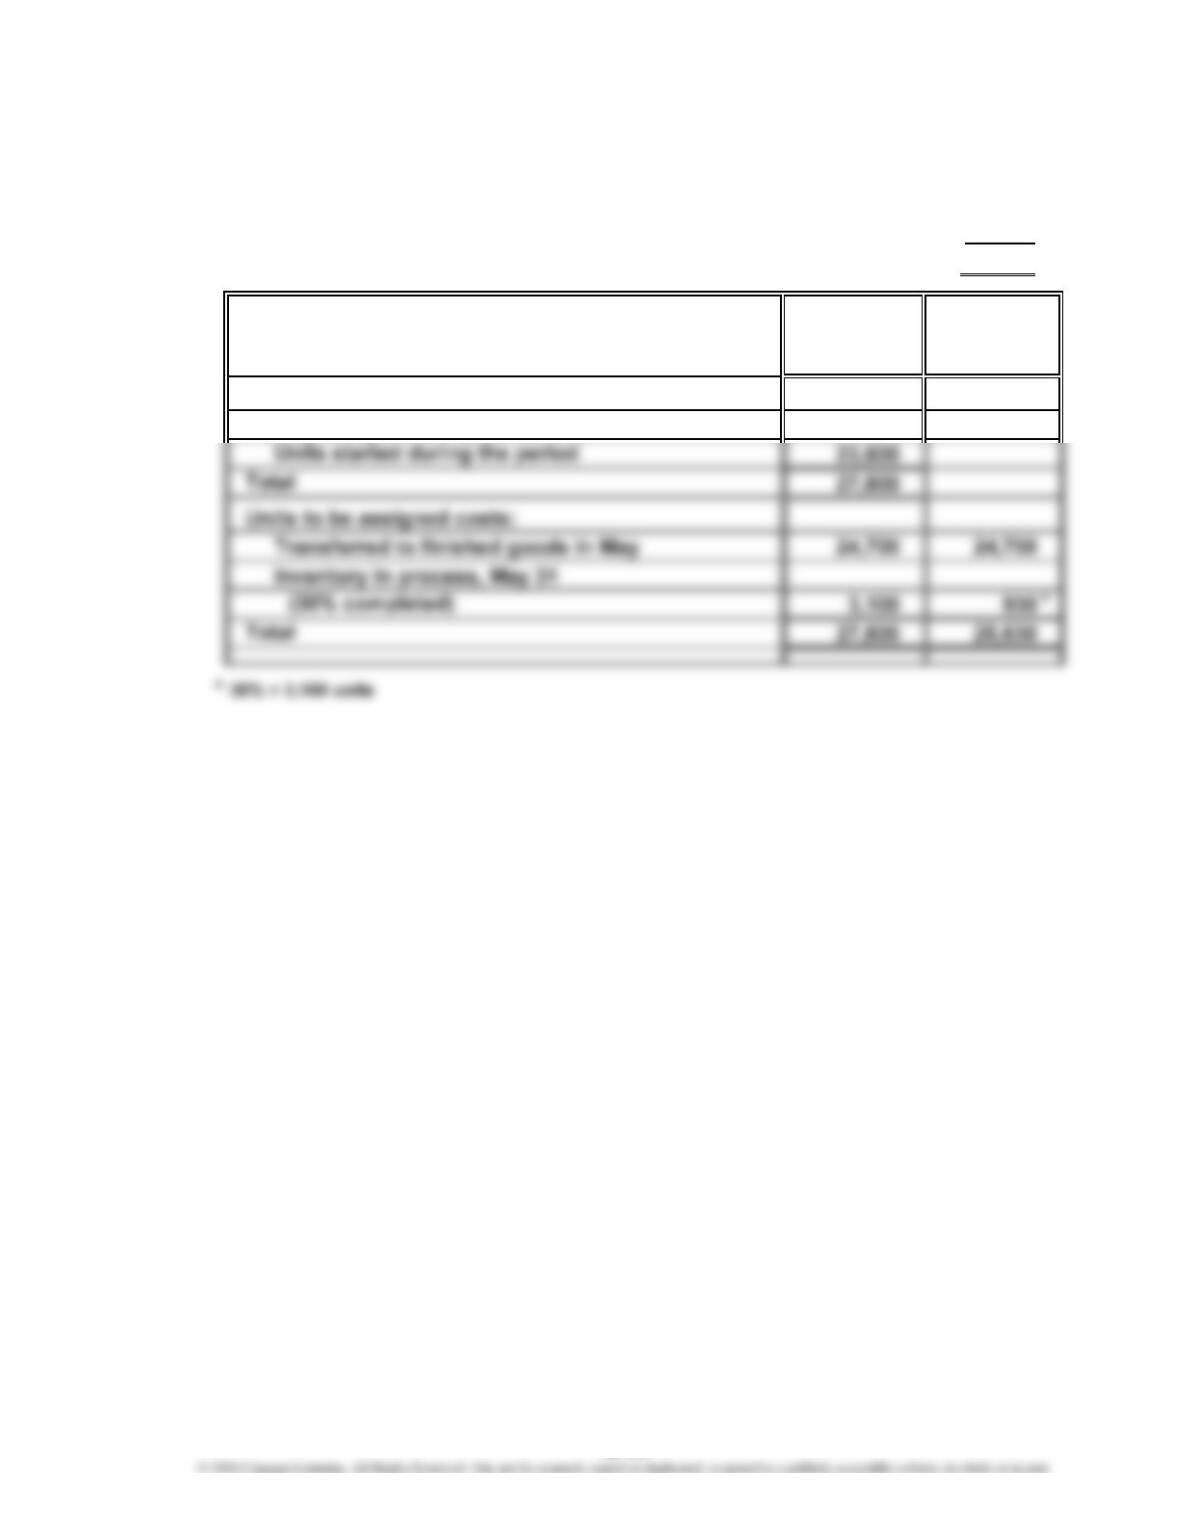
CHAPTER 18 Process Cost Systems
Ex. 18–26 (FIN MAN); Ex. 3–26 (MAN)
a. Units in process, May 1…………………………………………………………
…
4,200
Units placed into production for May………………………………………… 23,600
Less units finished during May………………………………………………
…
(24,700)
Units in process, May 31………………………………………………………
…
3,100
b.
Equivalent
Whole Units of
Units Production
Units to be accounted for:
Beginning work in process 4,200
18-35
CHAPTER 18 Process Cost Systems
Ex. 18–27 (FIN MAN); Ex. 3–27 (MAN)
a. and b.
Equivalent
Whole Units of
Units Production
Units to be accounted for:
Beginning work in process 900
Units started during the period 8,400
18-36
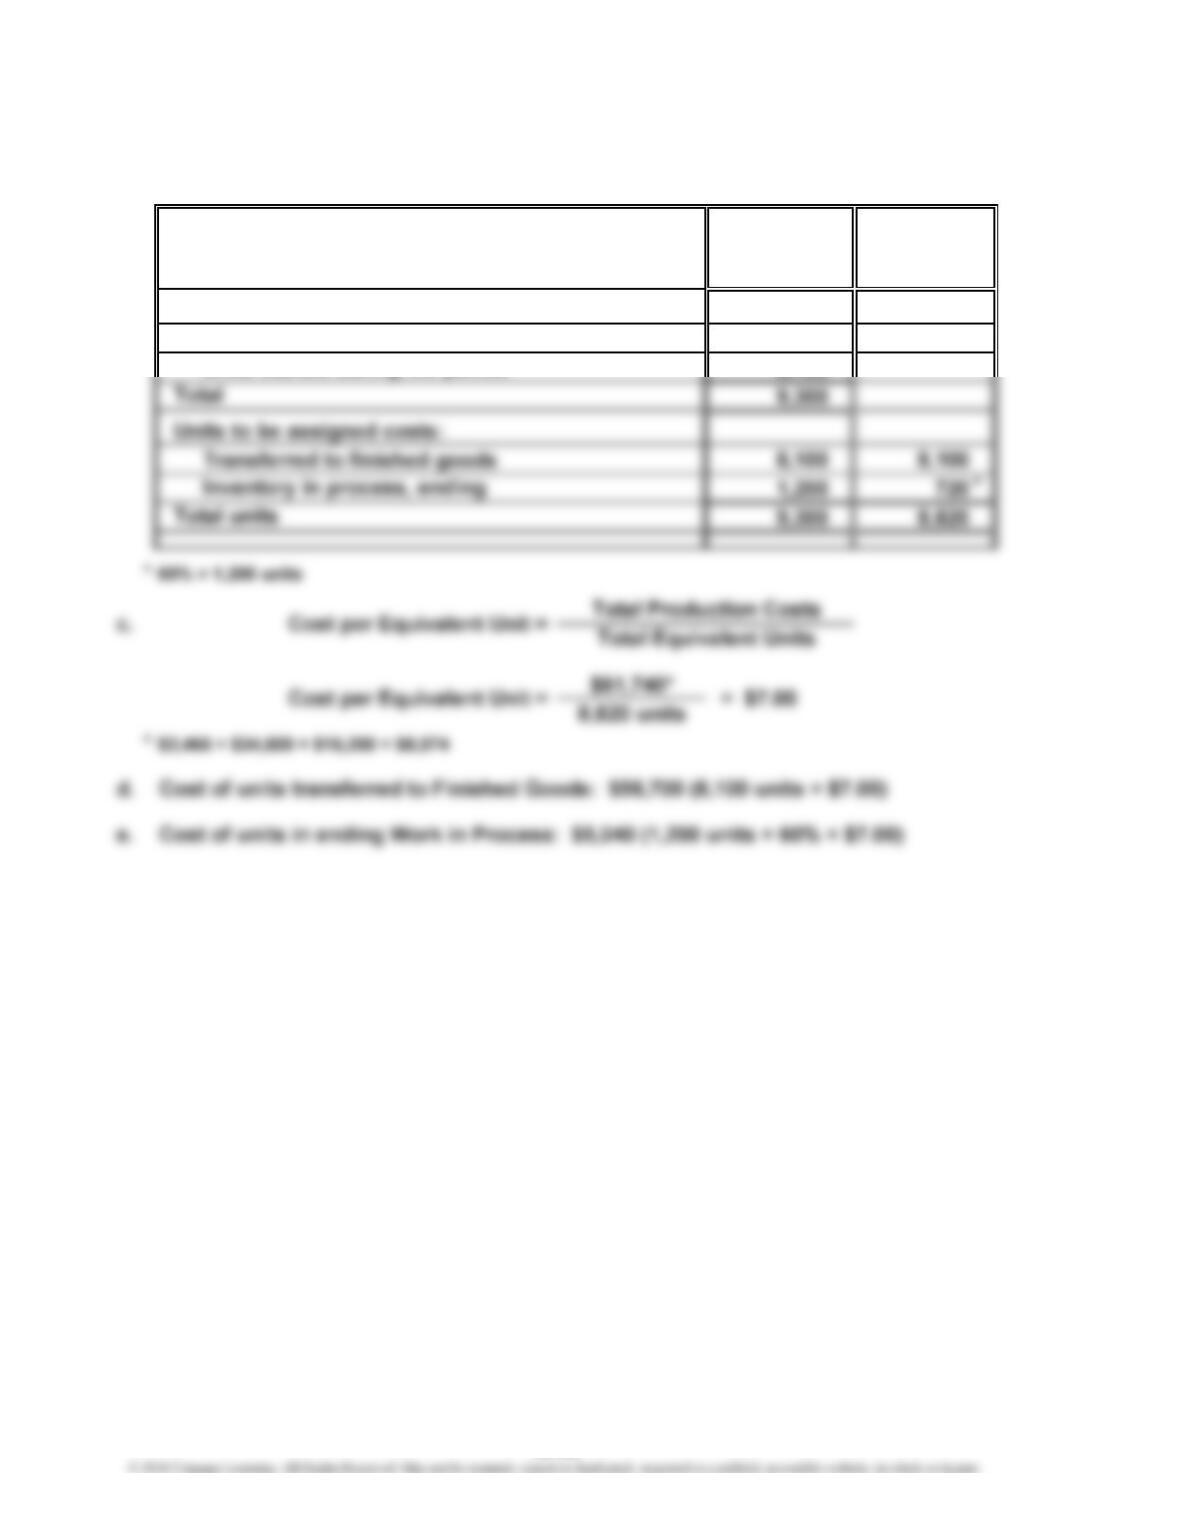
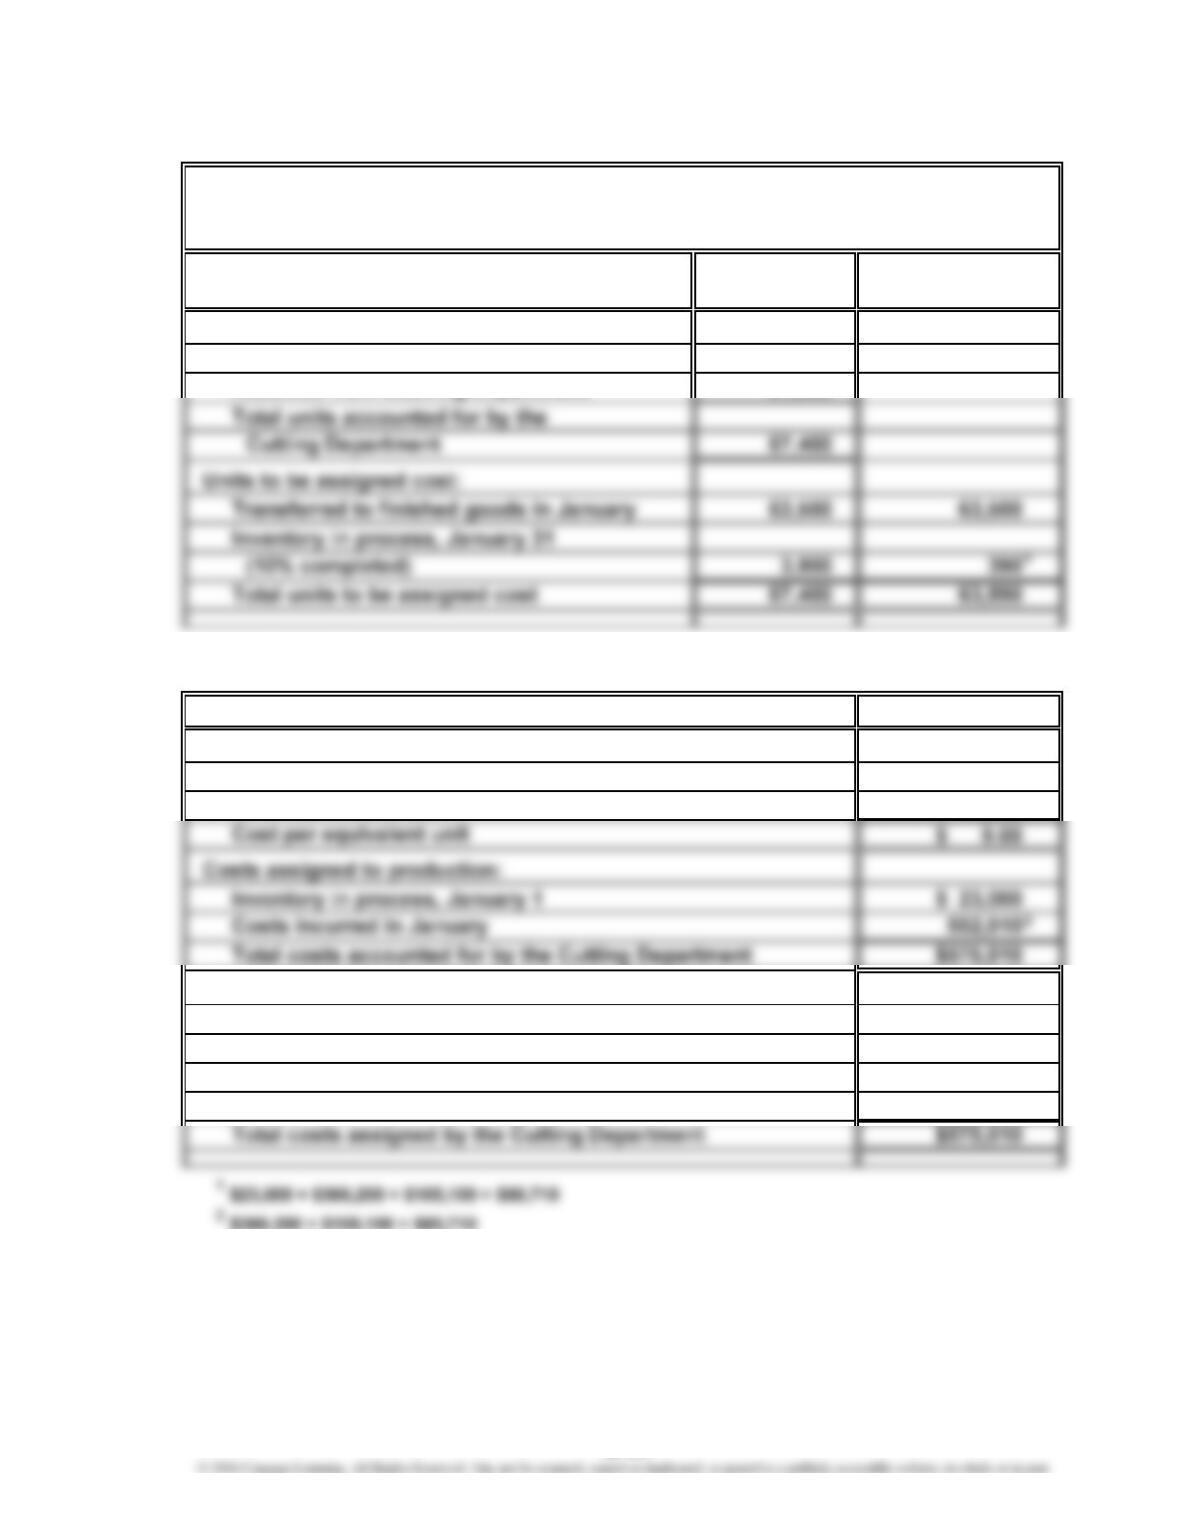
CHAPTER 18 Process Cost Systems
Ex. 18–28 (FIN MAN); Ex. 3–28 (MAN)
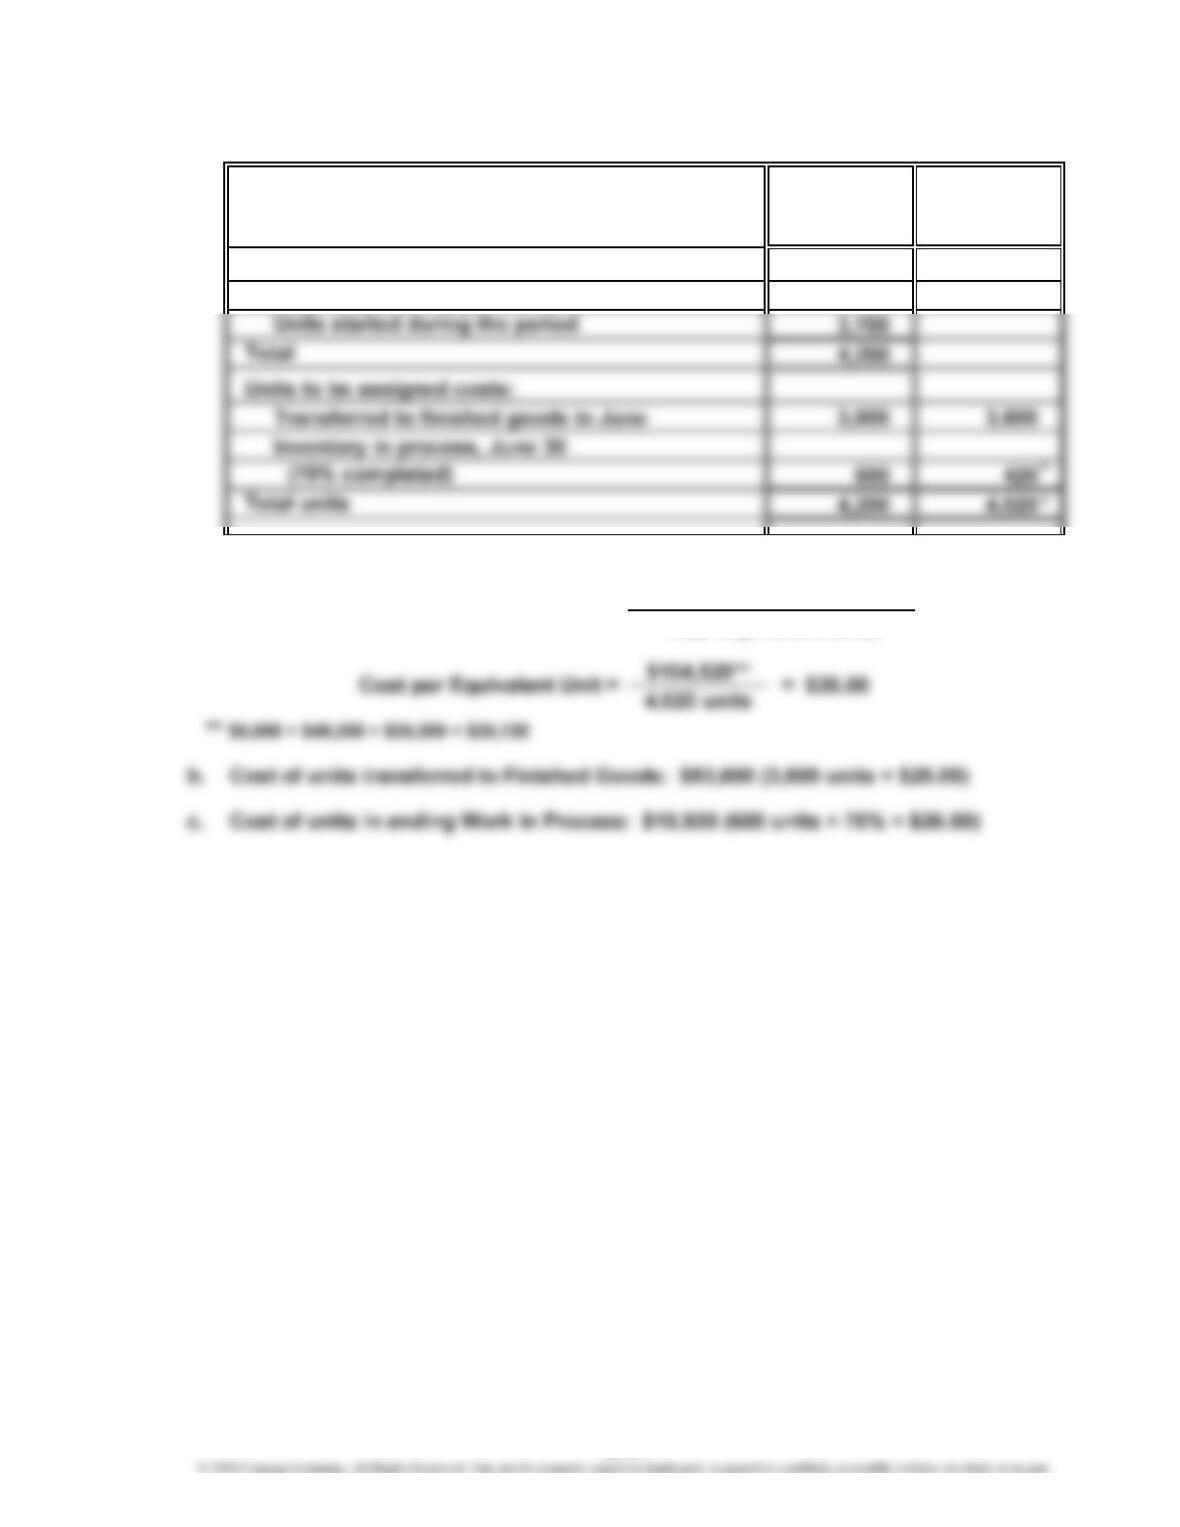
a.
Equivalent
Whole Units of
Units Production
Units to be accounted for:
Beginning work in process 500
*
70% × 600 units
Total Equivalent Units
Cost per Equivalent Unit =
Total Production Costs
18-37
CHAPTER 18 Process Cost Systems
Ex. 18–29 (FIN MAN); Ex. 3–29 (MAN)
Whole Equivalent Units
UNITS Units of Production
Units to account for during production:
*
80% × 800 units
COSTS Costs
Costs per equivalent unit:
Total costs for May in Roasting Department $42,804
Costs incurred in May 41,104
Total costs accounted for by the Roasting Department $42,804
Costs allocated to completed and partially completed units:
Transferred to finished goods in May
(11,250 units × $3.60) $40,500
Inventory in process, May 31
HIGHLANDS COFFEE COMPANY
Cost of Production Report—Roasting Department
For the Month Ended May 31, 2016
1
18-38
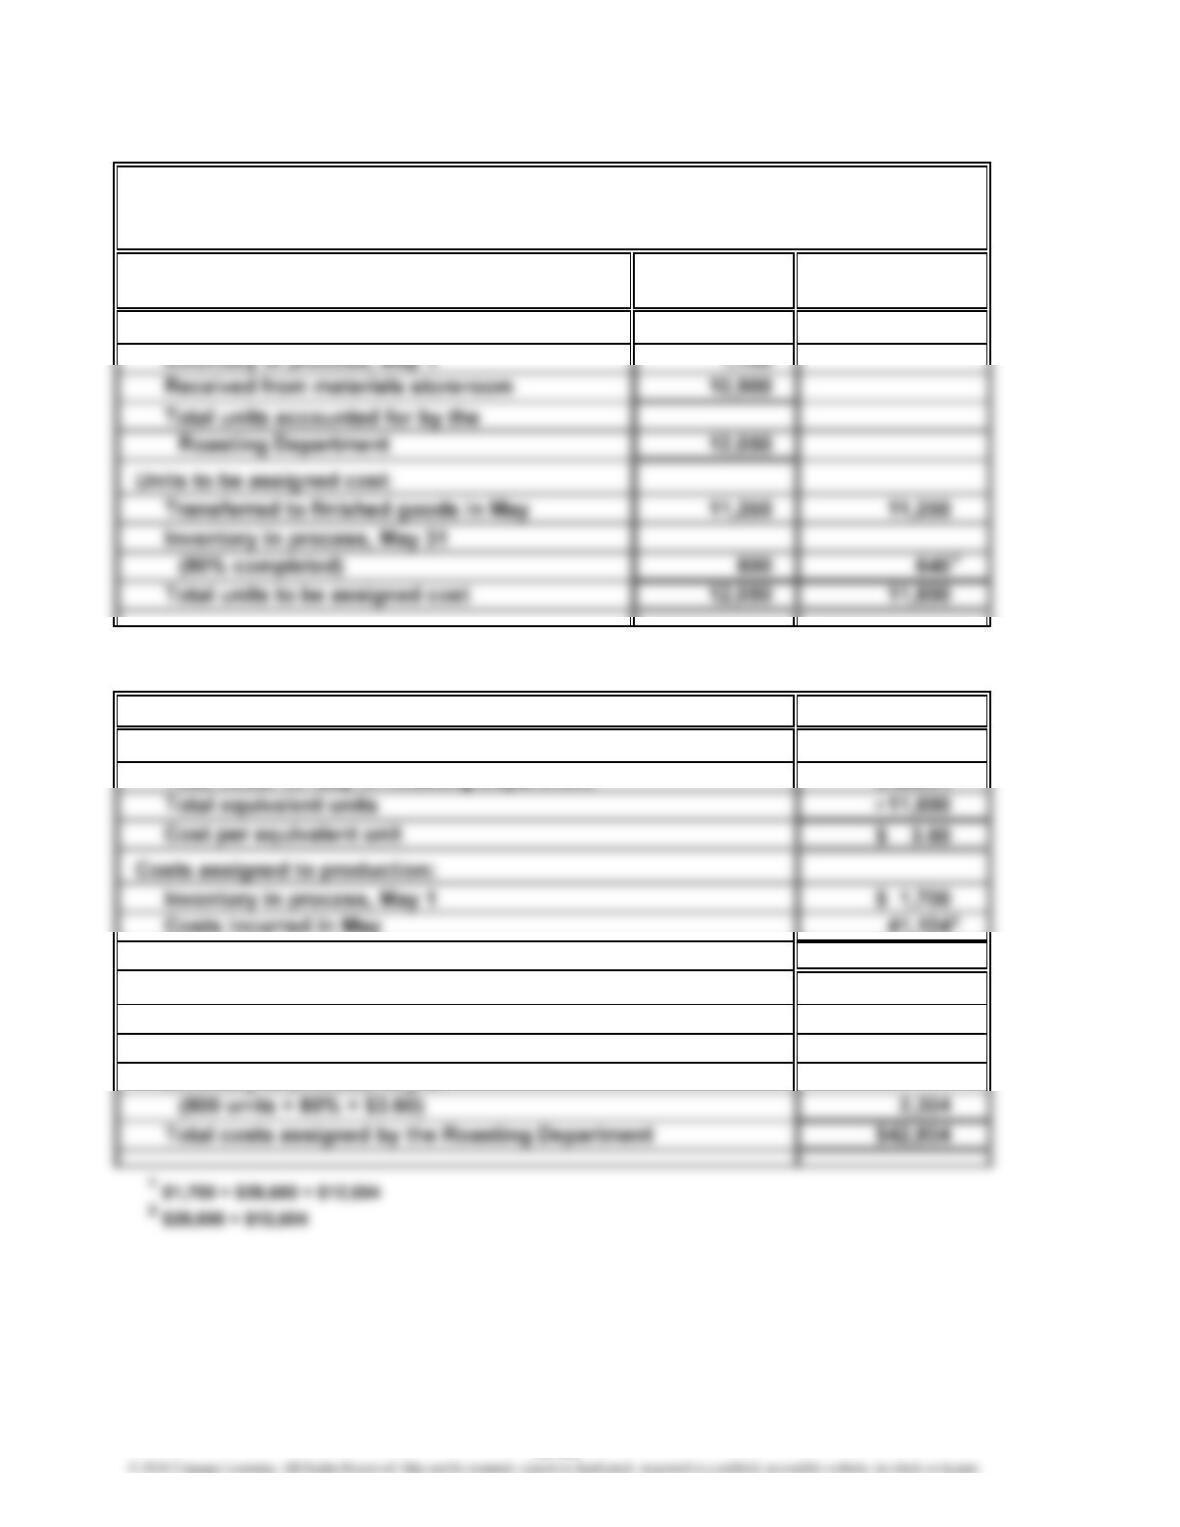
CHAPTER 18 Process Cost Systems
Ex. 18–30 (FIN MAN); Ex. 3–30 (MAN)
Whole Equivalent Units
UNITS Units of Production
Units charged to production:
Inventory in process, January 1 3,400
Received from Weaving Department 64,000
*
10% × 3,900 units
COSTS
Costs per equivalent unit:
Total costs for January in Cutting Department $575,010
Total equivalent units 63,890
Costs allocated to completed and partially completed units:
Transferred to finished goods in January
(63,500 units × $9.00) $571,500
Inventory in process, January 31
(3,900 units × 10% × $9.00) 3,510
DALTON CARPET COMPANY
Cost of Production Report—Cutting Department
For the Month Ended January 31, 2016
1
÷
18-39
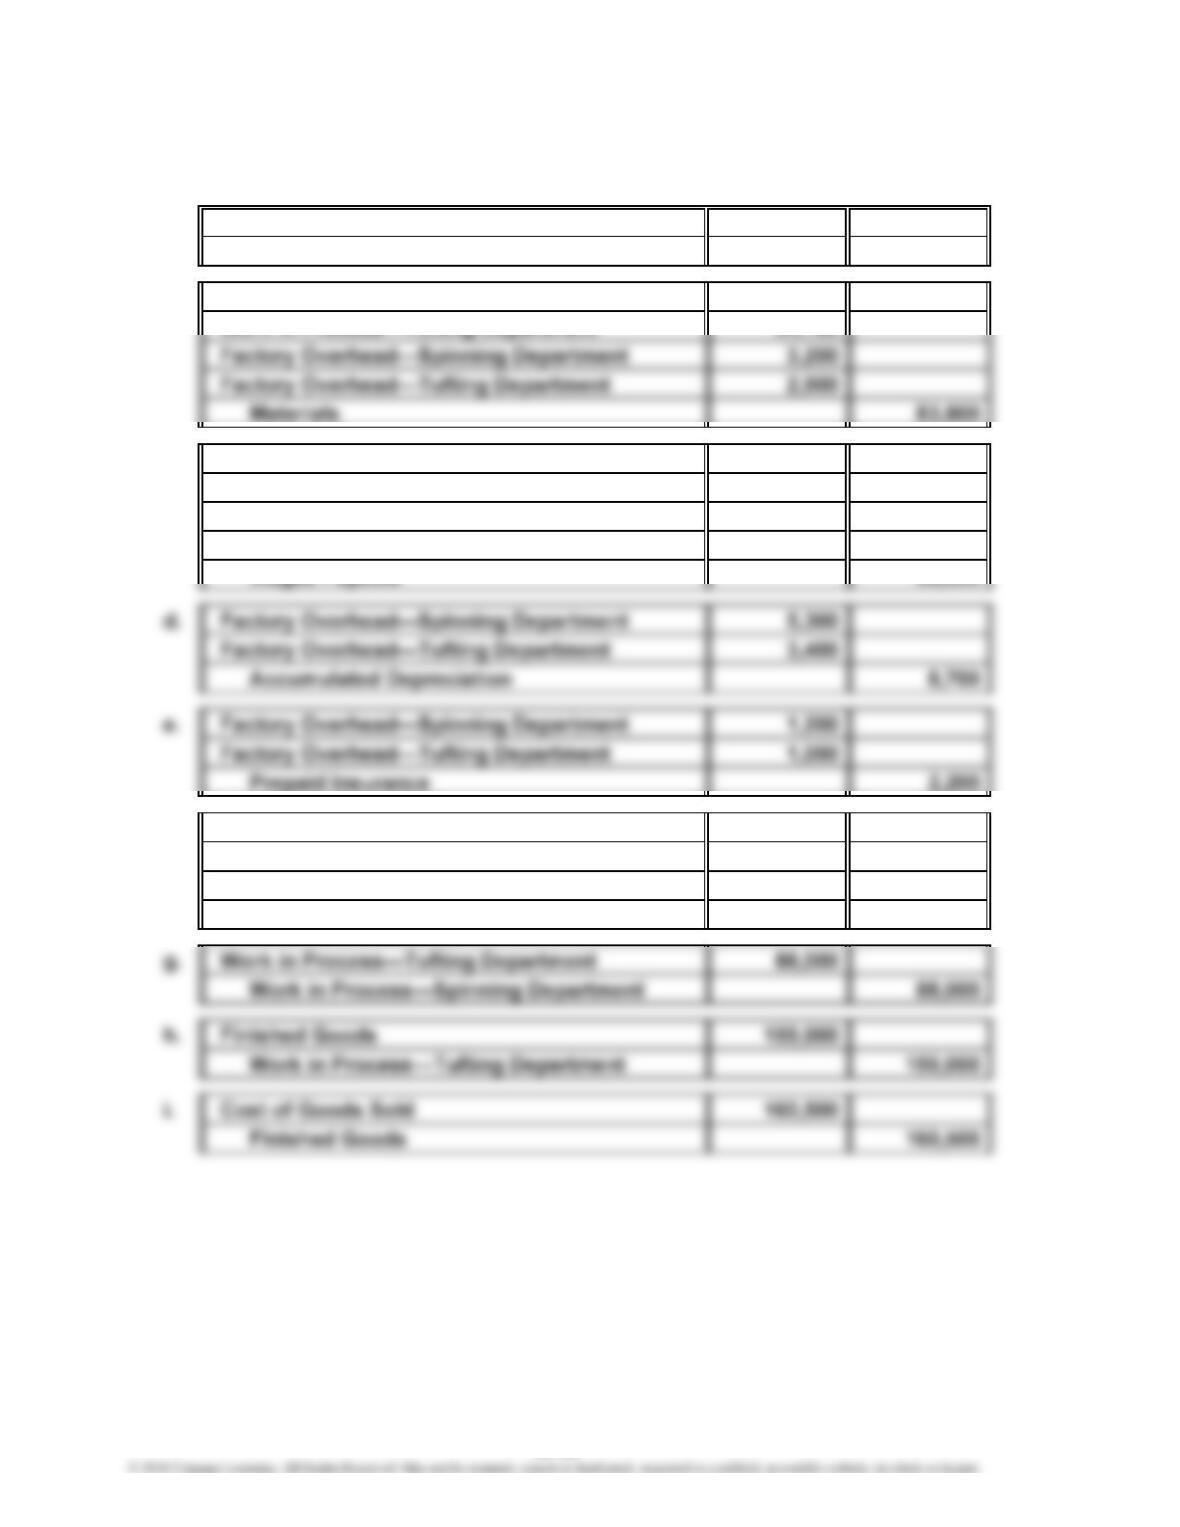
CHAPTER 18 Process Cost Systems
Prob. 18–1A (FIN MAN); Prob. 3–1A (MAN)
1. a. Materials 84,900
Accounts Payable 84,900
b. Work in Process—Spinning Department 43,600
Work in Process—Tufting Department 34,100
c. Work in Process—Spinning Department 26,300
Work in Process—Tufting Department 17,900
Factory Overhead—Spinning Department 12,100
Factory Overhead—Tufting Department 11,700
Wages Payable 68,000
f. Work in Process—Spinning Department 22,000
Work in Process—Tufting Department 18,700
Factory Overhead—Spinning Department 22,000
Factory Overhead—Tufting Department 18,700
PROBLEMS
18-40