Exercise 18-22 (25 minutes)
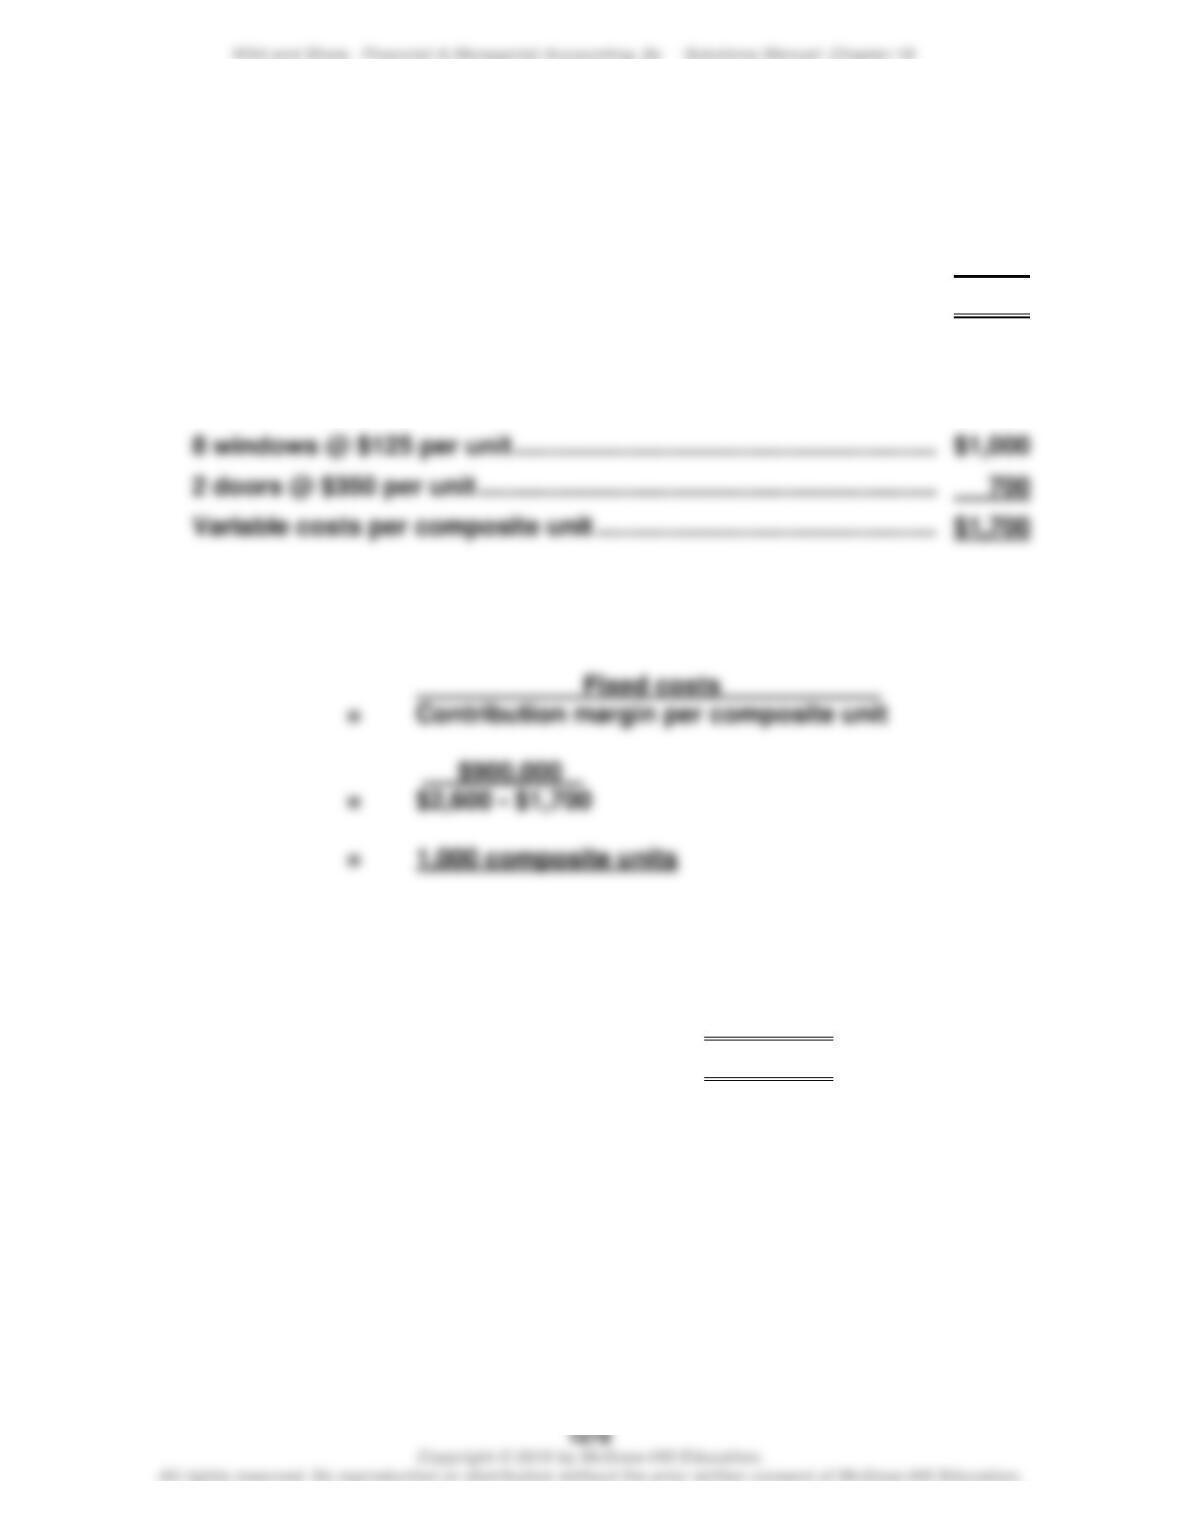
1. Selling price per composite unit
8 windows @ $200 per unit ………………………………………………………
$1,600
2 doors @ $500 per unit …………………………………………………………..
1,000
Selling price per composite unit ………………………………………………
$2,600
2. Variable costs per composite unit
8 windows @ $125 per unit ………………………………………………………
$1,000
2 doors @ $350 per unit …………………………………………………………..
700
Variable costs per composite unit …………………………..……………….
$1,700
3. Break-even point in composite units
4. Unit sales of windows and doors at break-even point
Windows: 8 x 1,000 units (from 3) ………………
8,000 units
Doors: 2 x 1,000 units (from 3) ………………
2,000 units
Exercise 18-23 (25 minutes)
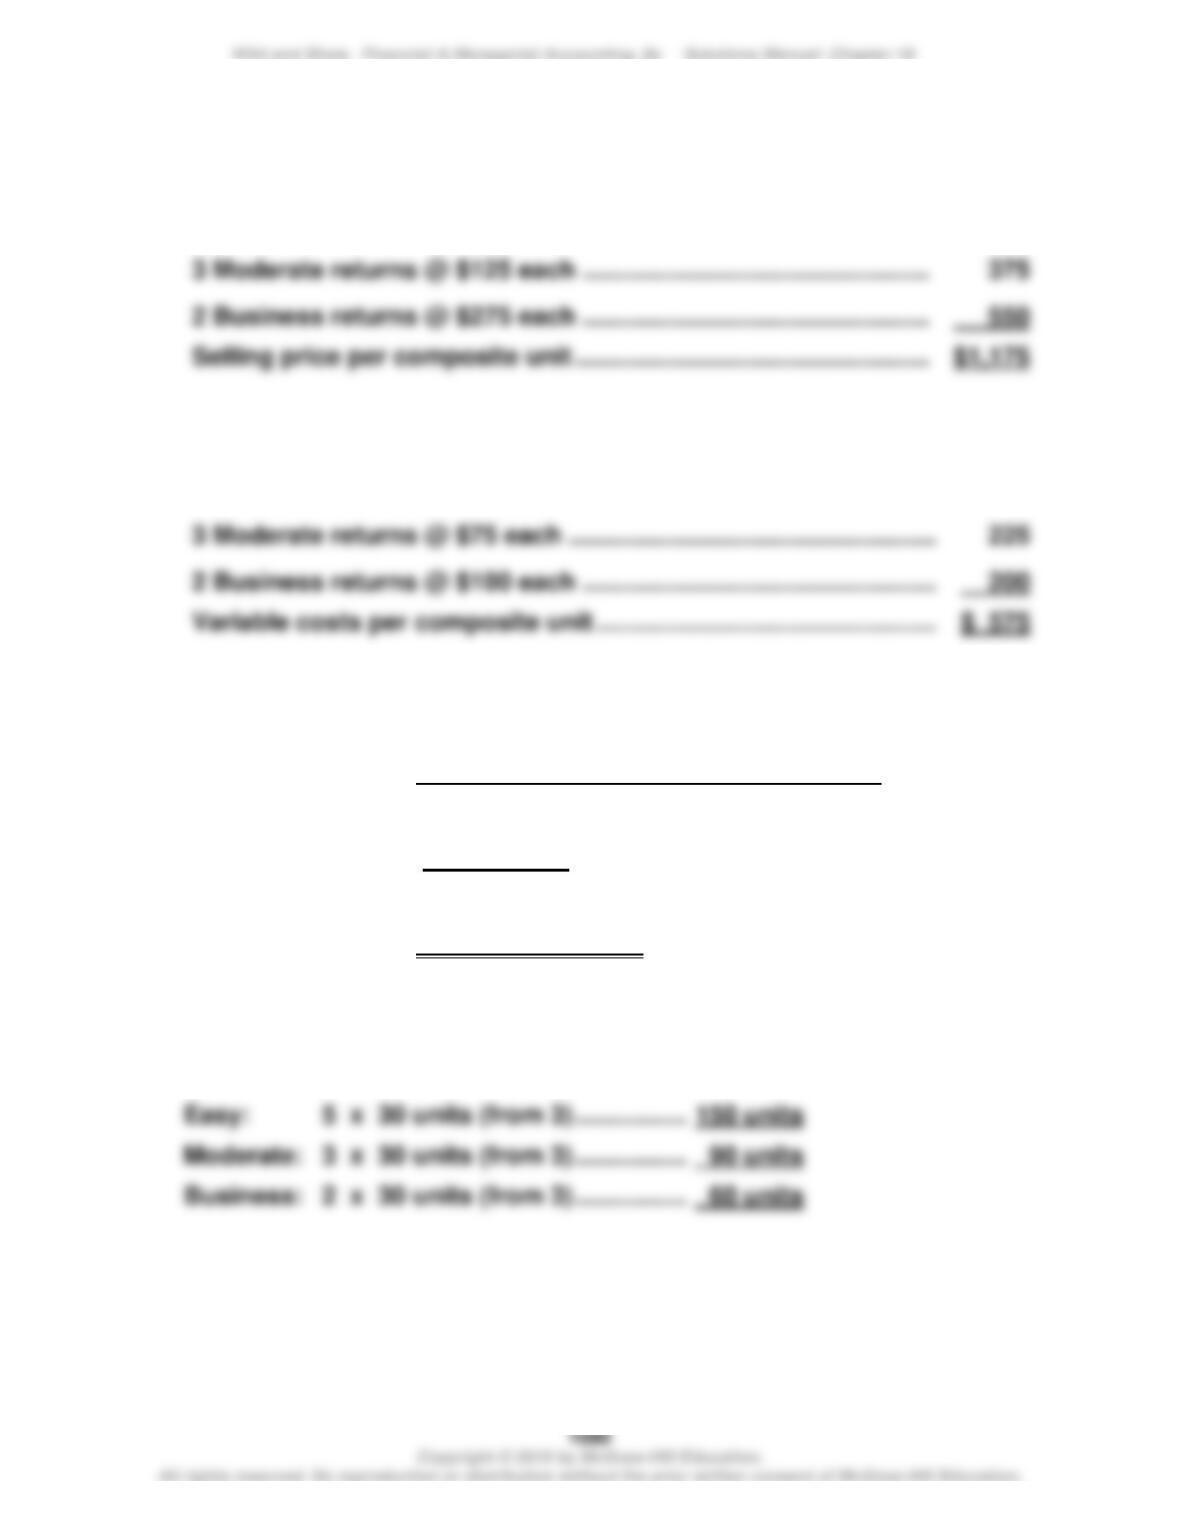
1. Selling price per composite unit
5 Easy returns @ $50 each …………………………………………………….
$ 250
2. Variable costs per composite unit
5 Easy returns @ $30 each …………………………………………………….
$ 150
3. Break-even point in composite units
Fixed costs .
= Contribution margin per composite unit
$18,000 .
= $1,175 – $575
= 30 composite units
4. Unit sales of Easy, Moderate, and Business returns at break-even point
Wild and Shaw, Financial & Managerial Accounting, 8e Solutions Manual: Chapter 18
Exercise 18-24 (30 minutes)
Instructor note: This exercise is solved in 3 steps
1. Prepare a contribution margin income statement for Co. A to compute its DOL;
2. Prepare a contribution margin income statement for Co. B to compute its DOL;
3. Analyze and interpret which company benefits more from a 20% sales increase.
Step 1.
Company A
Contribution Margin Income Statement
Sales (given)…………………………………………………………………..
$6,000,000
Variable costs [$6,000,000 x (100% – 60%)] ………………………
2,400,000
Contribution margin ($6,000,000 x 60%) ………………………….
3,600,000
Fixed costs (given) …………………………………………………………
2,600,000
Pretax income ………………………………………………………………..
$1,000,000
Company A’s DOL
=
Contribution margin in dollars / Pretax income
=
$3,600,000 / $1,000,000
=
3.6
Step 2.
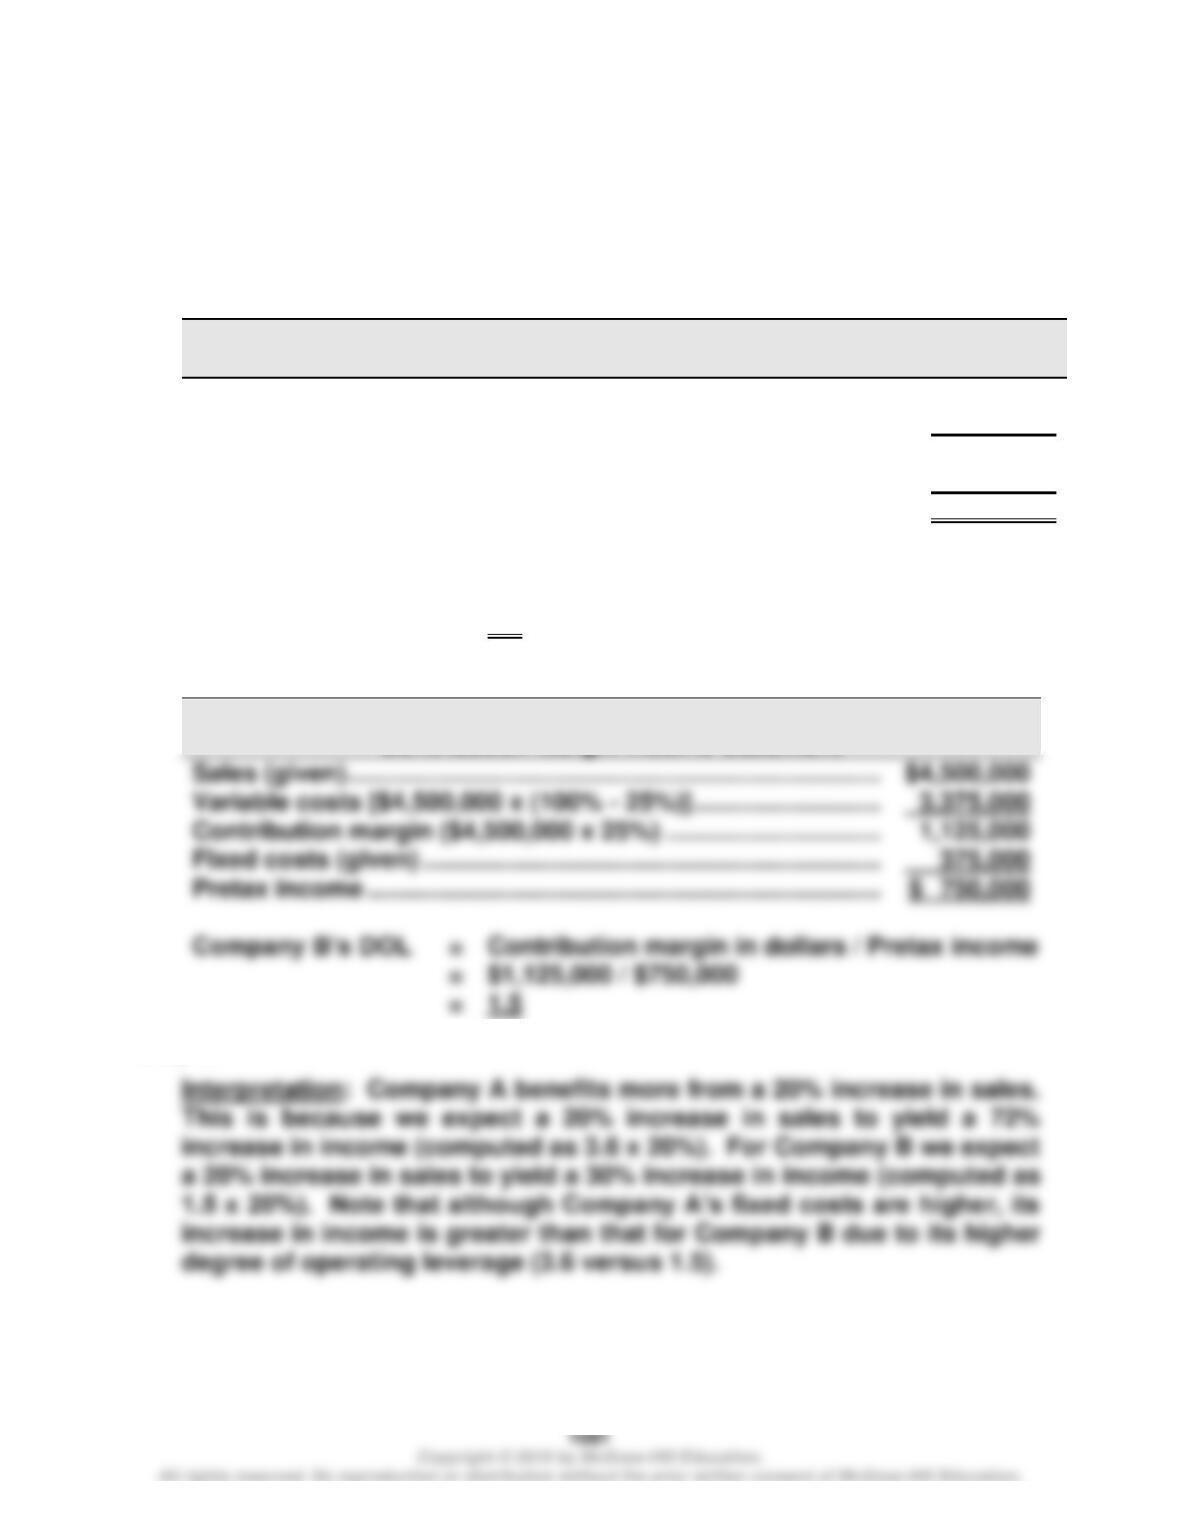
Company B
Sales (given)…………………………………………………………………..
Variable costs [$4,500,000 x (100% – 25%)] ………………………
Contribution margin ($4,500,000 x 25%) ………………………….
Fixed costs (given) …………………………………………………………
Pretax income ………………………………………………………………..
Company B’s DOL
=
Contribution margin in dollars / Pretax income
=
$1,125,000 / $750,000
=
Step 3.
Exercise 18-25 (10 minutes)
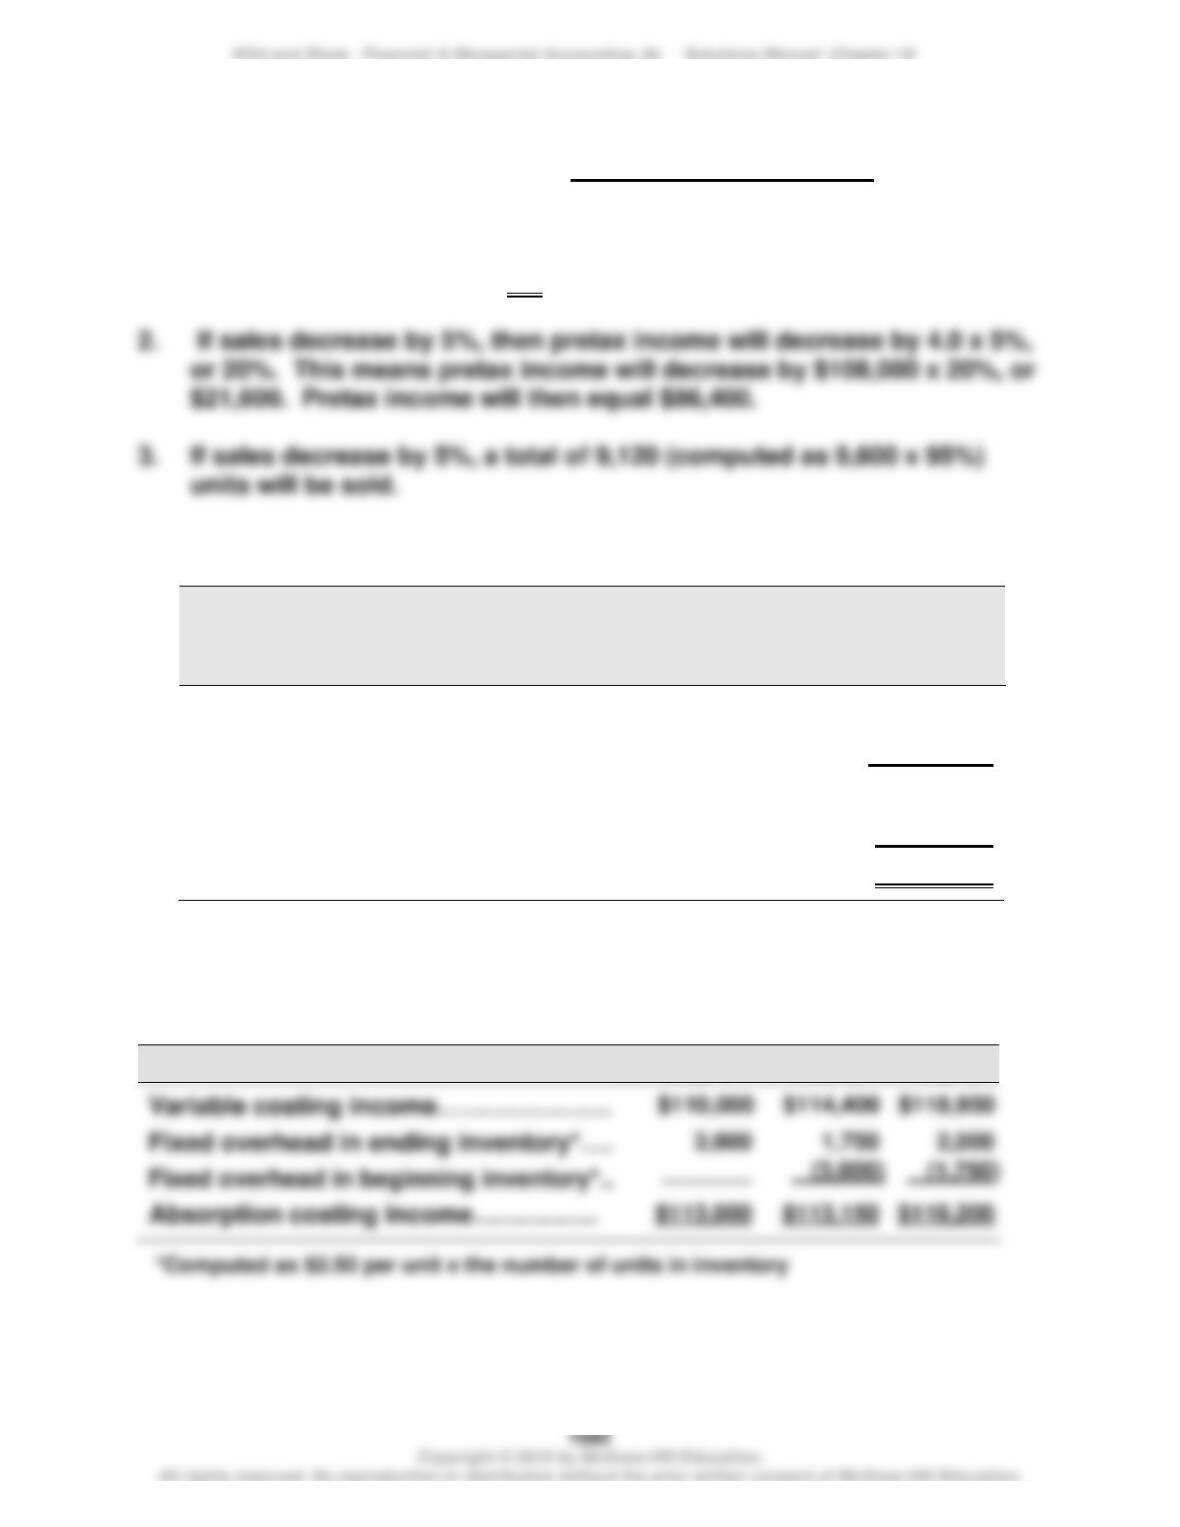
1. Degree of operating leverage = Total contribution margin
Pretax income
= $432,000/$108,000
= 4.0
Contribution margin income statement, assuming 5% sales decrease:
HUDSON CO.
Forecasted Contribution Margin Income Statement
For Year Ended December 31, 2020
Sales (9,120 x $225) ……………………………………………………….
$2,052,000
Variable costs (9,120 x $180) ……………………………………………………
1,641,600
Contribution margin ……………………………………………………….
410,400
Fixed costs …………………………………………………………………………….
324,000
Income (pretax) ……………………………………………………………………….
$ 86,400
Exercise 18–26B (15 minutes)
Reconciliation of variable costing income to absorption costing income:
Year 1
Year 2
Year 3
Variable costing income…………………
Exercise 18-27 (15 minutes)
Company A
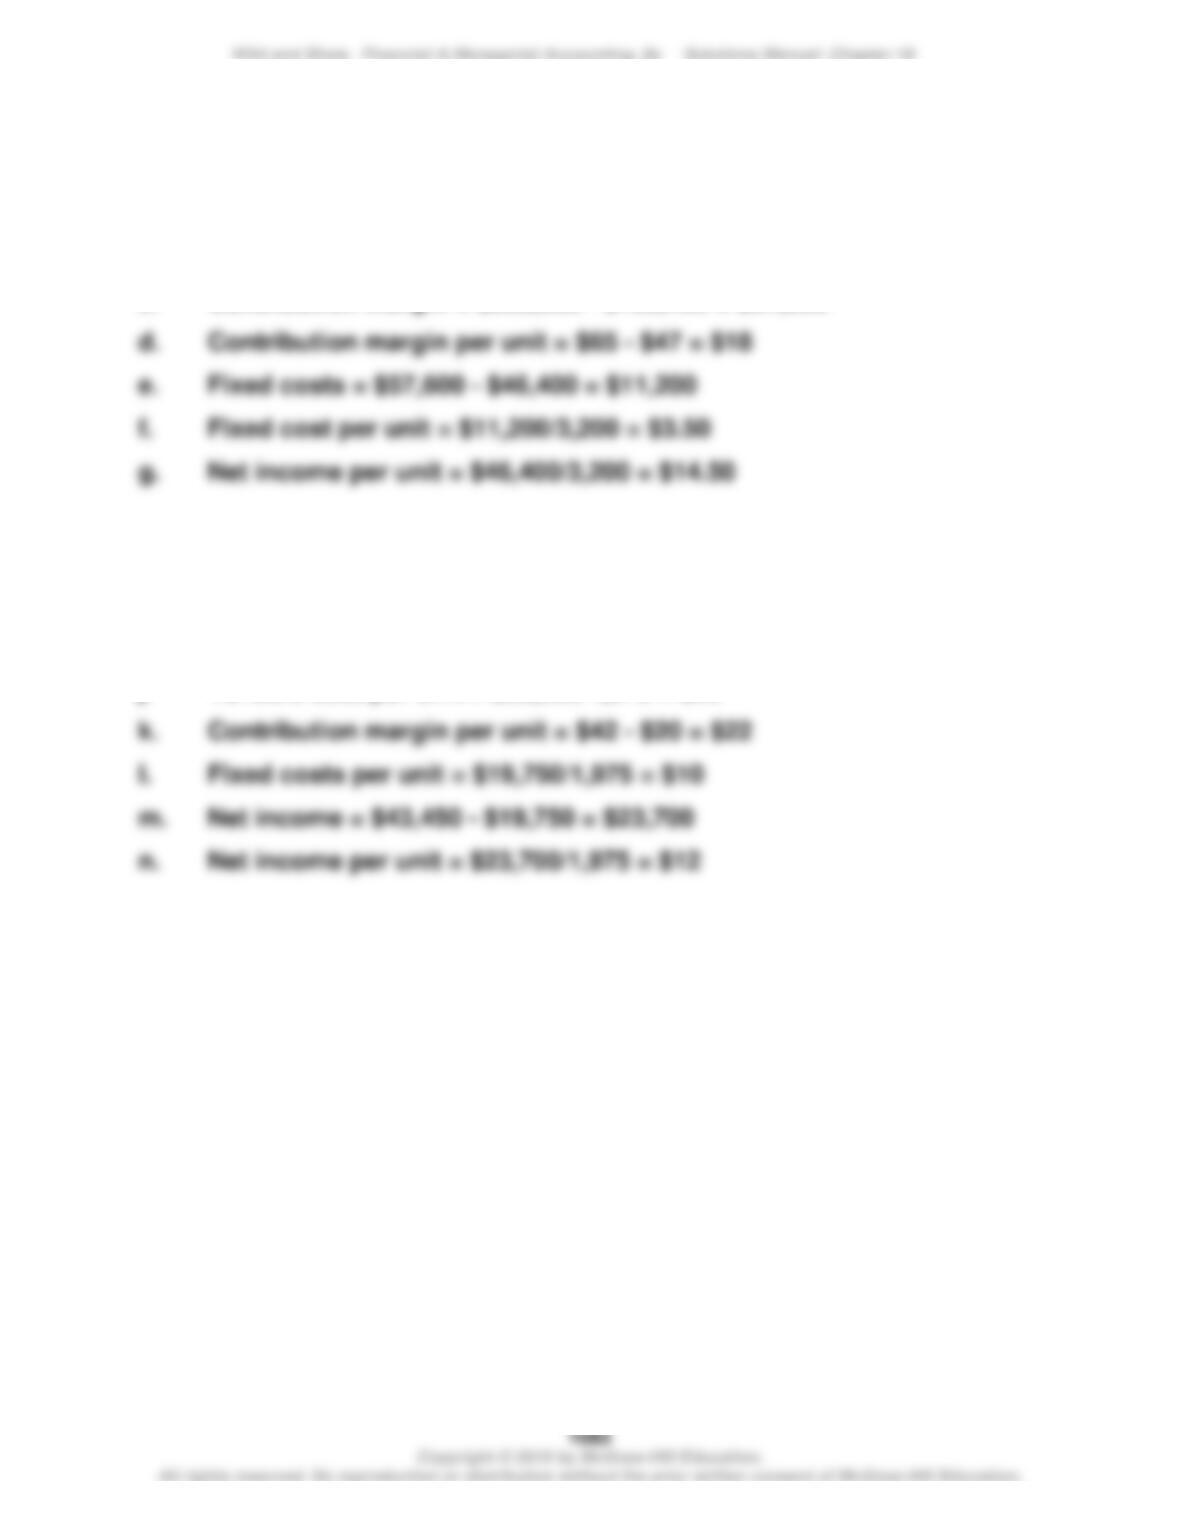
a. Units sold = $208,000/$65 = 3,200
b. Variable cost per unit = $150,400/3,200 = $47
c. Contribution margin = $208,000 – $150,400 = $57,600
Company B
h. Sales = $43,450 + $39,500 = $82,950
i. Sales price per unit = $82,950/1,975 = $42
j. Variable cost per unit = $39,500/1,975 = $20
PROBLEM SET A
Problem 18–1A (25 minutes)
Parts 1 and 2
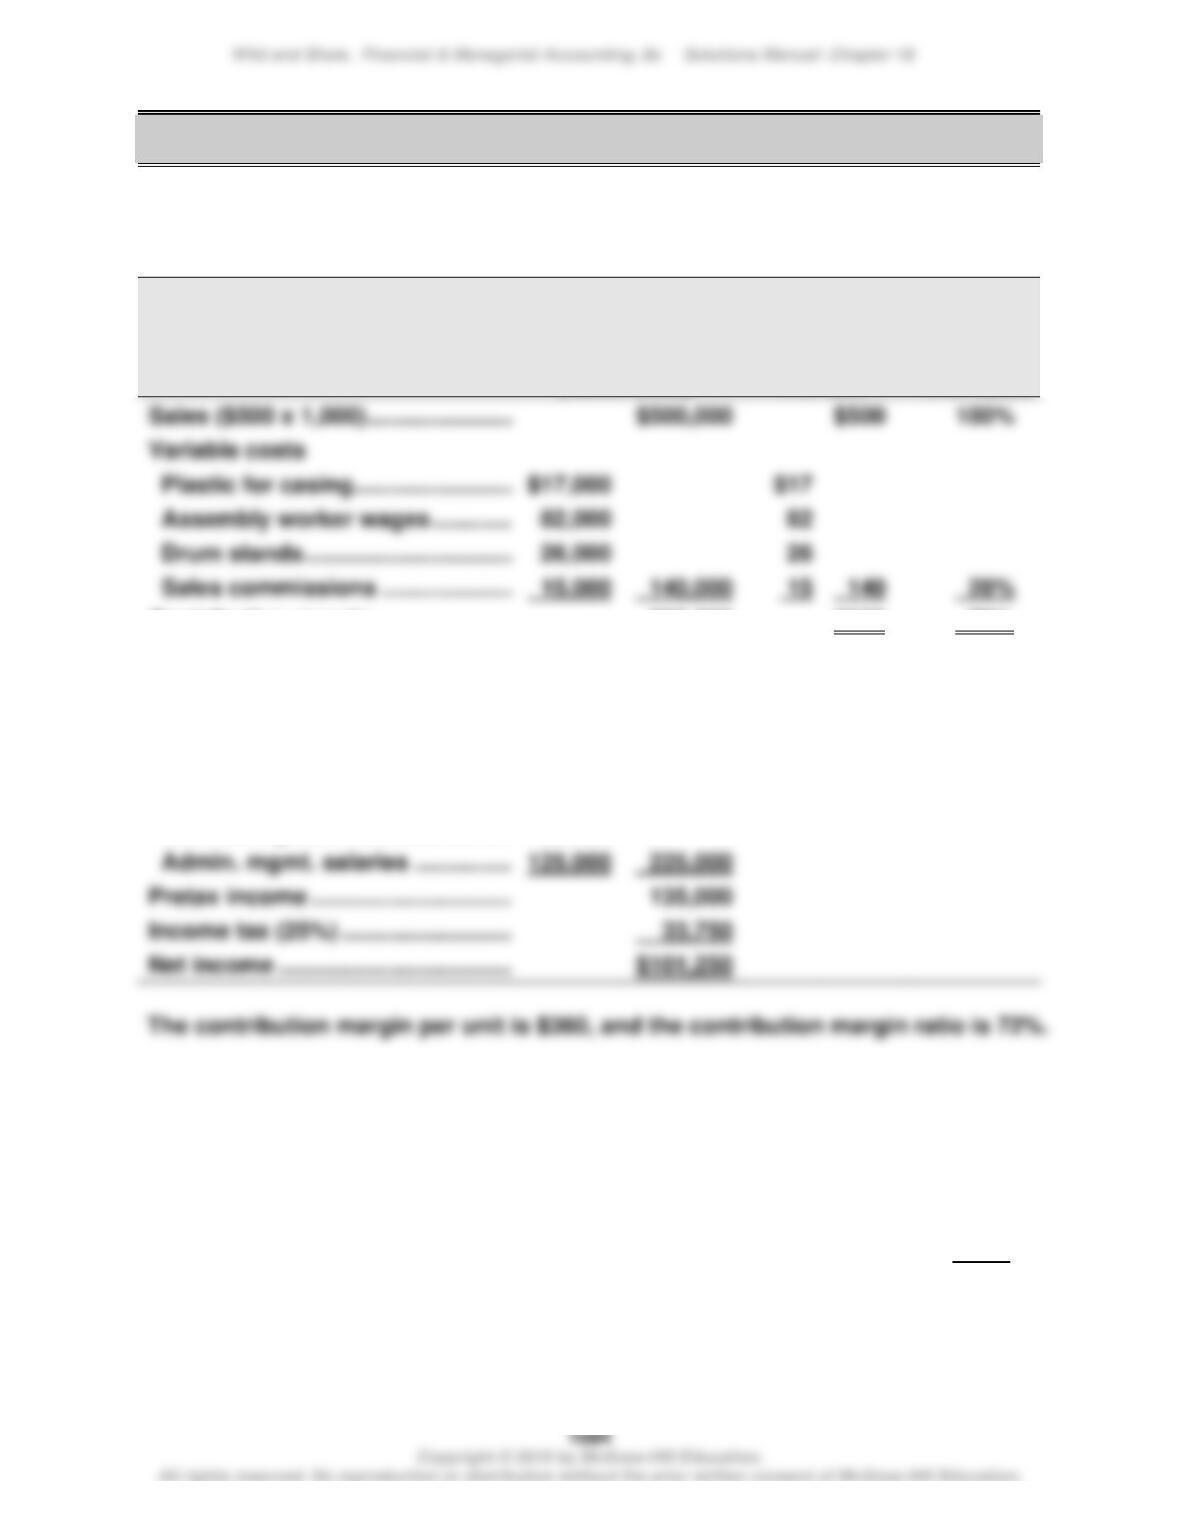
Tight Drums Company
Contribution Margin Income Statement
For Year Ended December 31, 2019
(1,000 units) Per unit % of sales
Sales ($500 x 1,000) ……………………….
$500
Variable costs
Assembly worker wages ………………..
82,000
26,000
28%
Contribution margin ………………………
360,000
$360
72%
Fixed costs
Taxes on factory …………………………..
5,000
Factory maintenance ……………………..
10,000
Factory machinery deprec. …………….
40,000
Sales equipment lease …………………..
10,000
Accounting staff salaries ……………….
35,000
Admin. mgmt. salaries …………………..
135,000
Part 3 Analysis Component
Contribution margin shows how much of total sales are available to cover fixed
costs and contribute to operating income. This is why the title for this statement
is “Contribution Margin Income Statement.” Contribution margin ratio shows
management the percent of each sales dollar that is available to cover fixed costs
and to contribute to operating income. That is, for each $1 of sales, $0.72 is
available both to cover fixed costs and to contribute to operating income.
Problem 18-2A (20 minutes)
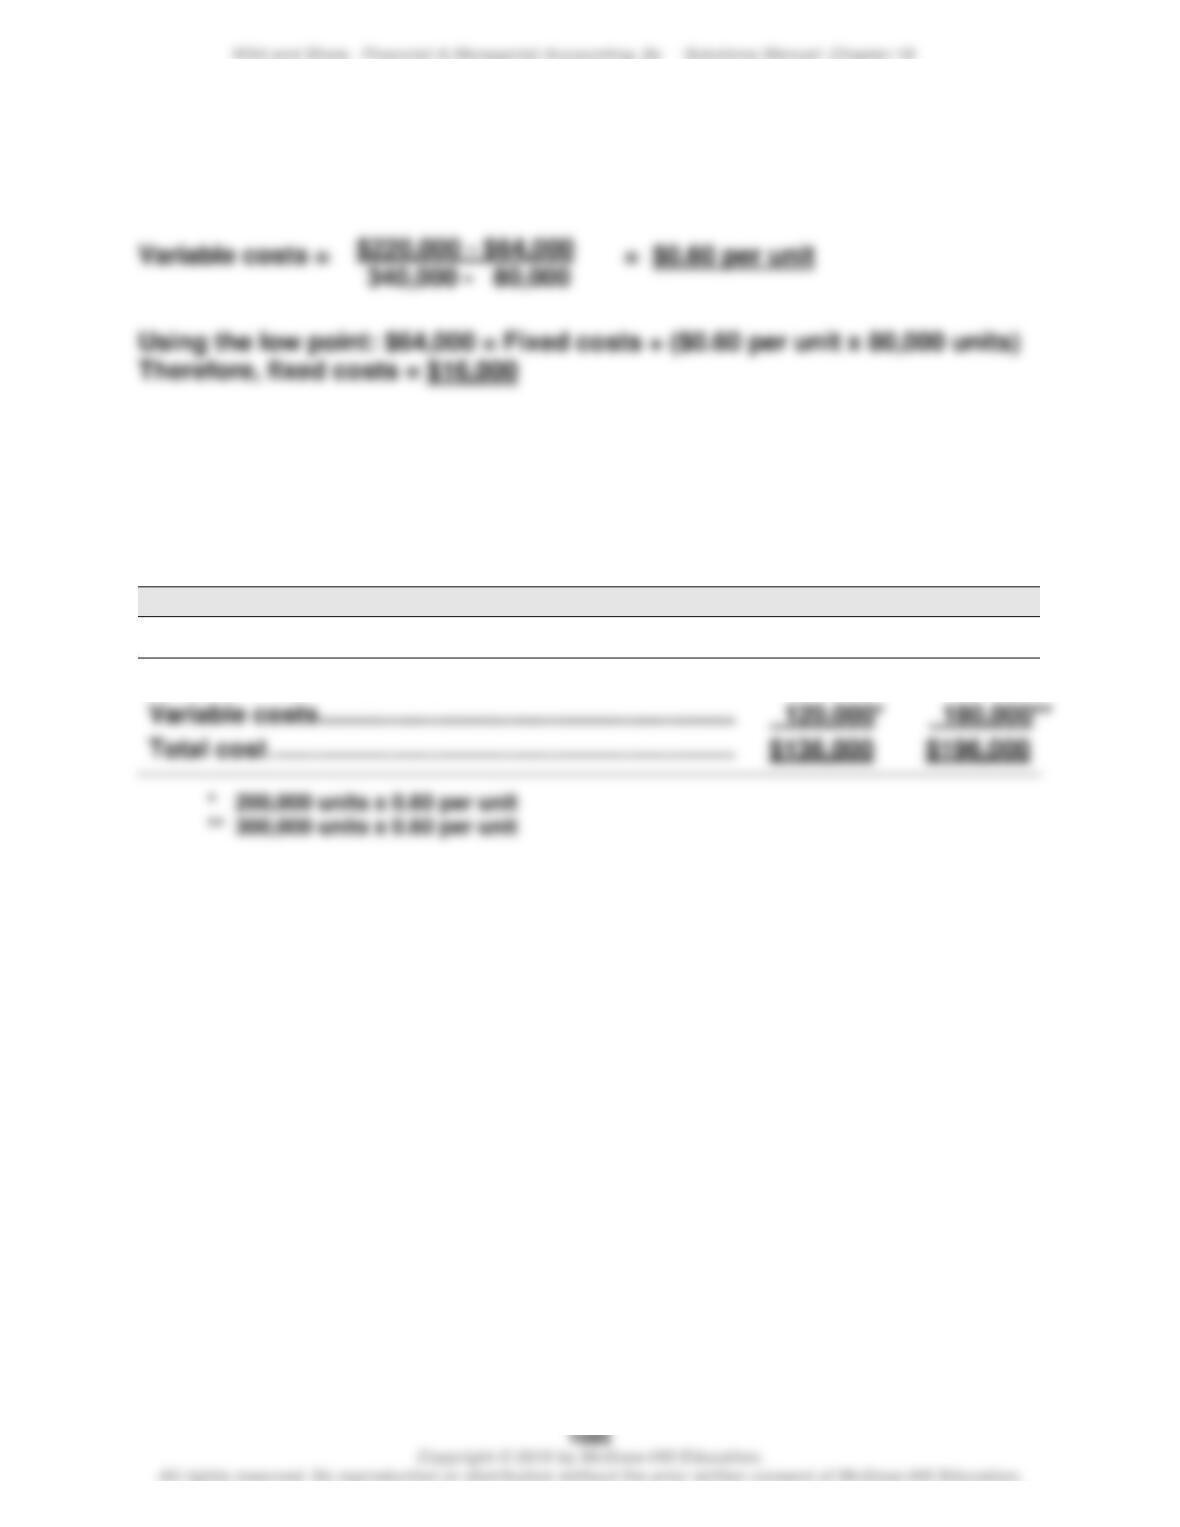
Part 1 – Calculation of variable and fixed costs
Part 2
The estimates in Part 1 can be used to predict the total costs that will be
incurred at sales levels of 200,000 and 300,000 units.
Predictions
Sales units (given) …………………………………………………
200,000
300,000
Fixed costs (from part 1) ………………………………………..
$16,000
$16,000
Problem 18-3A (40 minutes)
Part 1
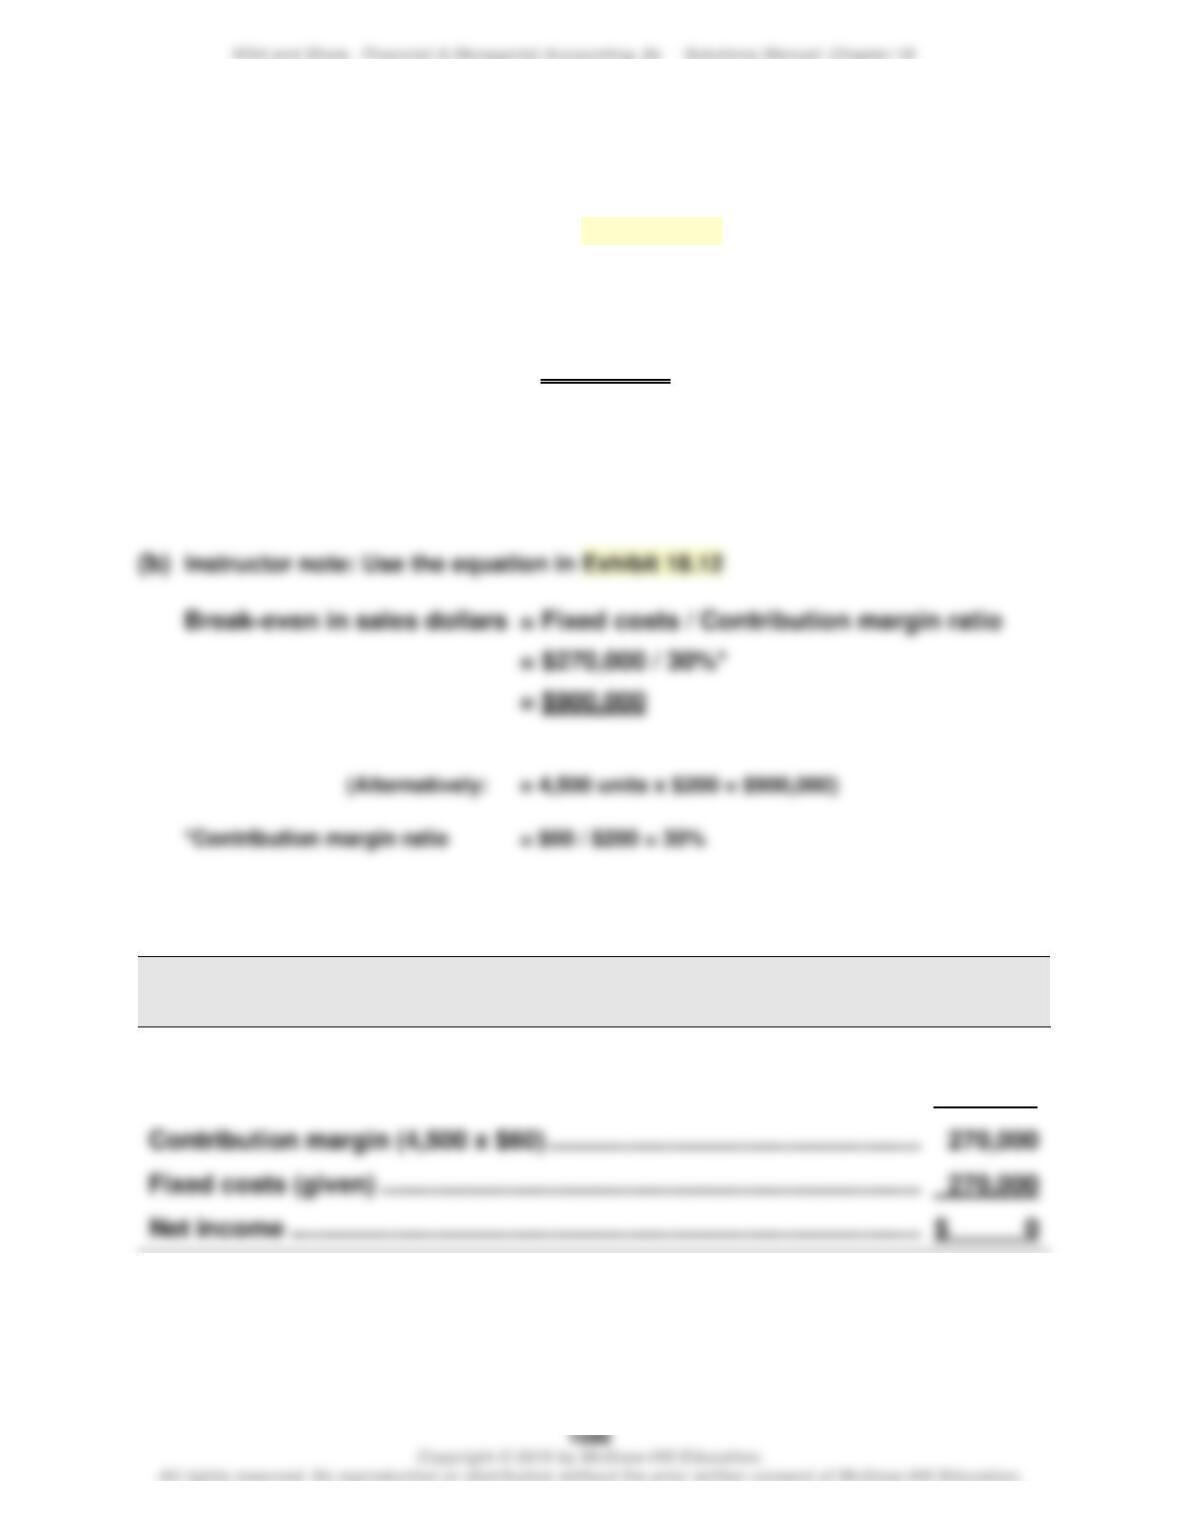
(a) Instructor note: Use the equation in Exhibit 18.11
Break-even in sales units = Fixed costs / Contribution margin per unit
= $270,000 / $60*
= 4,500 units (1 unit = 100 yards)
*Contribution margin per unit = $200 – $140 = $60 per 100 yards
Part 2
PRAVEEN CO.
Contribution Margin Income Statement (at Break-Even) — Product XT
Sales (4,500 x $200) ……………………………………………………….…………..
$900,000
Variable costs (4,500 x $140) ………………………………………………………
630,000
Fixed costs (given) …………………………………………………………………….
270,000
Problem 18-3A (Continued)
For the instructor:
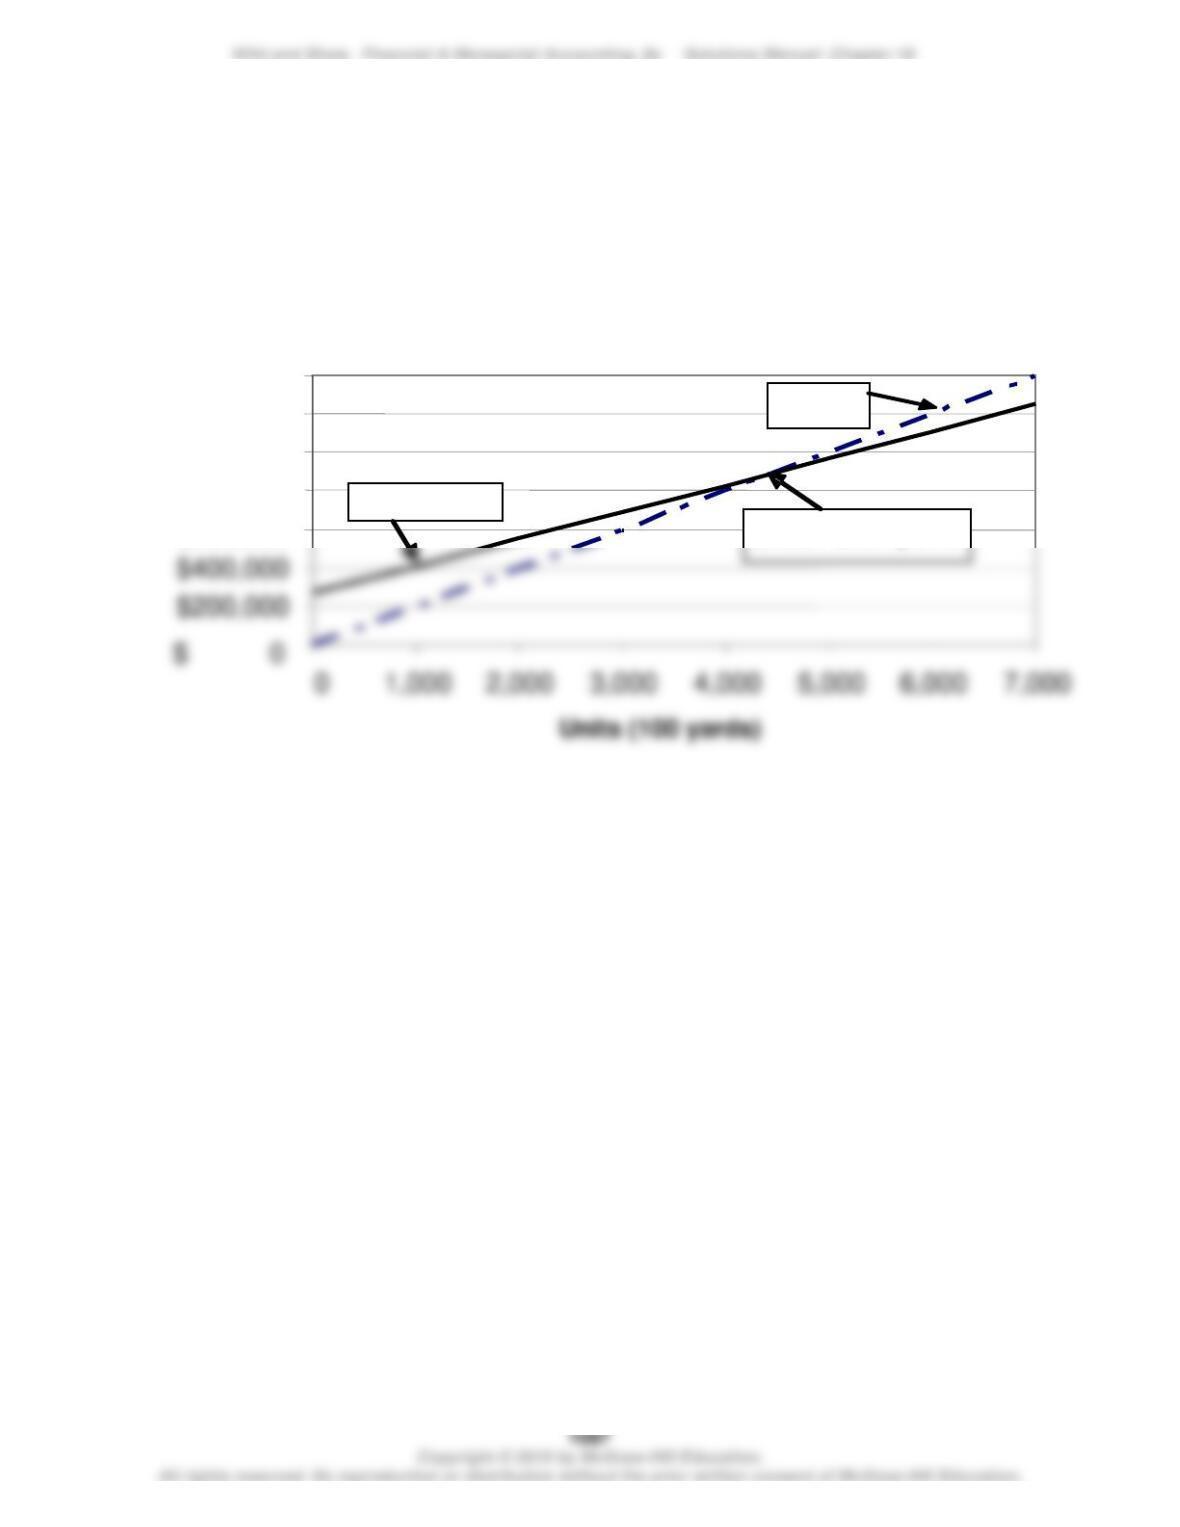
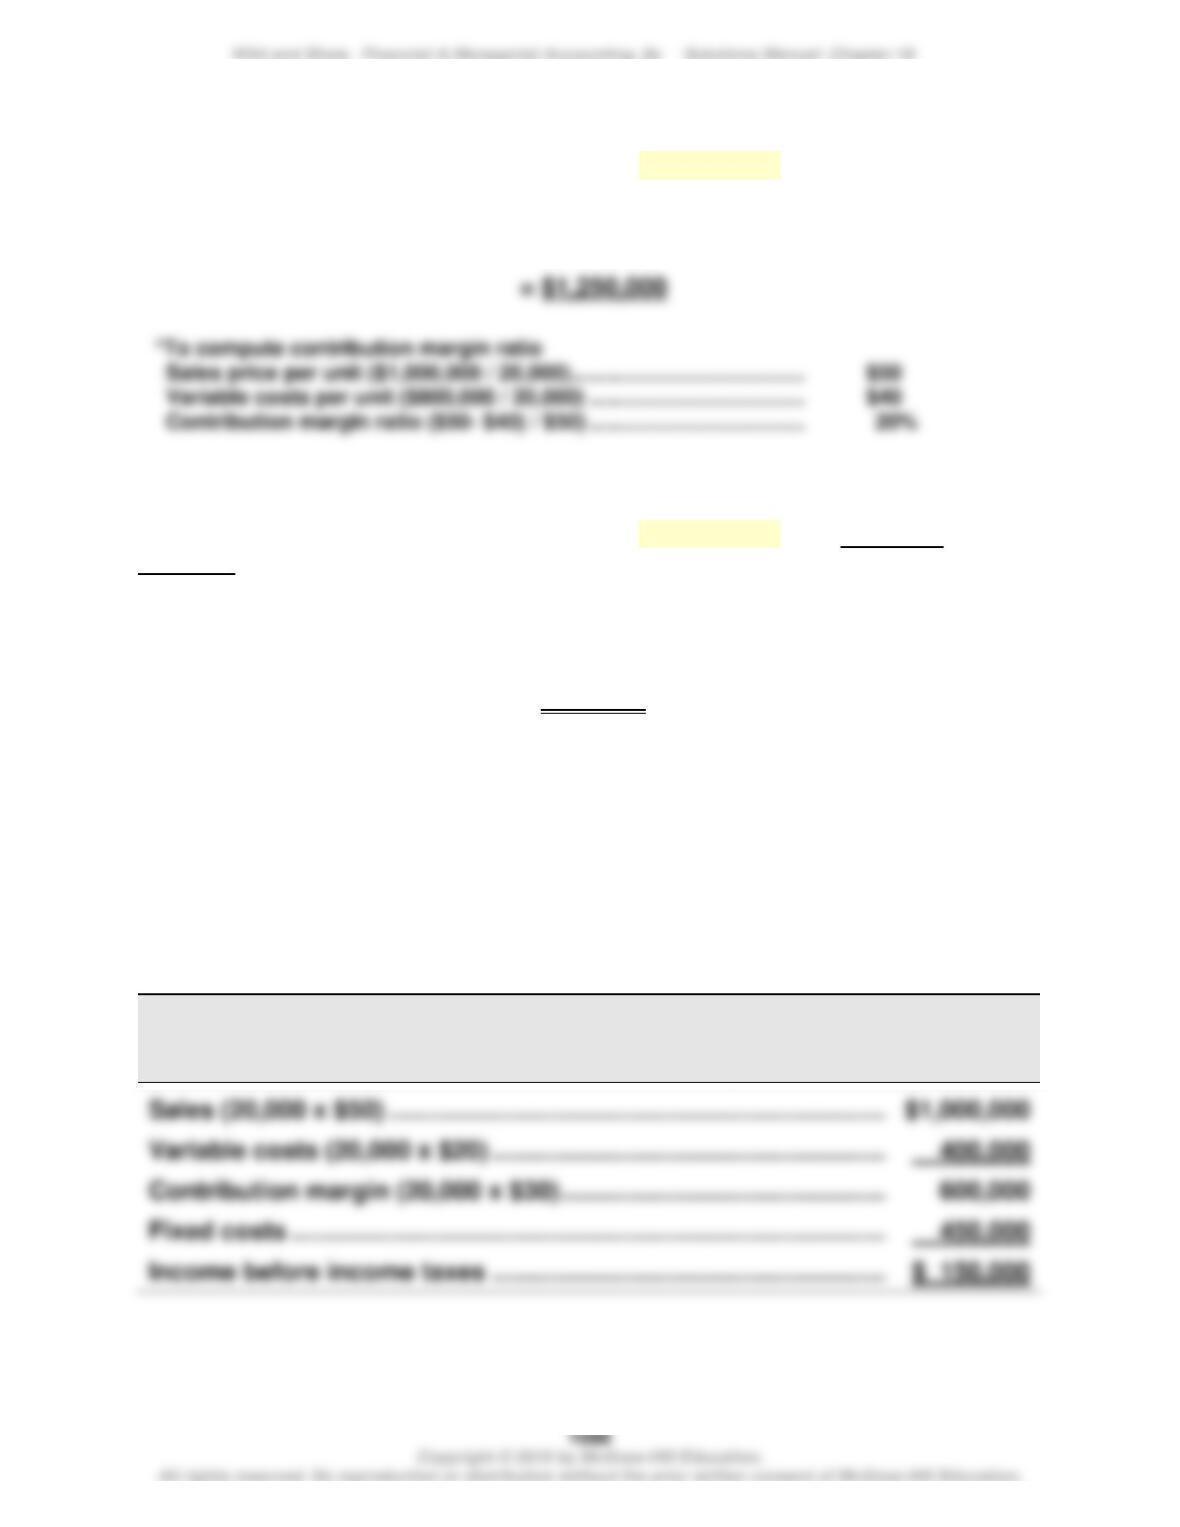
CVP Chart for Praveen Company
$200,000
$400,000
0
$600,000
$800,000
$1,000,000
$1,200,000
$1,400,000
Total costs
Sales
Break-even point
Problem 18-4A (75 minutes)
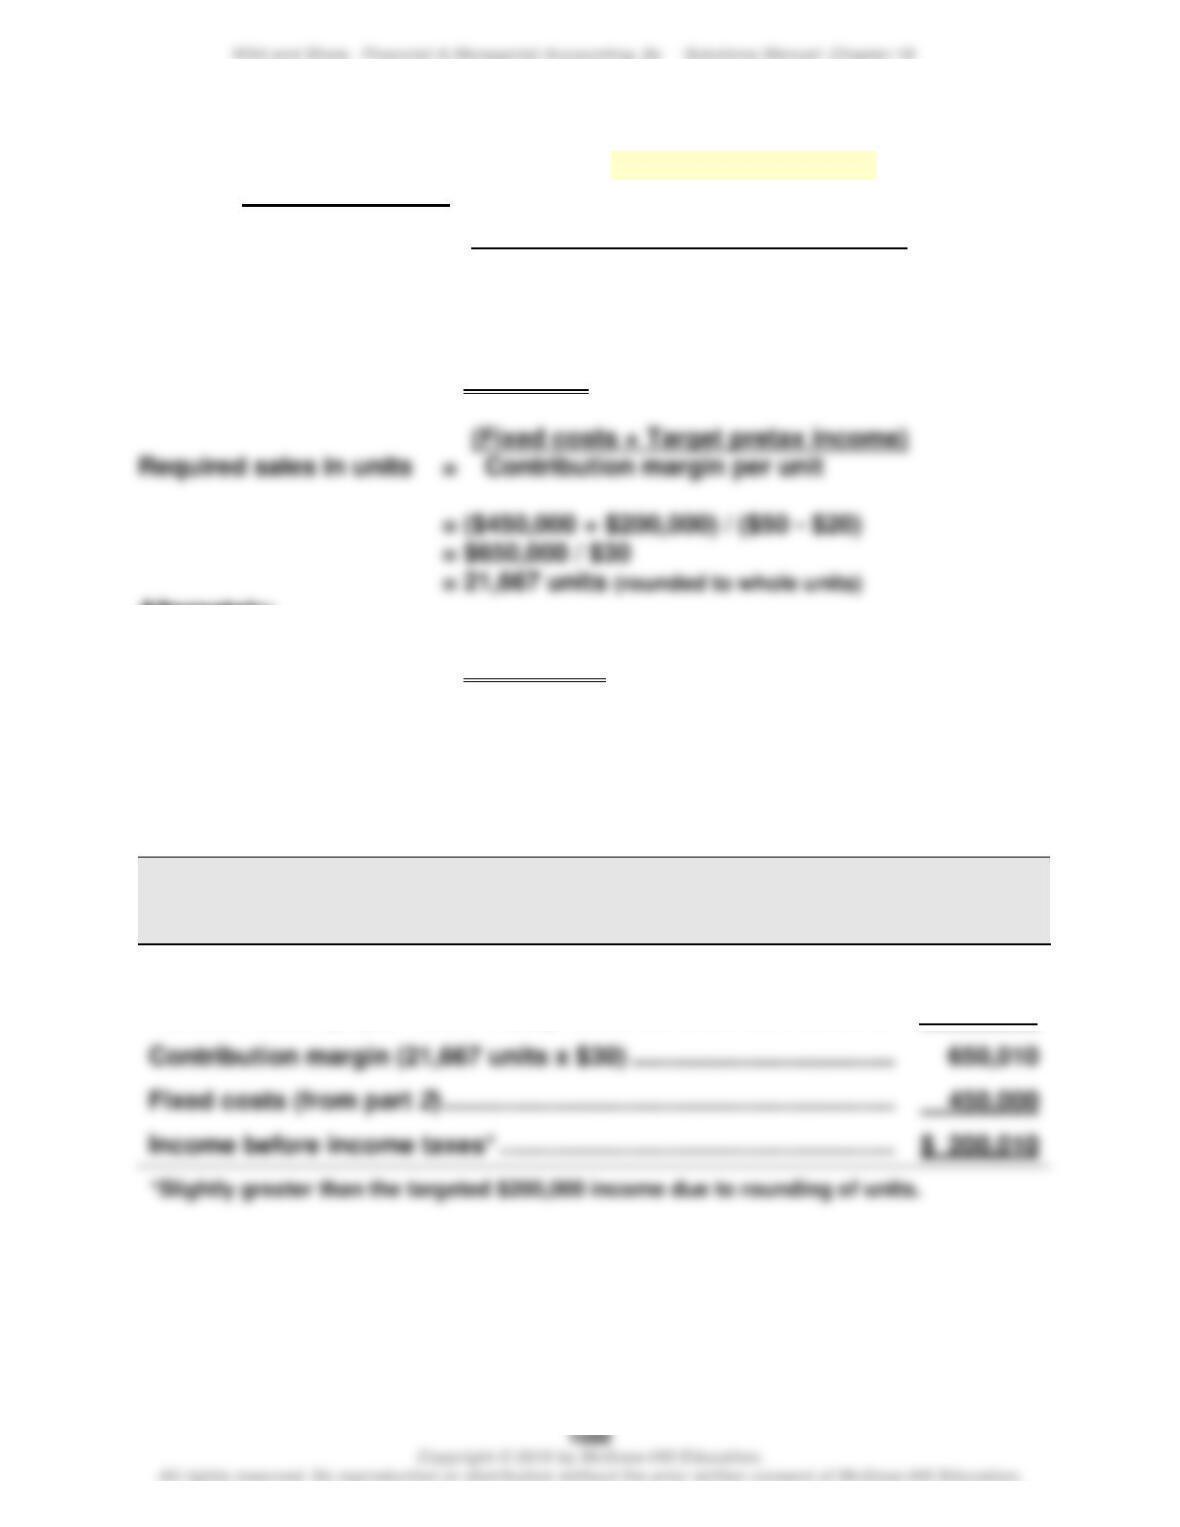
Part 1 Instructor note: Use the equation in Exhibit 18.12
2019 break-even in sales dollars = Fixed costs / Contribution margin ratio
= $250,000 / 20%*
Sales price per unit ($1,000,000 / 20,000) ……………………………………………………….
$50
Variable costs per unit ($800,000 / 20,000) …………………………..…………………………
$40
Contribution margin ratio ($50- $40) / $50) ……………………………………………………..
Part 2 Instructor note: Use the equation in Exhibit 18.12 with predicted
numbers
2020 break-even in sales dollars = Fixed costs / Contribution margin ratio
= $450,000* / 60%**
= $750,000
*To compute predicted fixed costs
2019 fixed costs plus 2020 increase ($250,000 + $200,000) …………………………..
$450,000
**To compute predicted contribution margin ratio
Predicted sales price per unit (no change in sales price) …………………………..
$50
Predicted variable costs per unit ($40 x 50%) …………………………..
$20
Predicted contribution margin ratio ($50- $20) / $50) …………………………..
60%
Part 3
ASTRO COMPANY
Forecasted Contribution Margin Income Statement
For Year Ended December 31, 2020
Problem 18–4A (Continued)
Part 4 Instructor note: Use equations in Exhibits 18.22 and 18.23 with
predicted numbers
(Fixed costs + Target pretax income)
Required sales in dollars = Contribution margin ratio
= ($450,000* + $200,000) / 60%**
= $650,000 / 60.0%
= $1,083,333 (rounded to whole dollars)
Alternately:
Required sales in units = $1,083,333† / $50 Sales price per unit
= 21,667 units (rounded to whole units)
* 2019 fixed costs plus 2020 increase ($250,000 + $200,000) …………………………
$450,000
** Predicted contribution margin ratio ($50- $30) / $50)—from part 2 ……………….
60%
† Taken from “required sales in dollars” above
Part 5
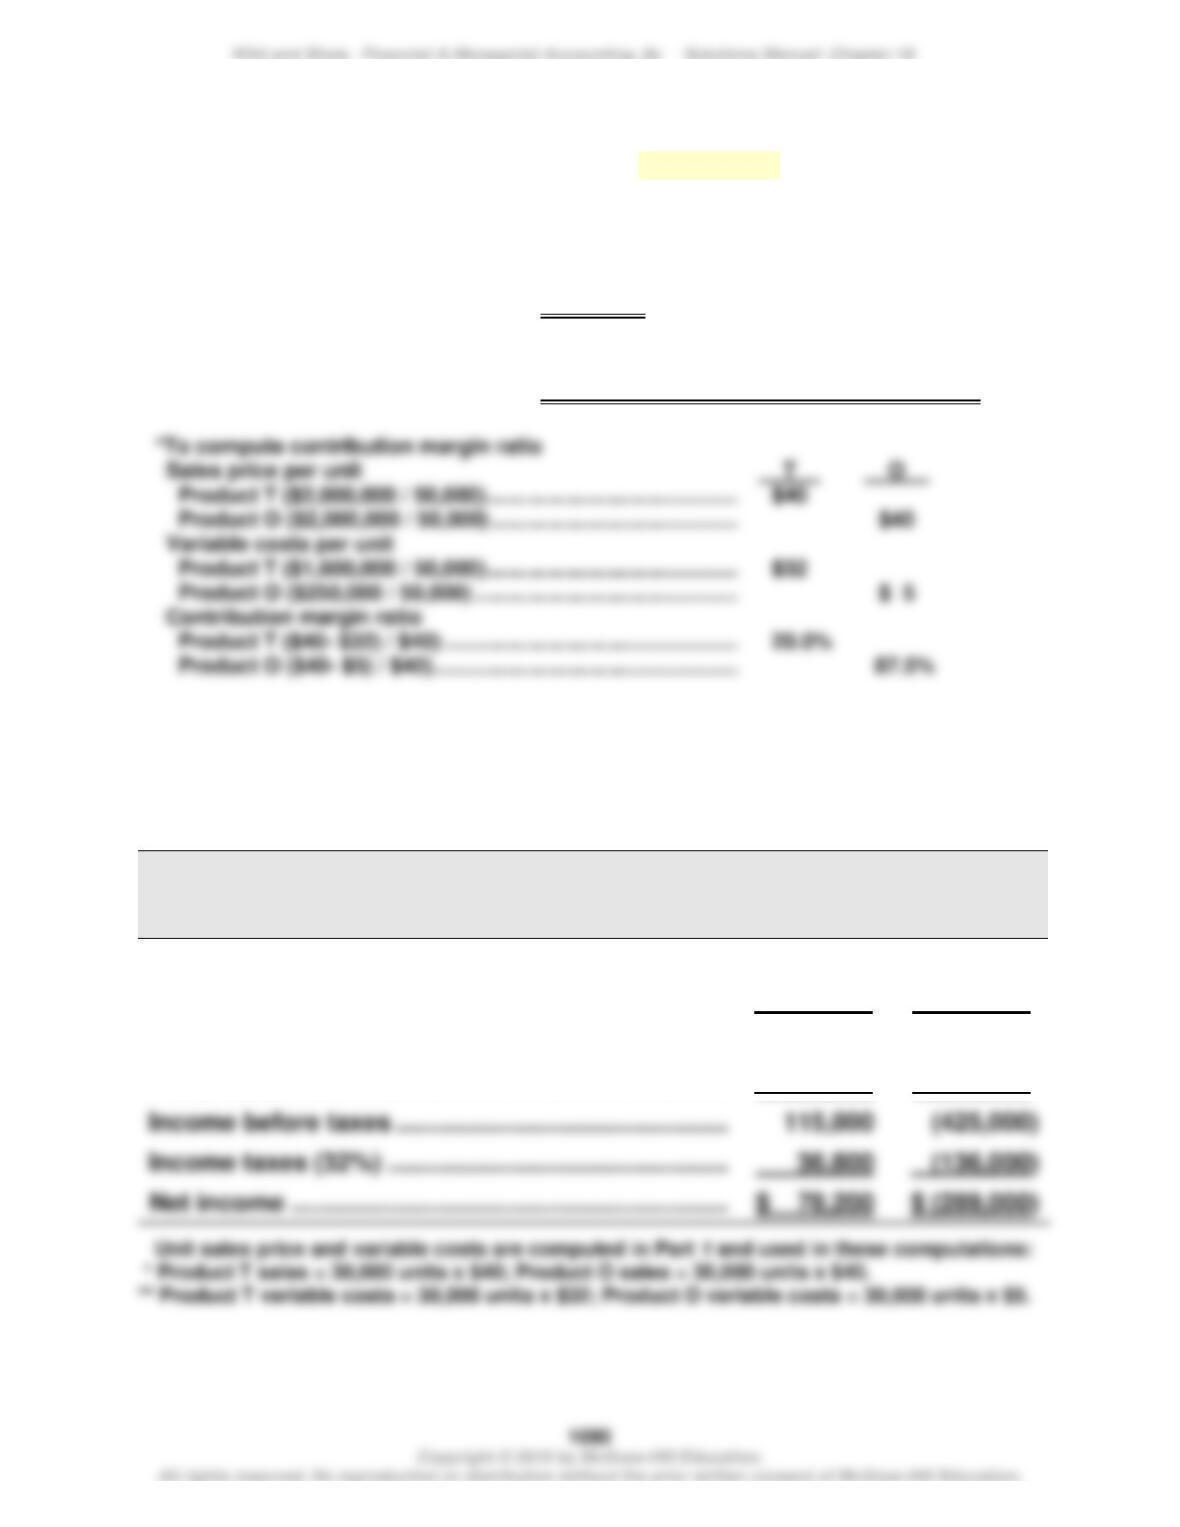
ASTRO COMPANY
Forecasted Contribution Margin Income Statement
For Year Ended December 31, 2020
Sales (21,667 units x $50) ……………………………………………………….
$1,083,350
Variable costs (21,667 units x $20) …………………………………………….
433,340
Fixed costs (from part 2) ……………………………………………………………
450,000
Income before income taxes* …………………………………………………….
Problem 18-5A (65 minutes)
Part 1 Instructor note: Use the equation in Exhibit 18.12
Break-even in dollar sales = Fixed costs / Contribution margin ratio
Product T:
= $125,000 / 20%*
= $625,000
Product O:
= $1,475,000 / 87.5%*
= $1,685,714 (rounded to the nearest dollar)
Part 2
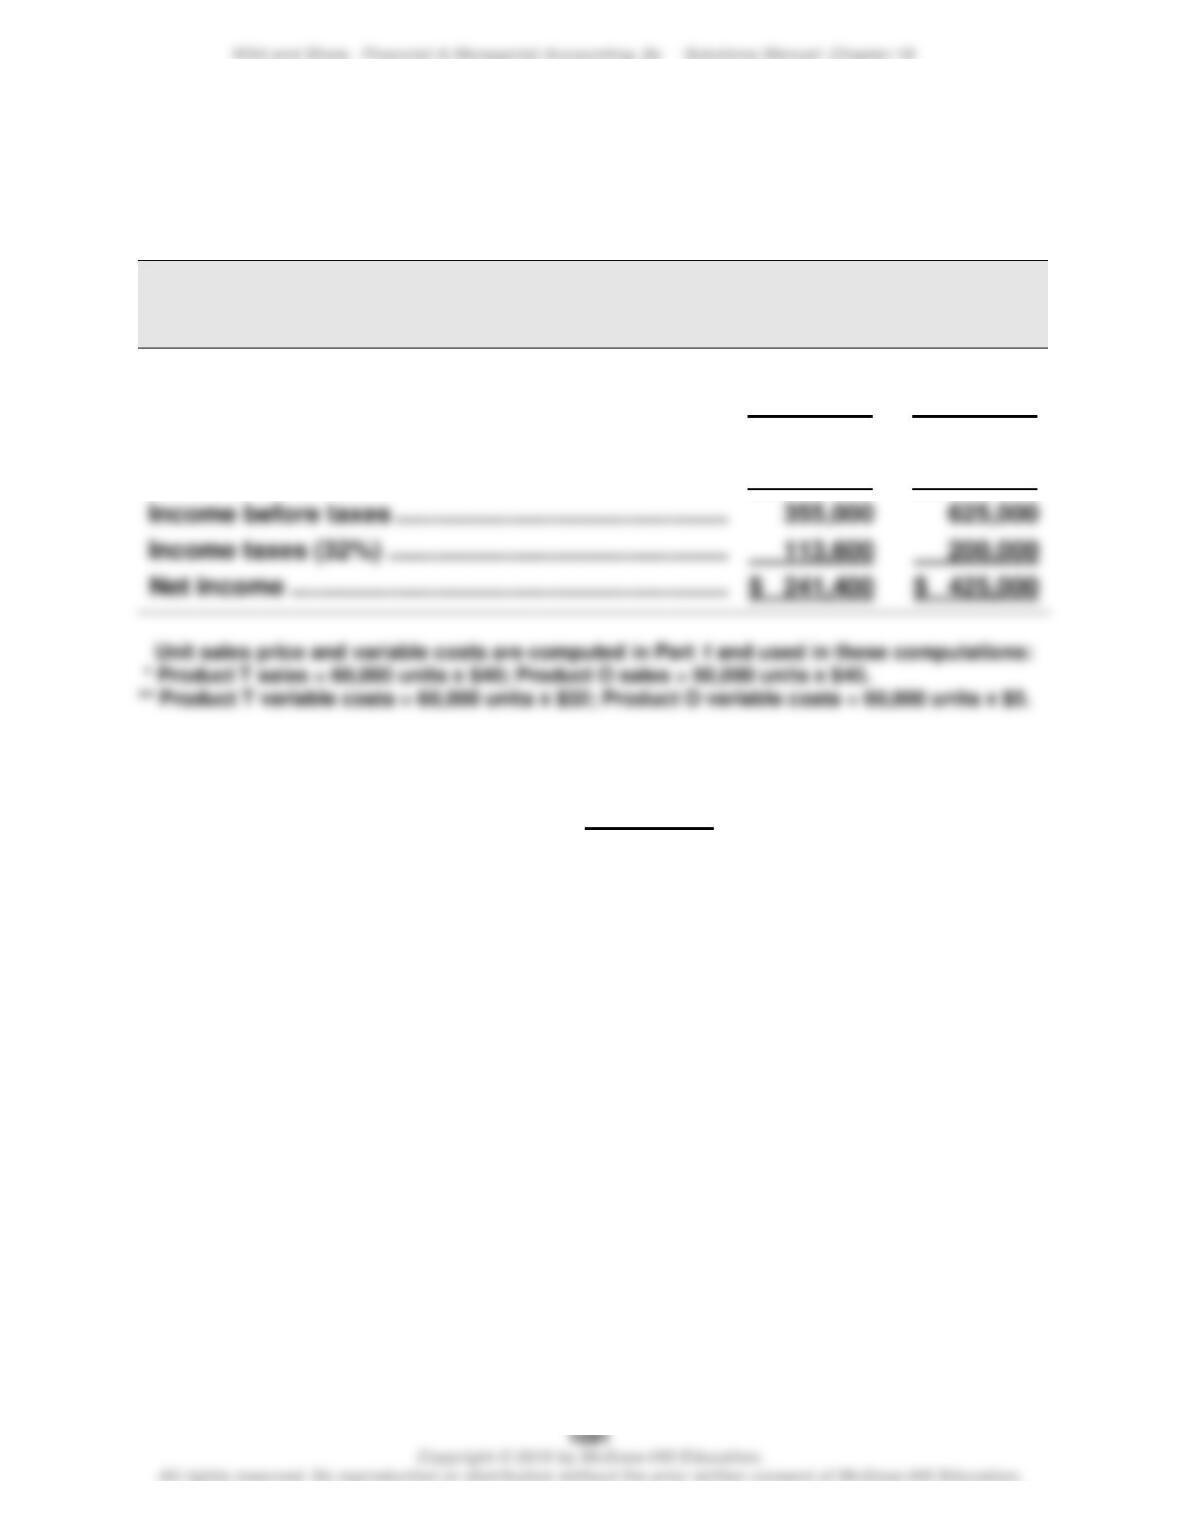
Forecasted contribution margin income statements for each product
assuming sales declines to 30,000 units with no change in unit sales price
HENNA CO.
Forecasted Contribution Margin Income Statement
Product T
Product O
Sales* …………………………………………………………………
$1,200,000
$1,200,000
Variable costs** …………………………..………………………
960,000
150,000
Contribution margin ……………………………………………
240,000
1,050,000
Fixed costs ……………………………………………………….
125,000
1,475,000
115,000
36,800
Net income ……………………………………………………….
Problem 18-5A (Continued)
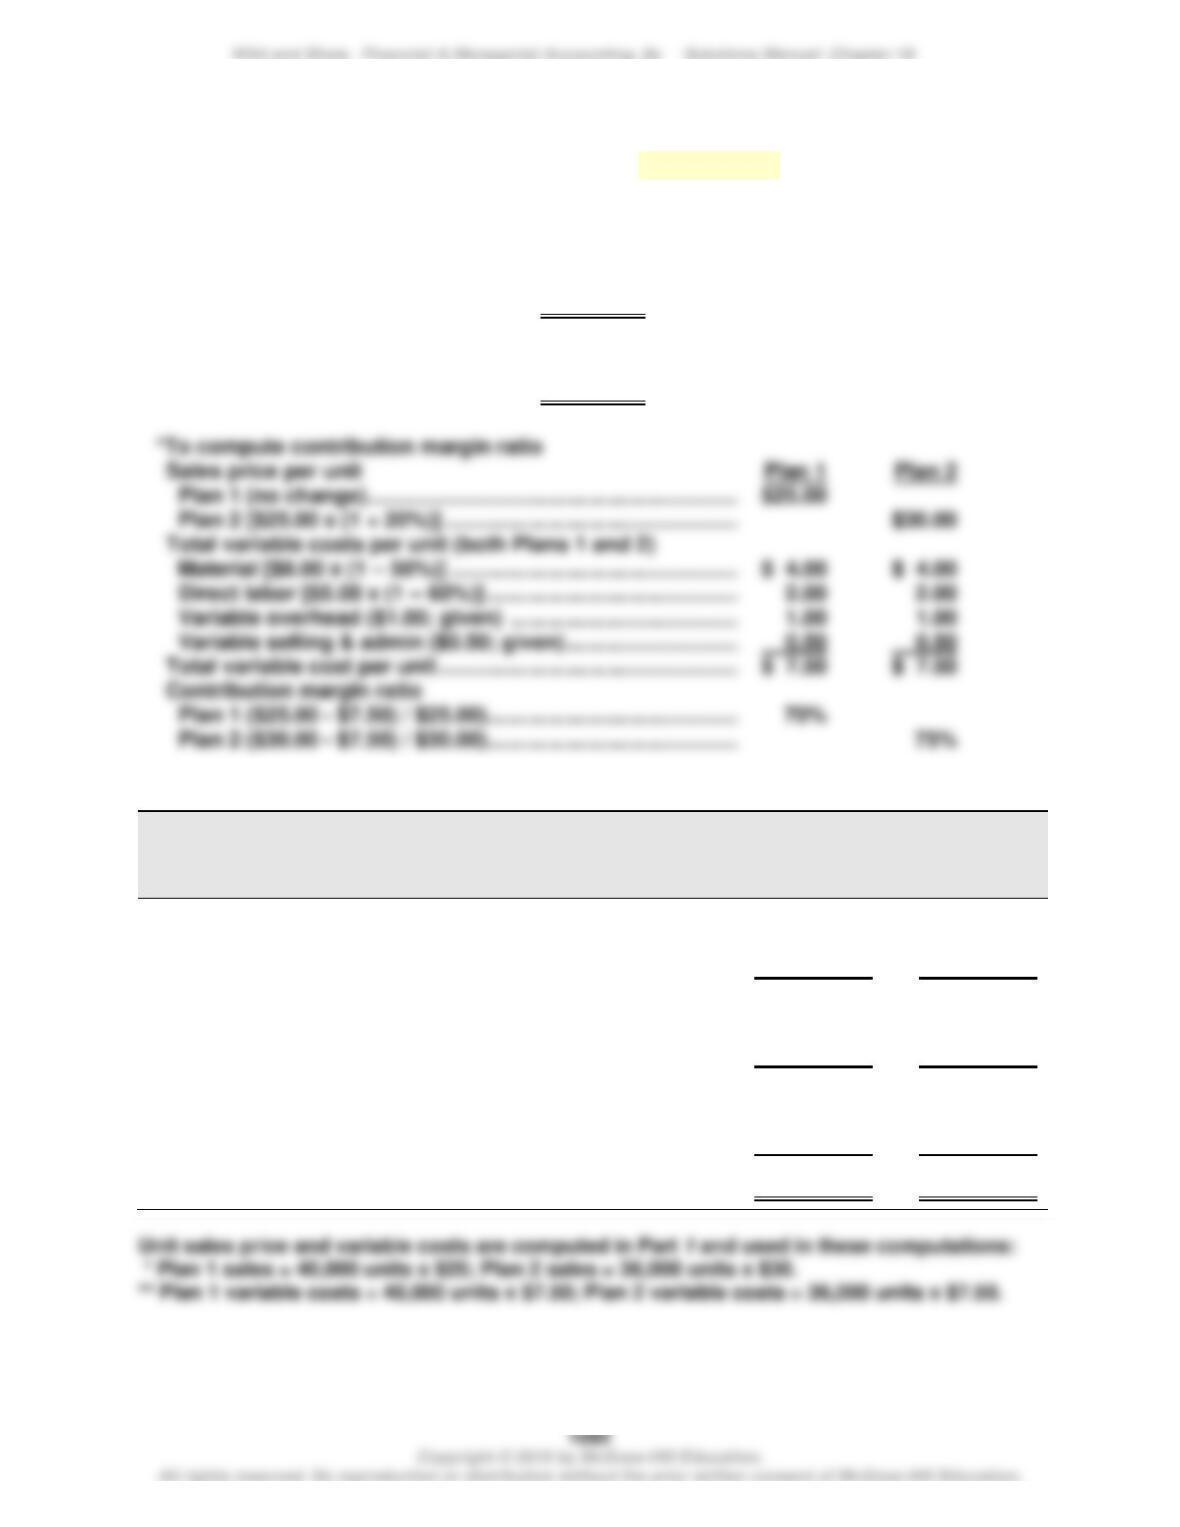
Part 3 Forecasted contribution margin income statements for each product
assuming sales increase to 60,000 units with no change in unit sales price
HENNA CO.
Forecasted Contribution Margin Income Statement
Product T
Product O
Sales* …………………………………………………………………
$2,400,000
$2,400,000
Variable costs** …………………………..………………………
1,920,000
300,000
Contribution margin ……………………………………………
480,000
2,100,000
Fixed costs ……………………………………………………….
125,000
1,475,000
Income before taxes ……………………………………………
355,000
113,600
200,000
Part 4
If sales were to greatly decrease, Product O would suffer the greater
decrease in net income because it would lose more contribution margin per
unit than Product T ($35 for O versus $8 for T). Examining the operating
leverage of these two products can yield the same inference. Specifically,
higher operating leverage reflects higher fixed costs, which implies greater
impacts on income from changes in sales levels. In the extreme, at zero
sales, Product O would have a loss equal to its fixed costs of $1,475,000,
while Product T’s loss would be only $125,000.
Problem 18-6A (45 minutes)
Part 1 Instructor note: Use the equation in Exhibit 18.12
Break-even in dollar sales = Fixed costs / Contribution margin ratio
Plan 1:
= ($200,000 + $325,000) / 70%*
= $750,000
Plan 2:
= ($200,000 + $325,000) / 75%*
= $700,000
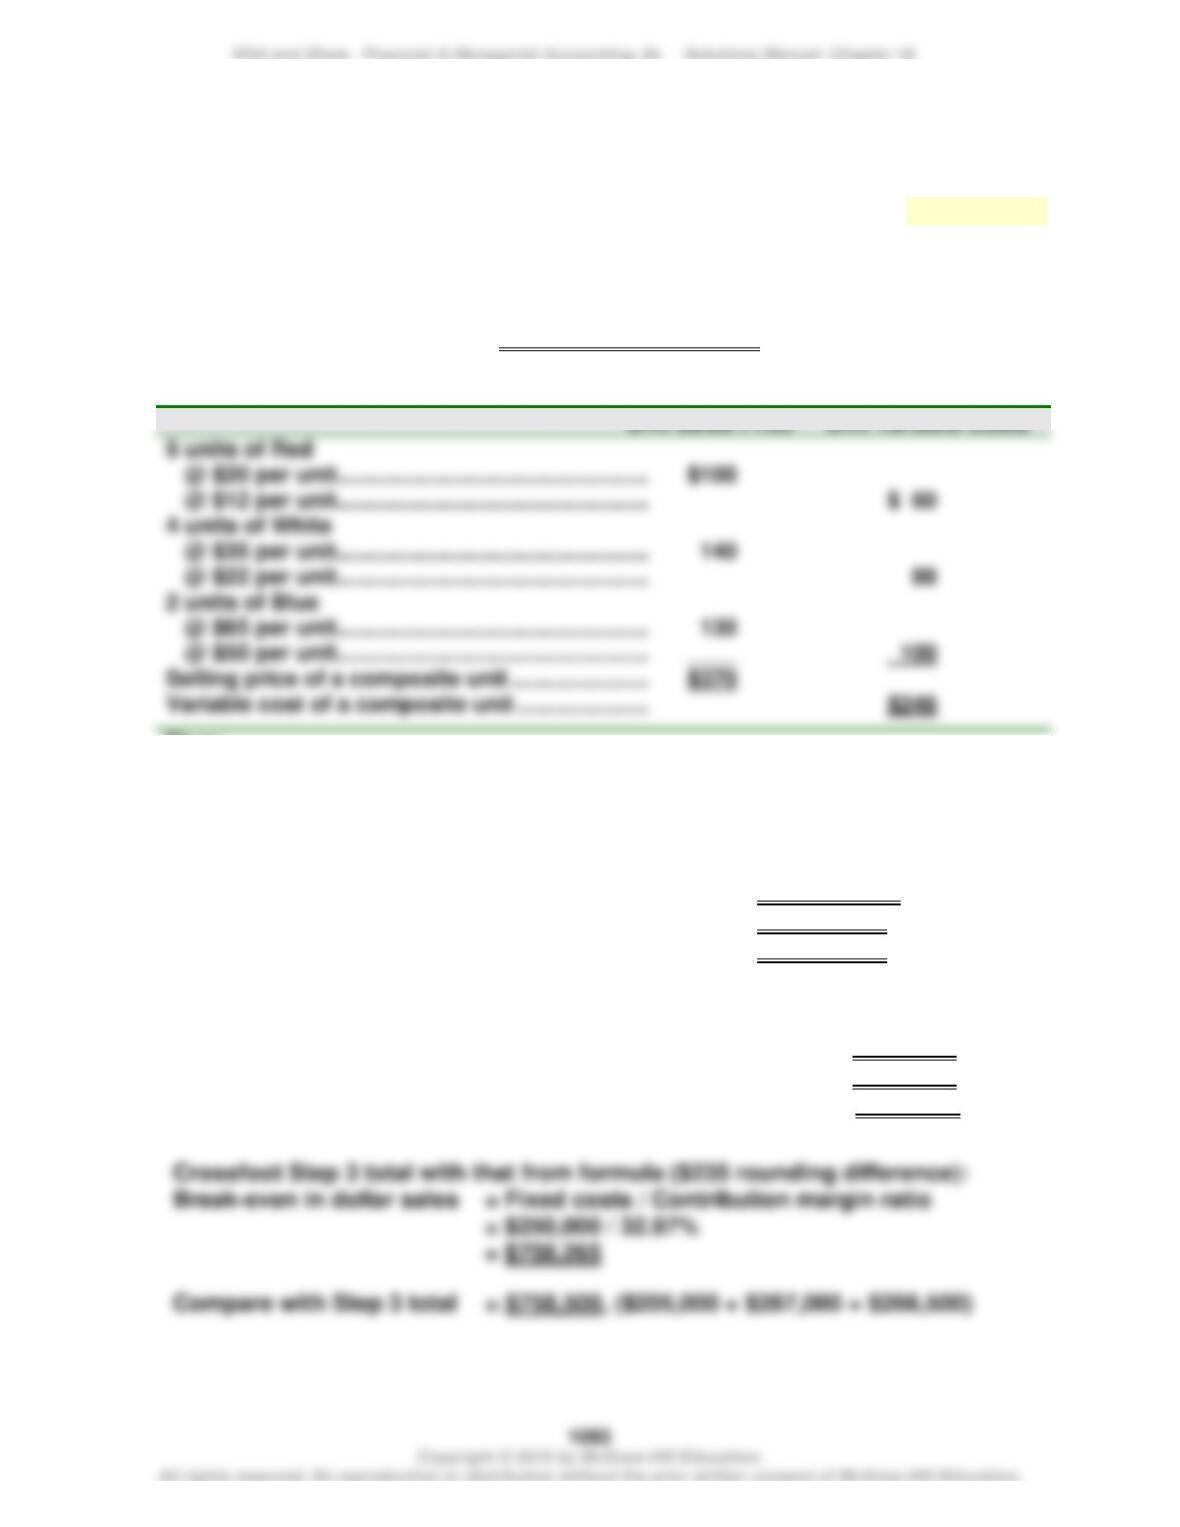
Part 2
BURCHARD CO.
Forecasted Contribution Margin Income Statement
Plan 1
Plan 2
Sales* …………………………………………………………………
$1,000,000
$1,080,000
Variable costs** …………………………..………………………
300,000
270,000
Contribution margin ……………………………………………
700,000
810,000
Fixed costs ……………………………………………………….
525,000
525,000
Income before taxes ……………………………………………
175,000
285,000
Income taxes (30%) …………………………………………….
52,500
85,500
Net income ……………………………………………………….
$ 122,500
$ 199,500
Problem 18-7A (50 minutes)
Part 1 BREAK–EVEN ANALYSIS ASSUMING USE OF SAME MATERIALS
Step 1: Compute break-even in composite units—Use equation in Exhibit 18.29
Break-even in composite units = Fixed costs/Contribution margin per composite unit
= $250,000 / $122*
= 2,050 composite units (rounded up to next whole unit)
*To compute the contribution margin per composite unit
Thus:
Contribution margin per composite unit = $370 – $248 = $122
Contribution margin ratio (rounded) = $122 / $370 = 32.97%
Step 2: Compute break-even in individual product unit sales
Unit sales of Red at break–even: 2,050 x 5 = 10,250 units
Unit sales of White at break-even: 2,050 x 4 = 8,200 units
Unit sales of Blue at break–even: 2,050 x 2 = 4,100 units
Step 3: Compute break-even in individual product dollar sales
Dollar sales of Red at break-even: 10,250 units x $20 = $205,000
Dollar sales of White at break-even: 8,200 units x $35 = $287,000
Dollar sales of Blue at break-even: 4,100 units x $65 = $266,500
Problem 18–7A (Continued)
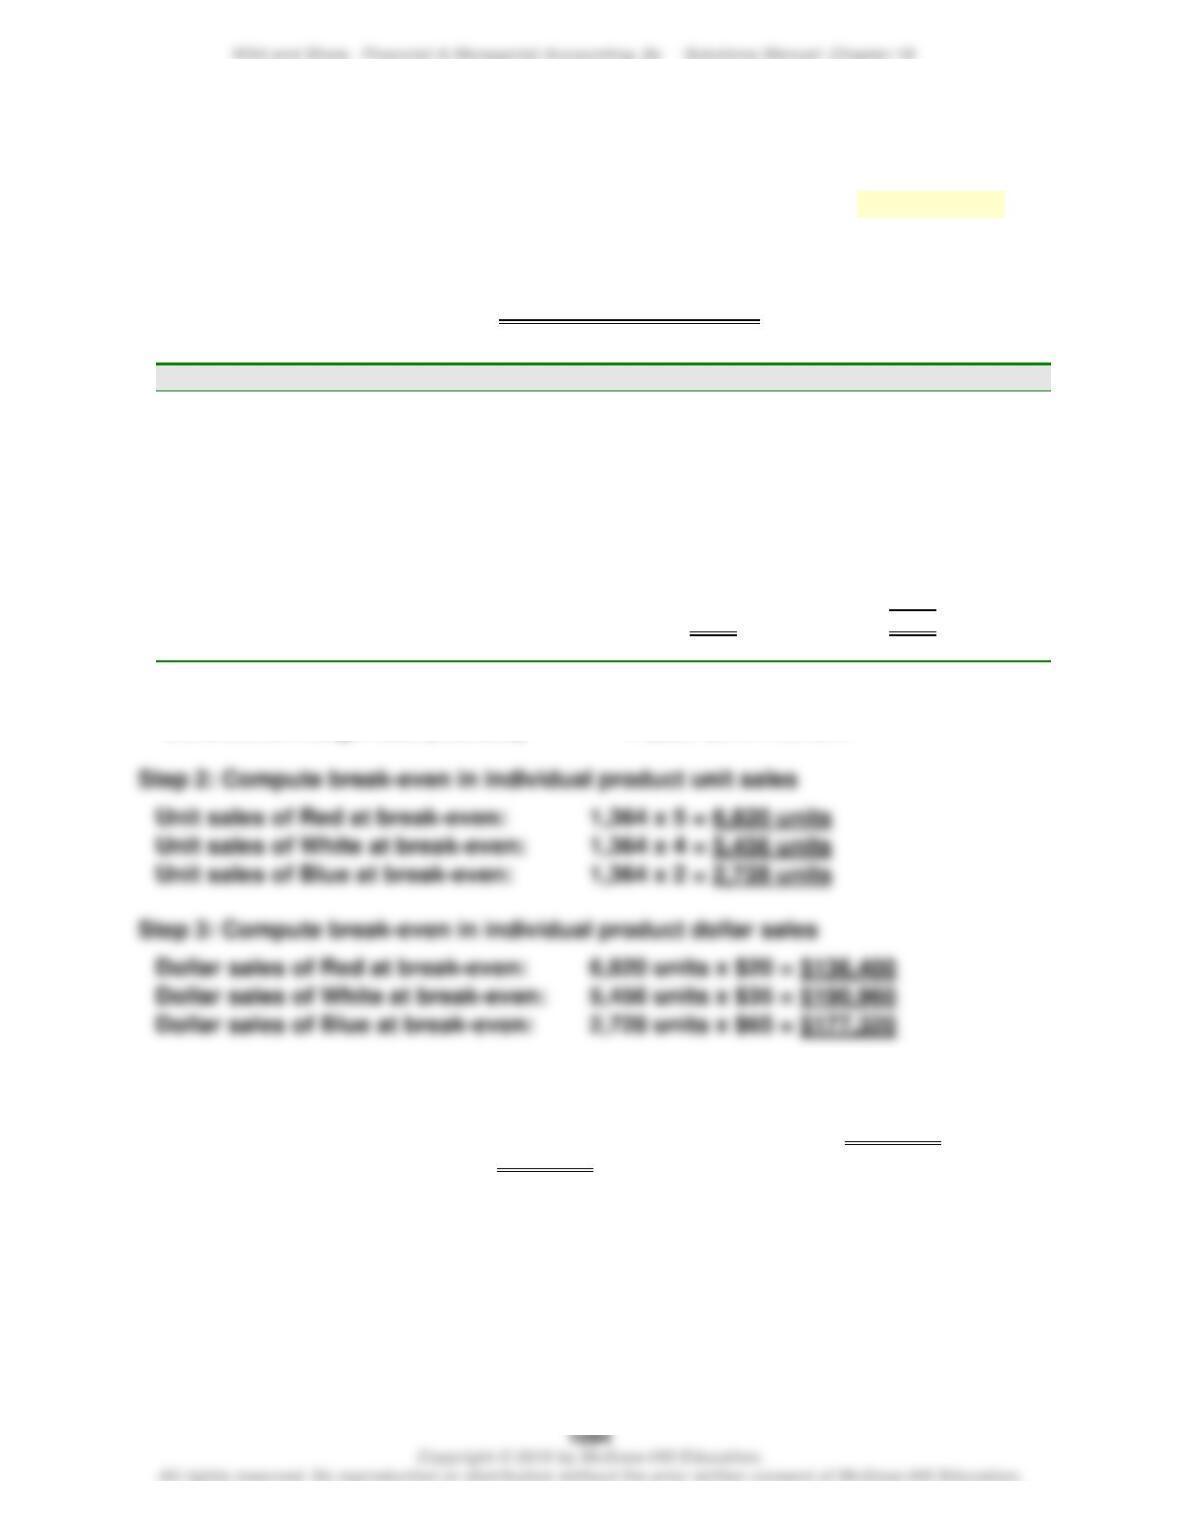
Part 2 BREAK–EVEN ANALYSIS ASSUMING USE OF NEW MATERIALS
Step 1: Compute break-even in composite units—Use equation in Exhibit 18.29
Break-even in composite units = Fixed costs/Contribution margin per composite unit
= ($250,000 + $50,000) / $220*
= 1,364 composite units (rounded to the next whole unit)
*To compute the contribution margin per composite unit
Unit Sales Price
Unit Variable Costs
5 units of Red
@ $20 per unit ……………………………………………..
@ ($12 – $6) per unit …………………………………….
$100
$ 30
4 units of White
@ $35 per unit ……………………………………………..
@ ($22 – $12) per unit …………………………………..
140
40
2 units of Blue
@ $65 per unit ……………………………………………..
@ ($50 – $10) per unit …………………………………..
130
____
80
Selling price of a composite unit ……………………..
Variable cost of a composite unit …………………….
$370
$150
Thus:
Contribution margin per composite unit = $370 – $150 = $220
Contribution margin ratio (rounded) = $220/ $370 = 59.46%
Crossfoot Step 3 total with that from formula ($139 rounding difference):
Break-even in dollar sales = Fixed costs / Contribution margin ratio
= ($250,000 + $50,000) / 59.46% = $504,541 (rounded)
Compare with Step 3 total = $504,680 ($136,400 + $190,960 + $177,320)
PROBLEM SET B
Problem 18-1B (25 minutes)
Parts 1 and 2
Gilmore Company
Contribution Margin Income Statement
For Year Ended December 31, 2019
(12,000 units) Per unit % of sales
Sales ($18 x 12,000) ………………………..
$216,000
$18.000
100.00%
Variable costs
Plastic for CD sets ………………………..
$ 1,500
$0.125
Assembly worker wages …………………
30,000
2.500
Labeling ……………………………………..
3,000
0.250
Sales commissions ………………………
6,000
40,500
0.500
3.375
18.75%
Contribution margin ……………………….
175,500
$14.625
81.25%
Fixed costs
Rent on factory …………………………..
6,750
Factory cleaning service …………………
4,520
Office equipment lease …………………..
1,050
System staff salaries ………………………
15,000
Pretax income ………………………………….
Income tax (25%) …………………………..
Net income ………………………………………
Part 3 Analysis Component
Contribution margin shows how much of total sales are available to cover
fixed costs and contribute to operating income. This is why the title for this
statement is “Contribution Margin Income Statement.” Contribution margin
ratio shows management the percent of each sales dollar that is available to
cover fixed costs and to contribute to operating income. That is, for each $1
of sales, roughly $0.8125 is available both to cover fixed costs and to
contribute to operating income.