CHAPTER 18
FINANCIAL STATEMENT ANALYSIS
Learning Objectives
1. APPLY HOIRIZONTAL AND VERTICAL ANALYSIS TO
FINANCIAL STATEMENTS.
2. ANALYZE A COMPANY’S PERFORMANCE USING
RATIO ANALYSIS.
3. APPLY THE CONCEPT OF SUSTAINABLE INCOME.
CHAPTER REVIEW
Need for Comparative Analysis
1. Financial statement analysis enables the financial statement user to make informed decisions
about a company.
2. When analyzing financial statements, three major characteristics of a company are generally
evaluated: (a) liquidity, (b) profitability, and (c) solvency.
3. Comparative analysis may be made on a number of different bases.
a. Intracompany basis—Compares an item or financial relationship within a company in the
current year with the same item or relationship in one or more prior years.
b. Industry averages—Compares an item or financial relationship of a company with industry
averages.
c. Intercompany basis—Compares an item or financial relationship of one company with the
same item or relationship in one or more competing companies.
Tools of Financial Analysis
4. (L.O. 1) There are three basic tools of analysis: (a) horizontal, (b) vertical, and (c) ratio.
Horizontal Analysis
5. Horizontal analysis, also called trend analysis, is a technique for evaluating a series of financial
statement data over a period of time to determine the increase or decrease that has taken place,
expressed as either an amount or a percentage. In horizontal analysis, a base year
is selected and changes are expressed as percentages of the base year amount.
Vertical Analysis
6. Vertical analysis, also called common size analysis, expresses each item within a financial
statement as a percentage of a base amount. Generally, the base amount is total assets for the
balance sheet, and net sales for the income statement. For example, it may be determined that
current assets are 22% of total assets, and selling expenses are 15% of net sales.
Ratio Analysis
7. (L.O. 2) A ratio expresses the mathematical relationship between one quantity and another as
either a percentage, rate, or proportion. Ratios can be classified as:
a. Liquidity ratios—measures of the short-term debt-paying ability.
b. Profitability ratios—measures of the income or operating success of a company for a given
period of time.
c. Solvency ratios—measures of the ability of the company to survive over a long period of time.
8. There are four liquidity ratios: the current ratio, the acid-test ratio, accounts receivable turnover,
and inventory turnover.
9. The current ratio expresses the relationship of current assets to current liabilities. It is a widely
used measure for evaluating a company’s liquidity and short–term debt paying ability. The formula
for this ratio is:
Current Ratio
=
Current Assets
Current Liabilities
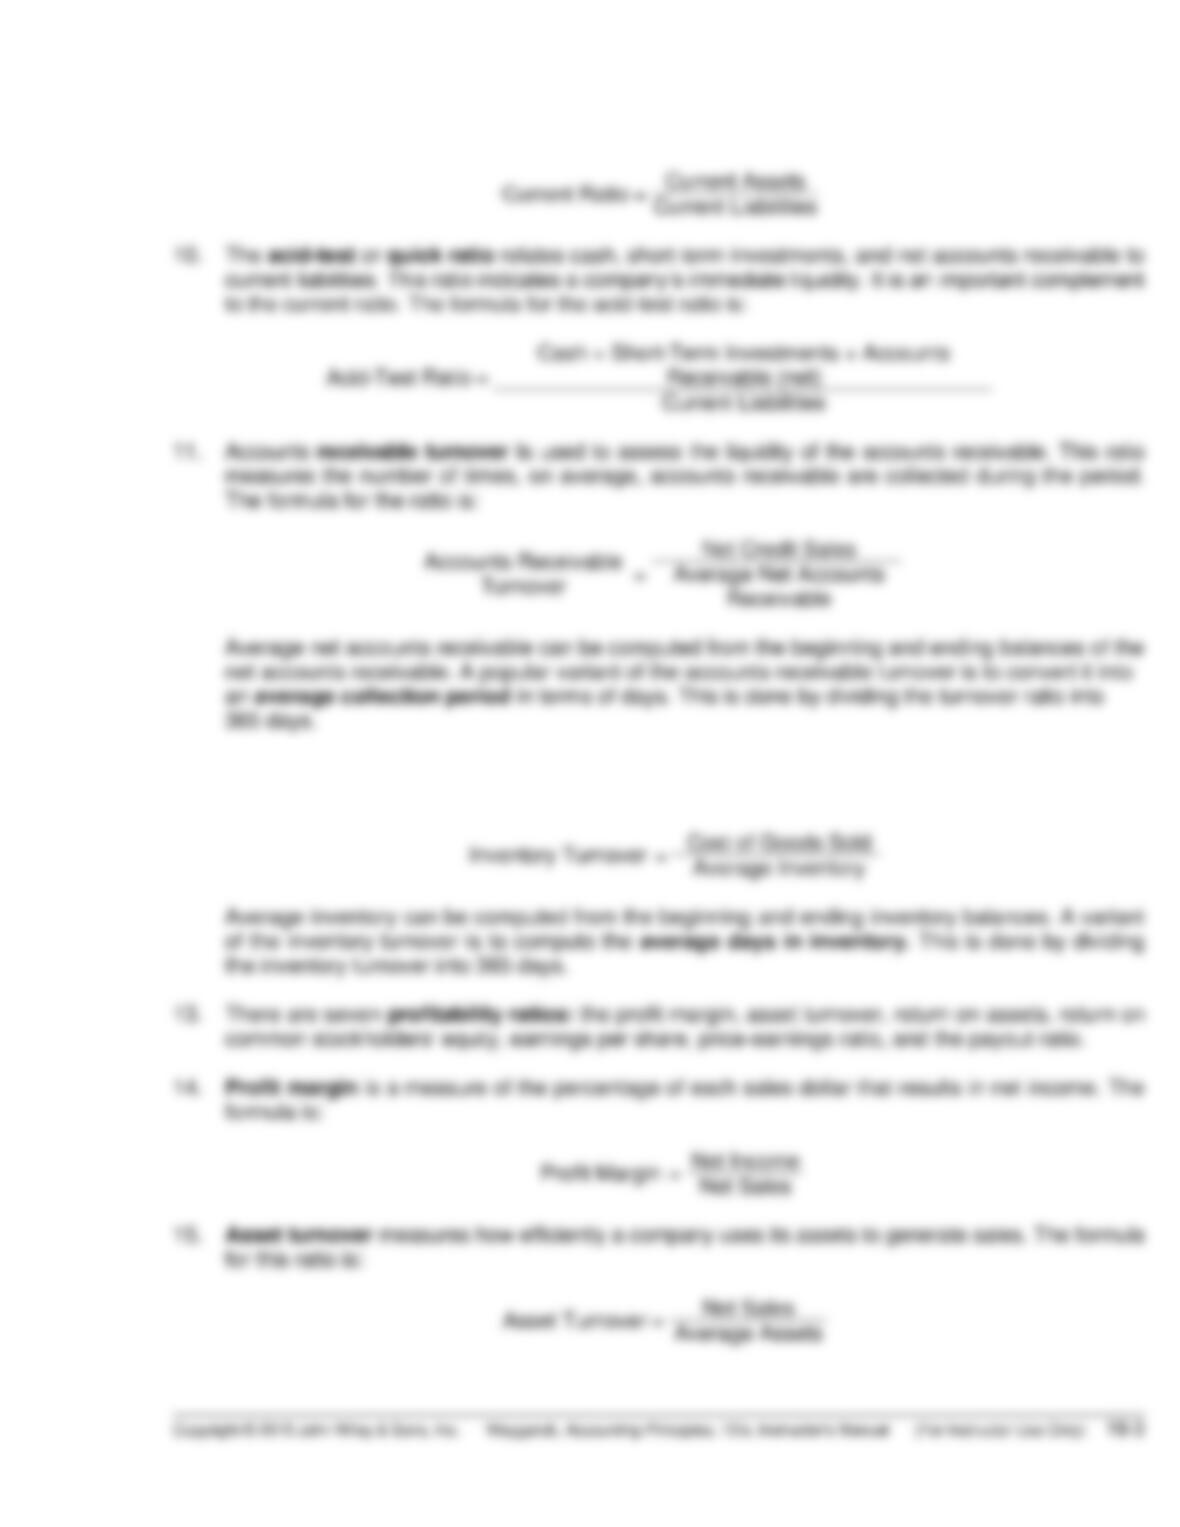
10. The acid-test or quick ratio relates cash, short-term investments, and net accounts receivable to
current liabilities. This ratio indicates a company’s immediate liquidity. It is an important complement
to the current ratio. The formula for the acid-test ratio is:
Acid-Test Ratio
=
Cash + Short-Term Investments + Accounts
Receivable (net)
Current Liabilities
11. Accounts receivable turnover is used to assess the liquidity of the accounts receivable. This ratio
measures the number of times, on average, accounts receivable are collected during the period.
The formula for the ratio is:
Accounts Receivable
Turnover
=
Net Credit Sales
Average Net Accounts
Receivable
Average net accounts receivable can be computed from the beginning and ending balances of the
net accounts receivable. A popular variant of the accounts receivable turnover is to convert it into
an average collection period in terms of days. This is done by dividing the turnover ratio into
365 days.
12. Inventory turnover measures the number of times, on average, the inventory is sold during the
period. It indicates the liquidity of the inventory. The formula for the ratio is:
Inventory Turnover
=
Cost of Goods Sold
Average Inventory
Average inventory can be computed from the beginning and ending inventory balances. A variant
of the inventory turnover is to compute the average days in inventory. This is done by dividing
the inventory turnover into 365 days.
13. There are seven profitability ratios: the profit margin, asset turnover, return on assets, return on
common stockholders’ equity, earnings per share, price-earnings ratio, and the payout ratio.
14. Profit margin is a measure of the percentage of each sales dollar that results in net income. The
formula is:
Profit Margin
=
Net Income
Net Sales
15. Asset turnover measures how efficiently a company uses its assets to generate sales. The formula
for this ratio is:
Asset Turnover
=
Net Sales
Average Assets
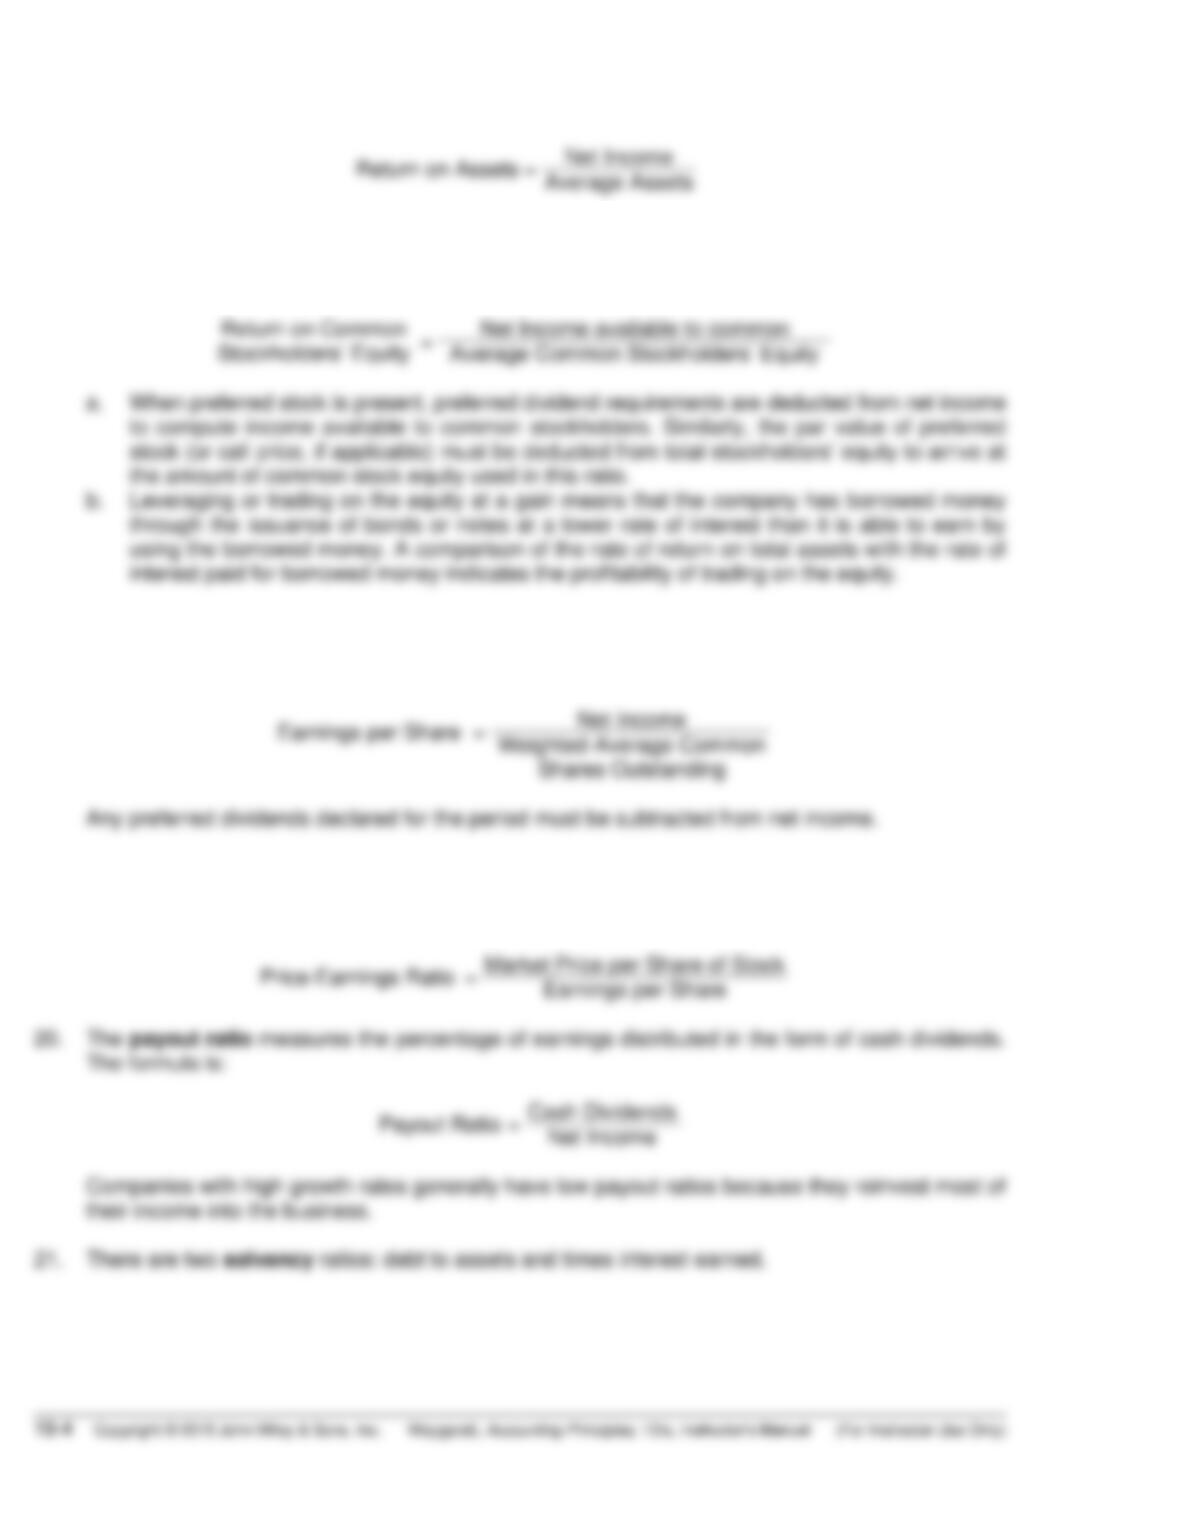
16. Return on assets is an overall measure of profitability. It measures the rate of return on each dollar
invested in assets. The formula is:
Return on Assets
=
Net Income
Average Assets
17. Return on common stockholders’ equity measures profitability from the common stockholders’
viewpoint. The ratio shows the dollars of income earned for each dollar invested by the owners.
The formula is:
Return on Common
Stockholders’ Equity
=
Net Income available to common
Average Common Stockholders’ Equity
a. When preferred stock is present, preferred dividend requirements are deducted from net income
to compute income available to common stockholders. Similarly, the par value of preferred
stock (or call price, if applicable) must be deducted from total stockholders’ equity to arrive at
the amount of common stock equity used in this ratio.
18. Earnings per share measures the amount of net income earned on each share of common stock.
The formula is:
Earnings per Share
=
Net Income
Weighted-Average Common
Shares Outstanding
Any preferred dividends declared for the period must be subtracted from net income.
19. The price-earnings ratio measures the ratio of market price per share of common stock to earnings
per share. It is an oft-quoted statistic that reflects investors’ assessments of a company’s future
earnings. The formula for the ratio is:
Price-Earnings Ratio
=
Market Price per Share of Stock
Earnings per Share
20. The payout ratio measures the percentage of earnings distributed in the form of cash dividends.
The formula is:
Payout Ratio
=
Cash Dividends
Net Income
Companies with high growth rates generally have low payout ratios because they reinvest most of
their income into the business.
21. There are two solvency ratios: debt to assets and times interest earned.
22. The debt to assets ratio measures the percentage of total assets provided by creditors. The
formula for this ratio is:
Debt to Assets
=
Debt
Assets
The adequacy of this ratio is often judged in the light of the company’s earnings. Companies with
relatively stable earnings, such as public utilities, have higher debt to assets ratios than cyclical
companies with widely fluctuating earnings, such as many high-tech companies.
23. Times interest earned measures a company’s ability to meet interest payments as they come
due. The formula is:
Times Interest
Earned
=
Income before Income Taxes
and Interest Expense
Interest Expense
Discontinued Operations
24. Discontinued operations refers to the disposal of a significant component of a business, such as
eliminating an entire activity or eliminating a major class of customers.
a. When the disposal occurs, the income statement should report both income from continuing
operations and income (loss) from discontinued operations.
b. The income (loss) from discontinued operations consists of (1) income (loss) from operations
and (2) gain (loss) on disposal of the component.
c. Both components are reported net of applicable taxes in a section entitled Discontinued
Operations, which follows income from continuing operations.
Extraordinary Items
25. Extraordinary items are events and transactions that meet two conditions: (a) unusual in nature
and (b) infrequent in occurrence.
a. To be “unusual,” the item should be abnormal and only incidentally related to customary
activities of the entity.
b. To be “infrequent,” the item should not be reasonably expected to recur in the foreseeable
future.
c. Extraordinary items are reported net of taxes in a separate section of the income statement
immediately below discontinued operations.
Changes in Accounting Principle
26. A change in an accounting principle occurs when the principle used in the current year is different
from the one used in the preceding year. Companies report most changes in accounting principle
retroactively. That is, they report both the current period and previous periods using the new principle.
Income Statement with Irregular Items
27. A partial income statement showing the additional sections and the material items not typical of
regular operations is as follows:
Income Statement (partial)
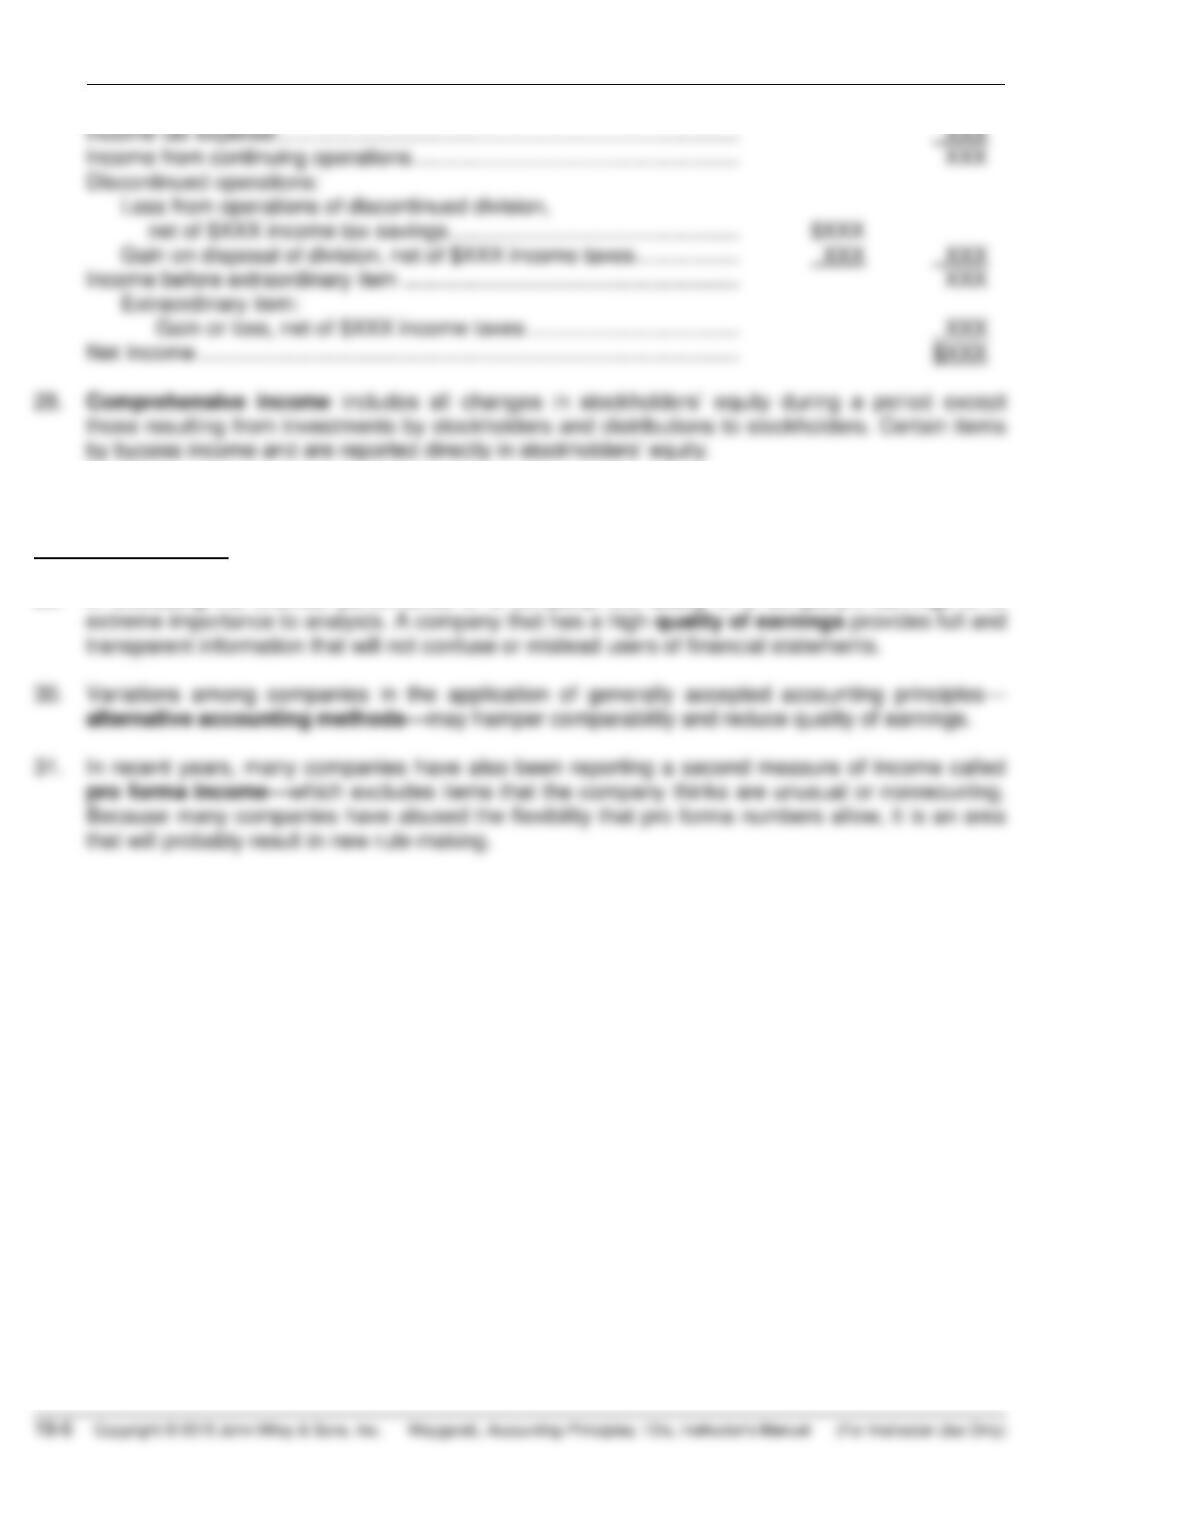
Income before income taxes ………………………………………………………. $XXX
Income tax expense ………………………………………………………………….. XXX
Income from continuing operations ……………………………………………… XXX
Discontinued operations:
Loss from operations of discontinued division,
net of $XXX income tax savings ………………………………………… $XXX
Gain on disposal of division, net of $XXX income taxes …………….. XXX XXX
Income before extraordinary item ……………………………………………….. XXX
Extraordinary item:
Gain or loss, net of $XXX income taxes …………………………….. XXX
Net Income ……………………………………………………………………………… $XXX
28. Comprehensive income includes all changes in stockholders’ equity during a period except
those resulting from investments by stockholders and distributions to stockholders. Certain items
by bypass income and are reported directly in stockholders’ equity.
NOTE – AUTHORS NEED TO CHANGE THIS SECTION TO SUSTAINABLE INCOME
Quality of Earnings
29. In evaluating the financial performance of a company, the quality of a company’s earnings is of
extreme importance to analysts. A company that has a high quality of earnings provides full and
transparent information that will not confuse or mislead users of financial statements.
30. Variations among companies in the application of generally accepted accounting principles—
alternative accounting methods—may hamper comparability and reduce quality of earnings.
31. In recent years, many companies have also been reporting a second measure of income called
pro forma income—which excludes items that the company thinks are unusual or nonrecurring.
Because many companies have abused the flexibility that pro forma numbers allow, it is an area
that will probably result in new rule-making.
LECTURE OUTLINE
A. Basics of Financial Statement Analysis.
1. Analyzing financial statements involves evaluating three characteristics:
a company’s liquidity, profitability, and solvency.
a. A short-term creditor (a bank) is primarily interested in liquidity—the
ability of the borrower to pay obligations when they come due.
b. A long–term creditor (a bondholder) looks to profitability and solvency
measures that indicate the company’s ability to survive over a long
period of time.
c. Stockholders look at the profitability and solvency of the company.
They want to assess the likelihood of dividends and the growth
potential of the stock.
2. Comparison of financial information can be made on a number of different
bases.
a. Intracompany basis: compares an item or financial relationship within
a company in the current year with the same item or relationship in
prior years.
b. Industry averages: compares an item or financial relationship of
a company with industry averages (norms) published by Dun &
Bradstreet, Moody’s, and Standard & Poor’s.
c. Intercompany basis: compares an item or financial relationship of
one company with the same item or relationship in one or more
competing companies.
B. Tools of Financial Statement Analysis.
1. Horizontal analysis (trend analysis) is a technique for evaluating a series
of financial statement data over a period of time to determine the increase
or decrease that has taken place, expressed as either an amount or a
percentage.
2. Vertical analysis (common-size analysis) is a technique that expresses
each financial statement item as a percentage of a base amount. A
benefit of vertical analysis is that it enables one to compare companies
of
different sizes.
3. Ratio analysis expresses the relationship among selected items of finan–
cial statement data. The relationship is expressed in terms of either a
percentage, a rate, or a simple proportion.
4. Ratios can be classified as follows:
a. Liquidity ratios: measure the short-term ability of the company to
pay its maturing obligations and to meet unexpected needs for
cash.
b. Profitability ratios: measure the income or operating success of a
company for a given period of time.
c. Solvency ratios: measure the ability of a company to survive over a
long period of time.
5. Liquidity ratios.
a. The current ratio is a widely used measure for evaluating a company’s
liquidity and short-term debt paying ability. It is computed by dividing
current assets by current liabilities.
b. The acid-test (quick) ratio is a measure of a company’s immediate
short-term liquidity. This ratio is computed by dividing the sum of
cash, short–term investments, and net accounts receivable by current
liabilities.
c. Accounts receivable turnover is used to assess the liquidity of
accounts receivable. Companies compute this ratio by dividing net
credit sales by the average net accounts receivable during the year.
The average collection period in days is computed by dividing
accounts receivable turnover into 365 days.
d. Inventory turnover measures the number of times, on average, the
inventory was sold during the period. Companies compute the inven-
tory turnover by dividing cost of goods sold by the average inventory
during the year. The average days in inventory is computed by
dividing inventory turnover into 365 days.
6. Profitability ratios.
a. Profit margin is a measure of the percentage of each dollar of sales
that results in net income. It is computed by dividing net income by
net sales.
b. Asset turnover measures how efficiently a company uses its assets
to generate sales. It is computed by dividing net sales by average
assets.
c. An overall measure of profitability is return on assets. This ratio is
computed by dividing net income by average assets.
d. Return on common stockholders’ equity shows how many dollars of
net income the company earned for each dollar invested by the
owners. Companies compute it by dividing net income by average
common stockholders’ equity.
(1) When a company has preferred stock, it must deduct preferred
dividend requirements from net income to compute income
available to common stockholders.
(2) Companies deduct the par value of preferred stock (or call
price) from total stockholders’ equity to determine the amount
of common stock equity used in the denominator.
(3) Trading on the equity at a gain is borrowing money at a lower
rate of interest than can be earned by using the borrowed
money.
e. Earnings per share is a measure of the net income earned on each
share of common stock. It is computed by dividing net income by
the number of weighted-average common shares outstanding during
the year.
f. The price-earnings ratio is a measure of the ratio of the market
price of each share of common stock to the earnings per share. It is
computed by dividing the market price per share of the stock by
earnings per share.
g. The payout ratio measures the percentage of earnings distributed
in the form of cash dividends. Companies compute it by dividing
cash dividends by net income.
7. Solvency ratios.
a. The debt to assets ratio measures the percentage of the total
assets that creditors provide. It is computed by dividing debt (both
current and long-term liabilities) by assets.
C. Earning Power and Irregular Items.
Earning power means the normal level of income to be obtained in the future.
Irregular items include (a) discontinued operations, and (b) extraordinary items.
1. Discontinued operations refers to the disposal of a significant component
of a business. Examples involve stopping an entire activity or eliminating
a major class of customers.
a. The income (loss) from discontinued operations consists of the
income (loss) from operations and the gain (loss) on disposal of the
component.
b. The discontinued operations section reports both the operating
income (loss) and the gain (loss) on disposal net of applicable income
taxes.
2. Extraordinary items are events and transactions that are:
a. Unusual in nature.
b. Infrequent in occurrence.
(1) To be “unusual,” the item should be abnormal and only inciden–
tally related to the company’s customary activities.
(2) To be “infrequent,” the item should not be reasonably expected
to recur in the foreseeable future.
c. Companies report extraordinary items net of taxes in a separate
section of the income statement, immediately below discontinued
operations.
INVESTOR INSIGHT
Many companies incur restructuring charges as they attempt to reduce costs.
They often label these items in the income statement as “non–recurring” charges
to suggest that they are isolated events which are unlikely to occur in future
periods.
If a company takes a large restructuring charge, what is the effect on the
company’s current income statement versus future ones?
Answer: The current period’s net income can be greatly diminished by a large
restructuring charge, while the net income in future periods can be
enhanced because they are relieved of costs (i.e., depreciation and
labor expenses) that would have been charged to them.
4. Companies report most changes in accounting principle retroactively.
They report both the current period and previous periods using the new
principle.
5. Comprehensive income includes all changes in stockholders’ equity
during a period except those resulting from investments by stockholders
and distributions to stockholders.
D. Quality of Earnings.
1. In evaluating the financial performance of a company, the quality of a
company’s earnings is of extreme importance to analysts. A high quality
of earnings provides full and transparent information that will not confuse
or mislead users of the financial statements. Factors affecting quality of
earnings are:
a. Alternative accounting methods. Variations among companies in the
application of generally accepted accounting principles may hamper
comparability and reduce quality of earnings.
b. Improper recognition. Due to pressure from investors to continually
increase earnings, some managers have manipulated the earnings
numbers to meet these expectations. The most common abuse is
the improper recognition of revenue.
2. Pro forma income. Pro forma income usually excludes items that the
company thinks are unusual or non–recurring. Many analysts are critical of
using pro forma income because these numbers often make companies
look better than they really are.
IFRS
A Look at IFRS
The tools of financial statement analysis, covered in the first section of this
chapter, are the same throughout the world. Techniques such as vertical and
horizontal analysis, for example, are tools used by analysts regardless of
whether GAAP- or IFRS-related financial statements are being evaluated. In
addition, the ratios provided in the textbook are the same ones that are used
internationally.
The latter part of this chapter relates to the income statement and irregular
items. As in GAAP, the income statement is a required statement under IFRS. In
addition, the content and presentation of an IFRS income statement is similar to
the one used for GAAP. IAS 1 (revised), “Presentation of Financial Statements,”
provides general guidelines for the reporting of income statement information. In
general, the differences in the presentation of financial statement information are
relatively minor.
IFRS ADDITIONS TO THE TEXTBOOK
• The tools of financial statement analysis covered in this chapter are universal
and therefore no significant differences exist in the analysis methods used.
• The basic objectives of the income statement are the same under both GAAP
and IFRS. As indicated in the textbook, a very important objective is to ensure
that users of the income statement can evaluate the earning power of the
company. Earning power is the normal level of income to be obtained in the
future. Thus, both the IASB and the FASB are interested in distinguishing normal
levels of income from irregular items in order to better predict a company’s future
profitability.
• The basic accounting for discontinued operations is the same under IFRS and
GAAP.
• Under IFRS, there is no classification for extraordinary items. In other words,
extraordinary item treatment is prohibited under IFRS. All revenue and expense
items are considered ordinary in nature. Disclosure, however, is extensive for
items that are considered material to the financial results. Examples are write–
downs of inventory or plant assets, or gains and losses on the sale of plant
assets.
• The accounting for changes in accounting principles and changes in accounting
estimates are the same for both GAAP and IFRS.
LOOKING TO THE FUTURE
The FASB and the IASB are working on a project that would rework the structure
of financial statements. Recently, the IASB decided to require a statement of
comprehensive income, similar to what was required under GAAP. In addition,

20 MINUTE QUIZ
Circle the correct answer.
True/False
1. Intercompany comparison refers to comparison with other companies to provide insight
into competitive position.
True False
2. Vertical analysis determines the percentage increase or decrease that has taken place
over a period of time.
True False
3. A base year is determined when performing horizontal analysis.
True False
4. Liquidity ratios measure the ability of a company to survive over a long period of time.
True False
5. Accounts receivable turnover, inventory turnover, and asset turnover are all common
measures of liquidity.
True False
6. Profit margin, return on assets, and return on common stockholders’ equity are profitability
ratios.
True False
7. The formula for computing times interest earned is income before income taxes and
interest expense divided by interest expense.
True False
8. The debt to assets ratio measures the percentage of total assets provided by long-term
creditors.
True False
9. Extraordinary gains and losses should be disclosed in the income statement immediately
below discontinued operations net of taxes.
True False
10. To compute pro forma income, companies generally can exclude any items they deem
inappropriate for measuring their performance.
True False

Multiple Choice
1. Sales (in millions) for a three year period are: Year 1 $6, Year 2 $6.9, and Year 3 $7.5.
Using Year 1 as the base year the percentage increase in sales in Years 2 and 3 are,
respectively
a. 115% and 125%.
b. 115% and 109%.
c. 115% and 130%.
d. 87% and 80%.
2. An incorrect formula is
a. current ratio = current assets ÷ current liabilities.
b. accounts receivable turnover = net credit sales ÷ average net accounts receivable.
c. asset turnover = net income ÷ average assets.
d. payout ratio = cash dividends ÷ net income.
3. The acid-test ratio
a. is a solvency ratio.
b. measures immediate short-term liquidity.
c. includes inventory in the numerator of the formula.
d. includes total liabilities in the denominator of the formula.
4. The ratio that measures the overall profitability of assets is
a. profit margin.
b. asset turnover.
c. return on common stockholders’ equity.
d. return on assets.
5. Which of the following would least likely be considered an extraordinary item?
a. Loss from fire destruction.
b. Loss from meteorite destruction.
c. Gain on sale of company vehicle.
d. Gain on property taken over by a foreign government.

ANSWERS TO QUIZ
True/False
1. True 6. True
2. False 7. True
Multiple Choice
1. a.
2. c.