Unlock document.
This document is partially blurred.
Unlock all pages and 1 million more documents.
Get Access
18–1
Chapter 18
Performance Measurement to
Support Business Strategy
Learning Objectives
1. Explain why management accountants should know the business strategy of their
organization.
2. Explain why companies use nonfinancial performance measures.
3. Understand the reasons why performance measures differ across levels of the organization.
4. Understand how the balanced scorecard helps organizations recognize and deal with their
conflicting responsibilities.
5. Understand how to apply the methods involved in an effective performance measurement
system.
18–2
Chapter Overview
I. EXPLAIN WHY MANAGEMENT ACCOUNTANTS SHOULD KNOW THE
BUSINESS STRATEGY OF THEIR ORGANIZATION
III. BEYOND THE ACCOUNTING NUMBERS
IV. RESPONSIBILITIES ACCORDING TO LEVEL OF ORGANIZATION
V. BUSINESS MODEL
VI. MULTIPLE MEASURES OR A SINGLE MEASURE OF PERFORMANCE?
• Balanced Scorecard
• Continuous Improvement and Benchmarking
VII. PERFORMANCE MEASUREMENT FOR CONTROL
VIII. SOME COMMON NONFINANCIAL PERFORMANCE MEASURES
• Customer Satisfaction Performance Measures
o Quality Control
o Delivery Performance
o Bookings and Purchase Orders
o Market Share
• Functional Performance Measures
o Manufacturing Cycle Time
IX. EMPLOYEE INVOLVEMENT
X. DIFFICULTIES IN IMPLEMENTING NONFINANCIAL PERFORMANCE
MEASUREMENT SYSTEMS
• Fixation on Financial Measures
• Reliability of Nonfinancial Measures
• Lack of Correlation Between Nonfinancial Measures and Financial Results
18–3
Chapter Outline
LO 18-1 Explain why management accountants should know the business
strategy of their organization.
EXPLAIN WHY MANAGEMENT ACCOUNTANTS SHOULD KNOW THE BUSINESS
STRATEGY OF THEIR ORGANIZATION
• The performance measures that accountants develop must tie directly to concepts in strategy
and organizational behavior.
o We have to know what kind of performance adds value to the company.
▪ We define business strategy as a company’s specific approach for deploying the
organizational assets and capabilities required to meet its customers’ needs competi-
tively, while delivering the desired returns to stakeholders.
• Stakeholders are groups or individuals who have an interest in what the
organization does.
o The business strategy identifies the firm’s value proposition.
▪ The firm’s value proposition is how the organization will create value for all
stakeholders.
▪ This statement may also imply the firm’s mission.
THE FOUNDATION OF A SUCCESSFUL BUSINESS STRATEGY
• Managers start forming strategy by identifying the company’s core assets and capabilities.
18–4
O Core resources and capabilities are those things that, if used well, can make the company
very successful.
• Porter Framework
o Of many frameworks for thinking about strategy, we present one of the most popular by a
scholar named Michael E. Porter.
▪ Porter identified three types of companies that are successful. They are:
• Cost leaders
• Product differentiators
• Focused competitors
o Cost Leaders
▪ Cost leaders have a high-volume production of an undifferentiated product, called a
commodity.
o Product Differentiation
▪ The product differentiator earns a premium price for a product with unique features.
• While there may be fewer customers who value these features, those who do are
willing to pay more for them and are not easily tempted to buy a cheaper product.
• Companies that use this strategy obtain profits by earning large margins.
18–5
• Product differentiators must develop products that customers value.
To do so, they use measures of marketing performance and the balanced
scorecard, discussed later in this chapter.
o Focused Competitors
▪ The focus strategy (also called a niche strategy or segmentation strategy) requires a
company to select a narrow segment of customers or products and apply a
combination of the cost leader and product differentiation strategies.
LO 18-2 Explain why companies use nonfinancial performance measures.
BEYOND THE ACCOUNTING NUMBERS
• Financial performance measures, especially those that come from the company’s accounting
systems, are commonly used to evaluate employee performance.
o Financial performance measures are easily quantifiable and can motivate employees to
improve the company’s accounting profits.
▪ Financial measures are good at getting managers’ attention.
o Financial measures suffer from several flaws that reduce their value as an operational
control device.
▪ They are not useful in identifying operational problems.
18–6
o In recent years, more and more companies have begun using nonfinancial metrics
because:
▪ Nonfinancial performance measures direct employees’ attention to those things that
the employees can control.
LO 18-3 Understand the reasons why performance measures differ across
levels of the organization.
RESPONSIBILITIES ACCORDING TO LEVEL OF ORGANIZATION
• Effective performance measurement is based on two factors:
• Effective performance measurement systems use measures that emphasize different things at
different levels of the organization.
o In general, performance measures should relate to what people at different levels control.
▪ At the lower levels in the organization, nonfinancial performance measures focus on
factors these employees can control, such as:
• Customer satisfaction (for those dealing with customers directly).
• Product quality (for those in production).
18–7
• The following are some of the nonfinancial performance measures that
organizations use to evaluate middle managers’ performance:
Amount of unwanted employee turnover.
• At middle levels in organizations, coordination and improvement of ongoing
activities take place in addition to redesigning products and processes.
BUSINESS MODEL
• A business model is a description of how different levels and employees in the organization
must perform for the organization to achieve its goals.
o A business model is a framework that links the roles of various employees and levels in
the organization and that illustrates how the successful completion of these roles will
result in achievement of the organization’s goals.
o For a given strategy and environment, many possible business models could be
appropriate.
▪ Example 1: The business model for an investment firm describes how a profitable
branch operates in the retail investment business. The branch manager exercises
leadership to motivate and satisfy employees.
18–8
LO 18-4 Understand how the balanced scorecard helps organizations
recognize and deal with their conflicting responsibilities.
MULTIPLE MEASURES OR A SINGLE MEASURE OF PERFORMANCE?
• Balanced Scorecard
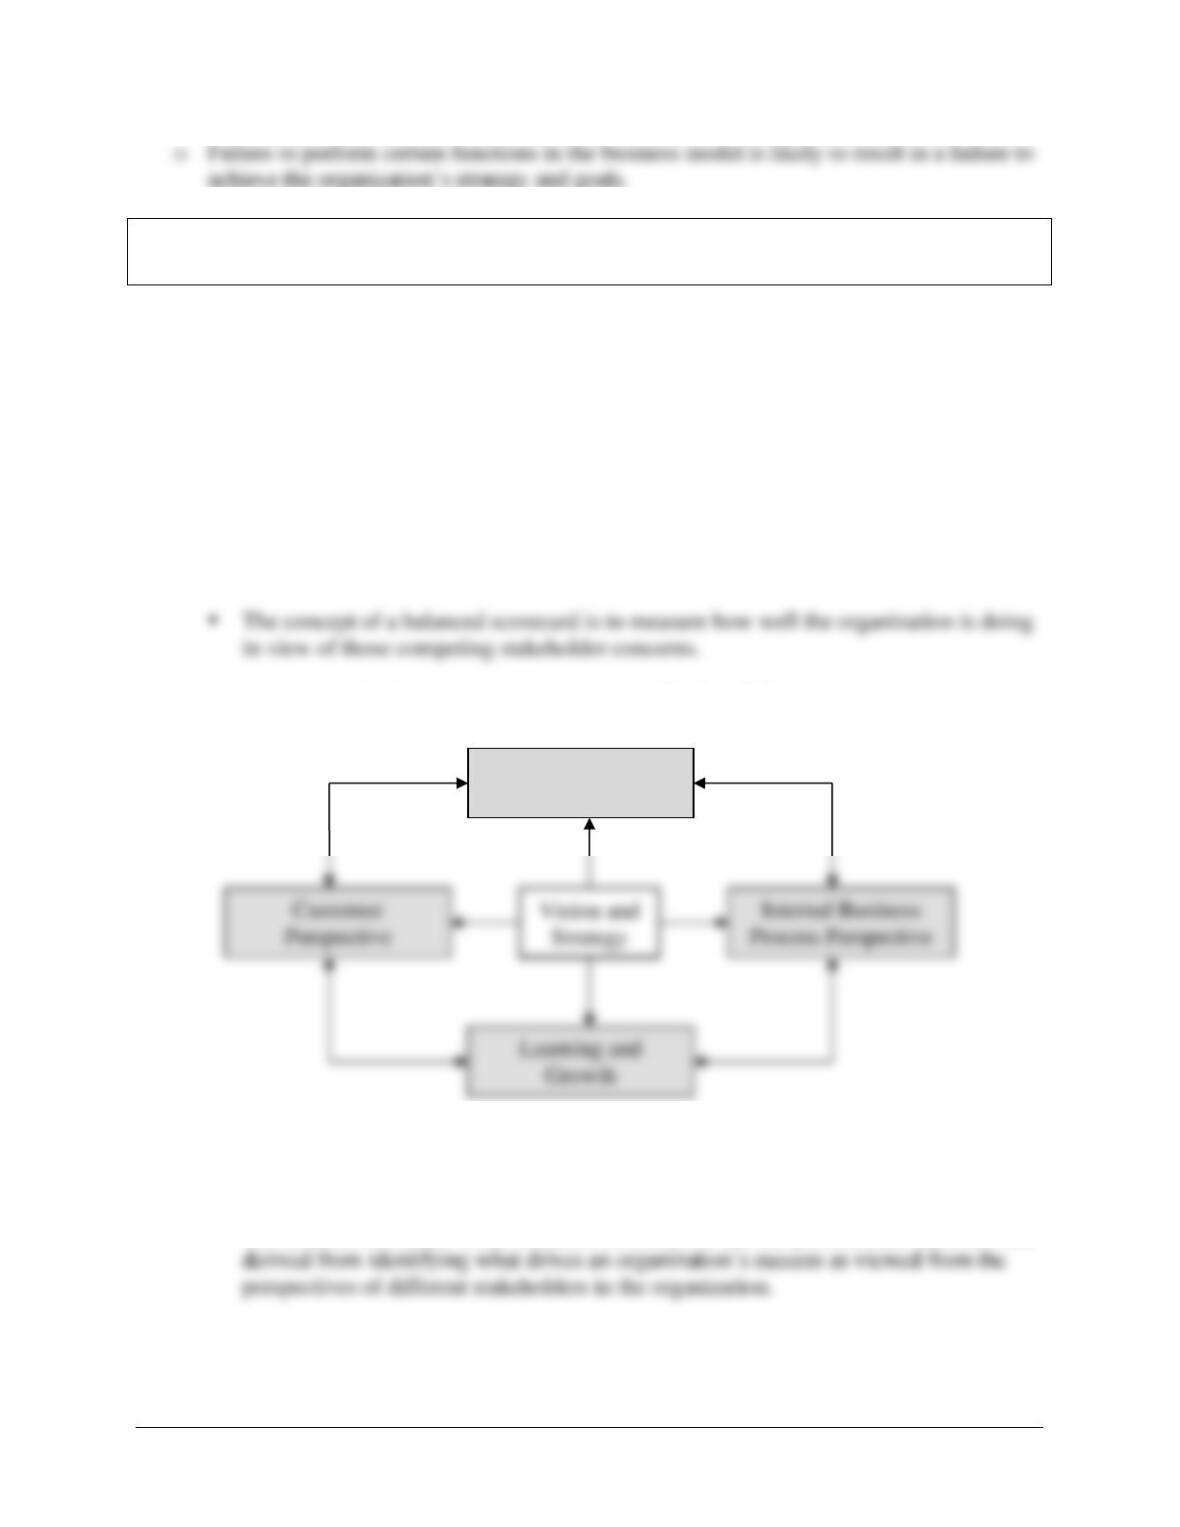
o One structured approach to implementing a set of performance measures is the balanced
scorecard, which is a set of performance targets and results that show how well an
organization has performed in meeting its objectives relating to its stakeholders.
▪ A balanced scorecard is a management tool that recognizes organizational
responsibility to different stakeholder groups.
o An example of a balanced scorecard is shown in Exhibit 18.2.
o The focus of the balanced scorecard is to balance the efforts of the organization in
meeting its financial, customer, process, and innovative responsibilities.
▪ The distinctive feature of the balanced scorecard is that the performance measures are
Financial
Perspective
Perspective
18–9
o The balanced scorecard has four views or perspectives:
▪ Financial: To succeed financially, how should we appeal to our shareholders?
o A balanced scorecard for any particular organization could be based on any other
perspectives if they are important for the organization’s success.
▪ Within each perspective, the scorecard identifies the goals, or objectives, for the
organization as often shaped by the competitive environment.
• A select list of organizations using the balanced scorecard is in Exhibit 18.3.
o The balanced scorecard primarily has been used at the top management level to support
the organization’s development of strategies.
18–10
▪ A typical development of the balanced scorecard may involve the following:
Step1: A company’s top executives form a team to clarify the company’s strategy
and objectives to meet responsibilities.
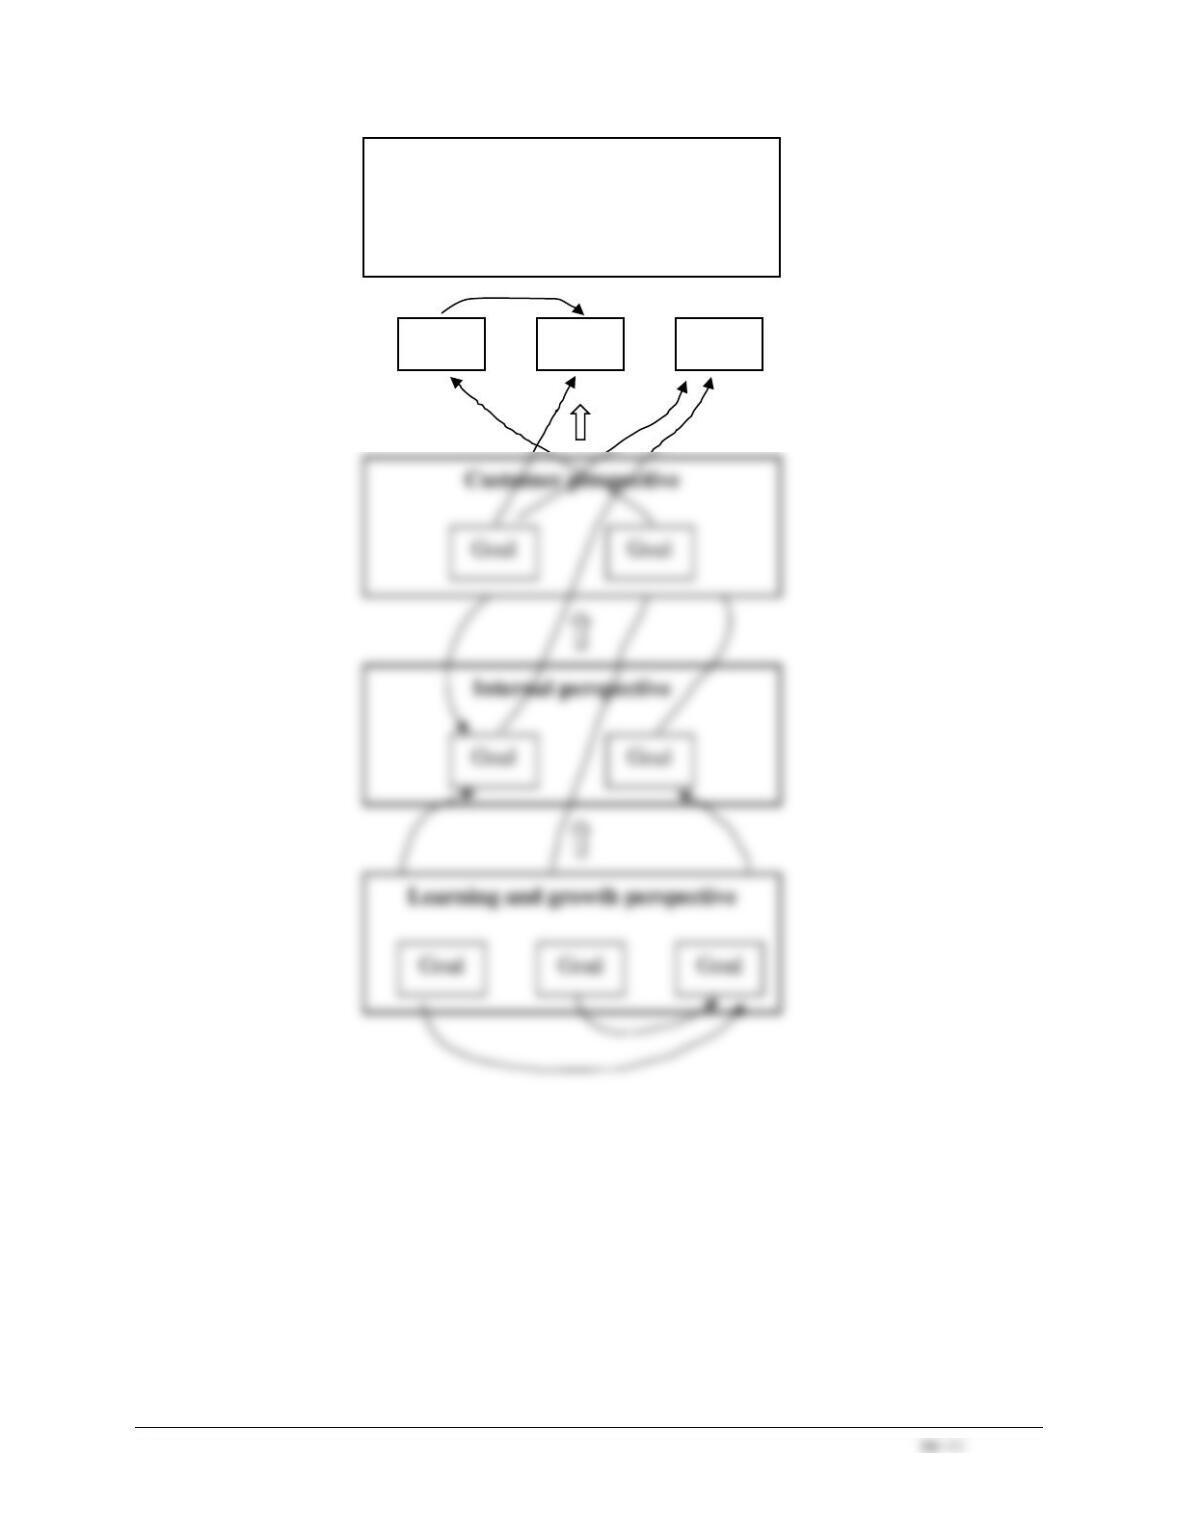
o A company’s strategy, as illustrated in the business model, can be linked to the balanced
scorecard through a strategy map, as shown in Exhibit 18.5. Specifically, the strategy
map links the objectives or goals in each of the perspectives.
▪ By drawing the strategy map, a company can determine if it is missing measures in
any of the perspectives or if it has goals that do not seem to be linked to other parts of
the map.
Financial perspective
Goal
Goal
Goal
18–12
LO 18-5 Understand how to apply the methods involved in an effective
performance measurement system.
• Continuous Improvement and Benchmarking
o Performance measurement is useful not only for evaluation, but also for control.
▪ Continuous improvement means the continuous reevaluation and improvement of
the efficiency of an organization’s activities.
• Continuous improvement is a philosophy that seeks to:
Improve the activities in which the organization engages through
documentation and understanding,
▪ Benchmarking involves continuously identifying an activity that needs to be
improved, finding an organization (sometimes in one’s own organization) that is the
most efficient in performing the activity, studying its process, and then utilizing that
process.
• Benchmarks are used to evaluate the performance of an activity, operation, or
organization relative to its performance by other companies.
• Important guidelines for benchmarking include:
18–13
PERFORMANCE MEASUREMENT FOR CONTROL
• Companies develop multiple performance measures as a way to evaluate the achievement of
its managers.
LO 18-6 Identify examples of nonfinancial performance measures and discuss
the potential for improved performance resulting from improved
activity management.
SOME COMMON NONFINANCIAL PERFORMANCE MEASURES
• Customer Satisfaction Performance Measures
o Quality Control
▪ Objective of quality control is to increase customer satisfaction with the product,
reduce the costs of dealing with customer complaints, and reduce the costs of
repairing products or providing a new service.
▪ Measures include:
o Delivery Performance
▪ The objective of delivery performance is to deliver goods and services when
promised.
18–14
o Bookings and Purchase Orders
▪ Bookings and purchase orders are a lead indicator of revenues.
o Market Share
▪ Market share must be measured relative to market size (i.e., its growth).
• Functional Performance Measures
o An organization must evaluate its internal functional process performance while serving
external customers. (See Business Application box “Loyal Customers Might Not Be
Profitable.”)
o Manufacturing Cycle Time
▪ Manufacturing cycle time represents the time involved in processing, moving,
storing, and inspecting products and materials. It is the total time taken to produce a
good or service.
18–15
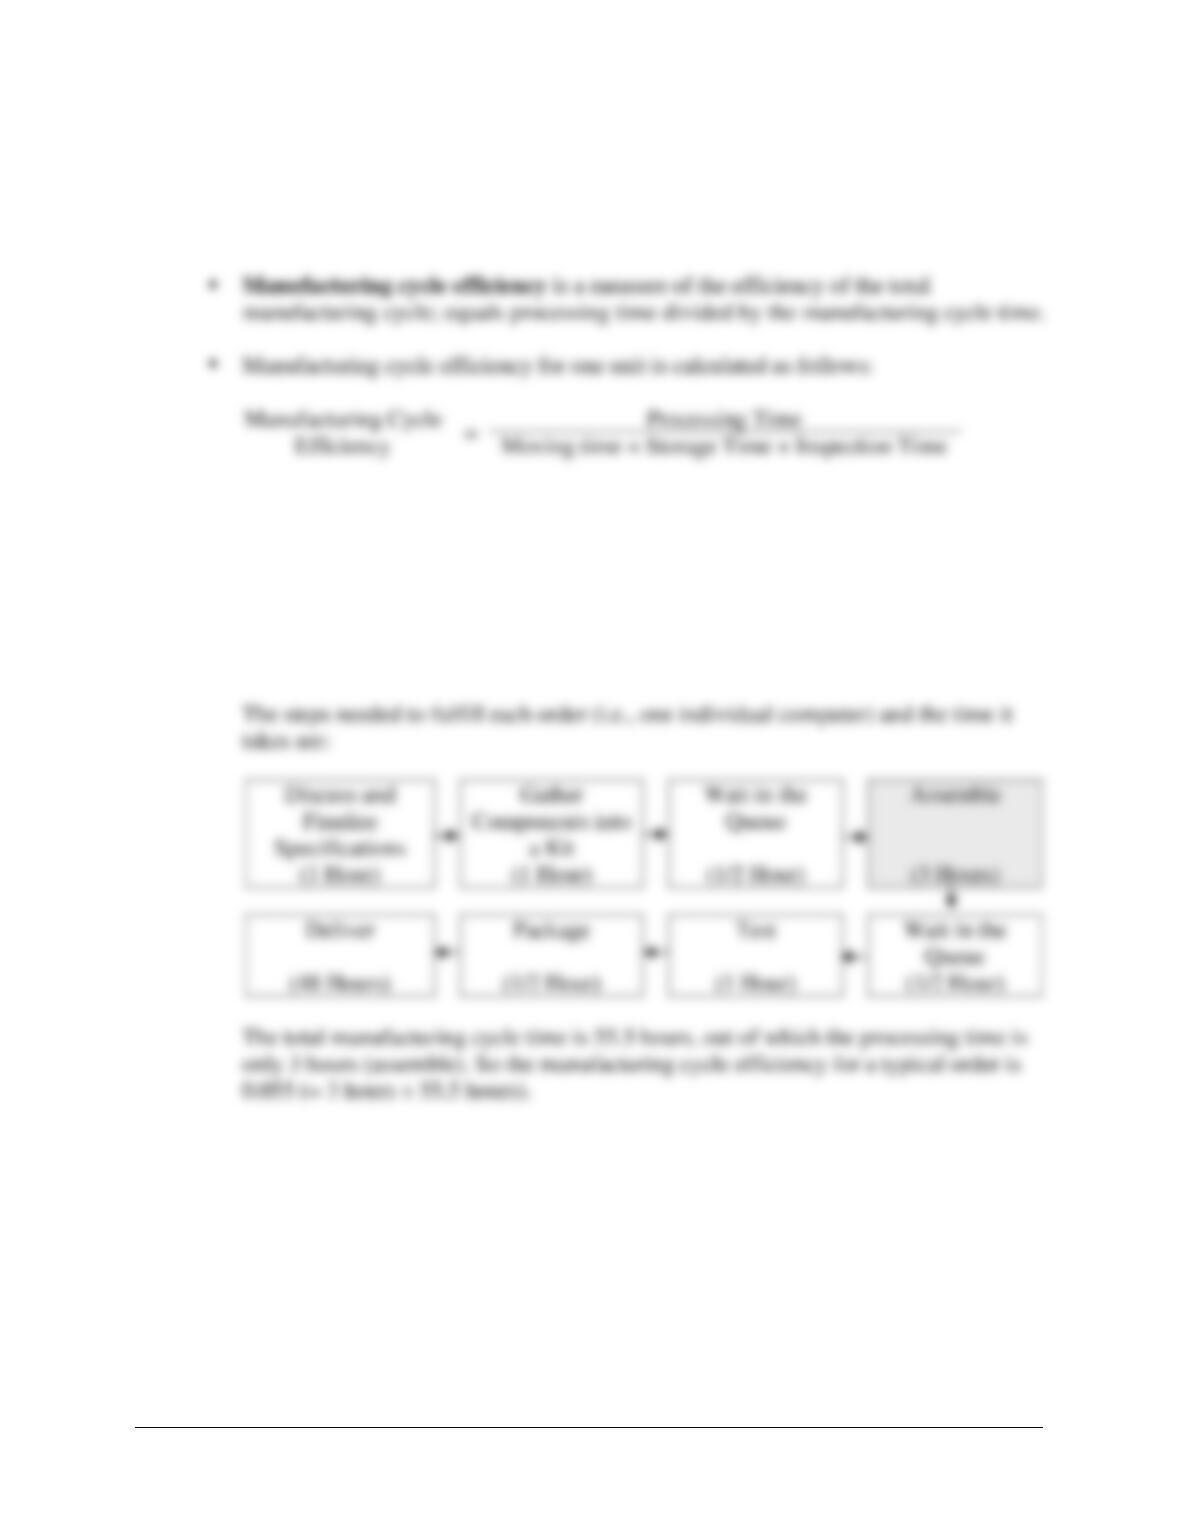
o Manufacturing Cycle Efficiency
▪ Manufacturing cycle efficiency measures the efficiency of the total manufacturing
cycle.
• This formula calculates a percentage representing the time actually spent
processing the unit. The higher the percentage, the less the time (and costs) that
needs to be spent on nonvalue-added activities.
▪ Example 3: Tom operates a computer store that accepts custom orders for desktop
computers. Customers can choose from a variety of components such as
motherboards, CPUs, hard drives, DRAMs, graphics cards, sound cards, etc.
18–16
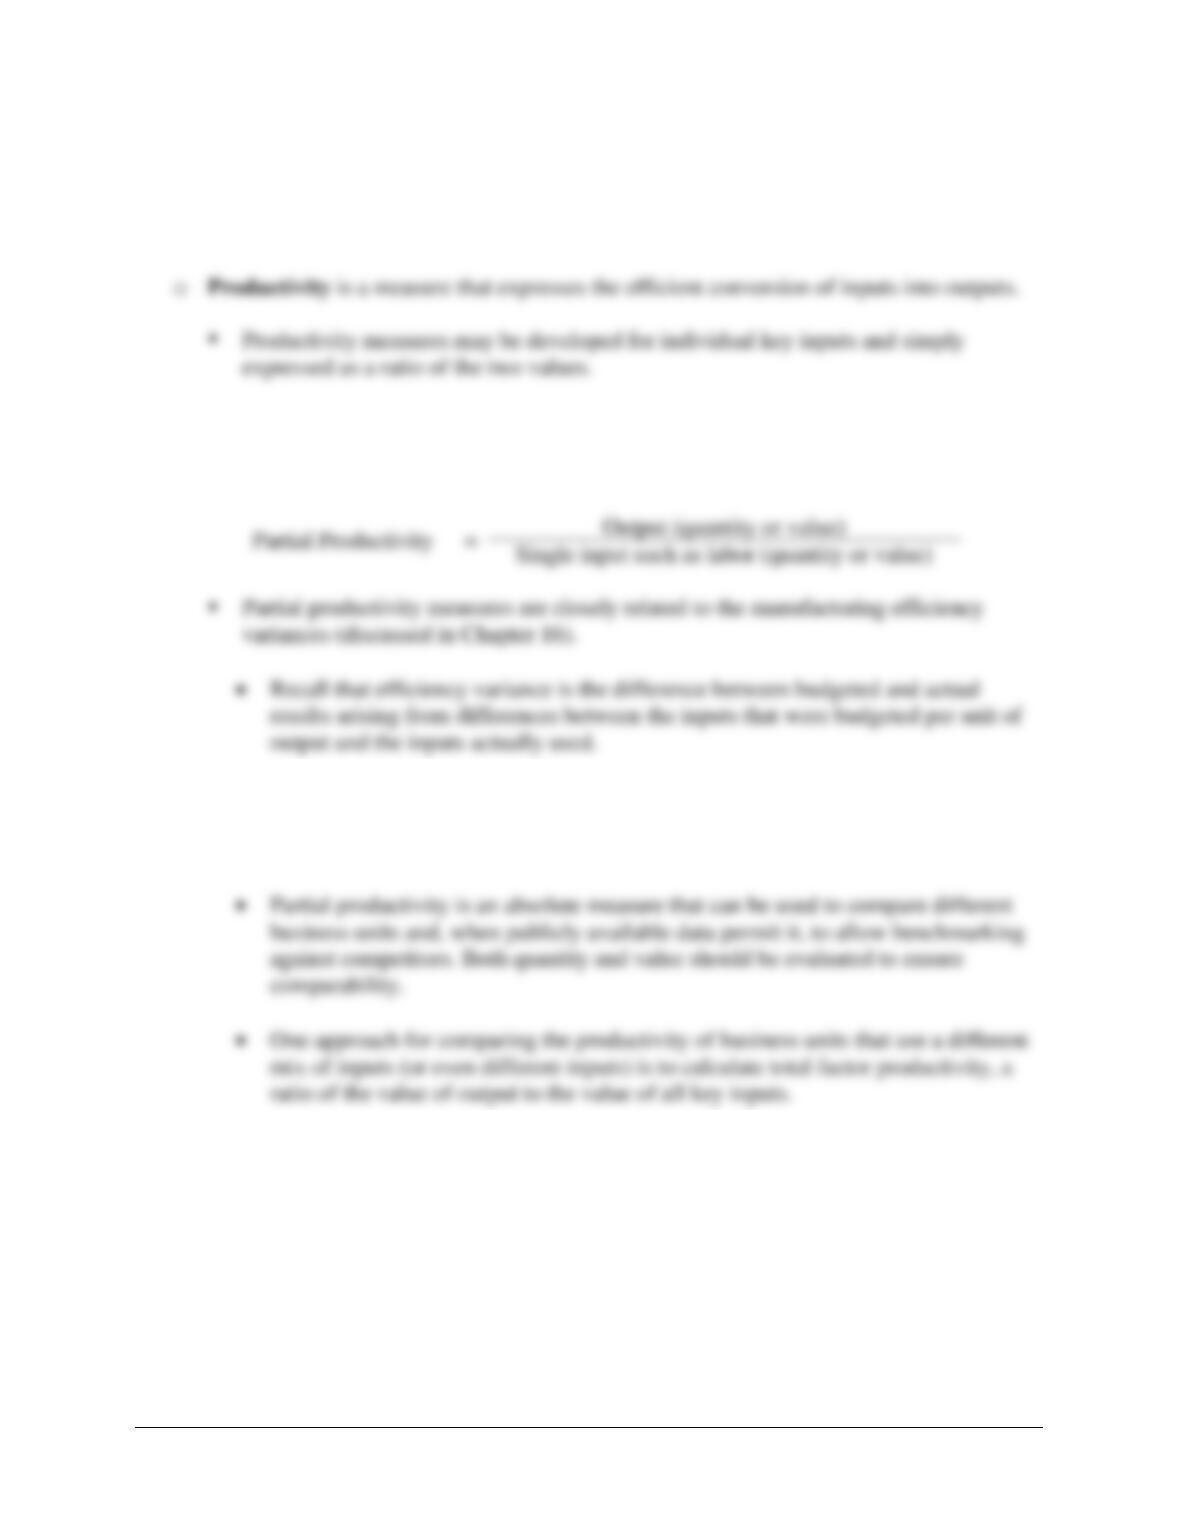
• Productivity
o Manufacturing cycle efficiency focuses on the effective use of time. Productivity focuses
on the efficient conversion of inputs into outputs.
o Partial productivity measures the relation between output and a single input, or
▪ Partial productivity measures are typically measured as:
• The efficiency variance is a good basis for assessing how a manufacturing plant is
doing as compared to engineering standards; if these standards do not change over
time, they are also a basis for assessing whether the plant is improving.
o One approach for comparing the productivity of business units that use a different mix of
inputs (or even different inputs) is to calculate total factor productivity.
▪ Total factor productivity is a ratio of the value of output to the value of all key
inputs.
18–17
o An Illustration of Various Productivity Measures
▪ Exhibit 18.8 provides selected operating data.
▪ Exhibit 18.9 provides the results. See Demonstration Problem
• Nonfinancial Performance and Activity-Based Management
o Organizations should manage by using activity data rather than cost data to identify
problems, to suggest an approach to solve problems, and to prioritize improvement
efforts.
▪ Organizations find value in knowing the amount of time it takes to complete a
sequence of activities.
▪ Companies often make four mistakes when trying to measure nonfinancial
performance.
• Not linking measures to strategy.
• Objective ad Subjective Performance Measures
o Objective performance measures are such that different people can look at them and
agree that the method used to calculate the measure is correct, even though the choice of
the measures is in dispute.
18–18
LO 18-7 Explain why employee involvement is important in an effective
performance measurement system.
EMPLOYEE INVOLVEMENT
• Nonfinancial measures have the advantage that they are more likely to be understandable by
employees directly involved in operations.
o The measures used to evaluate performance reflect each unit’s understanding of its
contribution to the organization.
o Worker involvement is important for three reasons:
▪ When workers take on real decision-making authority, their commitment to the
organization and its objectives increases.
▪ When decision-making responsibility lies with workers closer to the customer,
workers are more responsive to customer concerns and can make informed decisions.
o Companies need to evaluate their own performance in getting workers involved and
committed.
▪ Exhibit 18.10 lists performance measures that organizations can use to assess their
accomplishments in terms of worker involvement and commitment.
18–19
o Worker involvement and commitment measures include:
▪ Worker development (percentage of workers in mentor programs),
▪ Worker empowerment (percentage of workers authorized to issue credit),
o Increasing the percentages on these measures demonstrate the organization’s attempt to
increase worker involvement and commitment to it.
o Effective worker involvement presents three challenges for management.
▪ Management must create a system that conveys the organization’s objectives and
critical success factors to all members.
18–20
DIFFICULTIES IN IMPLEMENTING NONFINANCIAL PERFORMANCE
MEASUREMENT SYSTEMS
• Fixation on Financial Measures
o A strong fixation on financial measures works against effective use of nonfinancial
performance measures.
• Reliability of Nonfinancial Measures
18–21
Matching
A.
Balanced scorecard
I.
Mission statement
B.
Benchmarking
J.
Partial productivity
C.
Business model
K.
Productivity
D.
Business strategy
L.
Stakeholders
E.
Continuous improvement
M.
Strategy map
F.
Manufacturing cycle efficiency
N.
Total factor productivity
G.
Manufacturing cycle time
O.
Value proposition
H.
Mission
_____ 1. Description of how different levels and employees in the organization must perform
for the organization to achieve its goals.
_____ 2. Why an organization exists; its purpose and goals..
_____ 3. Description of an organization’s values, definition of its responsibilities to
stakeholders, and identification of its major strategies..
_____ 4. A company’s specific approach for deploying the organizational assets and
capabilities required to meet its customers’ needs competitively, while delivering the
desired returns to shareholders. .
_____ 5. Groups or individuals, such as employees, suppliers, customers, shareholders, and
communities, who have an interest in what the organization does.
_____ 6. Continuous reevaluation and improvement of the efficiency of an organization’s
activities.
_____ 7. Performance measurement system relying on multiple financial and nonfinancial
measures of performance.
_____ 8. The time involved in processing, moving, storing, and inspecting products and
materials.
_____ 9. Continuous process of measuring a company’s own products, services, or activities
against competitors’ performance.
_____ 10. Measures of the efficiency of the total manufacturing cycle; equals processing time
divided by the manufacturing cycle time.
_____ 11. Measure that expresses the relation between output and a single input.
_____ 12. How the organization will create value for all stakeholders.
_____ 13. Ratio of the value of output to the value of all key inputs.
_____ 14. A measure that expresses the conversion of inputs into output.
_____ 15. A visual device to communicate an organization’s strategy.
Matching Answers
18–23
Multiple Choice
1. Which of the following is a nonfinancial measure?
a. Number of customer complaints.
b. Return on investment.
c. Prevention cost.
d. Opportunity cost.
2. Which of the following statements is correct?
a. The business model can suggest ways to evaluate performance that makes sense to the
organization.
b. A single measure of performance typically evaluates the result.
c. Multiple measures emphasize how the result was achieved.
d. All of the above.
3. A balanced scorecard:
a. Emphasizes financial performance.
b. Caters to the needs of employees.
c. Tries to meet the organization’s responsibilities to stakeholders.
d. Is just a set of multiple performance measures.
4. Manufacturing cycle time is an example of a balanced-scorecard measure of:
a. Financial performance.
b. Customer perspective.
c. Internal business process.
d. Learning and growth.
5. Continuous improvement:
a. Is a philosophy of running the business.
b. Is independent of benchmarking.
c. Is looking to improve the efficiency of activities.
d. Both a and c.
6. Which of the following can be used to measure customer satisfaction?
a. Number of customer complaints
b. Number of service calls
c. Number or returns
d. All of the above
18–24
Use the following information to answer questions 7 and 8:
A manufacturing company has the following average times.
Product transportation
0.25 hour
Product manufacturing
3.5 hours
Inspection
0.25 hour
Inventory storage
10 hours
7. What is the average manufacturing cycle time (in hours)?
a. 14.00
b. 13.75
c. 13.50
d. 10.00
8. What is the manufacturing cycle efficiency?
a. 15%
b. 25%
c. 35%
d. 45%
9. Which of the following is an example of subjective measurement?
a. Economic conditions of the city where a branch is located
b. Employee turnover
c. Branch profits
d. Defect rates
10. Which of the statements regarding employee involvement is not correct?
a. When workers take on real decision-making authority, their commitment to the
organization increases.
b. When decision-making responsibility lies with workers farther away from the customer,
workers are more responsive and make informed decisions.
c. Management must create a system that conveys the organization’s objectives to all
members.
d. Management must ensure that the performance measures are applied consistently and
accurately.
11. Which of the statements is not correct?
a. People at different levels in the organization have different responsibilities.
b. At the lower levels, financial measures are critical.
c. At the middle levels, it is important to coordinate ongoing activities.
d. At the top levels, performance measures focus on meeting stakeholders’ needs.
18–25
12. Which of the following performance measures are appropriate for a regional manager?
a. Profitability
b. Employee turnover
c. Customer and employee satisfaction
d. All of the above
18–26
Multiple Choice Answers
18–27
Demonstration Problem
ChemUSA operates two highly automated chemical processing plants: East Plant and West Plant.
The same production process takes place in the two plants and turns material X into chemical
compound Y.
In order to evaluate their productivity measures, the managers of ChemUSA have the accounting
department gather comparative operating and financial data in the follow table.
East Plant
West Plant
This Year
Last Year
This Year
Last Year
Inputs:
X
30,000 lb @ $75
29,000 lb @ $73
50,000 lb @ $72
52,000 lb @ $71
Labor
4,000 h @ $15
3,740 h @$14
6,050 h @ $14
6,180 h @ $13
Overhead
$3,150,000
$2,878,000
$5,480,000
$5,672,500
Outputs:
Y
26,500 lb
24,650 lb
43,100 lb
44,200 lb
Value
$7,380,000
$6,763,500
$11,089,300
$11,428,300
Required:
Determine relevant partial productivity and total factor productivity measures for both plants and
compare the results.
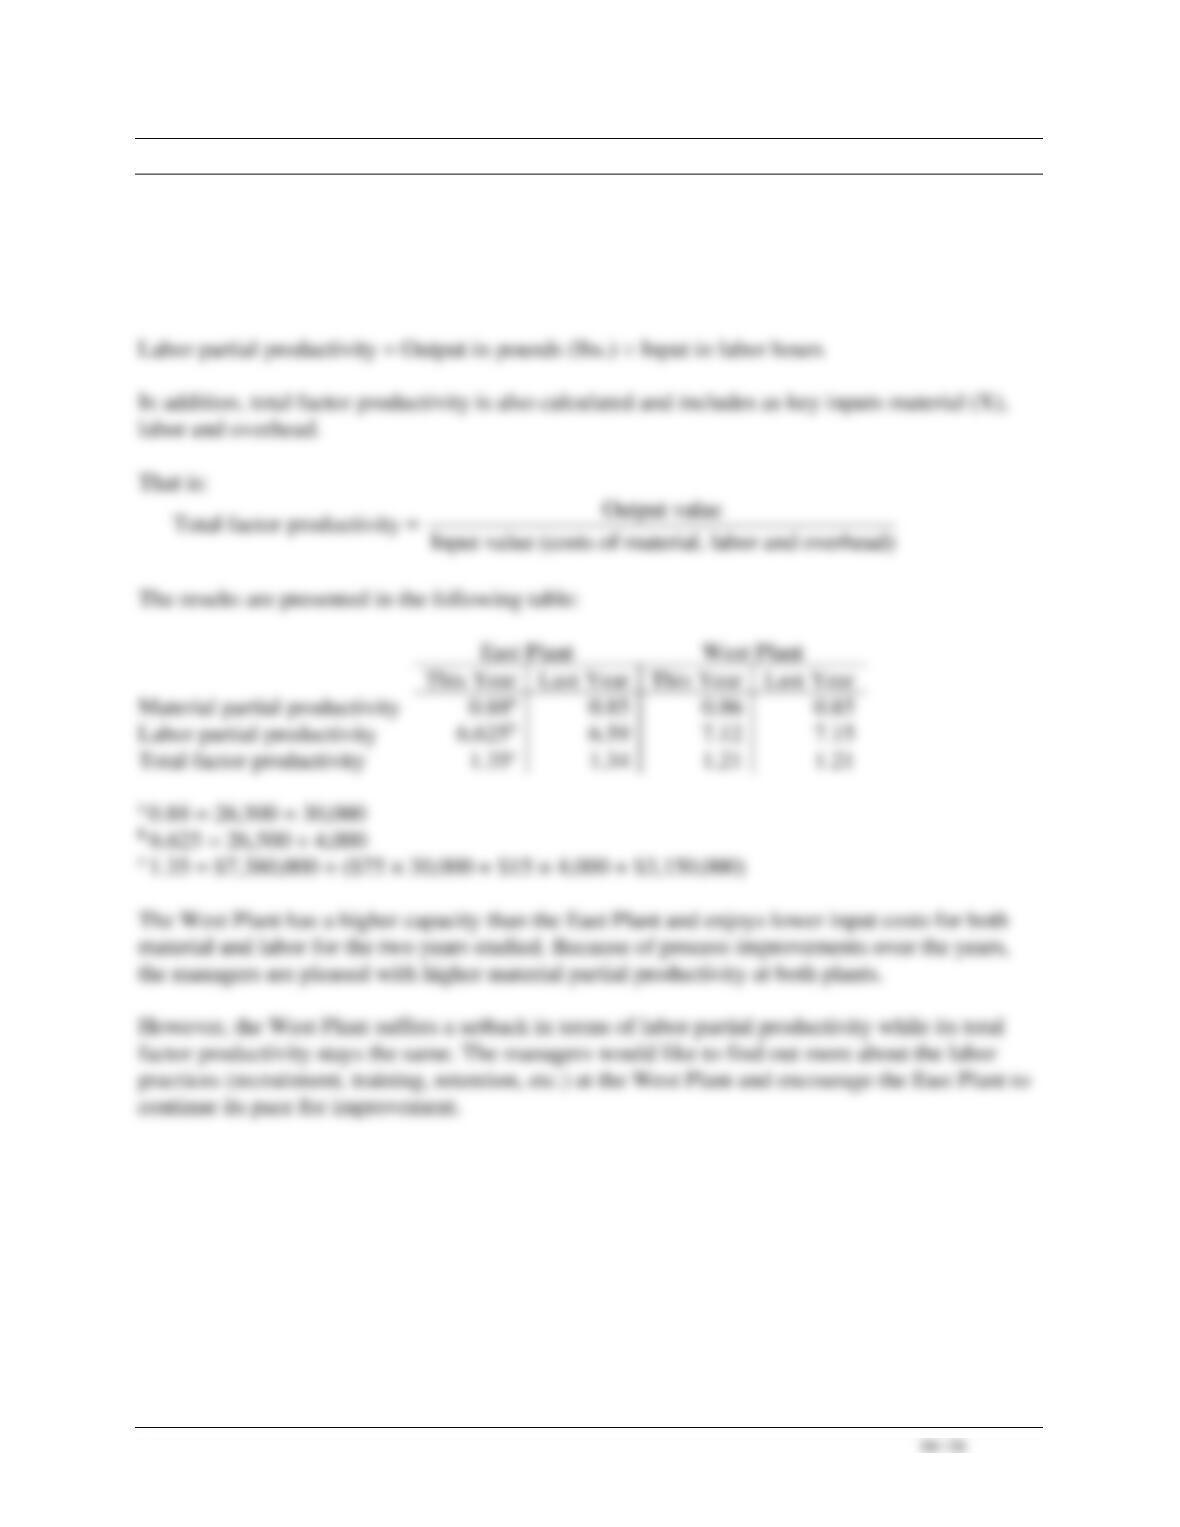
Demonstration Problem – Solution
The accounting department recommends the calculation of two partial productivity measures
corresponding to the use of material input (X) and labor input (hours), respectively.
Material partial productivity = Output in pounds (lbs.) ÷ Input in pounds (lbs.)


