CHAPTER 18
Financial Statement Analysis
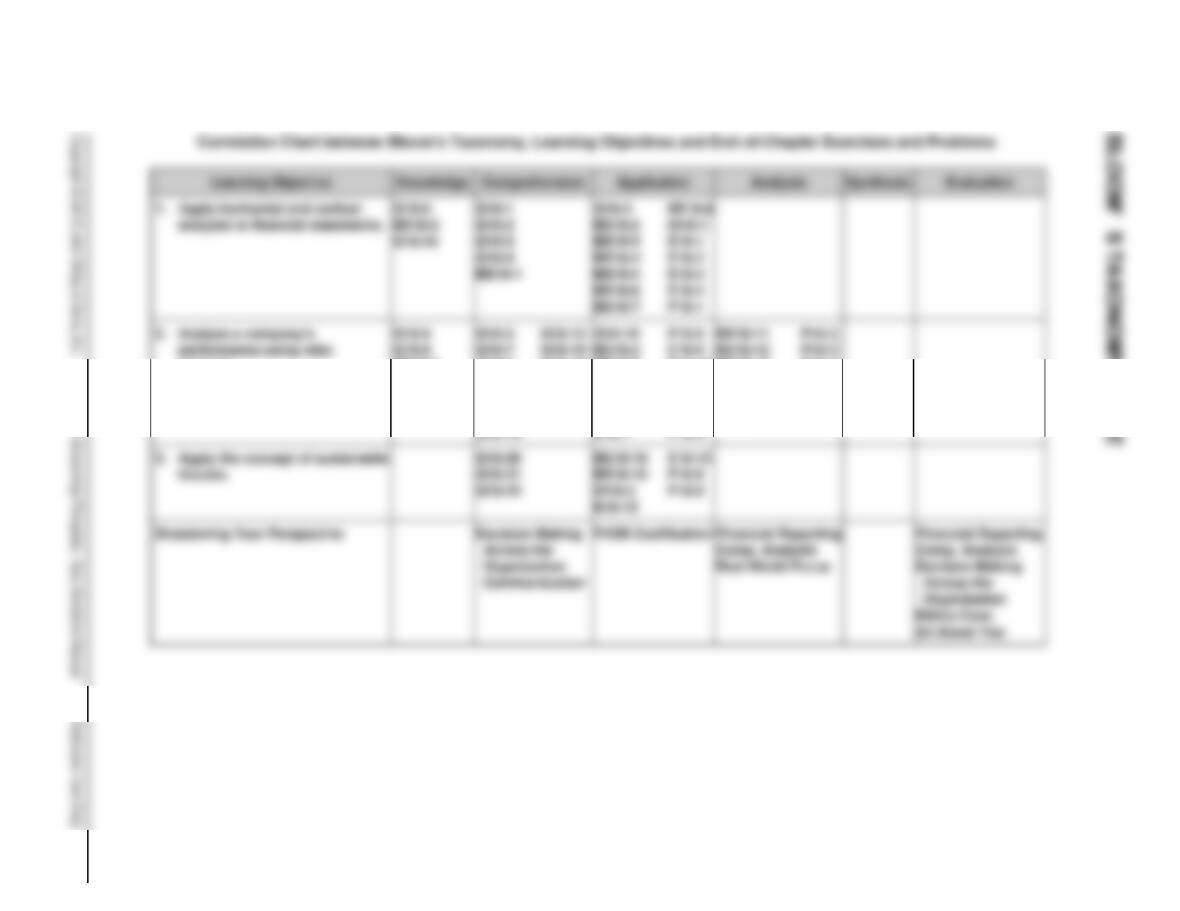
ASSIGNMENT CLASSIFICATION TABLE
Learning Objectives
Questions
Brief
Exercises
Do It!
Exercises
Problems
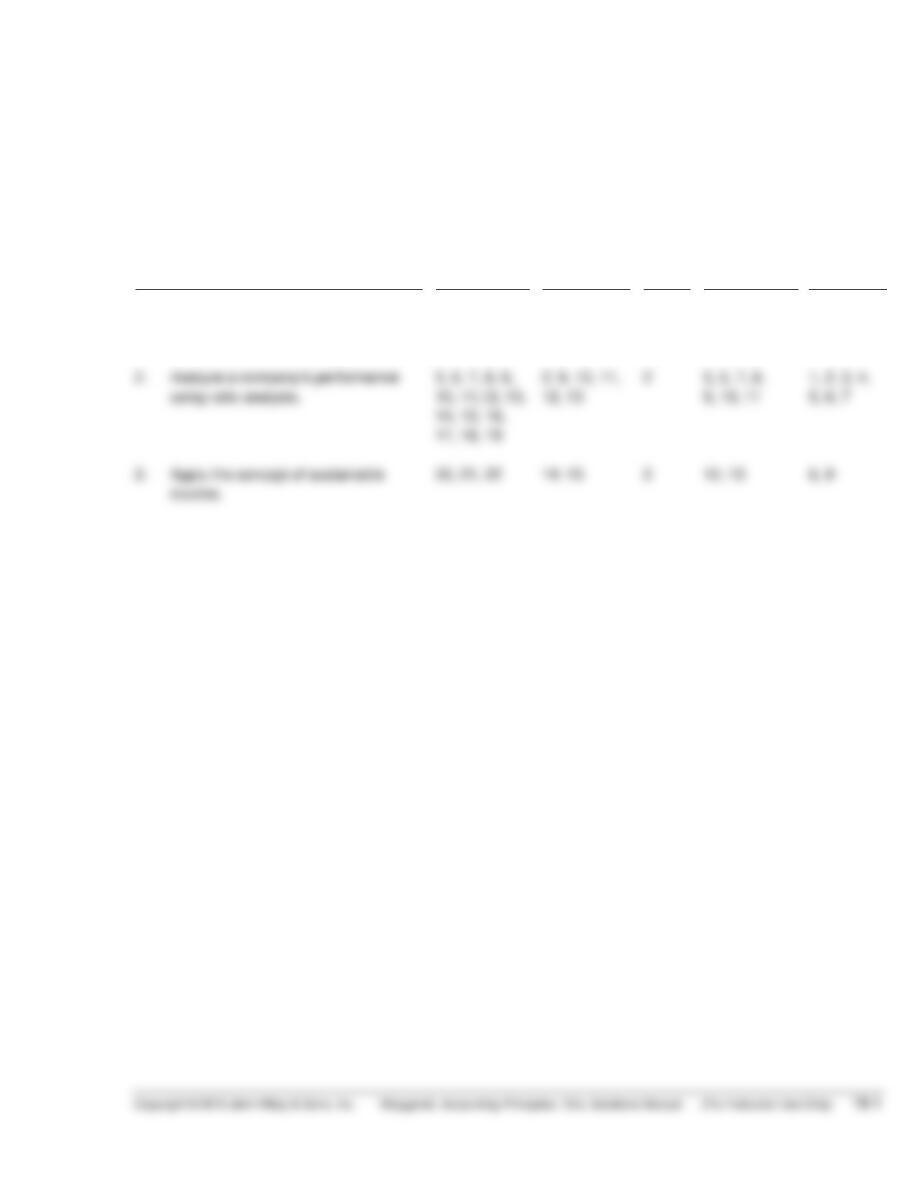
1. Apply horizontal and vertical analysis
to financial statements.
1, 2, 3, 4, 5,
6, 23
1, 2, 3, 4, 5,
6, 7, 8
1
1, 2, 3, 4
1
3. Apply the concept of sustainable
20, 21, 22
14, 15
3
12, 13
8, 9
ASSIGNMENT CHARACTERISTICS TABLE
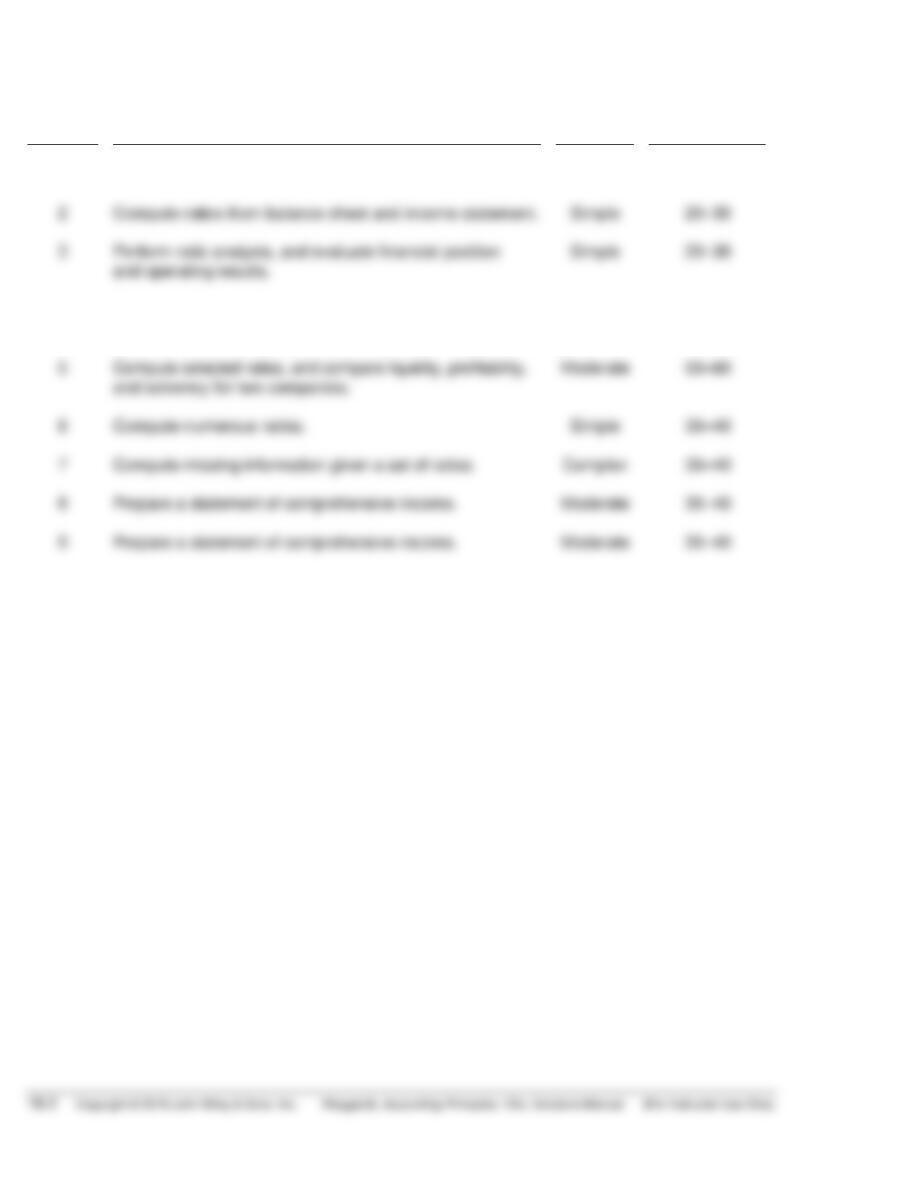
Problem
Number
Description
Difficulty
Level
Time
Allotted (min.)
1
Prepare vertical analysis and comment on profitability.
Simple
20–30
2
Compute ratios from balance sheet and income statement.
Simple
20–30
3
Perform ratio analysis, and evaluate financial position
and operating results.
Simple
20–30
4
Compute ratios, and comment on overall liquidity and
profitability.
Moderate
30–40
Compute numerous ratios.
7
Compute missing information given a set of ratios.
30–40
8
Prepare a statement of comprehensive income.
30–40
Prepare a statement of comprehensive income.
WEYGANDT ACCOUNTING PRINCIPLES 12E
CHAPTER 18
FINANCIAL STATEMENT ANALYSIS
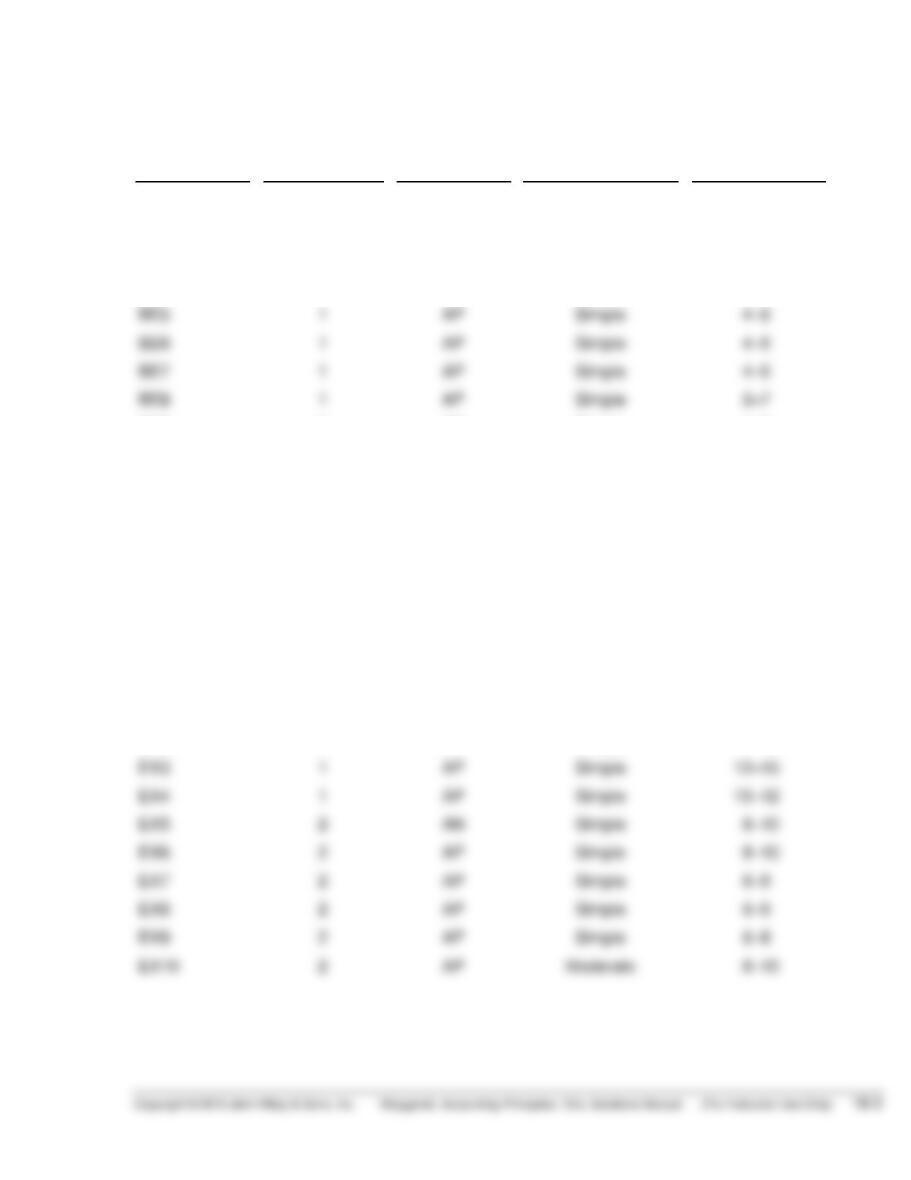
Number
LO
BT
Difficulty
Time (min.)
BE1
1
C
Moderate
10–12
BE2
1, 2
K, AP
Simple
8–10
BE3
1
AP
Simple
6–8
BE4
1
AP
Simple
6–8
BE5
1
AP
Simple
4–6
BE6
1
AP
Simple
4–6
BE7
1
AP
Simple
4–6
BE8
1
AP
Simple
5–7
BE9
2
AP
Simple
4–6
BE10
2
AP
Simple
3–5
BE11
2
AN
Simple
6–8
BE12
2
AN
Moderate
6–8
BE13
2
AN
Moderate
6–8
BE14
3
AP
Simple
4–6
BE15
3
AP
Simple
3–5
DI1
1
AP
Simple
6–8
DI2
2
AP
Simple
10–12
DI3
3
AP
Simple
6–8
EX1
1
AP
Simple
10–12
EX2
1
AP
Simple
10–12
EX3
1
AP
Simple
12–15
EX4
1
AP
Simple
10–12
EX5
2
AN
Simple
8–10
EX6
2
AP
Simple
8–10
EX7
2
AP
Simple
6–8
EX8
2
AP
Simple
6–8
EX9
2
AP
Simple
6–8
EX10
2
AP
Moderate
8–10
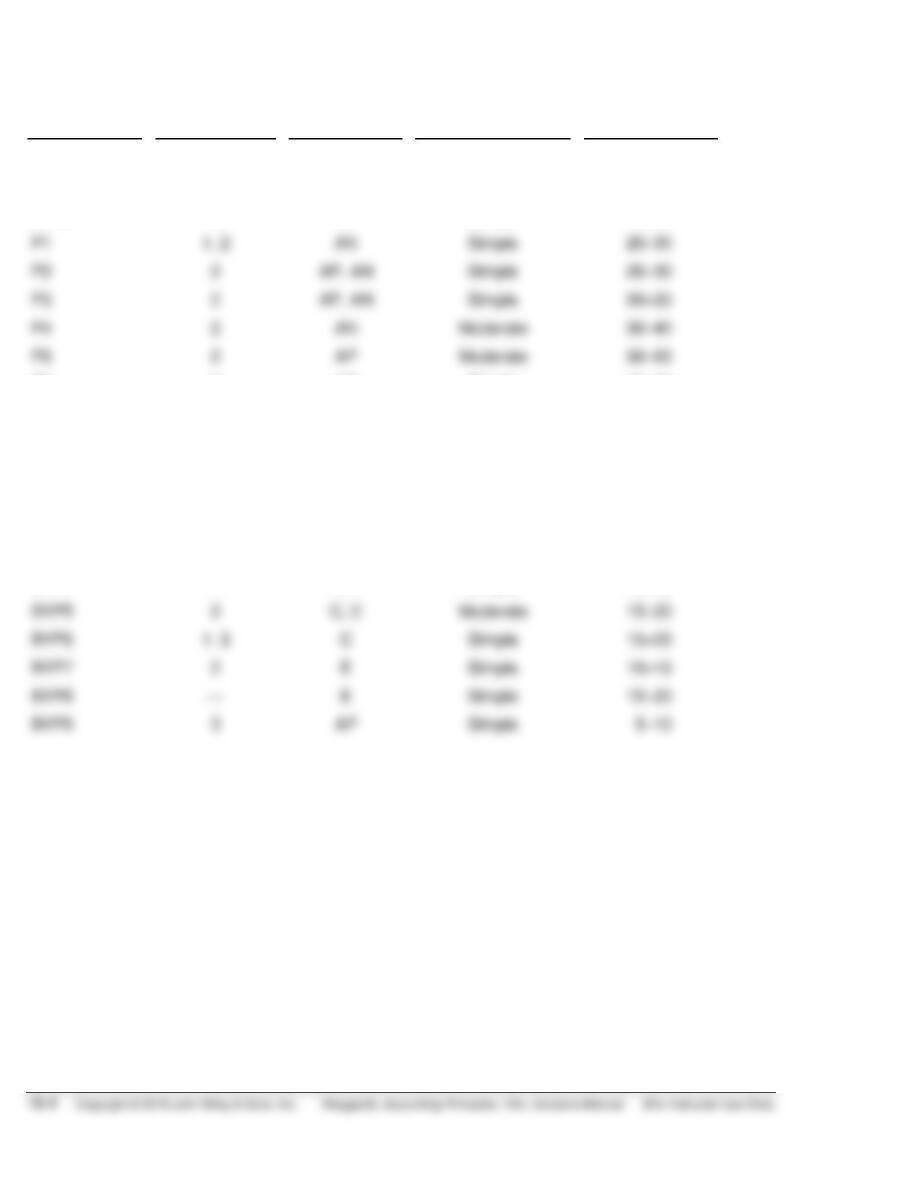
FINANCIAL STATEMENT ANALYSIS (Continued)
Number
LO
BT
Difficulty
Time (min.)
EX11
2
AP
Simple
10–12
EX12
3
AP
Moderate
8–10
EX13
3
AP
Simple
6–8
P1
1, 2
AN
Simple
20–30
P2
2
Simple
20–30
P3
2
Simple
20–30
P4
2
AN
Moderate
30–40
P5
2
AP
Moderate
50–60
P6
2
AP
Simple
30–40
P7
2
AN
Complex
30–40
P8
3
AP
Moderate
30–40
P9
3
AP
Moderate
30–40
BYP1
1, 2
AN, E
Moderate
20–25
BYP2
1, 2
AN, E
Simple
15–20
BYP3
1, 2
AN, E
Simple
15–20
BYP4
—
AN
Simple
15–20
BYP5
2
Moderate
15–20
BYP6
1, 3
Simple
15–20
BYP7
2
Simple
10–15
BYP8
Simple
15–20
BYP9
3
AP
Simple
5–10
analysis.
BE18-2
Real-World Focus
Decision Making
Ethics Case
Q18-9
Q18-10
Q18-11
Q18-12
Q18-16
Q18-17
Q18-18
BE18-9
BE18-10
DI18-2
E18-6
E18-10
P18-2
P18-3
P18-5
BE18-13
E18-5
E18-11
P18-1
P18-4
P18-7
ANSWERS TO QUESTIONS
1. (a) Jose is not correct. There are three characteristics: liquidity, profitability, and solvency.
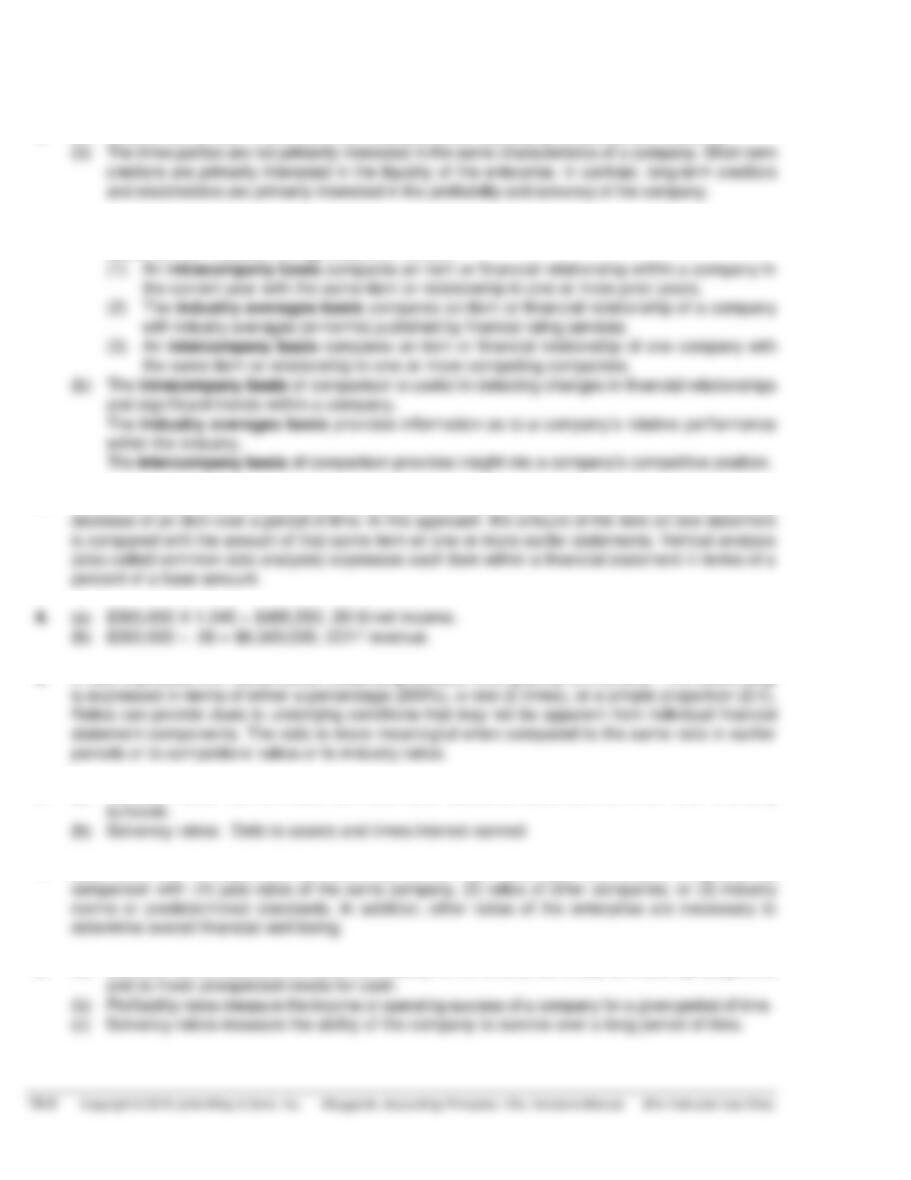
(b) The three parties are not primarily interested in the same characteristics of a company. Short-term
creditors are primarily interested in the liquidity of the enterprise. In contrast, long–term creditors
and stockholders are primarily interested in the profitability and solvency of the company.
2. (a) Comparison of financial information can be made on an intracompany basis, an intercompany
basis, and an industry average basis (or norms).
(1) An intracompany basis compares an item or financial relationship within a company in
3. Horizontal analysis (also called trend analysis) measures the dollar and percentage increase or
decrease of an item over a period of time. In this approach, the amount of the item on one statement
is compared with the amount of that same item on one or more earlier statements. Vertical analysis
(also called common-size analysis) expresses each item within a financial statement in terms of a
percent of a base amount.
5. A ratio expresses the mathematical relationship between one quantity and another. The relationship
is expressed in terms of either a percentage (200%), a rate (2 times), or a simple proportion (2:1).
Ratios can provide clues to underlying conditions that may not be apparent from individual financial
statement components. The ratio is more meaningful when compared to the same ratio in earlier
periods or to competitors’ ratios or to industry ratios.
6. (a) Liquidity ratios: Current ratio, acid-test ratio, accounts receivable turnover, and inventory
turnover.
Questions Chapter 18 (Continued)
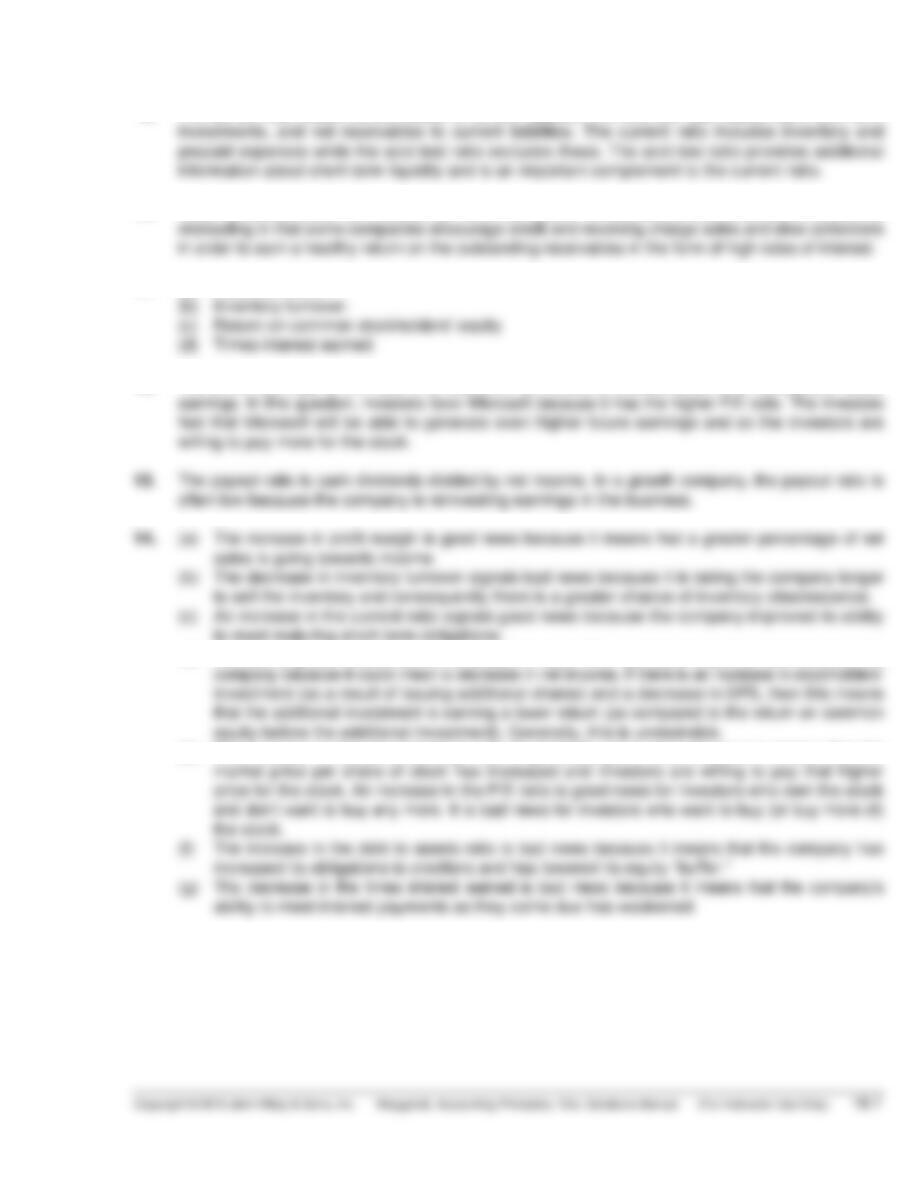
9. The current ratio relates current assets to current liabilities. The acid-test ratio relates cash, short-term
investments, and net receivables to current liabilities. The current ratio includes inventory and
prepaid expenses while the acid-test ratio excludes these. The acid-test ratio provides additional
information about short-term liquidity and is an important complement to the current ratio.
12. The price earnings (P/E) ratio is a reflection of investors’ assessments of a company’s future
earnings. In this question, investors favor Microsoft because it has the higher P/E ratio. The investors
feel that Microsoft will be able to generate even higher future earnings and so the investors are
willing to pay more for the stock.
13. The payout ratio is cash dividends divided by net income. In a growth company, the payout ratio is
often low because the company is reinvesting earnings in the business.
14. (a) The increase in profit margin is good news because it means that a greater percentage of net
sales is going towards income.
(b) The decrease in inventory turnover signals bad news because it is taking the company longer
to sell the inventory and consequently there is a greater chance of inventory obsolescence.
(c) An increase in the current ratio signals good news because the company improved its ability
to meet maturing short-term obligations.
(d) The earnings per share ratio is a deceptive ratio. The decrease might be bad news to the
Questions Chapter 18 (Continued)
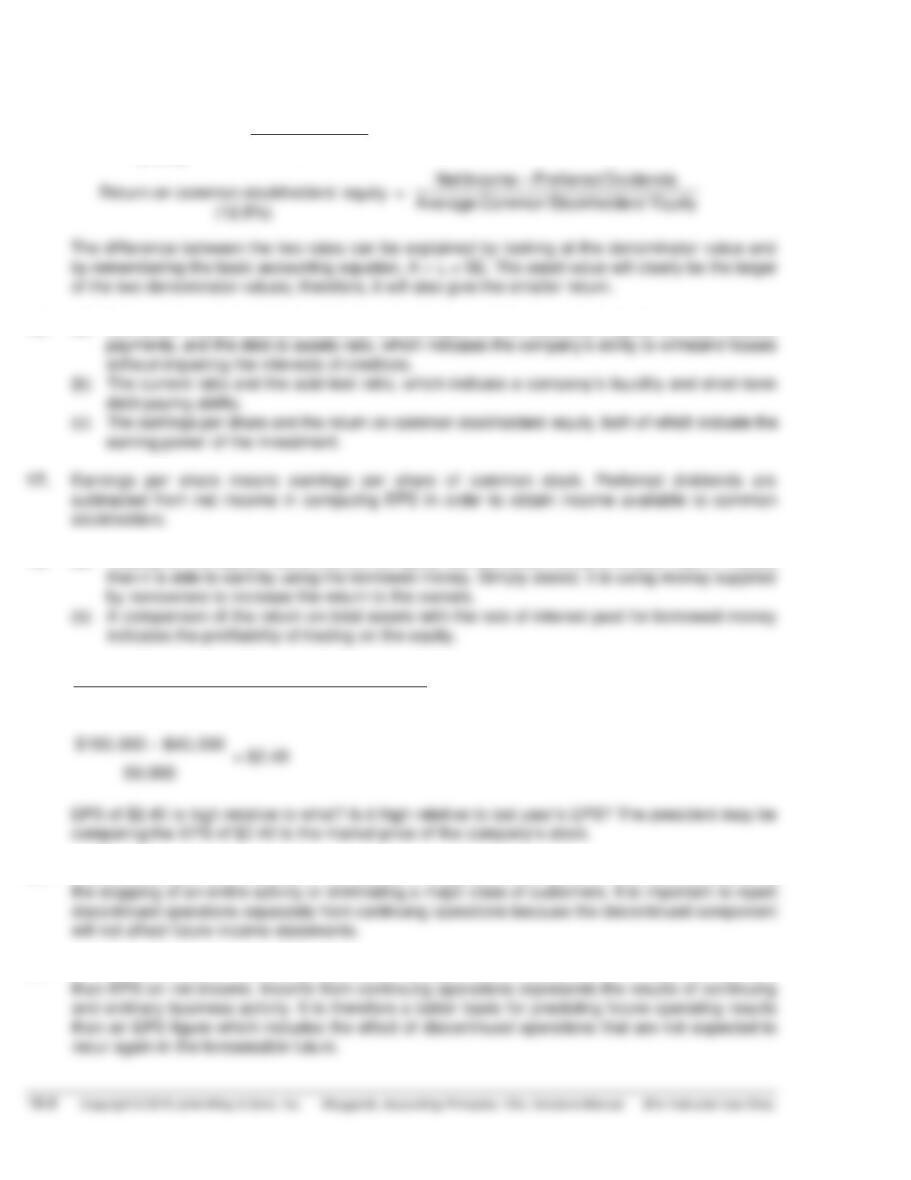
15.
Return on assets
(7.6%)
=
Net Income
Average Assets
16. (a) The times interest earned, which is an indication of the company’s ability to meet interest
payments, and the debt to assets ratio, which indicates the company’s ability to withstand losses
without impairing the interests of creditors.
(b) The current ratio and the acid-test ratio, which indicate a company’s liquidity and short-term
debt-paying ability.
17. Earnings per share means earnings per share of common stock. Preferred dividends are
subtracted from net income in computing EPS in order to obtain income available to common
stockholders.
18. (a) Trading on the equity means that the company has borrowed money at a lower rate of interest
than it is able to earn by using the borrowed money. Simply stated, it is using money supplied
by nonowners to increase the return to the owners.
(b) A comparison of the return on total assets with the rate of interest paid for borrowed money
indicates the profitability of trading on the equity.
19.
Net income – Preferred dividends
Weighted – average common shares outstanding
= Earnings per share
20. Discontinued operations refers to the disposal of a significant component of the business such as
the stopping of an entire activity or eliminating a major class of customers. It is important to report
discontinued operations separately from continuing operations because the discontinued component
will not affect future income statements.
Questions Chapter 18 (Continued)
22. When comparing EPS trends, discontinued operations should be omitted since they are not
reflective of normal operations. In this example, the trend is unfavorable because EPS, exclusive of
discontinued operations, has decreased from $3.20 to $2.99.
23. The following provide examples of horizontal and vertical analysis:
SOLUTIONS TO BRIEF EXERCISES
BRIEF EXERCISE 18-1
Dear Uncle Sammy,
It was so good to hear from you! I hope you and Aunt Jennie are still enjoying
your new house.
You asked some interesting questions. They relate very well to the material
that we are studying now in my financial accounting class. You said you
heard that different users of financial statements are interested in different
characteristics of companies. This is true. A short-term creditor, such as a bank,
is interested in the company’s liquidity, or ability to pay obligations as they
It is important to compare different financial statement elements to other
items. The amount of a financial statement element such as cash does not have
much meaning unless it is compared to something else. Comparisons can
be done on an intracompany basis. This basis compares an item or financial
relationship within a company for the current year to one or more previous
years. Intracompany comparisons are useful in detecting changes in financial
I hope this answers your questions. If it does not, or you have more questions,
please write me again or call. We could even meet for lunch sometime; it
would be great to see you!
Love,
Your niece (or nephew)
BRIEF EXERCISE 18-2
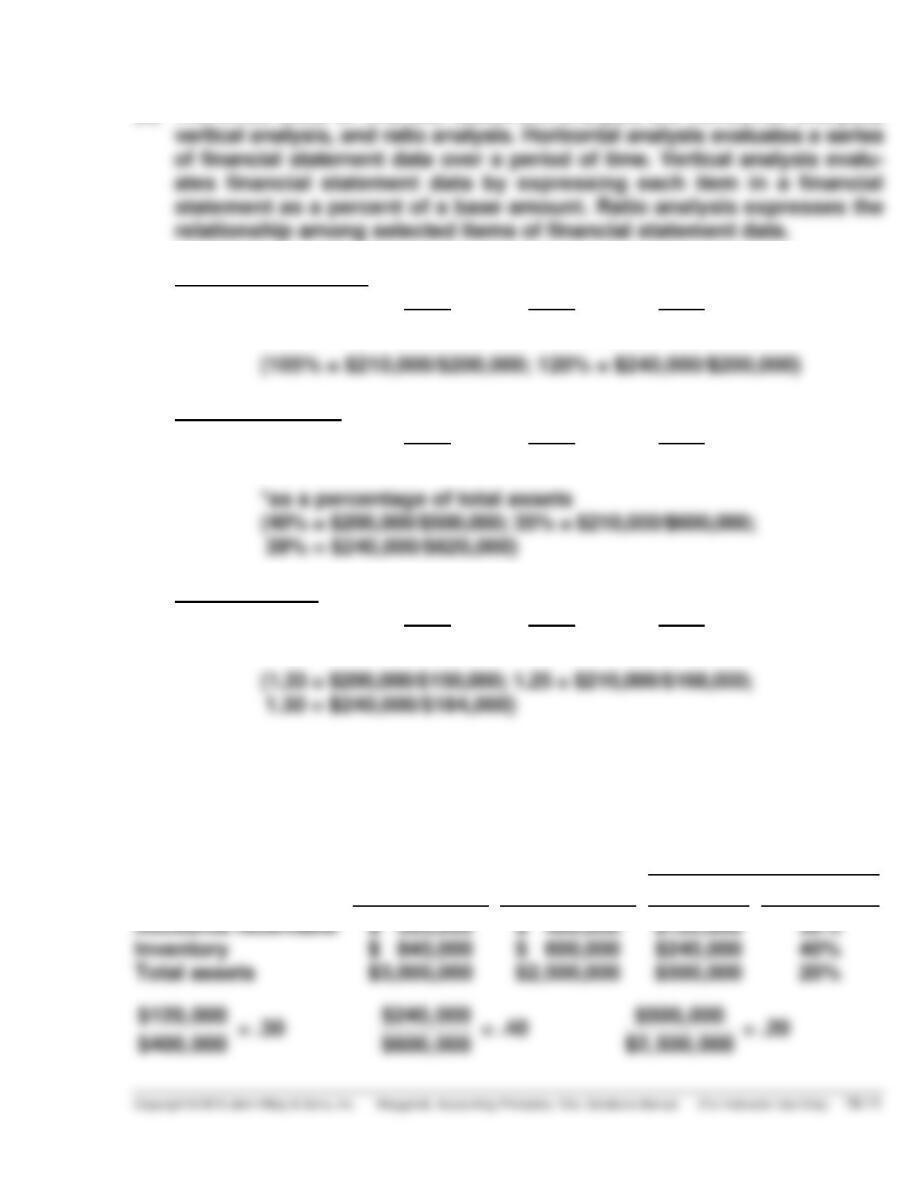
(a) The three tools of financial statement analysis are horizontal analysis,
vertical analysis, and ratio analysis. Horizontal analysis evaluates a series
of financial statement data over a period of time. Vertical analysis evalu-
(b) Horizontal Analysis
2016
2017
2018
Current assets
100%
105%
120%
Vertical Analysis
2016
2017
2018
Current assets*
40%
35%
39%
Ratio Analysis
2016
2017
2018
Current ratio
1.33:1
1.25:1
1.30:1
BRIEF EXERCISE 18-3
Horizontal analysis:
Increase
or (Decrease)
Dec. 31, 2017
Dec. 31, 2016
Amount
Percentage
Accounts receivable
Inventory
Total assets
$ 520,000
$ 840,000
$3,000,000
$ 400,000
$ 600,000
$2,500,000
$120,000
$240,000
$500,000
30%
40%
20%
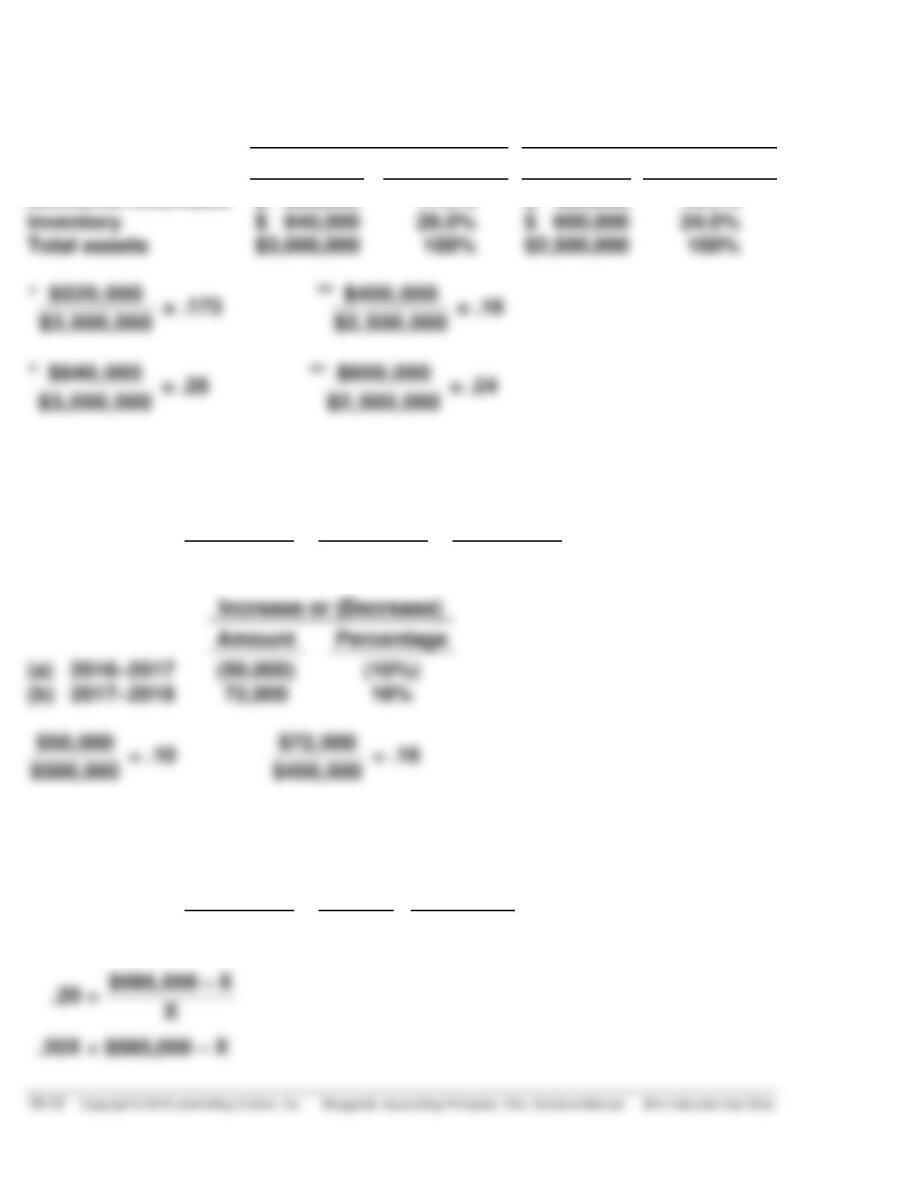
BRIEF EXERCISE 18-4
Vertical analysis:
Dec. 31, 2017
Dec. 31, 2016
Amount
Percentage*
Amount
Percentage**
Accounts receivable
Inventory
Total assets
$ 520,000
$ 840,000
$3,000,000
17.3%
28.0%
100%
$ 400,000
$ 600,000
$2,500,000
16.0%
24.0%
100%
BRIEF EXERCISE 18-5
2018
2017
2016
Net income
$522,000
$450,000
$500,000
Increase or (Decrease)
Amount
BRIEF EXERCISE 18-6
2017
2016
Increase
Net income
$585,000
X
20%
BRIEF EXERCISE 18-6 (Continued)
1.20X = $585,000
X = $487,500
BRIEF EXERCISE 18-7
Comparing the percentages presented results in the following conclusions:
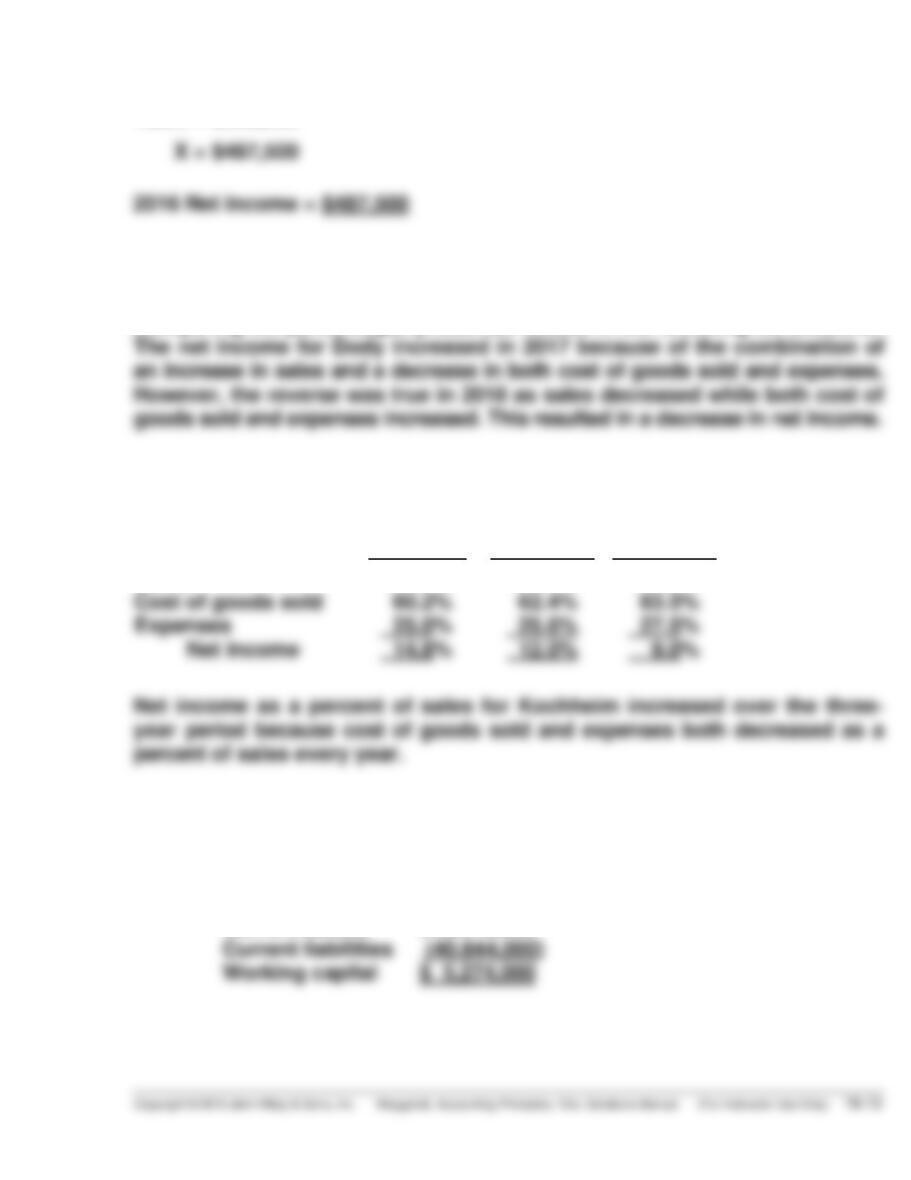
The net income for Dody increased in 2017 because of the combination of
BRIEF EXERCISE 18-8
2018
2017
2016
Sales
100.0%
100.0%
100.0%
BRIEF EXERCISE 18-9
(a) Working capital = Current assets – Current liabilities
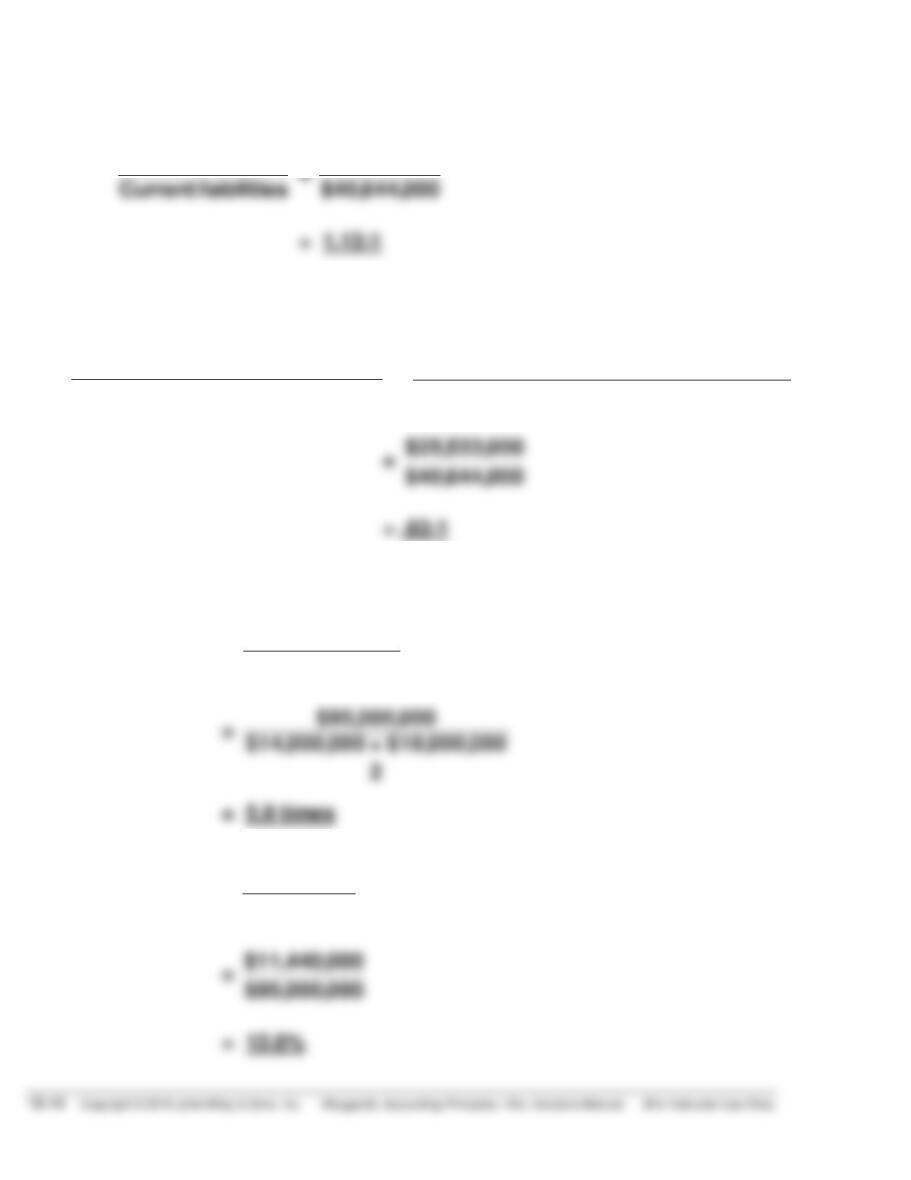
BRIEF EXERCISE 18-9 (Continued)
(b) Current ratio:
Current assets
$45,918,000
(c) Acid-test ratio:
Cash + Short–terminvestments
+ Receivables (net)
Current liabilities
=
$8,041,000 + $4,947,000 + $12,545,000
$40,644,000
BRIEF EXERCISE 18–10
(a) Asset turnover =
Net sales
Average assets
(b) Profit margin =
Net income
Net sales
BRIEF EXERCISE 18–11
(a) Accounts Receivable turnover =
Net credit sales
Average net accounts receivable
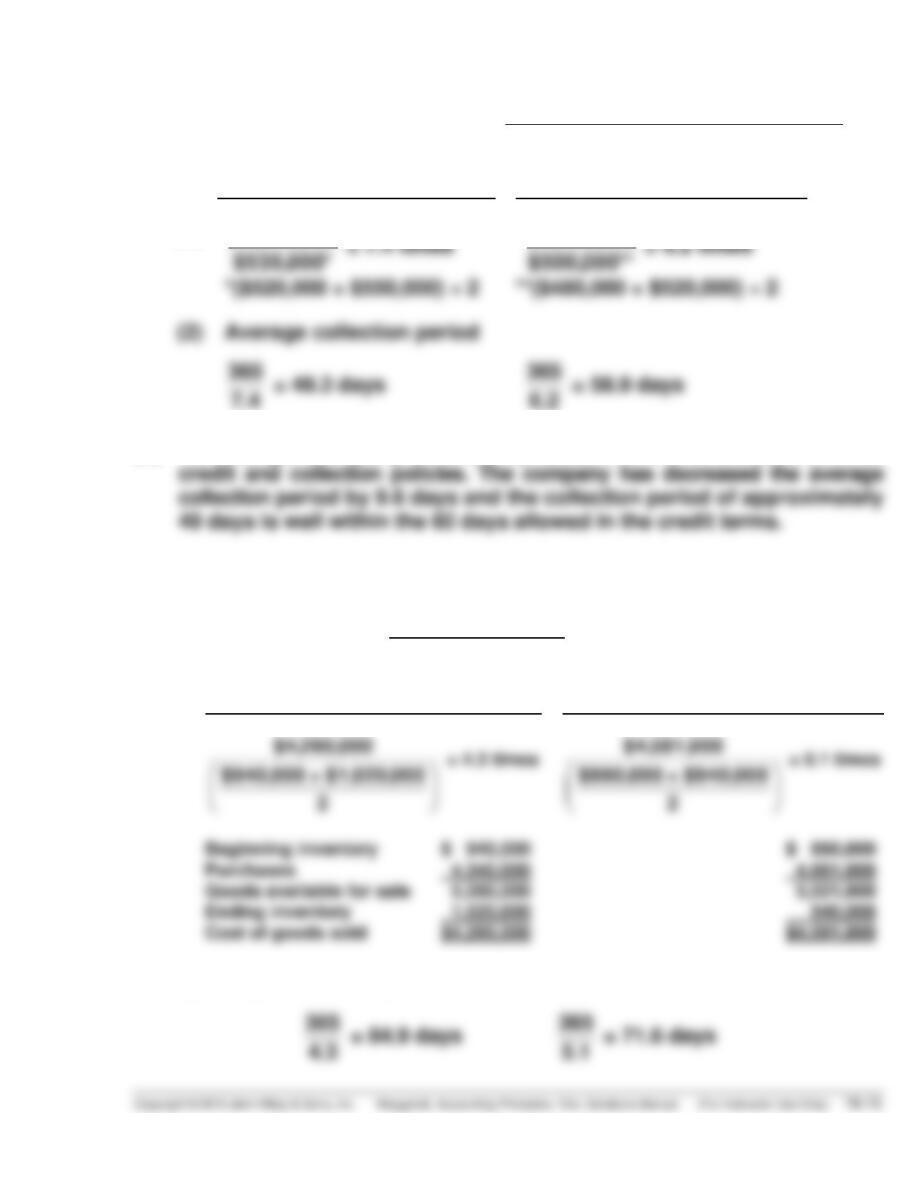
2018
2017
(1)
*($520,000 + $550,000) ÷ 2
$3,960,000
= 7.4 times
$3,100,000
= 6.2 times
(b) Rainsberger Company should be pleased with the effectiveness of its
credit and collection policies. The company has decreased the average
BRIEF EXERCISE 18–12
(a) Inventory turnover =
Cost of goods sold
Average inventory
(1)
2017
2016
$4,260,000
$940,000 + $1,020,000
2
= 4.3 times
$4,581,000
$860,000 + $940,000
2
= 5.1 times
(2) Days in inventory
BRIEF EXERCISE 18-12 (Continued)
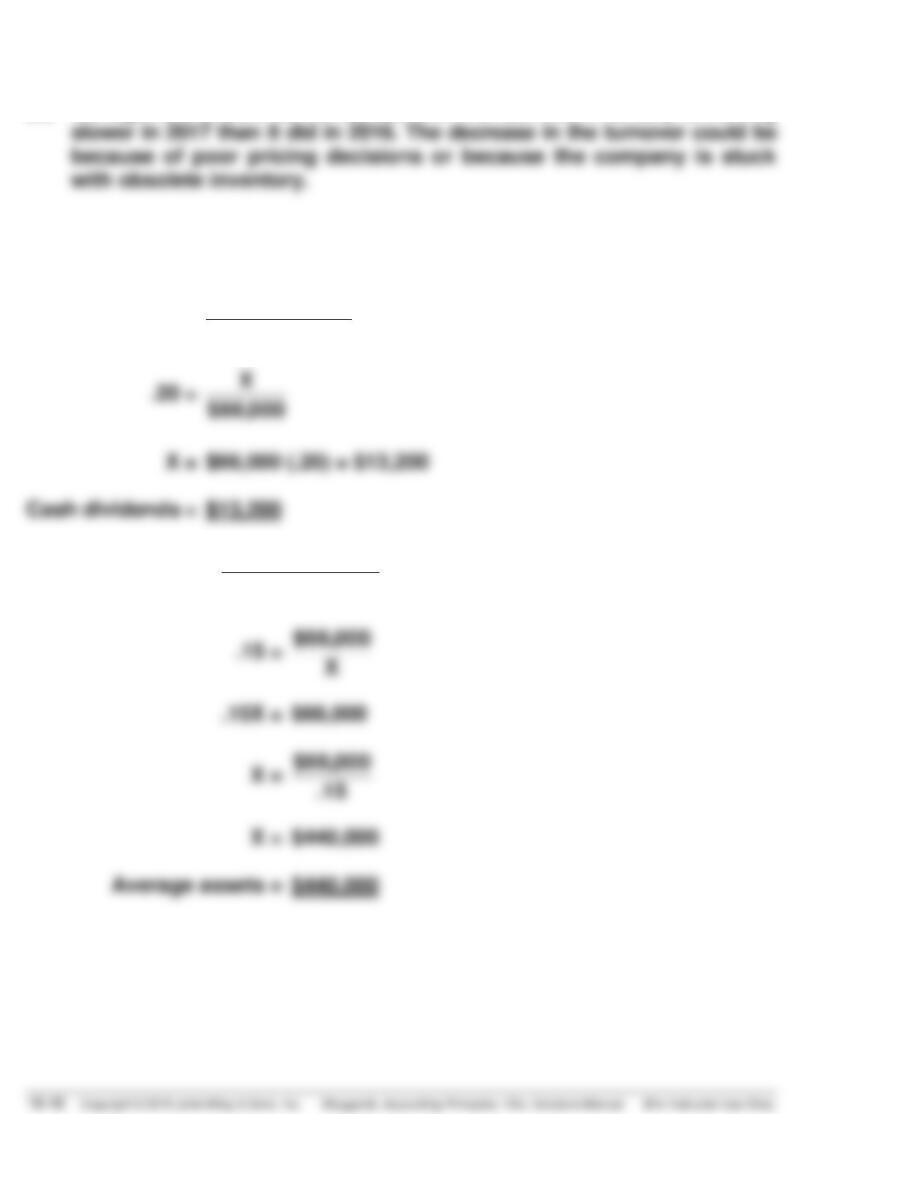
(b) Management should be concerned with the fact that inventory is moving
BRIEF EXERCISE 18–13
Payout ratio =
Cash dividends
Net income
Return on assets =
Net income
Average assets
BRIEF EXERCISE 18–14
SILVA CORPORATION
Partial Statement of Comprehensive Income
Income before income taxes ………………………………………………… $450,000
Income tax expense ($450,000 X 25%) …………………………………… 112,500
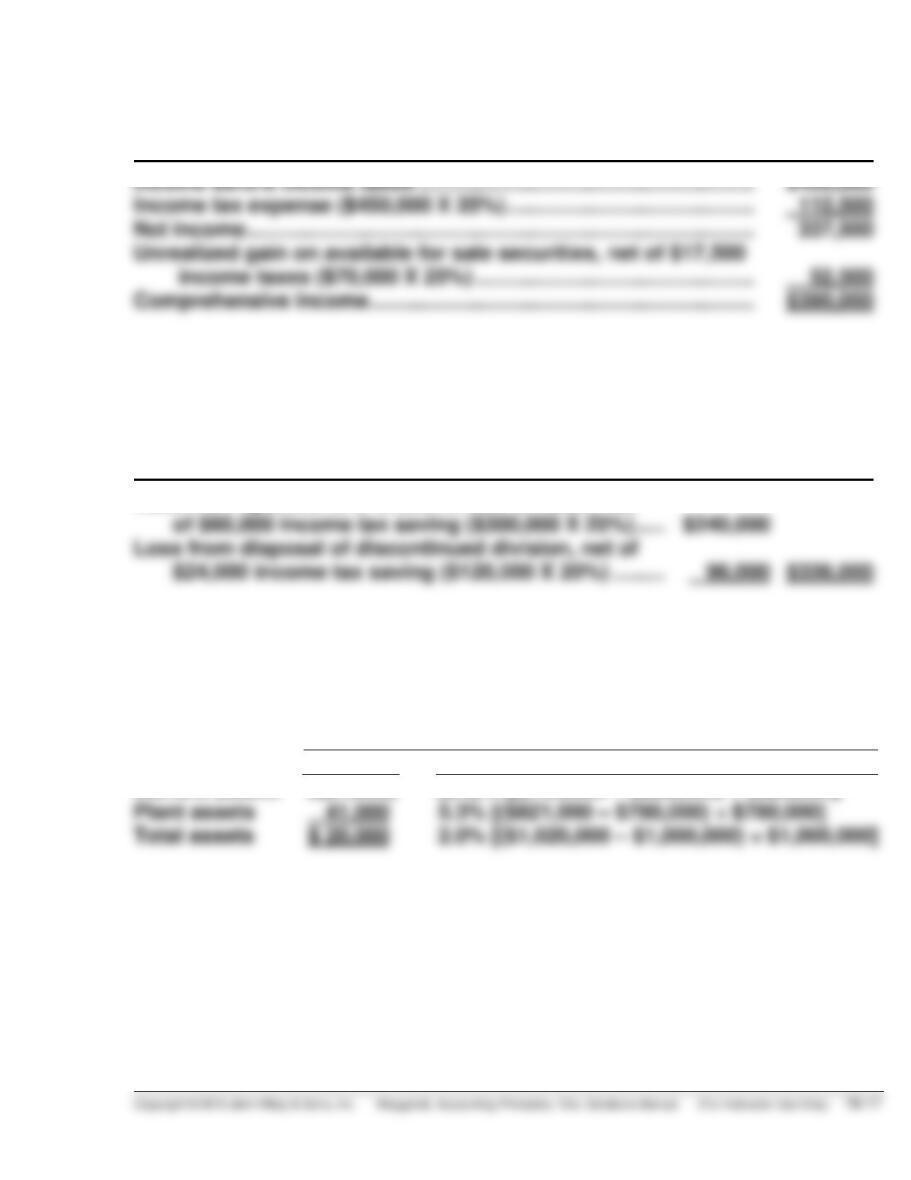
BRIEF EXERCISE 18–15
HOLLOWAY CORPORATION
Partial Income Statement
Loss from operations of discontinued division, net
of $60,000 income tax saving ($300,000 X 20%) ….. $240,000
SOLUTIONS FOR DO IT! REVIEW EXERCISES
DO IT! 18-1
Increase (Decrease) in 2017
Amount
Percent
Current assets $(21,000) (9.5)% [($199,000 – $220,000) ÷ $220,000]
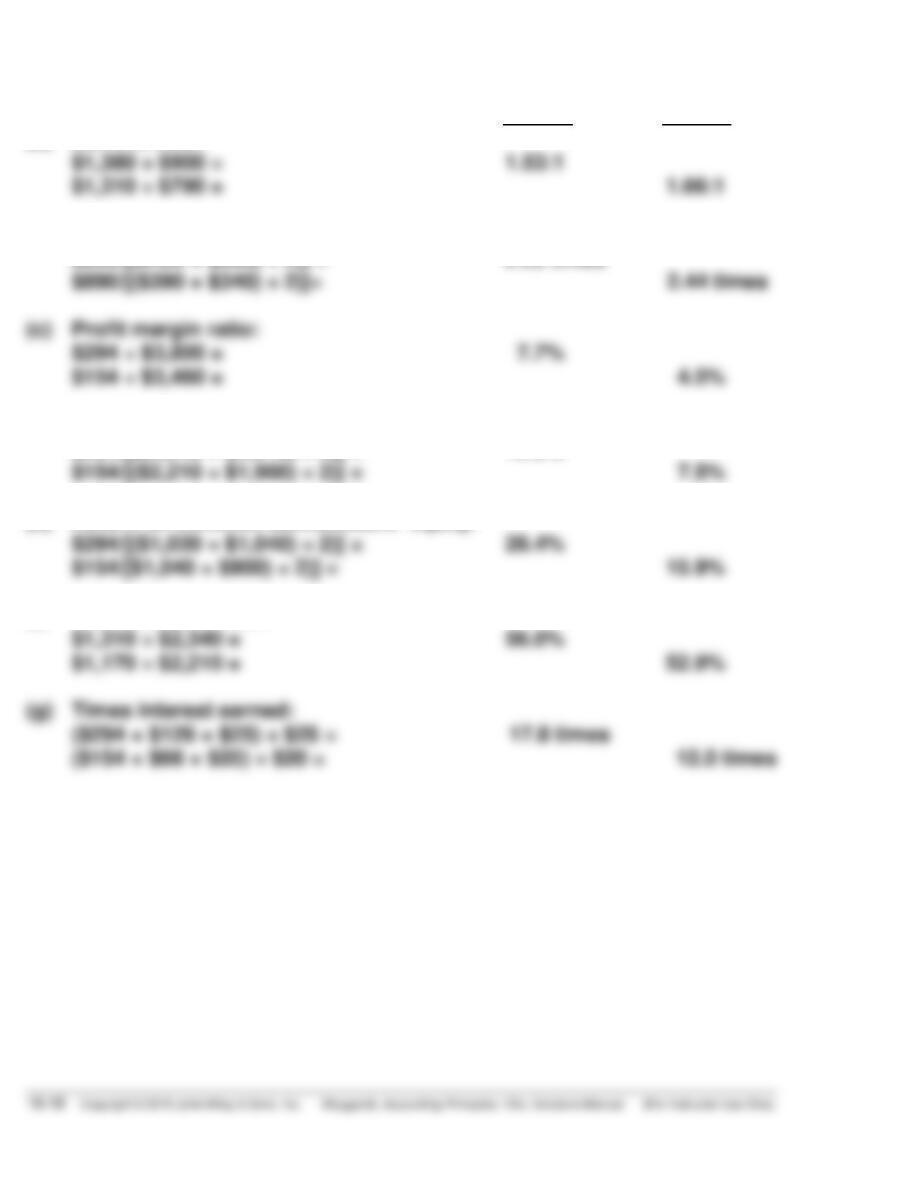
DO IT! 18-2
2017 2016
(a) Current ratio:
$1,380 ÷ $900 = 1.53:1
$1,310 ÷ $790 = 1.66:1
(b) Inventory turnover:
$955/[($460 + $390) ÷ 2)] = 2.25 times
$890/[($390 + $340) ÷ 2)]= 2.44 times
(d) Return on assets:
$294/[($2,340 + $2,210) ÷ 2)] = 12.9%
$154/[($2,210 + $1,900) ÷ 2)] = 7.5%
(e) Return on common stockholders’ equity:
$294/[($1,030 + $1,040) ÷ 2)] = 28.4%
$154/[$1,040 + $900) ÷ 2)] = 15.9%
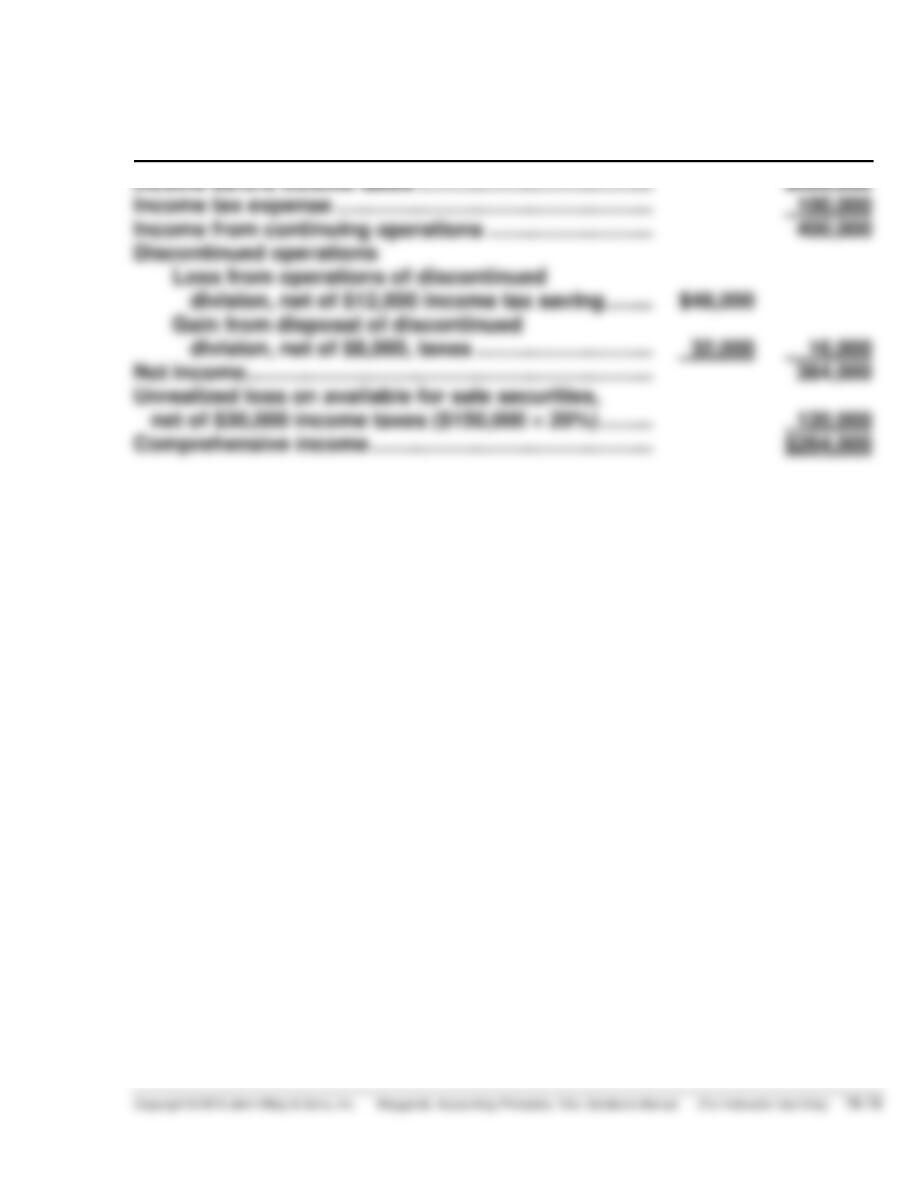
DO IT! 18-3
HRABIK CORPORATION
Statement of Comprehensive Income (Partial)
Income before income taxes …………………………………. $500,000
Income tax expense ……………………………………………… 100,000
Income from continuing operations ………………………. 400,000
SOLUTIONS TO EXERCISES
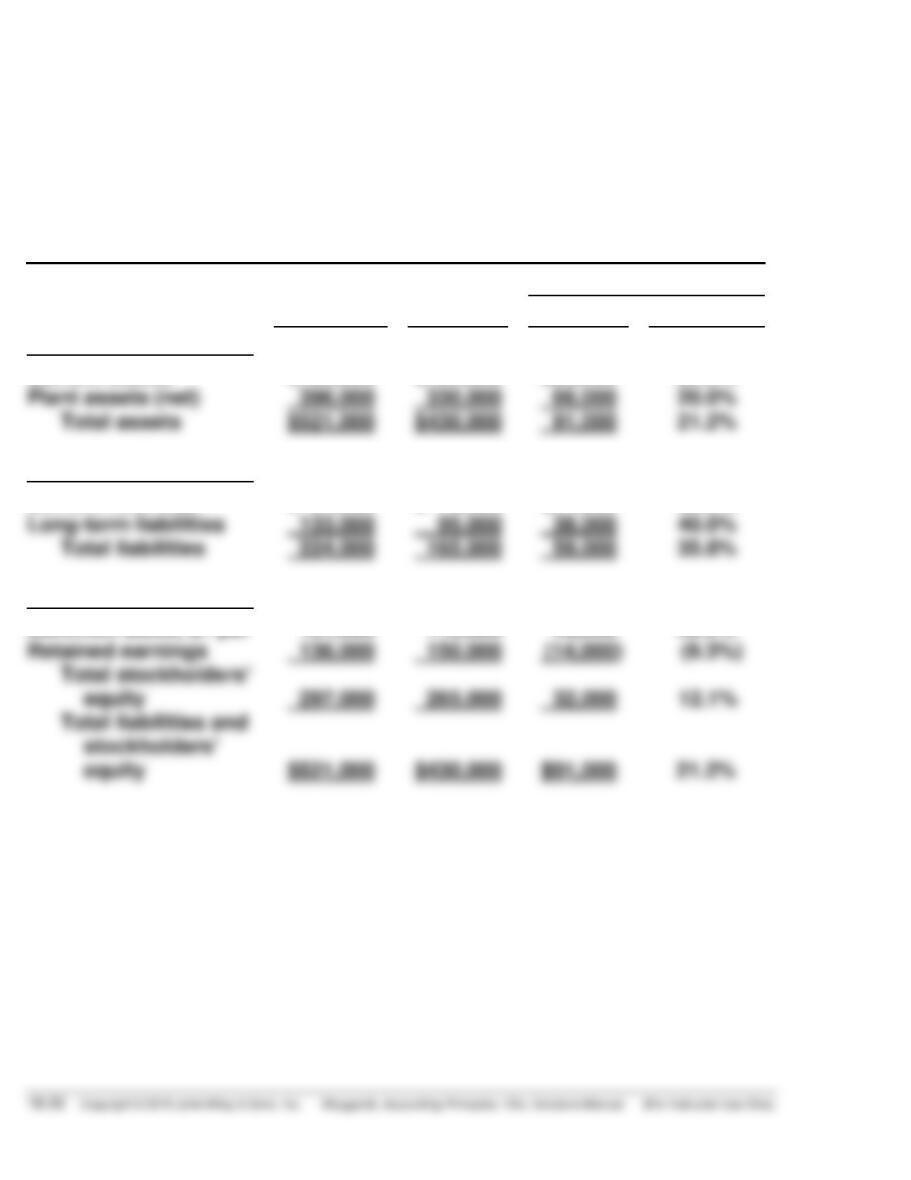
EXERCISE 18-1
KURZEN INC.
Condensed Balance Sheets
December 31
Increase or (Decrease)
2017
2016
Amount
Percentage
Assets
$430,000
Current assets
$125,000
$100,000
($25,000
(25.0%)
Liabilities
165,000
Current liabilities
$ 91,000
$ 70,000
($21,000)
(30.0%)
Stockholders’ Equity
Common stock, $1 par
Retained earnings
161,000
136,000
115,000
150,000
( 46,000
(14,000)
(40.0%)
(9.3%)