chapter
18(3)
Process Cost Systems
______________________________________________
OPENING COMMENTS
Chapter 18(3) completes the coverage of manufacturing accounting by introducing process costing. The
text demonstrates process costing under the FIFO method. The average cost method is presented in the
chapter’s appendix. Chapter 18(3) also discusses the impact of just-in-time systems on manufacturing.
In this chapter, you need to consider which method(s) of process costing you will choose to cover in your
class. When the FIFO method is presented in the chapter (Objectives 2 and 3), the manufacturing
department adds materials at the beginning of production and conversion costs evenly throughout
production. This requires two sets of equivalent unit calculations. When the average cost method is
presented in the chapter appendix, the problems show materials and conversion costs both added evenly
throughout production, requiring only one equivalent unit calculation. This assumption, along with the
ability to commingle beginning work in process with units started and completed, greatly simplifies the
computations related to process costing.
After studying the chapter, your students should be able to:
2. Prepare a cost of production report.
4. Describe and illustrate the use of cost of production reports for decision making.
5. Compare just-in-time processing with traditional manufacturing processing.
KEY TERMS
cost of production report
cost per equivalent unit
equivalent units of production
first-in, first-out (FIFO) method
just-in-time (JIT) processing
manufacturing cells
process cost system
process manufacturer
whole units
yield
STUDENT FAQS
• Why is it necessary to know the four steps of producing a cost of production report?
• What does equivalent units of production (EUP) mean, and why is it necessary for it to be correct?
• Started and completed under “units to be assigned cost” gives me problems every time. Do you have
a suggestion to eliminate my problem?
OBJECTIVE 1
Describe process cost systems.
SYNOPSIS
A process manufacturer produces products that are homogeneous; they use a cost system called process
costing. This system records the costs of each department or process. Process costing is similar to job
costing in that each records and summarizes product costs, allocates overhead, uses perpetual inventory,
and provides useful information for decision making. The example in the chapter, using ice cream, adds
all materials at the beginning of the process. There are two departments: Mixing and Packaging. Labor
and overhead costs occur in each department. When the Mixing Department is done with the product, its
costs are transferred to the Packaging Department along with the product. When the Packaging
Department completes its process, the product costs are transferred to finished goods. The cost flows in
the process cost system are similar to the physical flow of goods. As shown in Exhibit 4, each department
Chapter 18(3) Process Cost Systems 339
has a separate overhead account. The overhead is applied to work in process by debiting each
department’s factory overhead account and crediting each department’s Work in Process. When the
product is transferred, Work in Process—Mixing Department is credited and Work in Process—
Packaging Department is debited. Lastly, the Packaging Department transfers the product to finished
goods. Finished Goods is debited for the amount transferred, and Work in Process—Packaging
Department is credited.
Key Terms and Definitions
• Process Cost System – A type of cost system that accumulates costs for each of the various
departments within a manufacturing facility.
• Process Manufacturer – A manufacturer that uses large machines to process a continuous flow
of raw materials through various stages of completion into a finished state.
Relevant Example Exercises and Exhibits
• Example Exercise 18(3)-1 Job Order versus Process Costing
• Exhibit 1 – Examples of Process Cost and Job Order Companies
SUGGESTED APPROACH
Transparency Masters (TMs) 18(3)-1 through 18(3)-3 explain the types of manufacturers that use job
order and process costing, as well as the similarities and differences in these two systems. Ask your
students to give examples of companies that would use job order costing and companies that would use
process costing. As an alternative, ask your students whether a soft drink bottler would use a process or
job order system.
340 Chapter 18(3) Process Cost Systems
OBJECTIVE 2
Prepare a cost of production report.
SYNOPSIS
In a process system, the cost of units transferred out of each department must be determined along with
the cost of any partially completed units remaining in the department. These costs are reported in a cost
of production report. This report is prepared in four steps: (1) determine units to be assigned costs, (2)
compute equivalent units of production, (3) determine cost per equivalent unit, and (4) allocate costs to
units transferred out and partially completed units. In preparing the report, assumptions are made that the
FIFO inventory cost system is used. To complete Step 1, units to be included are determined by adding
the previous period’s ending inventory to the units received from materials inventory (or previous
Key Terms and Definitions
• Cost of Production Report – A report prepared periodically by a processing department,
summarizing (1) the units for which the department is accountable and the disposition of those
units and (2) the costs incurred by the department and the allocation of those costs between
completed and incomplete production.
• Cost per Equivalent Unit – The rate used to allocate costs between completed and partially
completed production.
Relevant Example Exercises and Exhibits
• Example Exercise 18(3)-2 Units to Be Assigned Costs
• Example Exercise 18(3)-3 Equivalent Units of Materials Cost
• Example Exercise 18(3)-4 Equivalent Units of Conversion Costs
• Example Exercise 18(3)-5 Cost per Equivalent Unit
• Example Exercise 18(3)-6 Cost of Units Transferred Out and Ending Work in Process
• Exhibit 5 – July Units to Be Costed—Mixing Department
• Exhibit 6 – Direct Materials Equivalent Units
Chapter 18(3) Process Cost Systems 341
• Exhibit 7 – Conversion Equivalent Units
• Exhibit 8 – Cost of Production Report for Frozen Delight’s Mixing Department—FIFO
SUGGESTED APPROACH
TM 18(3)-3 illustrates that each department in a process costing system can compute the cost to
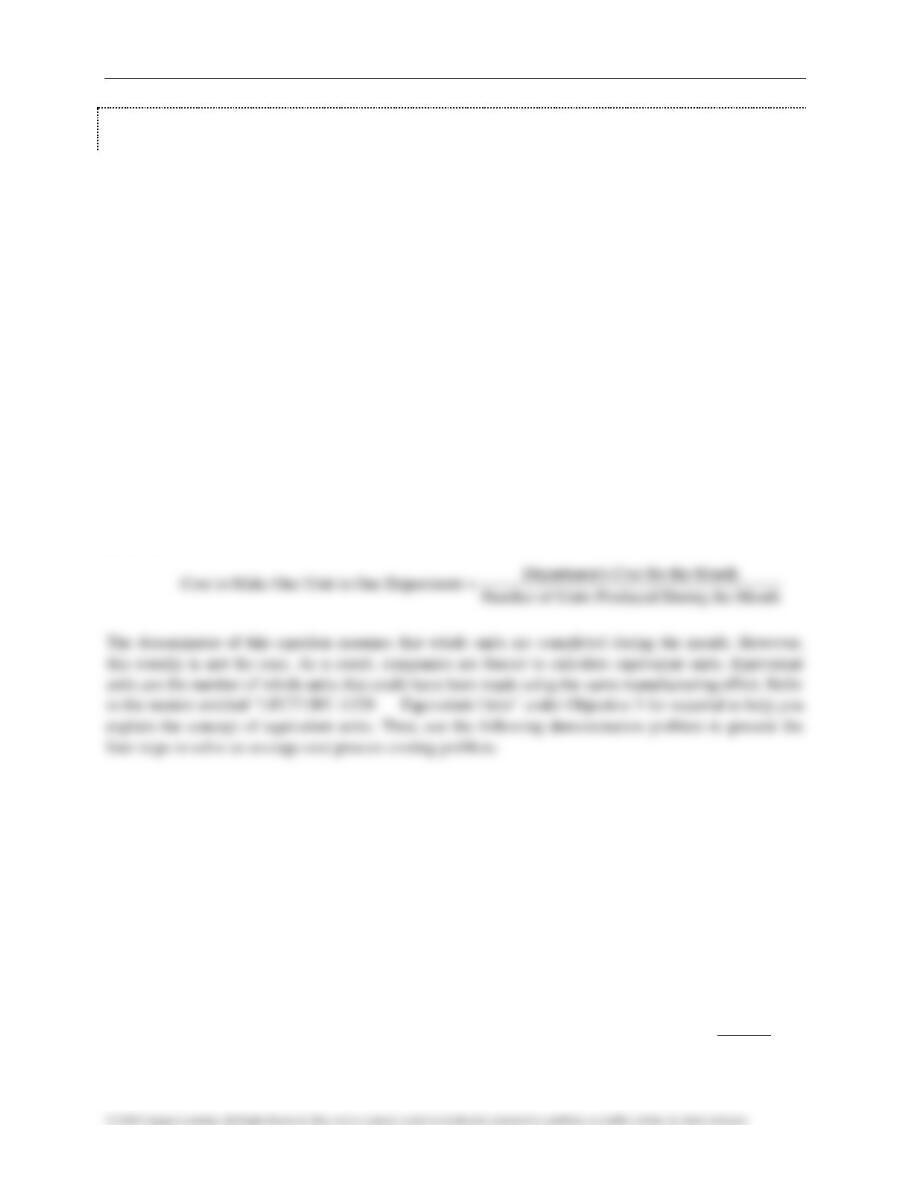
manufacture one unit of product as follows:
Cost to Make One Unit in One Department = Department’s Cost for the Month
Number of Units Produced During the Month
GROUP LEARNING ACTIVITY—Cost of Production Report
Divide the class into small groups. Ask them to use the information and calculations from the
demonstration problem in TM 18(3)-5 to prepare a cost of production report for Advanced Technologies’
LECTURE AID—Equivalent Units
The following scenario relates equivalent units to a common student dilemma.
Assume that you are taking four classes this term, and all four classes require a five-page paper. Of
course, when will these papers be due? (I’ve never had a class that didn’t immediately respond with the
following answer: the same day.) OK, if these papers are all due the same day, when will you start them?
(Once again, they always say: the night before they’re due.)
Assume that you write four pages on the first paper and run out of information. Then you write three
pages on the next paper and stop to watch a TV show. Next, you write two pages on the third paper before
you get too bored to continue. So you switch to the last paper and write one page before you fall asleep at
342 Chapter 18(3) Process Cost Systems
DEMONSTRATION PROBLEM—Process Costing, FIFO Method
The text presents the calculation of product costs under FIFO process costing as a four-step process. Use
the following facts to demonstrate process costing [also on TM 18(3)-5]. This information refers to
Advanced Technologies, the three-department computer manufacturer described on TM 18(3)-4.
The costs associated with production in assembly during April were as follows:
Cost of units in beginning work in process inventory $228,000
Cost of materials used in April 630,000
Cost of direct labor and overhead for April 527,000
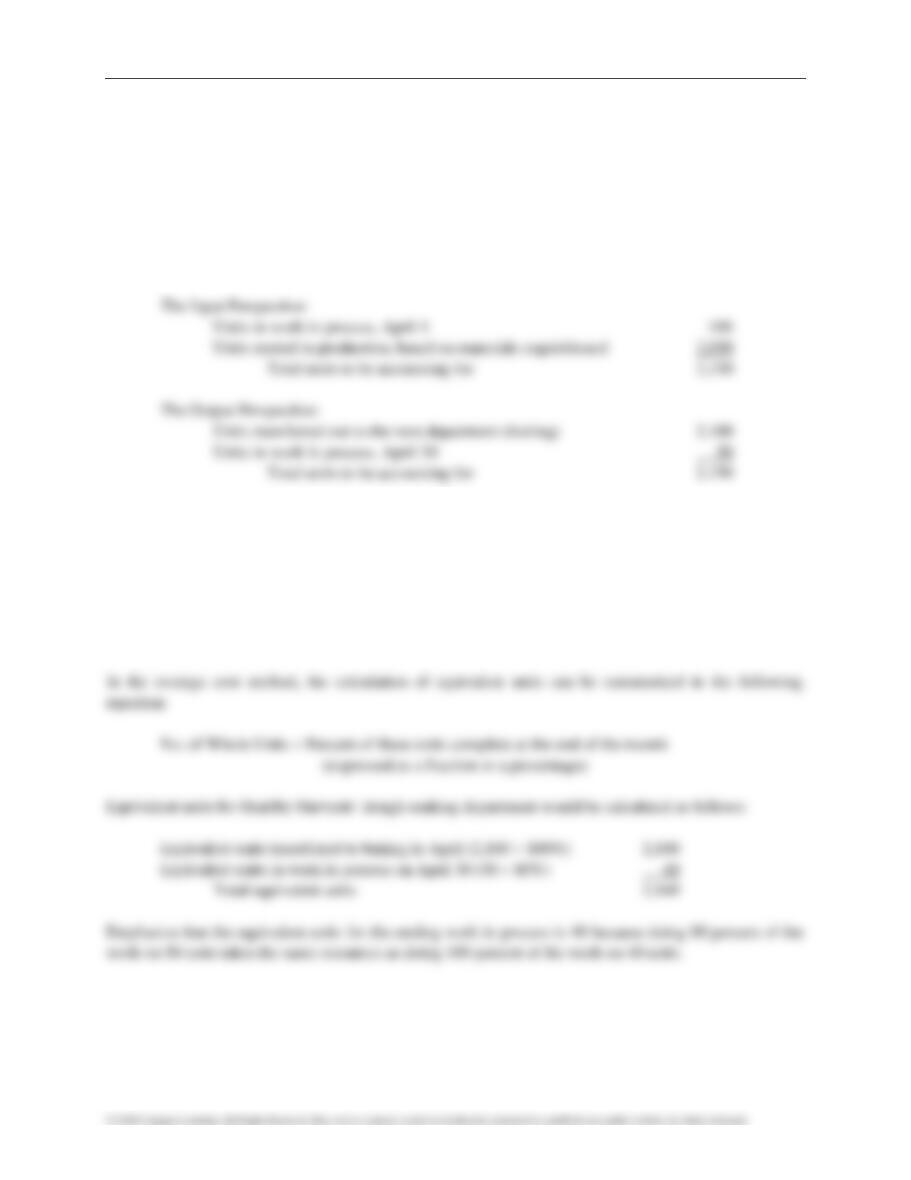
STEP 1: Determine the units to be assigned costs. Instruct students to begin by determining the total
number of units worked on in the assembly department during April plus the number of units in each of
the following three categories:
For example, Advanced Technologies worked on 3,800 units during April (the 800 in beginning work in
process plus the 3,000 units started this month.) There were 800 units in beginning work in process
inventory, 2,700 started and completed (3,000 started – 300 not completed) and 300 in ending work in
process inventory.
STEP 2: Calculate equivalent units of production. Since all materials are added by the assembly
department at the beginning of production, and conversion costs are added evenly throughout production,
equivalent units must be calculated separately for materials and conversion costs. Remind students that
conversion costs are the costs needed to “convert” raw materials to a finished product (labor and factory
overhead). The calculation of equivalent units can be summarized in the following equation:
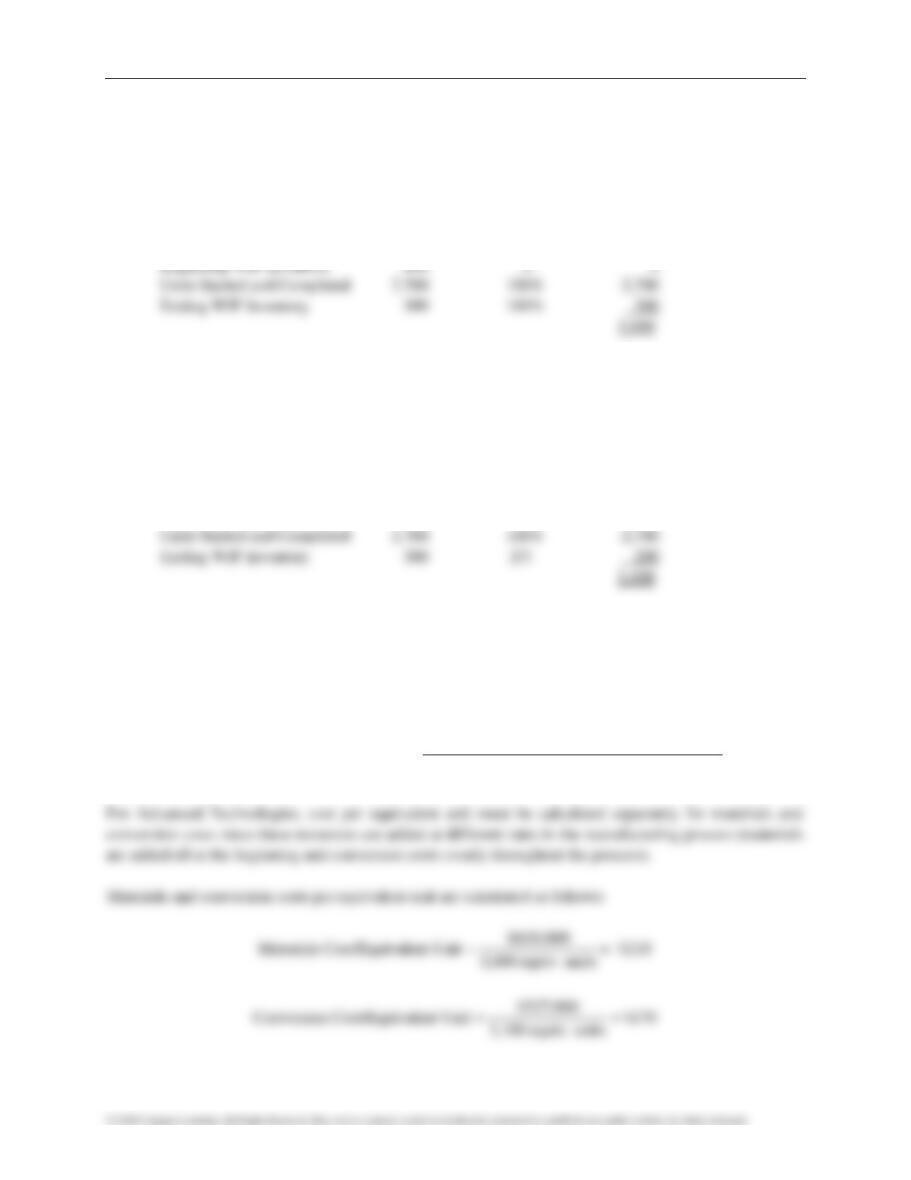
Chapter 18(3) Process Cost Systems 343
No. of Whole Units Amount of Work Put into the Units during the Month
(expressed as a fraction or a percentage)
Material equivalent units for Advanced Technologies’ assembly department would be calculated as
follows:
% Materials
Whole Units Added in April Equivalent Units
Emphasize that all materials are added at the beginning of production. Therefore, no materials are added
to the beginning work in process inventory, which was placed into production last month.
Conversion equivalent units for Advanced Technologies’ assembly department would be calculated as
follows:
% Conversion
Whole Units Added in April Equivalent Units
Beginning WIP Inventory 800 1/4 200
Emphasize that the percentage of completion can also be expressed as a fraction.
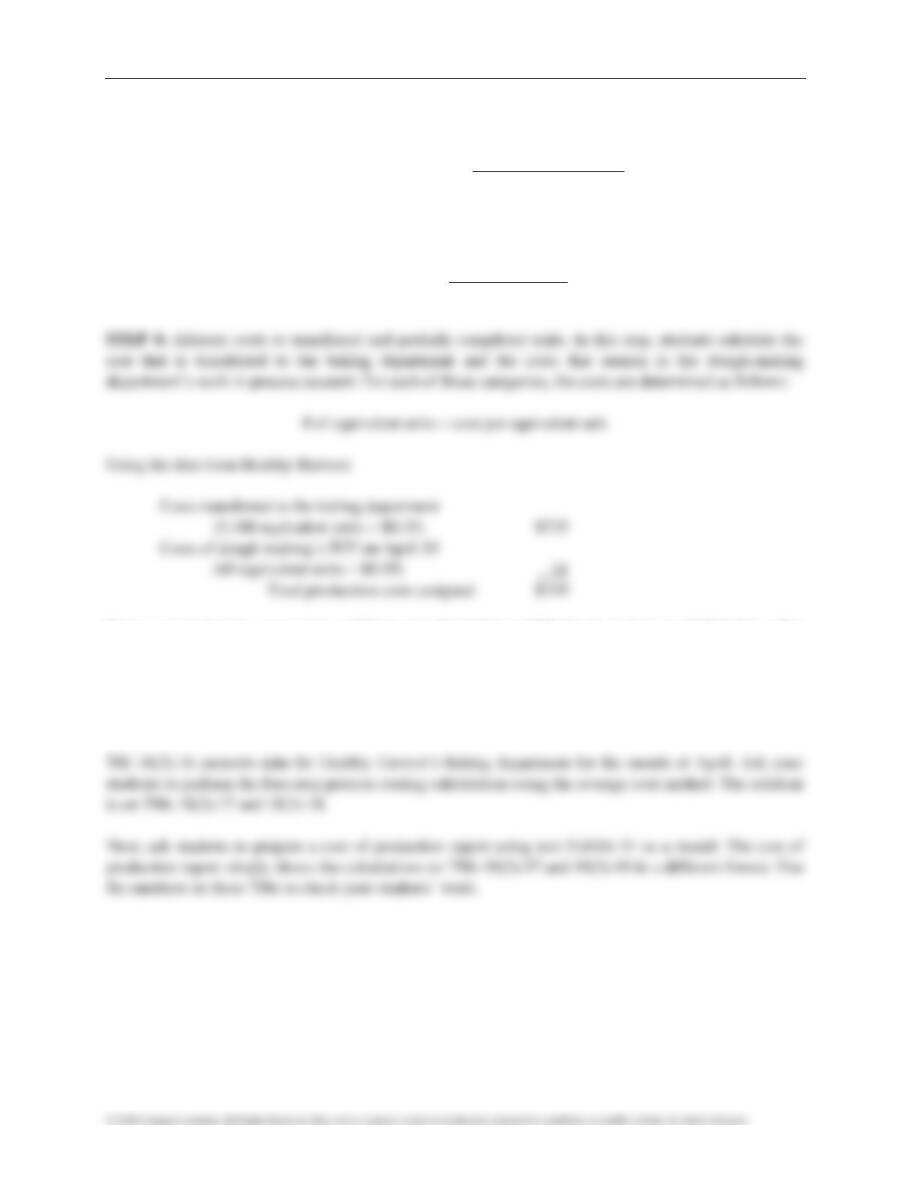
STEP 3: Determine the cost per equivalent unit. In order to determine the total cost to produce a unit, a
manufacturer must compute the materials cost and the conversion cost (labor and overhead) in a
completed unit. This amount is the cost per equivalent unit. The formula for this calculation is:
Costs Incurred During the Month
Cost per Equivalent Unit Equivalent Units Produced During the Month
=
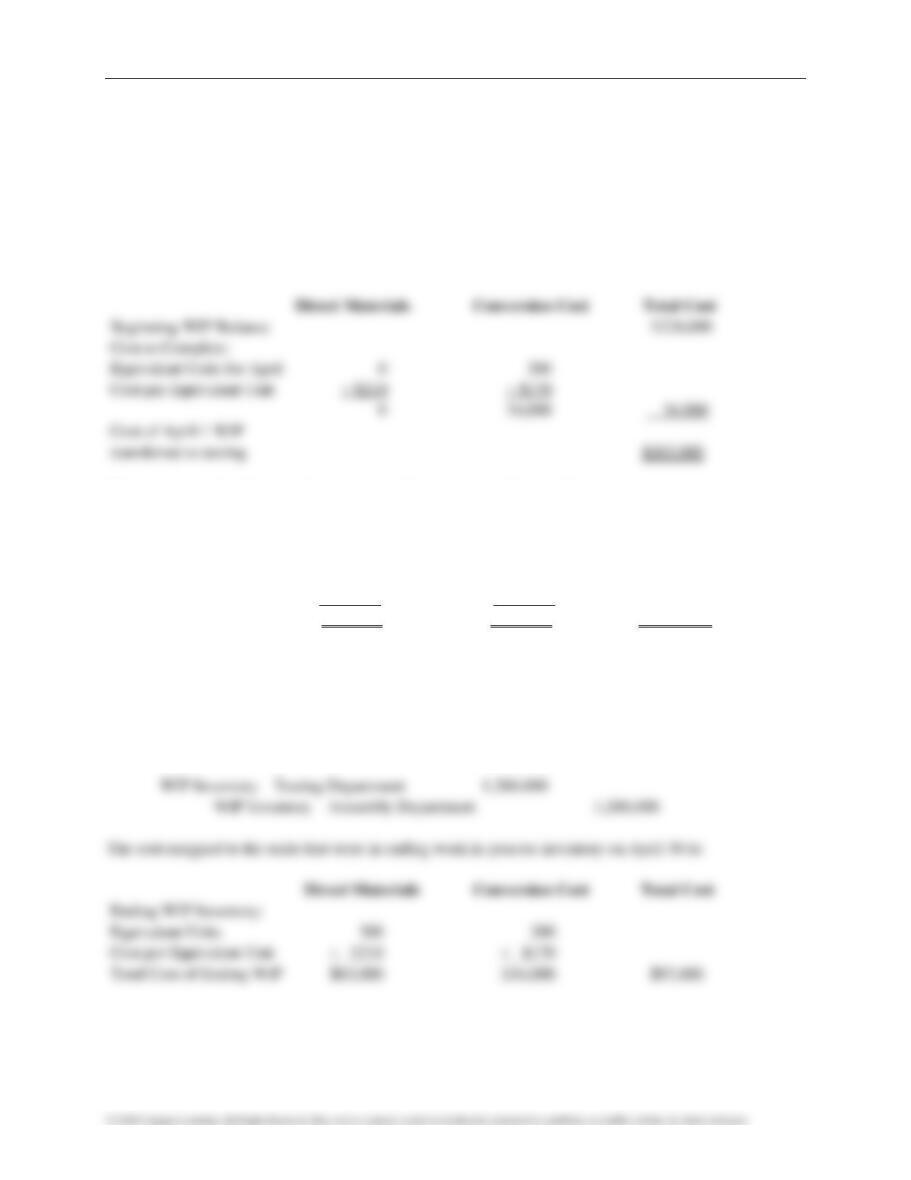
344 Chapter 18(3) Process Cost Systems
STEP 4: Allocate costs to transferred and partially completed units. After calculating the cost per
equivalent unit for materials and conversion costs, the cost of units completed and those still in process
must be determined. Stress that students will have the most success if they calculate the cost separately
for each category of units on the equivalent units’ schedule. The beginning work in process and started
and completed categories represent units that have been completed in assembly and transferred on to the
testing department. The ending work in process represents the units that have not been completed.
The cost assigned to the units that were in beginning work in process is:
The cost assigned to the units that were started and completed in April is:
Direct Materials Conversion Cost Total Cost
Started and Completed:
Equivalent Units 2,700 2,700
Cost per Equivalent Unit $210 $170
Cost of Units Started & $567,000 $459,000 $1,026,000
Completed in April
Remind students that the total cost of units completed and transferred to testing is $1,288,000 ($262,000 +
$1,026,000). This amount must be transferred from the work in process account for the assembly
department to the testing department’s work in process account. Note that the journal entry is covered in
Objective 3.
Chapter 18(3) Process Cost Systems 345
CLASS DISCUSSION—Process Costing
In the previous Demonstration Problem, all materials were introduced at the beginning of the production
process. Ask your students for other examples of materials that would be added at the start of production.
Additional ideas include soup broth for soup making, alumina for aluminum smelting, crude oil for
gasoline refining, or pulp for papermaking. Next ask your students for materials that would not be added
at the beginning of the manufacturing process. Examples include icing for cake baking, varnish for
making wood furniture, or packing material for any product delivered in a box.
GROUP LEARNING ACTIVITY—Process Costing with Transferred in Costs,
FIFO Method
The textbook illustrates process costing for the first department in a manufacturing process. End of
chapter problems also ask students to calculate product costs for departments that are second or third in
the manufacturing flow. Emphasize that all departments that receive units from prior departments also
OBJECTIVE 3
Journalize entries for transactions using a process cost system.
SYNOPSIS
Next, journal transactions are discussed as these product transfers need to be journalized. Materials are
purchased and the materials account is debited and Accounts Payable is credited. As the direct materials
are requisitioned, work in process accounts are debited and Materials is credited. When indirect materials
are requisitioned or other indirect expenses are recognized, factory overhead accounts are debited and
either Materials or other accounts are credited. Applied factory overhead is then charged to the
departments by debiting the department’s work in process account and crediting the same department’s
factory overhead account. When products are transferred from department to department, the receiving
department’s work in process account is debited and the transferring department’s work in process
account is credited. When the units are entirely complete, Finished Goods is debited and Work in
346 Chapter 18(3) Process Cost Systems
Process—Packaging is credited. After the product is sold, Cost of Goods Sold is debited and Finished
Goods is credited. These cost flows are shown in Exhibit 9.
Relevant Example Exercises and Exhibits
• Example Exercise 18(3)-7 Process Cost Journal Entries
• Exhibit 9 – Frozen Delight’s Cost Flows
SUGGESTED APPROACH
A process cost system requires only a few modifications to the journal entries illustrated for a job order
manufacturer in Chapter 17(2). These modifications are as follows:
1. Separate work in process accounts are maintained for each department.
3. To determine the cost of units transferred from one production department to the next department (or
to finished goods), equivalent units must be computed and costs assigned using the method illustrated
under Objective 2.
Refer students to the journal entries illustrated in the text. Stress that a cost of production report or four–
step process costing calculation must be prepared to determine the cost of units transferred to the various
departments and the cost of completed units transferred to finished goods.
OBJECTIVE 4
Describe and illustrate the use of cost of production reports for decision making.
SYNOPSIS
Using the cost of production reports, managers can track and analyze these costs over time. By
investigating the causes of increases or problems, managers can make decisions regarding efficiency and
improvement. In addition, managers are concerned about yield, computed as: yield = quantity of material
output/quantity of material input.
Key Terms and Definitions
• Yield – A measure of materials usage efficiency.
Chapter 18(3) Process Cost Systems 347
Relevant Example Exercises and Exhibits
• Example Exercise 18(3)-8 Using Process Costs for Decision Making
SUGGESTED APPROACH
The objective in this section is to move the students from preparing cost reports to using them for
decision making. A manufacturing cost system provides the user with a database of cost information. This
database can be used to segment cost data in a number of ways, such as by product, by process, by
You may also want to point out that the cost of production report illustrated in the text is highly
summarized. In a real-world setting, each significant material and energy input would be individually
identified. In most cases, conversion costs are not lumped together but would be individually identified as
well.
GROUP LEARNING ACTIVITY—Decision Making Exercise
Provide students with Handout 18(3)-1. This handout describes a situation where material costs have been
OBJECTIVE 5
Compare just-in-time processing with traditional manufacturing processing.
SYNOPSIS
The objective of most manufacturers is to produce goods with high quality, low cost, and instant
availability. Just–in-time processing is an approach that focuses on reducing time and cost and eliminating
poor quality. The traditional manufacturing process is streamlined, waiting time is eliminated, workers
become multifunctional, and inventories are reduced when using JIT methods.
Key Terms and Definitions
• Just-in-Time (JIT) Processing – A processing approach that focuses on eliminating time, cost,
and poor quality within manufacturing and nonmanufacturing processes.
348 Chapter 18(3) Process Cost Systems
Relevant Example Exercises and Exhibits
SUGGESTED APPROACH
Just-in-time (JIT) manufacturing is not just a method of reducing inventory. It is embraced as a
philosophy that emphasizes eliminating waste from all processes. Inventory is simply a buffer that
protects a process against unreliability (such as poor supplier delivery or machinery that breaks down
frequently). Reducing inventory levels without correcting the problems that create unreliability will stop
production. Constructing a reliable system will eliminate the need for an inventory buffer.
Emphasize that the employee involvement in a JIT system also implies employee accountability.
Employees cannot be either involved or accountable without information. If employees are to be
IN-CLASS SIMULATION—Just–in-Time Manufacturing
Just-in-time is essentially a demand-pull system. Products are not made until they are needed by the
customer, and component parts are not made until they are needed by the next stage of production. Just–
in-time significantly reduces inventories, allowing manufacturers to reduce costs incurred in moving and
storing inventory. Just-in-time also emphasizes quality.
You can simulate the difference between the traditional push system and the demand-pull system of just-
in-time in your classroom. You will need scrap paper, four pens, a stapler, and six volunteers. Divide the
scrap paper between two volunteers. Instruct one student to write an “A” on his or her pieces of paper,
Chapter 18(3) Process Cost Systems 349
immediately. Therefore, any work in process will need to be scrapped. Count the scrapped sheets. Allow
your students to work for another 30 seconds. Ask your customer to count the completed products he or
she received.
Run this simulation a second time, but this time institute a demand-pull system. Instruct all workers that
they are not to make a new product (or component) until it is needed for the next stage of production.
Also ask them to focus on quality, not quantity. In addition, physically move the students who are writing
letters close enough to the student stapling the papers so that an expediter is not needed to move the
papers from one station to the next. Allow your students to work for 30 seconds. After that time, stop
production, announce another ink color change, and collect any work in process as scrap. Start up the
production line again for another 30 seconds. Ask your customer to count the completed products
received.
You should find that the number of completed units is about the same under either system. However, the
amount of scrap will be dramatically reduced under the just–in-time system. In addition, you may want to
ask your customer to compare the quality of the output. It should be significantly higher under the second
simulation.
LECTURE AID—Value-Added versus Non-Value-Added
Each activity performed by an organization creates cost. If the activity does not create any value for the
customer, its cost represents wasted resources and it can be labeled as “non-value-added.” Since one of
the goals of a JIT system is to eliminate waste, non-value-added activities should be identified and
eliminated, if possible.
The following questions can aid students in determining if an activity is value-added or non-value-added.
1. Given a choice, would the customer pay for this activity?
A “yes” answer to questions 1 or 2 indicates a value–added activity. A “yes” answer to questions 3, 4, or 5
indicates a non-value-added activity.
350 Chapter 18(3) Process Cost Systems
APPENDIX—AVERAGE COST METHOD
SYNOPSIS
The appendix illustrates how the average cost method affects the cost of production report. It is completed
in four steps: (1) determine units to be assigned costs, (2) compute equivalent units of production, (3)
determine cost per equivalent unit, and (4) allocate costs to transferred out and partially complete units.
Compare Exhibits 8 and 12 to see how the average cost method changes to amounts allocated to
equivalent units.
Relevant Example Exercises and Exhibits
• Exhibit 12 – Cost of Production Report for S&W’s Mixing Department—Average Cost
SUGGESTED APPROACH
If you are going to present only the average cost method of process costing, you will want to start by
thoroughly explaining the need for equivalent units. Begin by using TM 18(3)-3 to illustrate that each
department in a process costing system can compute the cost to manufacture one unit of product as
follows:
DEMONSTRATION PROBLEM—Process Costing, Average Cost Method
Use the following facts to demonstrate process costing [also on TM 18(3)-15].
Healthy Harvest Company is a bakery that makes breads. The manufacturing department is organized into
three departments: dough making, baking, and packaging. The following information is related to the
dough making department:
Cost data for the month of April:
Work in process inventory, April 1 (100 units, 40 percent complete) $ 49.00
Direct materials cost (for 2,050 units) 400.00
Direct labor cost 80.00
Factory overhead applied 220.00
Total production costs $749.00
Chapter 18(3) Process Cost Systems 351
Unit data:
Units transferred to baking in April 2,100
Units in work in process on April 30 (80 percent complete) 50
STEP 1: Determine the units to be assigned costs. In this step, students determine the total number of
units worked on in the dough-making department during April from both an “Input” and an “Output”
perspective.
In reality, the preceding calculations only use the numbers identified under the “Output” perspective.
STEP 2: Calculate equivalent units of production. In the textbook problems and exercises based on the
chapter appendix, students must assume that materials and conversion costs are added evenly throughout
production. Therefore, only one equivalent unit calculation is required. If you have not covered the FIFO
method, students won’t be expecting two equivalent unit calculations (one for materials and one for
conversion costs), so you won’t even need to mention this assumption.
352 Chapter 18(3) Process Cost Systems
STEP 3: Determine the cost per equivalent unit. The formula for this calculation is:
Total Production Costs
Cost per Equivalent Unit Total Equivalent Units
=
Continuing with the data for Healthy Harvest, the cost per equivalent unit is:
$749
Cost/Equivalent Unit $0.35
2,140 equiv. units
==
From a journal entry perspective, $735 is transferred from WIP-dough making to WIP-baking. The
balance remaining in WIP-dough making after this entry is posted would be $14.
GROUP LEARNING ACTIVITY—Process Costing Using the Average Cost
Method
Handout 18(3)-1
Decision Making Using Process Cost Data
Hall Company produces synthetic materials from a chemical extrusion processes. Management
has been concerned that material costs per pound are too high. Hall produces only a single
product on four separate extrusion lines. The product is processed over two shifts per day. The
following data have been collected for analysis:
January
Total materials costs ………………………………………………………………… $335,050
Total number of pounds produced ……………………………………………… 50,400
Cost per pound ……………………………………………………………………….. $6.65
Materials Costs by Production Line
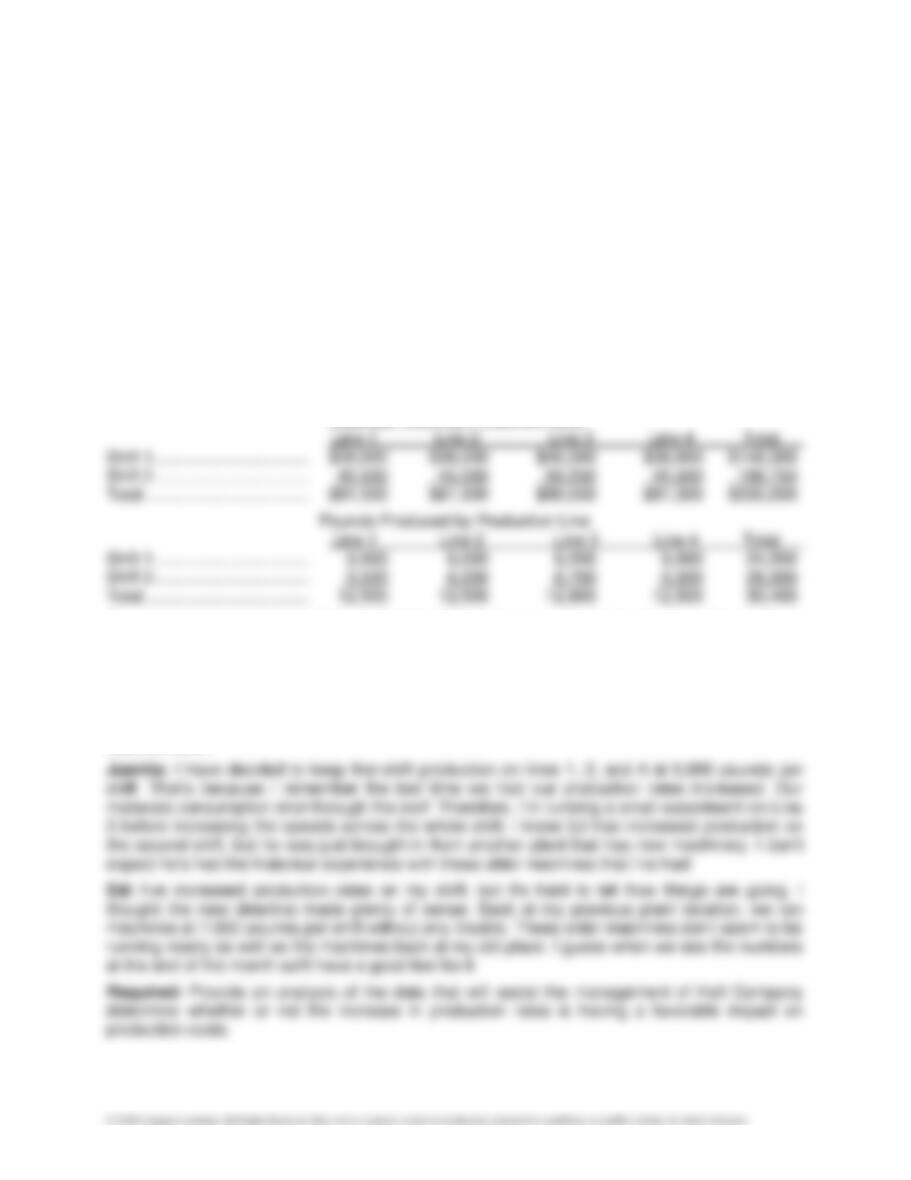
Assume you have interviewed the following individuals in an attempt to discover the problems
causing material costs to be inflated: Juanita Marcos, shift 1 supervisor; Ed Curcek, shift 2
supervisor; and Hal Bundy, plant manager. A summary of their responses are given below.
Hal: I just received a directive from headquarters to increase my production rates. I talked to Ed
and Juanita about kicking up our production from our old average of 6,000 pounds per shift.
Juanita did not seem to think that this was a good idea. My bet is that our problems are with
Juanita’s shift.
PR 2A Cost of production report 2,4 Moderate 1.5 hours Analytics Measurement Process Costing Application x
PR 3A Equivalent units and related costs; cost of production report; entries 2,3,4 Challenging 1.5 hours Analytics Measurement Process Costing Application x x
PR 5A Cost of production report: average cost method Appendix Moderate 1 hours Analytics Measurement Process Costing Application x
PR 1B Entries for process cost system 1,3 Moderate 1.5 hours Analytics Measurement Process Costing Application x x
PR 2B Cost of production report 2,4 Moderate 1.5 hours Analytics Measurement Process Costing Application x
PR 3B Equivalent units and related costs; cost of production report; entries 2,3,4 Challenging 1.5 hours Analytics Measurement Process Costing Application x x
PR 5B Cost of production report: average cost method Appendix Moderate 1 hours Analytics Measurement Process Costing Application x
Type Item Description LO(s) Difficulty Time Est BUSPROG AICPA ACBSP – APC Bloom’s EE Excel GL SMH FAI Service Real World Writing Ethics Internet Group
DQ 1 1 Easy 5 min. Analytics Measurement Process Costing Knowledge
DQ 2 1 Easy 5 min. Analytics Measurement Process Costing Knowledge
DQ 3 1 Easy 5 min. Analytics Measurement Process Costing Knowledge
DQ 4 2 Easy 5 min. Analytics Measurement Process Costing Knowledge
DQ 5 2 Easy 5 min. Analytics Measurement Process Costing Knowledge
DQ 6 3 Easy 5 min. Analytics Measurement Process Costing Knowledge
DQ 7 4 Easy 5 min. Analytics Measurement Process Costing Knowledge
DQ 8 4 Easy 5 min. Analytics Measurement Process Costing Knowledge
DQ 9 4 Easy 5 min. Analytics Measurement Process Costing Knowledge
DQ 10 5 Easy 5 min. Analytics Measurement Process Costing Knowledge
PE 1A Job order versus process costing 1 Easy 5 min. Analytics Measurement Process Costing Knowledge x
PE 1B Job order versus process costing 1 Easy 5 min. Analytics Measurement Process Costing Knowledge x
PE 2A Units to be assigned costs 2 Easy 5 min. Analytics Measurement Process Costing Application x
PE 2B Units to be assigned costs 2 Easy 5 min. Analytics Measurement Process Costing Application x
PE 3A Equivalent units of materials cost 2 Easy 5 min. Analytics Measurement Process Costing Application x
PE 3B Equivalent units of materials cost 2 Easy 5 min. Analytics Measurement Process Costing Application x
PE 4A Equivalent units of conversion costs 2 Easy 5 min. Analytics Measurement Process Costing Application x
PE 4B Equivalent units of conversion costs 2 Easy 5 min. Analytics Measurement Process Costing Application x
PE 5A Cost per equivalent unit 2 Easy 5 min. Analytics Measurement Process Costing Application x
PE 5B Cost per equivalent unit 2 Easy 5 min. Analytics Measurement Process Costing Application x
PE 6A Cost of units transferred out and ending work in process 2 Easy 10 min. Analytics Measurement Process Costing Application x
PE 6B Cost of units transferred out and ending work in process 2 Easy 10 min. Analytics Measurement Process Costing Application x
PE 7A Process cost journal entries 3 Easy 10 min. Analytics Measurement Process Costing Application x
PE 7B Process cost journal entries 3 Easy 10 min. Analytics Measurement Process Costing Application x
PE 8A Using process costs for decision making 4 Easy 5 min. Analytics Measurement Process Costing Application x
PE 8B Using process costs for decision making 4 Easy 5 min. Analytics Measurement Process Costing Application x
EX 1 Entries for materials cost flows in a process cost system 1,3 Easy 5 min. Analytics Measurement Process Costing Knowledge x
EX 2 Flowchart of accounts related to service and processing departments 1 Easy 5 min. Analytics Measurement Process Costing Knowledge x
EX 3 Entries for flow of factory costs for process cost system 1,3 Easy 10 min. Analytics Measurement Process Costing Application x x
EX 4 Factory overhead rate, entry for applying factory overhead, and factory overhead account balance 1,3 Easy 10 min. Analytics Measurement Process Costing Application x
EX 5 Equivalent units of production 2 Easy 5 min. Analytics Measurement Process Costing Application x
EX 6 Equivalent units of production 2 Moderate 15 min. Analytics Measurement Process Costing Application x
EX 7 Equivalent units of production 2 Moderate 15 min. Analytics Measurement Process Costing Application x
EX 8 Costs per equivalent unit 2,4 Moderate 30 min. Analytics Measurement Process Costing Application x
EX 9 Equivalent units of production 2 Moderate 10 min. Analytics Measurement Process Costing Application x
EX 10 Costs per equivalent unit 2 Moderate 15 min. Analytics Measurement Process Costing Application x
EX 11 Equivalent units of production and related costs 2 Moderate 15 min. Analytics Measurement Process Costing Application x x
EX 12 Cost of units completed and in process 2,4 Moderate 30 min. Analytics Measurement Process Costing Application x
EX 13 Errors in equivalent unit computation 2 Moderate 20 min. Analytics Measurement Process Costing Application
EX 14 Cost per equivalent unit 2 Moderate 15 min. Analytics Measurement Process Costing Application x
EX 15 Costs per equivalent unit and production costs 2,4 Moderate 30 min. Analytics Measurement Process Costing Application
EX 16 Cost of production report 2,4 Moderate 20 min. Analytics Measurement Process Costing Application x
EX 17 Cost of production report 2,4 Moderate 20 min. Analytics Measurement Process Costing Application
EX 18 Cost of production and journal entries 1,2,3,4 Moderate 30 min. Analytics Measurement Process Costing Application
EX 19 Cost of production and journal entries 1,2,3 Moderate 20 min. Analytics Measurement Process Costing Application
EX 20 Process costing for a service company 4 Moderate 20 min. Analytics Measurement Process Costing Application x
EX 21 Decision making 4 Moderate 20 min. Analytics Measurement Process Costing Analysis x x
EX 22 Decision making 4 Moderate 20 min. Analytics Measurement Process Costing Evaluation x
EX 23 Lean manufacturing 5 Moderate 20 min. Analytics Measurement Process Costing Analysis x
EX 24 Equivalent units of production: average cost method Appendix Easy 20 min. Analytics Measurement Process Costing Application
EX 25 Equivalent units of production: average cost method Appendix Moderate 20 min. Analytics Measurement Process Costing Application
EX 26 Equivalent units of production: average cost method Appendix Moderate 20 min. Analytics Measurement Process Costing Application
EX 27 Equivalent units of production and related costs Appendix Moderate 30 min. Analytics Measurement Process Costing Application x
EX 28 Cost per equivalent unit: average cost method Appendix Moderate 20 min. Analytics Measurement Process Costing Application
EX 29 Cost of production report: average cost method Appendix Moderate 20 min. Analytics Measurement Process Costing Application
EX 30 Cost of production report: average cost method Appendix Moderate 20 min. Analytics Measurement Process Costing Application x
PR 1A Entries for process cost system 1,3 Moderate 1.5 hours Analytics Measurement Process Costing Application x x
HOMEWORK CHART WITH LEARNING OUTCOMES TAGGING
TAGGING
RESOURCES
FOCUS