CHAPTER 18 Process Cost Systems
Prob. 18–2B (FIN MAN); Prob. 3–2B (MAN) (Concluded)
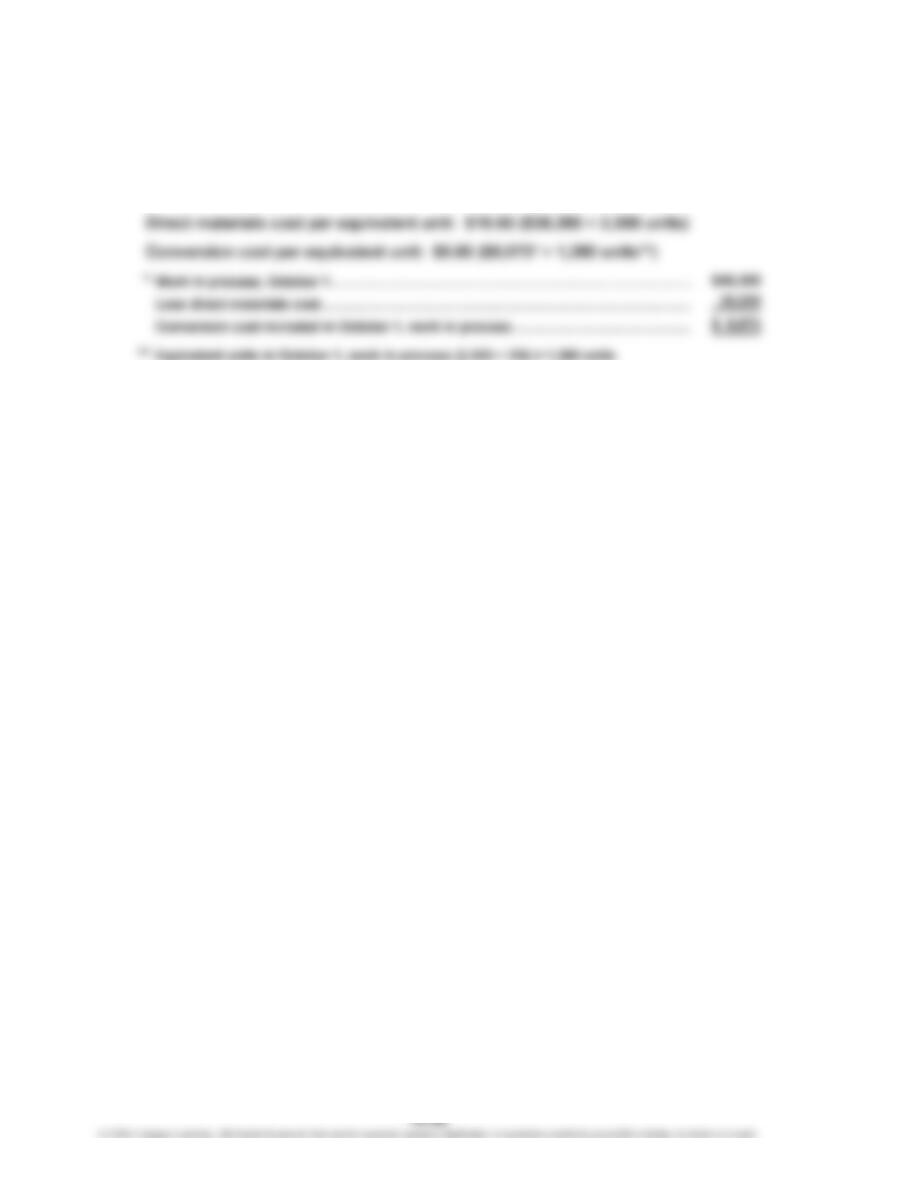
2. Direct materials: Decrease of $0.15 ($16.50 – $16.65)
Conversion: Increase of $0.15 ($6.00 – $5.85)
Computations:
CHAPTER 18 Process Cost Systems
Prob. 18–3B (FIN MAN); Prob. 3–3B (MAN)
1.
Whole Direct
UNITS Units Materials Conversion
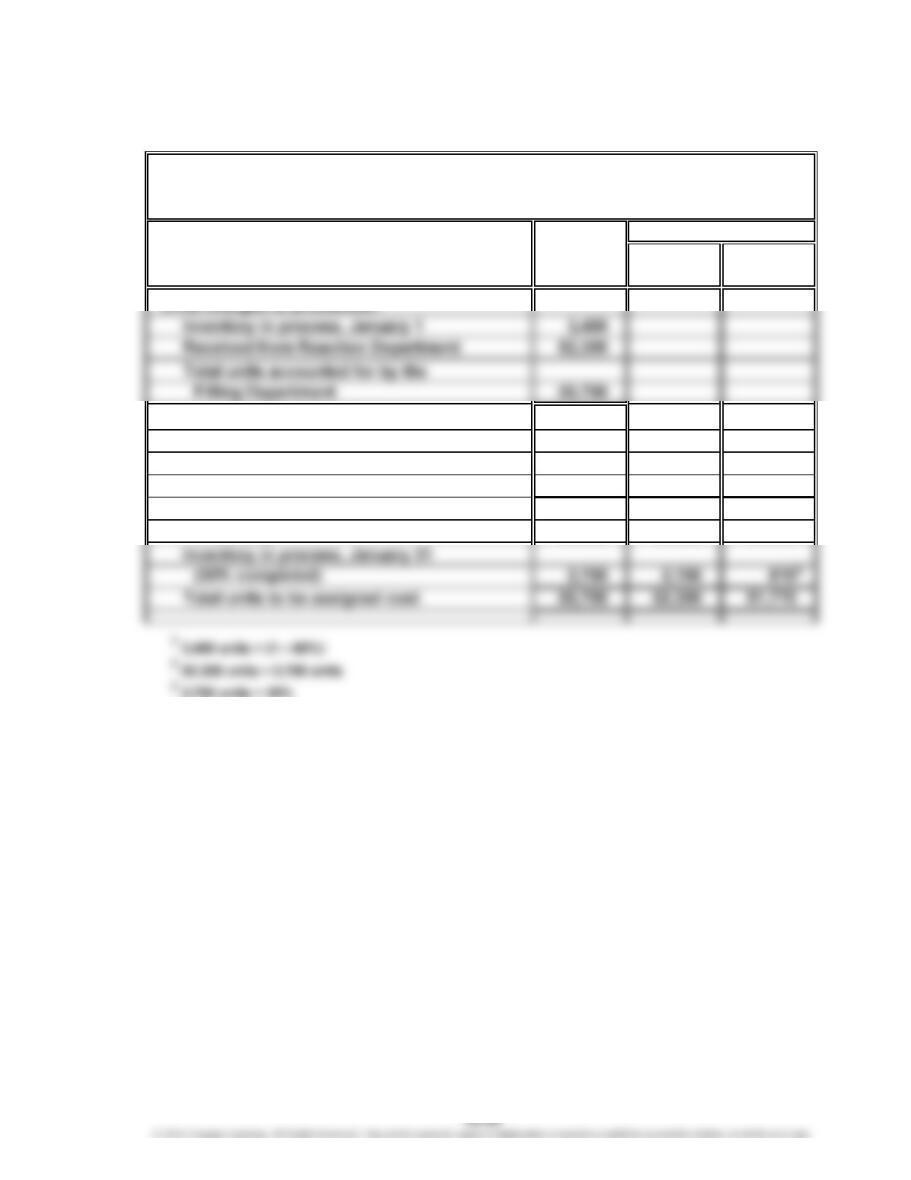
Units charged to production:
Units to be assigned cost:
Inventory in process, January 1
(60% completed) 3,400 01,360
Started and completed in January 49,600 49,600 49,600
Transferred to finished goods
in January 53,000 49,600 50,960
DOVER CHEMICAL COMPANY
Cost of Production Report—Filling Department
For the Month Ended January 31, 2016
Equivalent Units
1
2
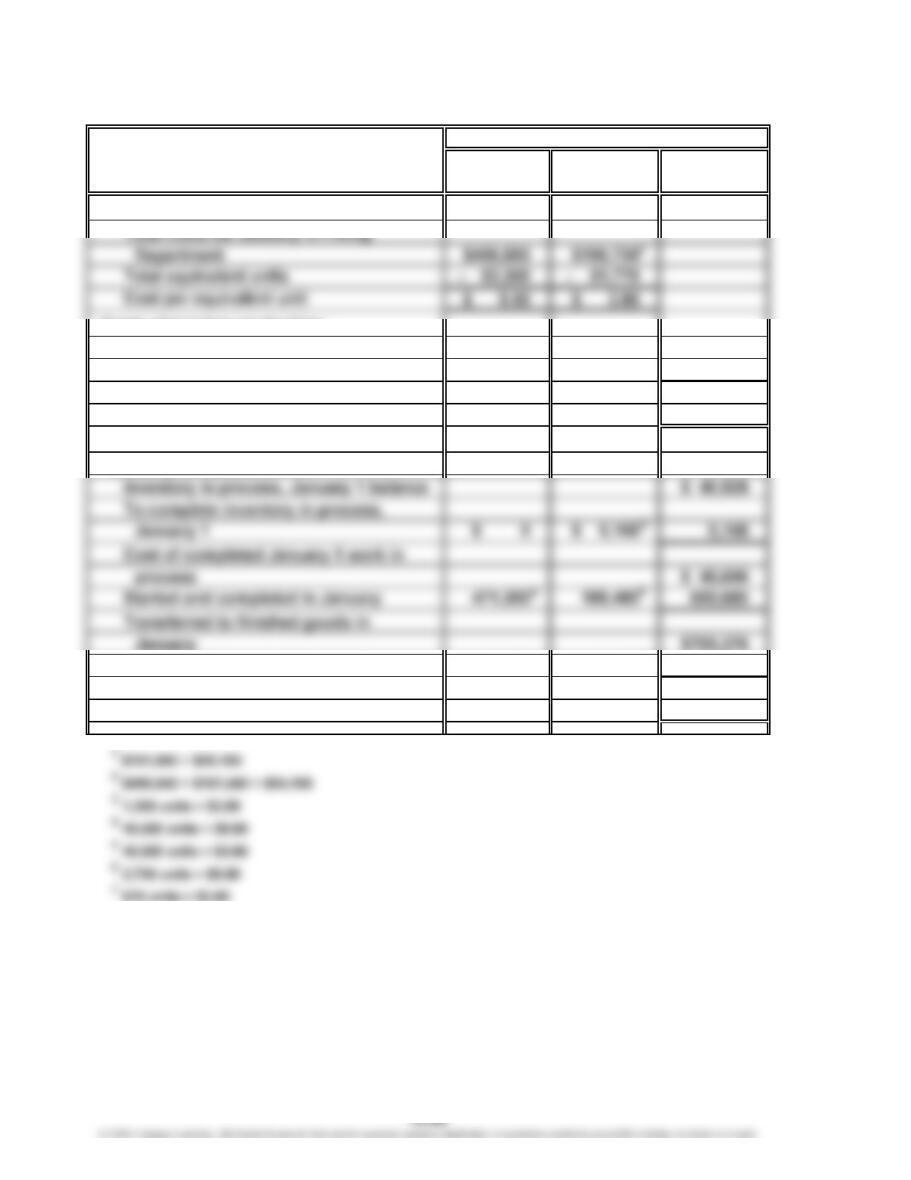
CHAPTER 18 Process Cost Systems
Prob. 18–3B (FIN MAN); Prob. 3–3B (MAN) (Continued)
Direct
COSTS Materials Conversion Total
Costs per equivalent unit:
Costs charged to production:
Inventory in process, January 1 $ 40,528
Costs incurred in January 693,576
Total costs accounted for by the
Filling Department $734,104
Cost allocated to completed and
partially completed units:
Inventory in process, January 31 25,650 3,078 28,728
Total costs assigned by the Filling
Department $734,104
Costs
2
67
CHAPTER 18 Process Cost Systems
Prob. 18–3B (FIN MAN); Prob. 3–3B (MAN) (Concluded)
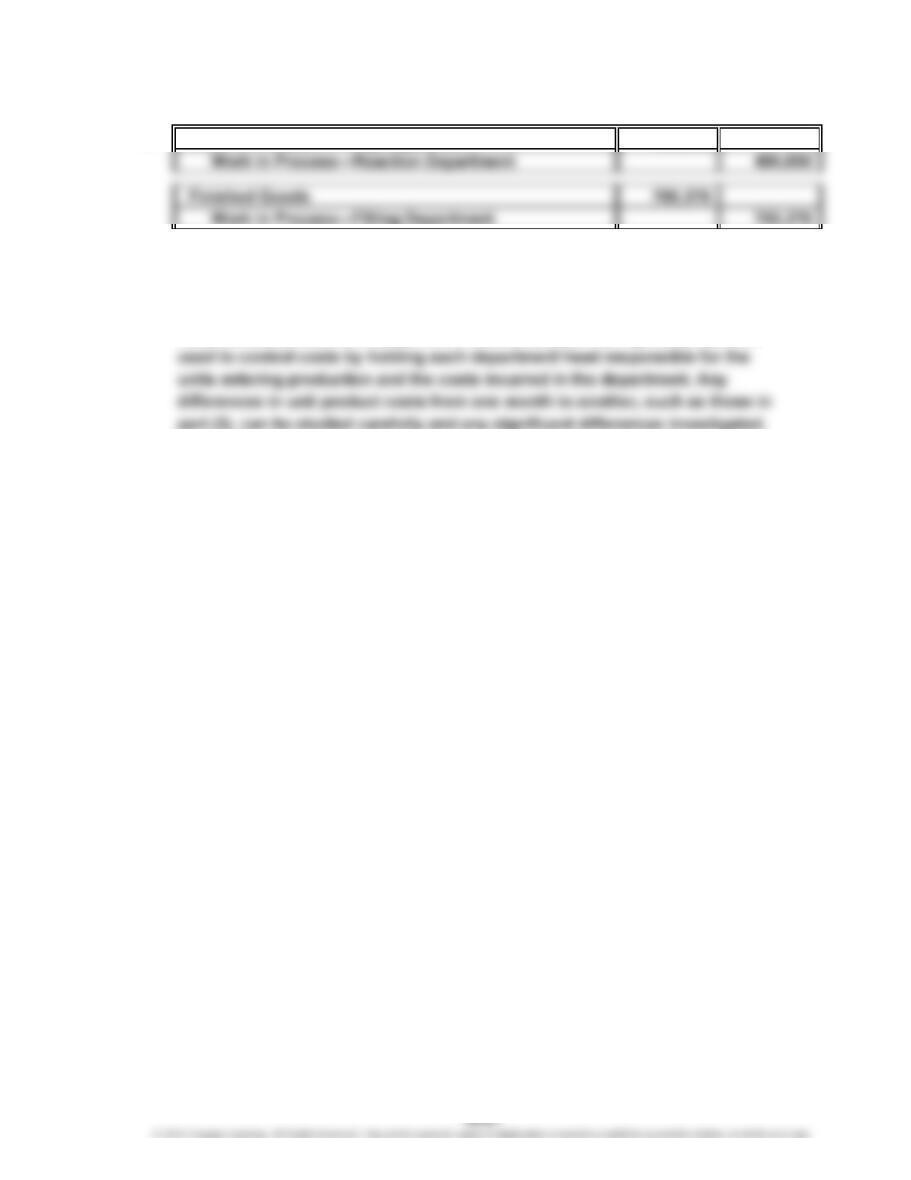
2. Work in Process—Filling Department 496,850
3. Direct materials: –$0.08 decrease ($9.50 – $9.58)
Conversion: –$0.10 decrease ($3.80 – $3.90)
4. The cost of production report may be used as the basis for allocating product
costs between Work in Process and Finished Goods. The report can also be
CHAPTER 18 Process Cost Systems
Prob. 18–4B (FIN MAN); Prob. 3–4B (MAN)
1. and 2.
$16.00/unit 462,400 508,225
30 Direct labor 158,920 667,145
$16.50/unit 511,500 577,852
31 Direct labor 162,850 740,702
Balance
Work in Process—Rolling
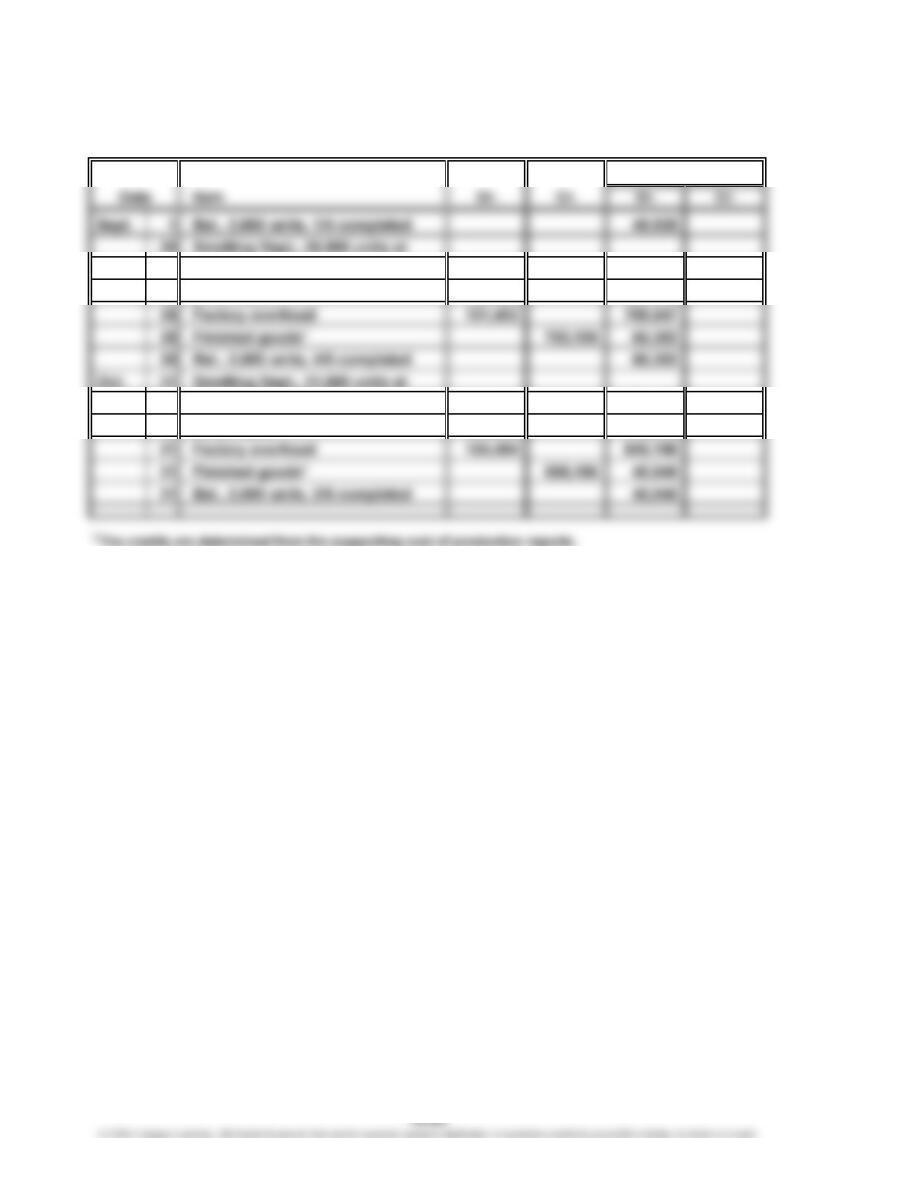
CHAPTER 18 Process Cost Systems
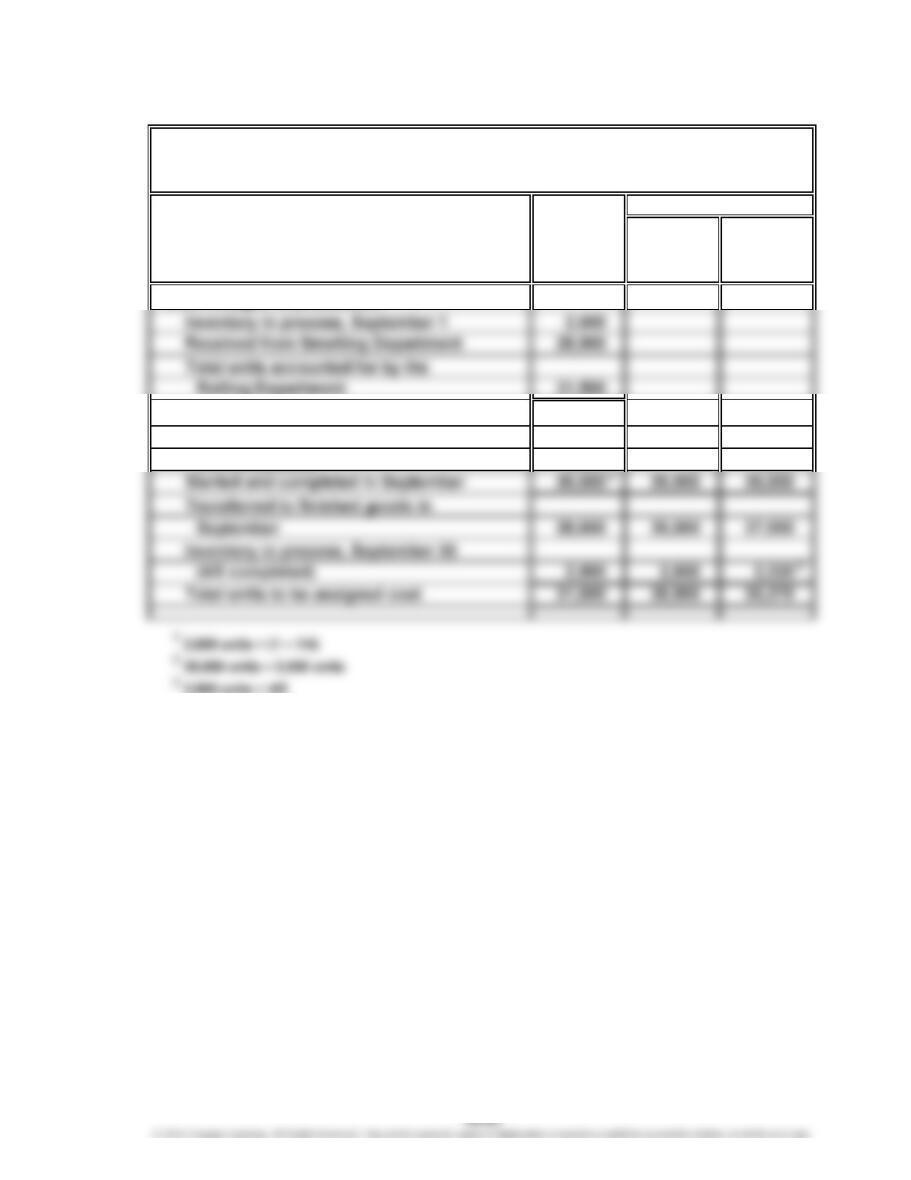
Prob. 18–4B (FIN MAN); Prob. 3–4B (MAN) (Continued)
Whole Direct
UNITS Units Materials Conversion
(a) (a)
Units charged to production:
Rolling Department 31,500
Units to be assigned cost:
Inventory in process, September 1
(1/4 completed) 2,600 01,950
PITTSBURGH ALUMINUM COMPANY
Cost of Production Report—Rolling Department
For the Month Ended September 30, 2016
Equivalent Units
1
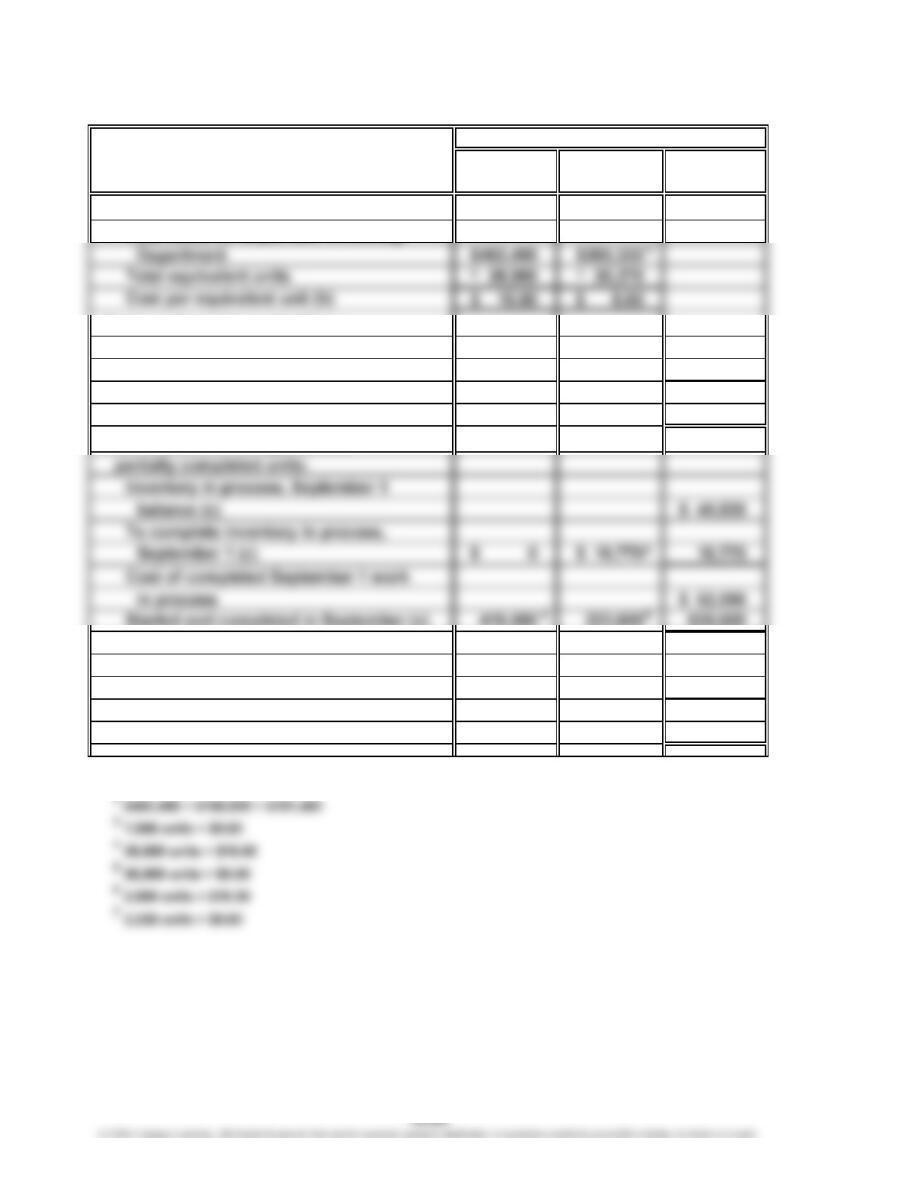
CHAPTER 18 Process Cost Systems
Prob. 18–4B (FIN MAN); Prob. 3–4B (MAN) (Continued)
Direct
COSTS Materials Conversion Total
Costs per equivalent unit:
Total costs for September in Rolling
Costs assigned to production:
Inventory in process, September 1 $ 45,825
Costs incurred in September 722,722
Total costs accounted for by the
Rolling Department $768,547
Cost allocated to completed and
Transferred to finished goods
in September (c) $702,195
Inventory in process, September 30 (d) 46,400 19,952 66,352
Total costs assigned by the Rolling
Department $768,547
1
$158,920 + $101,402
Costs
2
67
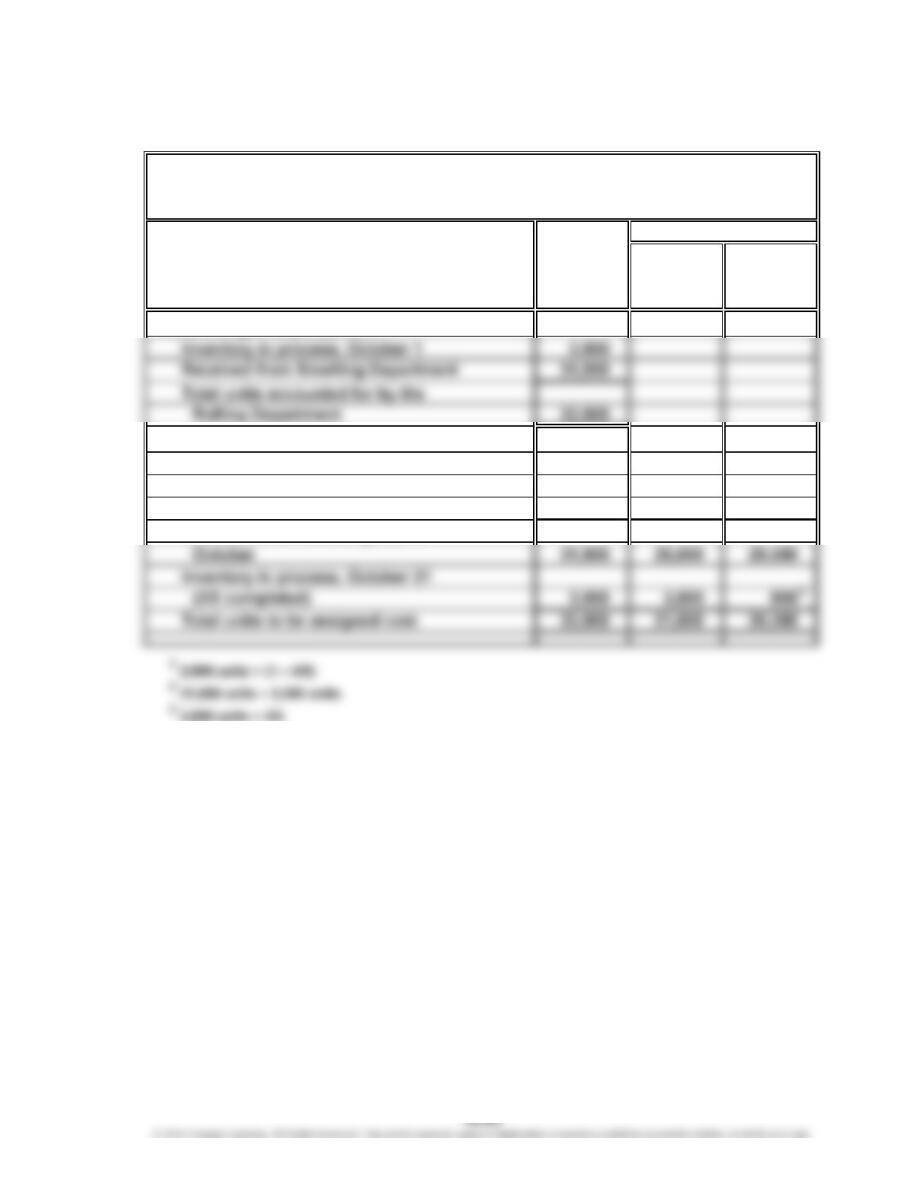
CHAPTER 18 Process Cost Systems
Prob. 18–4B (FIN MAN); Prob. 3–4B (MAN) (Continued)
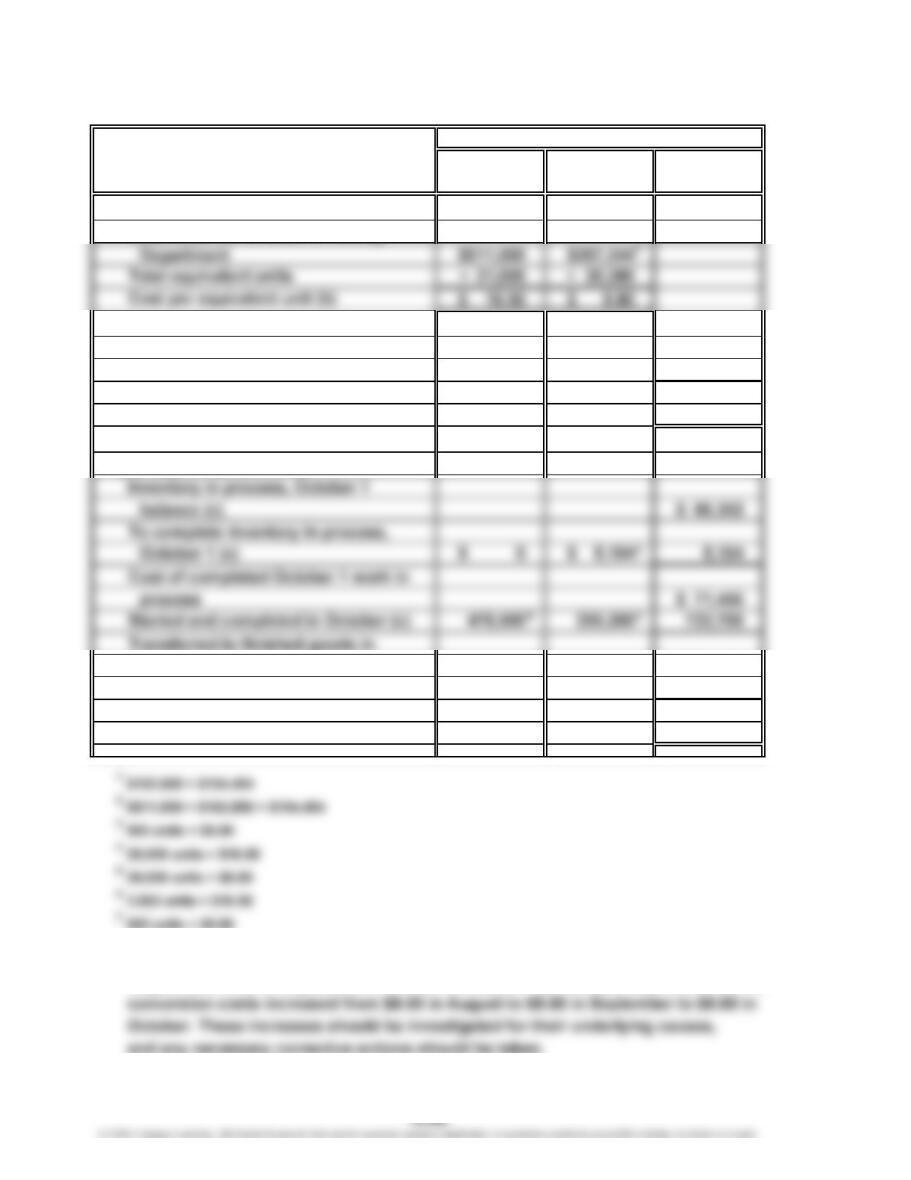
2.
Whole Direct
UNITS Units Materials Conversion
(a) (a)
Units charged to production:
Units to be assigned cost:
Inventory in process, October 1
(4/5 completed) 2,900 0580
Started and completed in October 29,000 29,000 29,000
Transferred to finished goods in
PITTSBURGH ALUMINUM COMPANY
Cost of Production Report—Rolling Department
For the Month Ended October 31, 2016
Equivalent Units
1
2
CHAPTER 18 Process Cost Systems
Prob. 18–4B (FIN MAN); Prob. 3–4B (MAN) (Concluded)
Direct
COSTS Materials Conversion Total
Costs per equivalent unit:
Total costs for October in Rolling
Costs charged to production:
Inventory in process, October 1 $ 66,352
Costs incurred in October 778,844
Total costs accounted for by the
Rolling Department $845,196
Cost allocated to completed and
partially completed units:
October (c) $805,156
Inventory in process, October 31 (d) 33,000 7,040 40,040
Total costs assigned by the Rolling
Department $845,196
3. The cost per equivalent unit for direct materials increased from $15.50 in
August to $16.00 in September to $16.50 in October. The cost per equivalent unit for
Costs
2
67
CHAPTER 18 Process Cost Systems
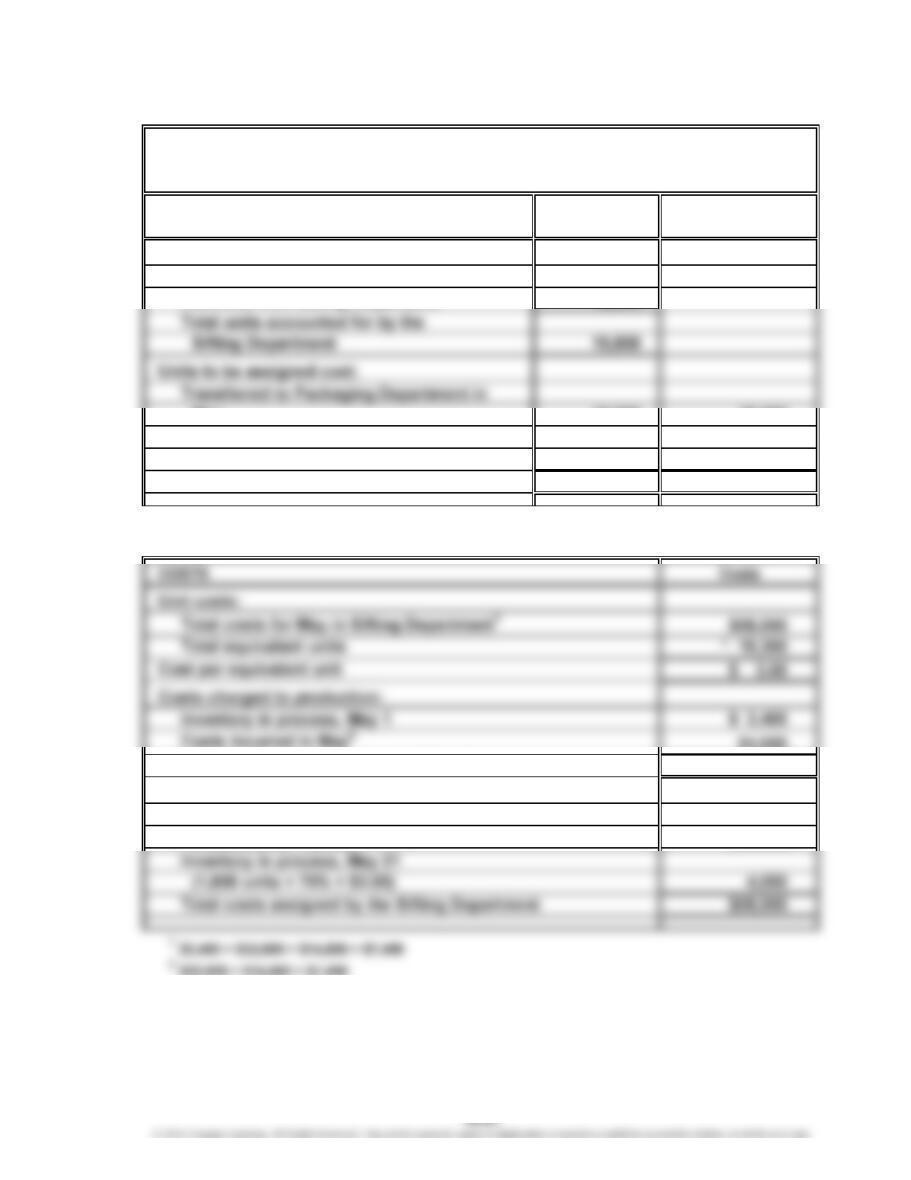
Prob. 18–5B (FIN MAN); Prob. 3–5B (MAN)
Whole Equivalent Units
UNITS Units of Production
Units charged to production:
Inventory in process, May 1 1,500
Received from Milling Department 18,300
May 18,000 18,000
Inventory in process, May 31
(75% completed) 1,800 1,350
Total units to be assigned cost 19,800 19,350
*
75% units × 1,800 units
54,650
Total costs accounted for by the Sifting Department $58,050
Costs allocated to completed and partially completed units:
Transferred to Packaging Department in May
(18,000 units × $3.00) $54,000
BLUE RIBBON FLOUR COMPANY
Cost of Production Report—Sifting Department
For the Month Ended May 31, 2016
*
CHAPTER 18 Process Cost Systems
CP 18–1 (FIN MAN); CP 3–1 (MAN)
This case comes from a real story. In the real story, the first reduction in chips had
no impact on the marketplace. The manager was promoted, and the next manager
attempted the same strategy—reduce chips by 10%. Again, it worked. The next
manager did the same thing. All of a sudden, the market demand dropped for the
a. Do nothing. This is a safe strategy. It would be highly unlikely that failing to
reveal this information to anybody would ever be discovered or “pinned” on
you. Unfortunately, this is one of those situations where silence has very little
b. Talk to Bishop. You can have a conversation with Bishop. This is also a
reasonably safe strategy and probably the best start. For example, you may
discover that the reduction in chips was okayed by the vice president or that
there was a market study that revealed that the market thought the cookie had
too many chips. This kind of information could be discovered very easily and
without any risk through a personal conversation with Bishop.
c. Talk to the vice president. You could also go right over Bishop’s head to the
vice president. This strategy might label you as “not a team player,” so some
care is in order here. You might get Bishop in trouble, or you may get yourself
in some trouble. This is probably not the best first move. It is within Bishop’s
authority to make the chip decision, so you are, in a sense, second-guessing
Bishop when you go to the vice president. You could be accused of being out
of your expertise. After all, what do you know about chips and the marketplace?
CASES & PROJECTS
CHAPTER 18 Process Cost Systems
CP 18–2 (FIN MAN); CP 3–2 (MAN)
a. This accounting procedure has the effect of rewarding the production of
broke. In essence, the procedure communicates to operating personnel that
broke is a normal part of doing business. In fact, not only is broke a normal
part of business, but its production is actually attractive because of the
b. The accounting for broke that is typical in the industry fails to account for the
total impact of broke. It is true that the use of recycled materials may reduce the
direct materials cost to the operation. However, such a view is very limited. For
example, the production of broke has a cost. Machine capacity was used to
produce the broke in the first place. Therefore, broke has an original materials
cost and a machine cost. Both of these together are likely to be greater than the
cost of virgin material. One mill manager once commented, “There is a free
paper machine out there.” What he was implying is that if all the machine
capacity used to produce broke could be harnessed for good production, it
would have been equal to a “free” paper machine. The cost of misused capacity
CHAPTER 18 Process Cost Systems
CP 18–3 (FIN MAN); CP 3–3 (MAN)
This case is abstracted from a real situation, where higher raw materials costs due
to tin content were more than offset by lower energy costs. The cost system used
in the real situation was a sophisticated “real-time” expense tracking system. The
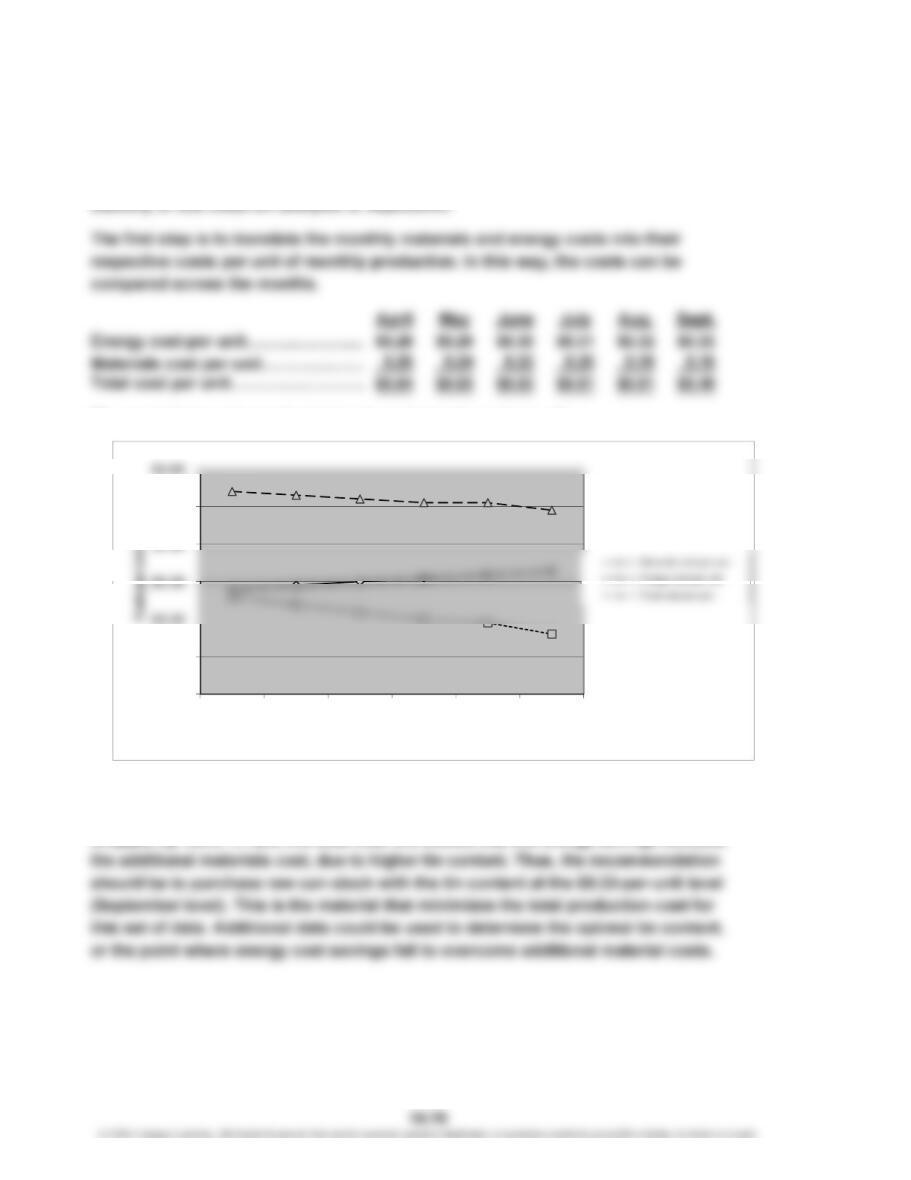
The graph below shows the total unit cost data for each month.
The graph reveals that the tin content and energy costs are inversely related. That
is, as the materials cost increased due to higher tin content, the energy costs
dropped by more. In fact, the total cost line shows that the energy savings exceeds
$0.00
$0.10
$0.40
$0.50
April May June July Aug. Sept.
Month
CP 18–4 (FIN MAN); CP 3–4 (MAN)
To: Jamarcus Bradshaw
From: Leann Brunswick
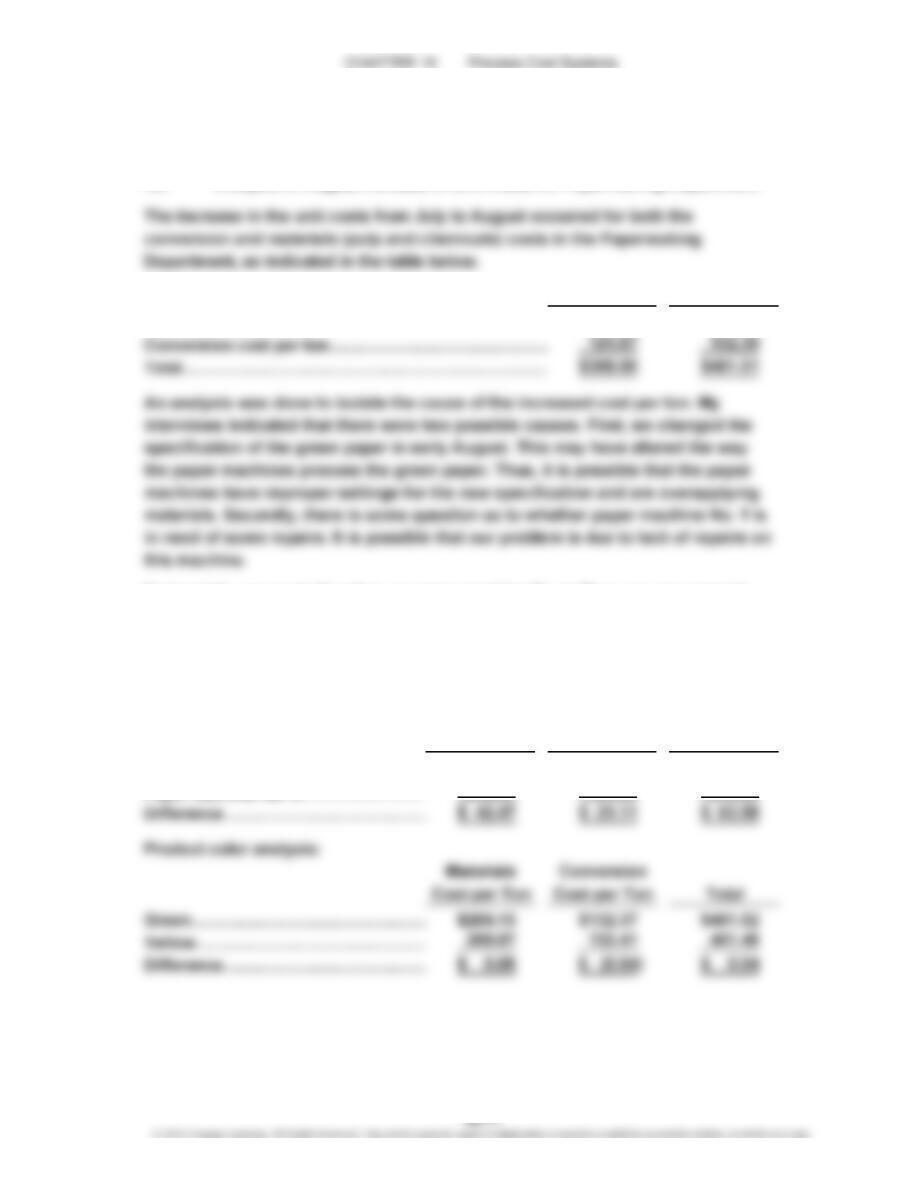
Re: Analysis of August Increase in Unit Costs for Papermaking Department
July August
Materials cost per ton……………………………………
…
$246.33 $269.12
…
Fortunately, we run both colors on paper machine No. 1. Thus, we can separate
the analysis between these two possible explanations. I have provided the
following cost per ton data for the two paper machines and the two product
colors:
Paper machine analysis:
Materials Conversion
Cost per Ton Cost per Ton Total
Paper Machine No. 1…………………
…
$290.54 $143.04 $433.58
Paper Machine No. 2…………………
…
248.07 121.93 370.00
CHAPTER 18 Process Cost Systems
CP 18–4 (FIN MAN); CP 3–4 (MAN) (Concluded)
The results are clear. Paper machine 1 has a much higher materials and conversion
cost per ton in August. Apparently, the paper machine is overapplying pulp. This is
resulting in an increase in both the materials and conversion cost per ton. Paper
machine No. 2 is running at a cost near our historical cost per ton. There is no
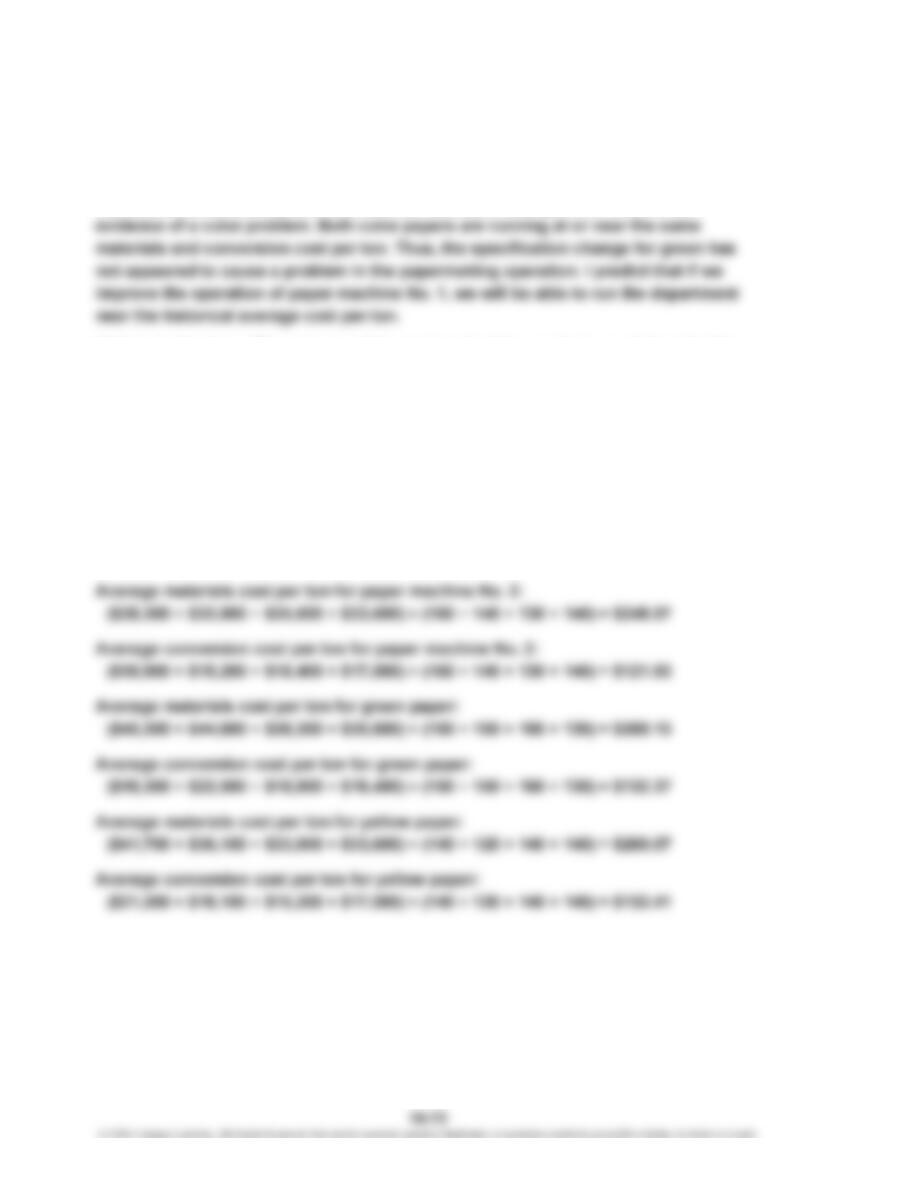
Note to Instructors: The paper machine and product line analysis are determined by
summarizing the data from the computer run provided in the problem. Students
must divide costs by ton-volume for each paper machine and then do the same
thing for each product color. The tables in the memo show the results of the
following analysis ( a spreadsheet is recommended for performing this analysis):
Average materials cost per ton for paper machine No. 1:
($40,300 + $41,700 + $44,600 + $36,100) ÷ (150 + 140 + 150 + 120) = $290.54
Average conversion cost per ton for paper machine No. 1:
($18,300 + $21,200 + $22,500 + $18,100) ÷ (150 + 140 + 150 + 120) = $143.04
CHAPTER 18 Process Cost Systems
CP 18–5 (FIN MAN); CP 3–5 (MAN)
This activity can be accomplished with multiple groups assigned to one or more
of the industry categories. Assign at least one group to each industry category
(some are easier than others, so some groups may be assigned multiple
CHAPTER 18 Process Cost Systems
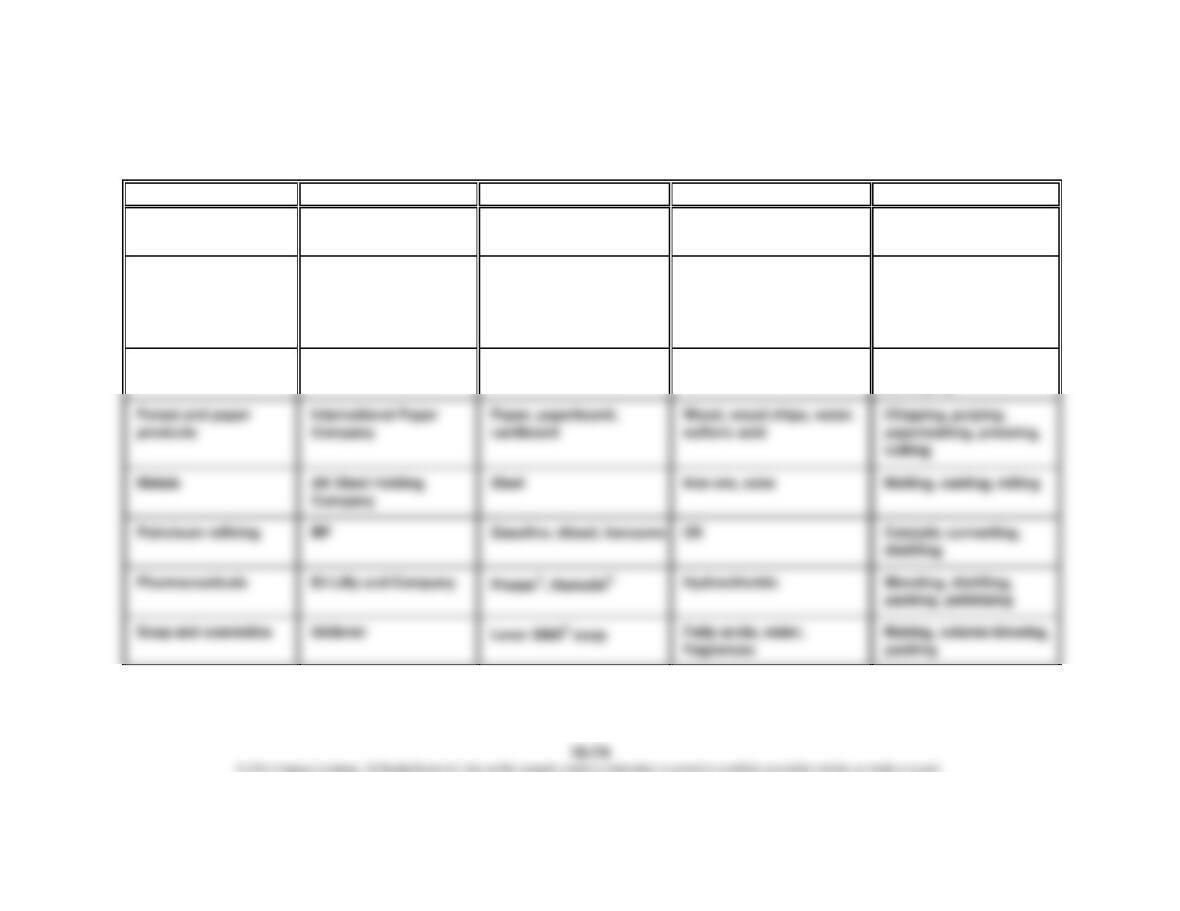
CP 18–5 (FIN MAN); CP 3–5 (MAN) (Concluded)
Industry Category Example Company Products Materials Processes
Beverages PepsiCo, Inc. Pepsi, Diet Pepsi Sugar, carbonated water,
concentrate
Mixing, bottling
Chemicals E. I. du Pont de
Nemours and Company
Stainmaster
®
, Kevlar
®
,
Lycra
®
, Teflon
®
,
refrigerants, electronic
materials
Petroleum and petroleum-
based intermediates
(esters and olefins)
Reaction, blending,
distilling, extruding
Food H.J. Heinz Company Ketchup Tomato, sugar, salt, spices Cooking, blending,
packaging