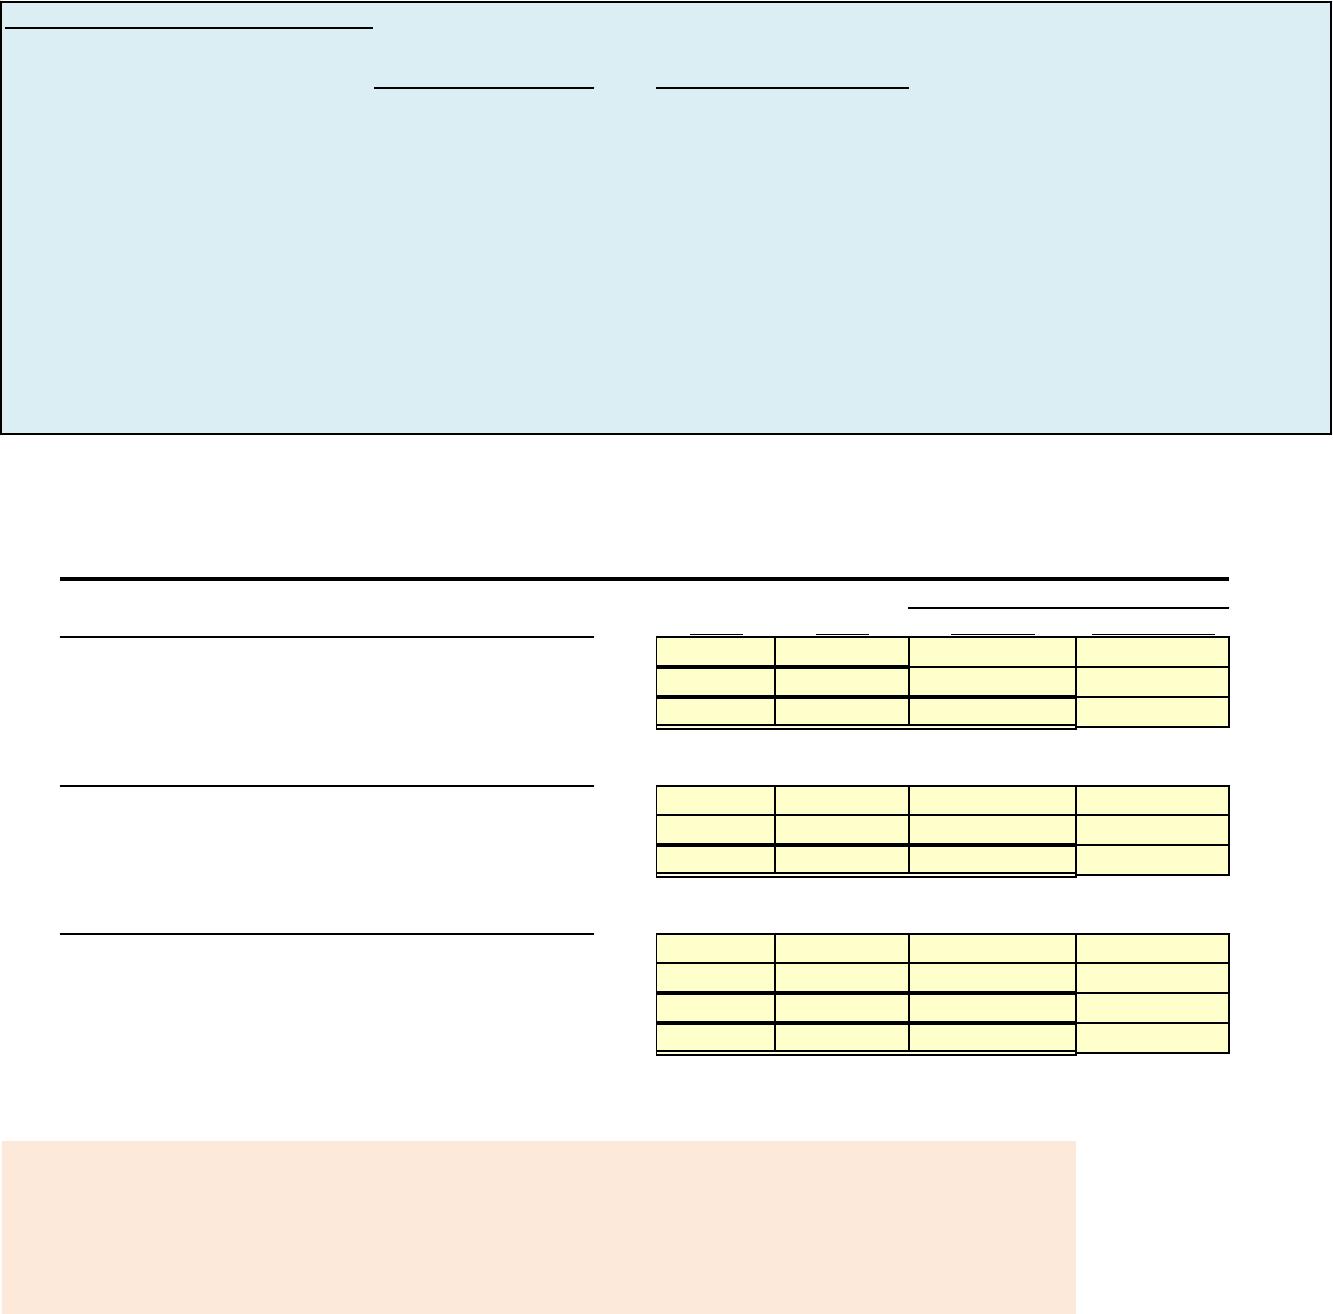
E18-1 Prepare horizontal analysis
Financial information for Kurzen Inc. is presented below.
Current assets
Plant assets (net)
Current liabilities
Long-term liabilities
Common stock, $1 par
Retained earnings
Instructions
Prepare a schedule showing a horizontal analysis for 2017 using 2016 as the base year. (Round percentages to one
decimal point.
NOTE: Enter a number in cells requesting a value; enter either a number or a formula in cells with a “?” .
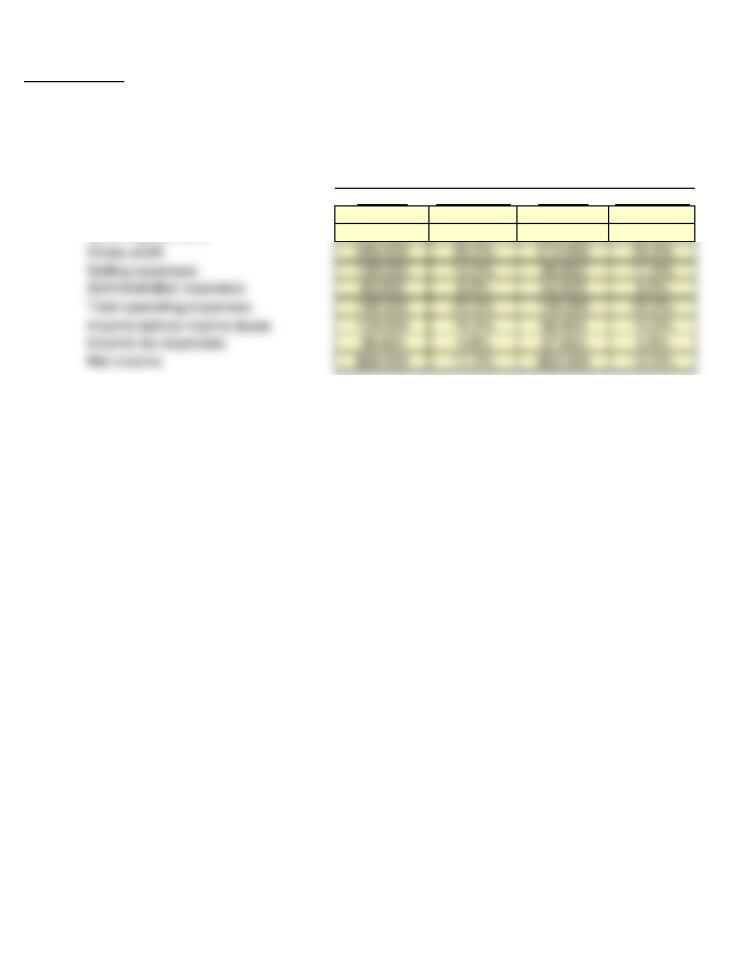
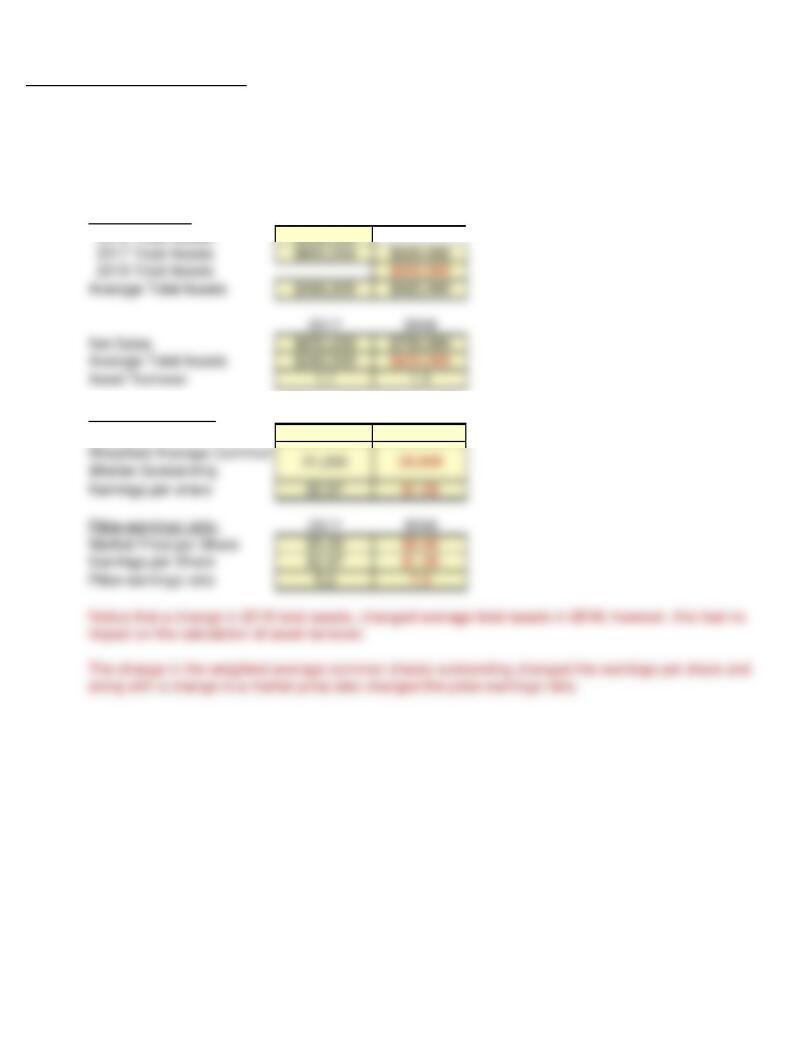
KURZEN INC.
Condensed Balance Sheets
December 31
2017 2016 Amount Percentage
Current assets Value Value ? ?
Plant assets (net) Value Value ? ?
Total assets ? ? ? ?
Current liabilities Value Value ? ?
Long-term liabilities Value Value ? ?
Total liabilities ? ? ? ?
Common stock, $1 par Value Value ? ?
Retained earnings Value Value ? ?
Total stockholders’ equity ? ? ? ?
Total liabilities and stockholders’ equity ? ? ? ?
After you have completed the requirements of E18-1, consider the additional questions.
Answers are on the other tab in this file.
1. Suppose that in 2017, current assets and current liabilities changed to $115,000 and $100,000.
Revise the horizontal analysis to reflect these changes. Round percentages to one decimal point.
133,000
December 31, 2017
December 31, 2016
$125,000
91,000
396,000
$100,000
330,000
70,000
95,000
115,000
Increase or (Decrease)
Assets
Liabilities
Stockholders’ equity
161,000
136,000
150,000
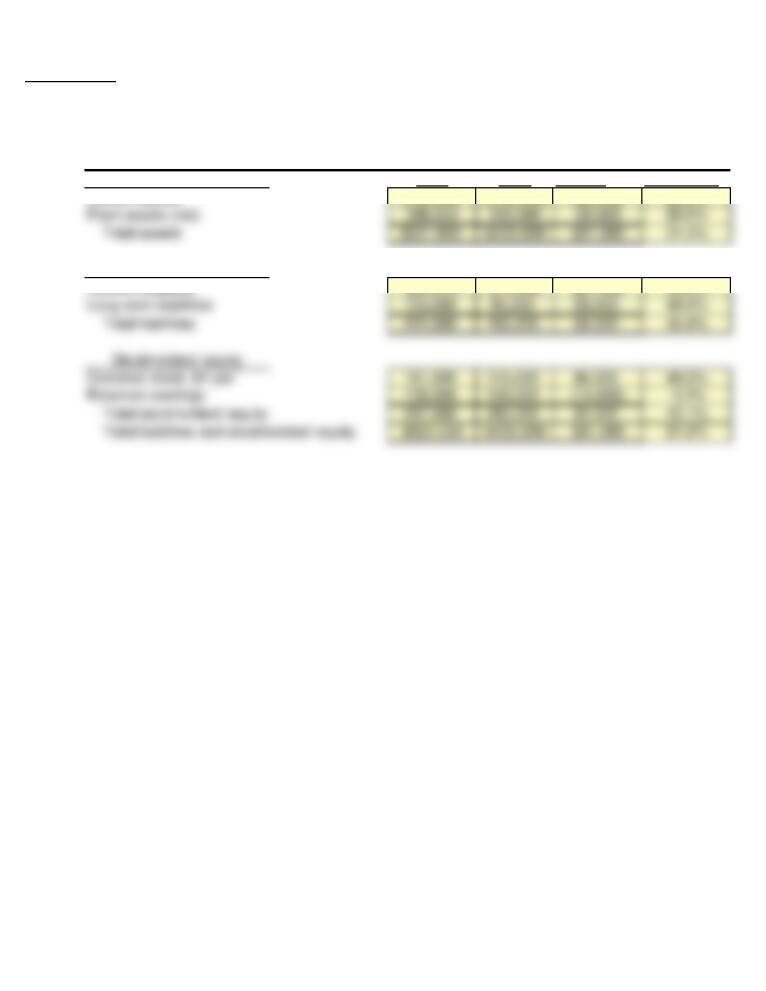
E18-1 Solution
2017 2016 Amount Percentage
Current assets $125,000 $100,000 $25,000 25.0%
Plant assets (net) 396,000 330,000 66,000 20.0%
Current liabilities $91,000 $70,000 $21,000 30.0%
Long-term liabilities 133,000 95,000 38,000 40.0%
KURZEN INC.
Condensed Balance Sheets
December 31
Assets
Liabilities
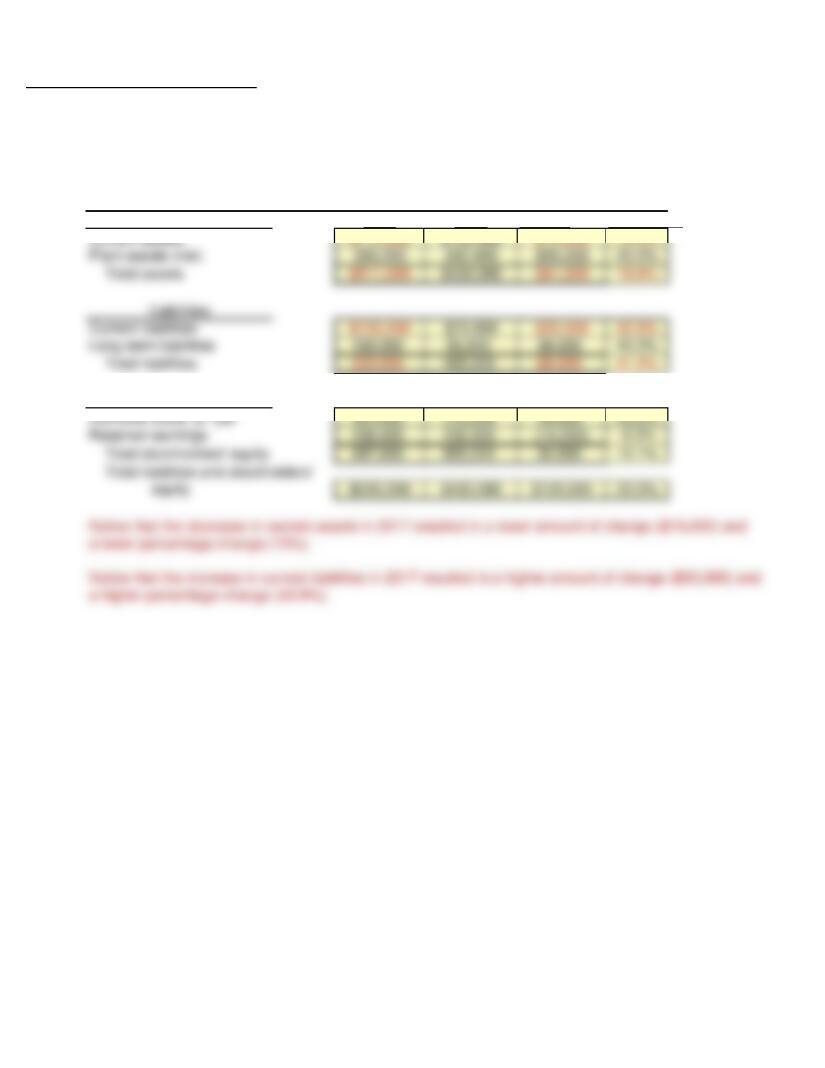
PE18-1 Solution to additional question
1. Suppose that in 2017, current assets and current liabilities changed to $115,000 and $100,000.
Revise the horizontal analysis to reflect these changes. Round percentages to one decimal point.
2017 2016 Amount Percentage
Current assets $115,000 $100,000 $15,000 15.0%
Plant assets (net) 396,000 330,000 $66,000 20.0%
Long-term liabilities 133,000 95,000 38,000 40.0%
Total liabilities 233,000 165,000 68,000 41.2%
KURZEN INC.
Condensed Balance Sheets
December 31
Assets
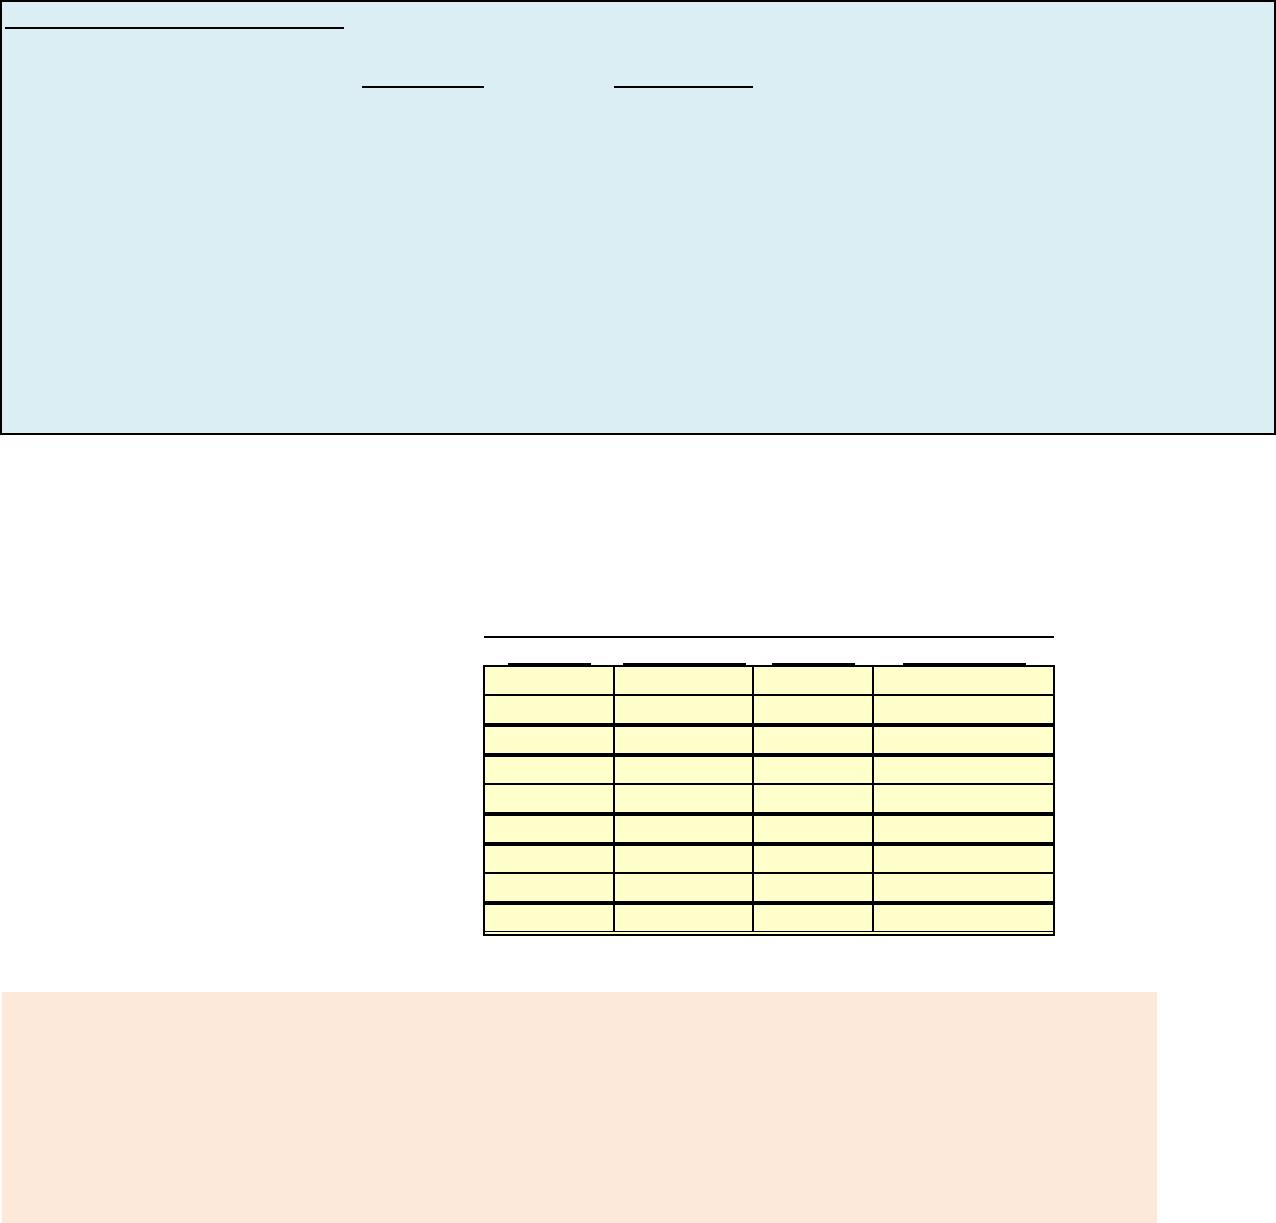
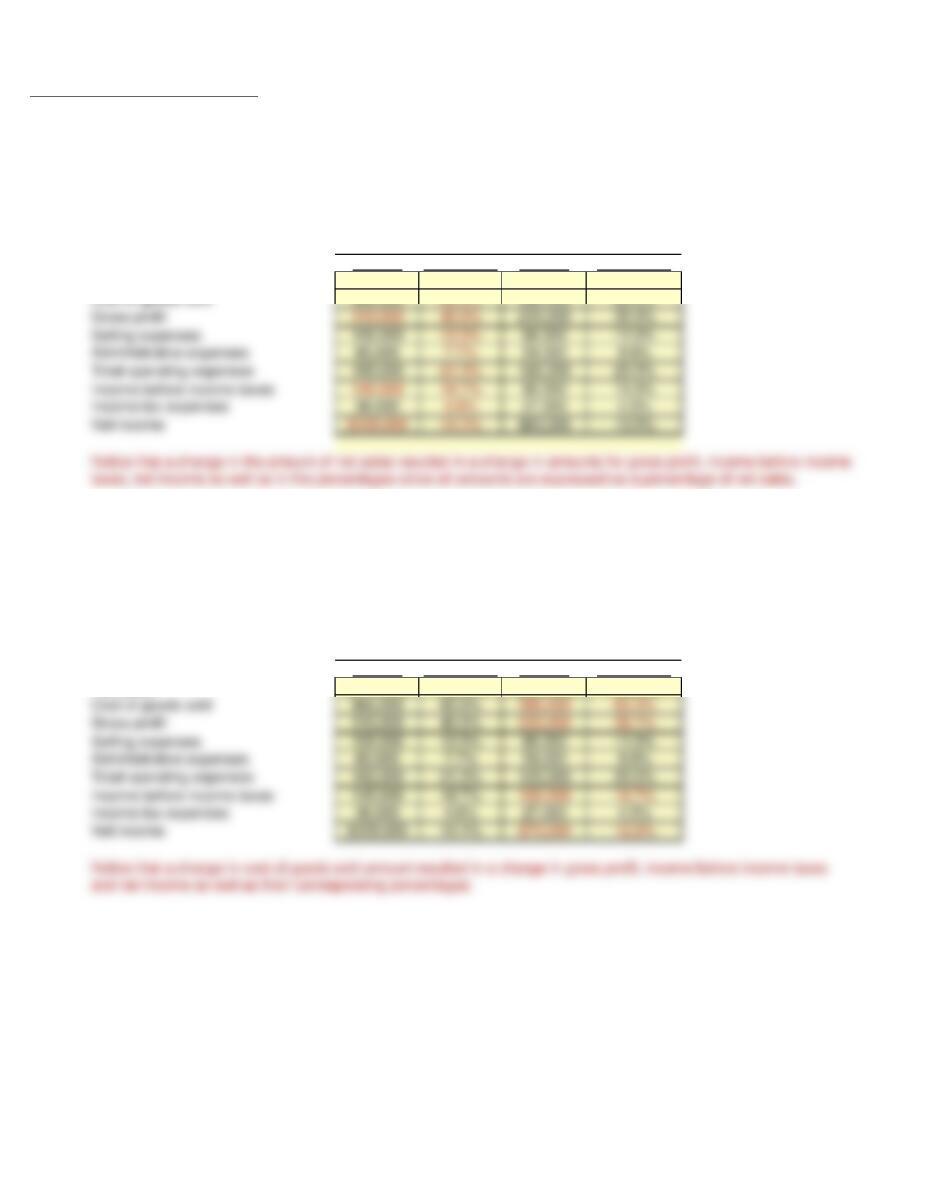
E18-2 Prepare vertical analysis
Operating data for Navarro Corporation are presented below.
2017 2016
Net sales $750,000 $600,000
Cost of goods sold
465,000 390,000
Selling expenses 105,000 66,000
Administrative expenses 60,000 54,000
Income tax expense 36,000 27,000
Net income 84,000 63,000
Instructions
Prepare a schedule showing a vertical analysis for 2017 and 2016. Round percentages to one decimal
point.
NOTE: Enter a number in cells requesting a value; enter either a number or a formula in cells with a “?” .
Amount Percentage Amount Percentage
Value ?Value ?
Cost of goods sold
Value ?Value ?
Gross profit ? ? ? ?
Selling expenses Value ?Value ?
Administrative expenses Value ?Value ?
Total operating expenses ? ? ? ?
Income before income taxes ? ? ? ?
Income tax expenses Value ?Value ?
Net income ? ? ? ?
After you have completed the requirements of E18-2, consider the additional questions.
Answers are on the other tab in this file. Round percentages to one decimal point.
1. Suppose that the amount of net sales in 2017 changed to $775,000. Show the impact on the
vertical analysis for 2017.
2. Suppose that the cost of goods sold for 2016 changed to $380,000. Show the impact on the
vertical analysis for 2016.
2017
2016
Net Sales
NAVARRO CORPORATION
Condensed Income Statements
For the Years Ended December 31
E18-2 Solution
Amount Percentage Amount Percentage
$750,000 100.0% $600,000 100.0%
Cost of goods sold
465,000 62.0% 390,000 65.0%
Total operating expenses 165,000 22.0% 120,000 20.0%
Income before income taxes
120,000 16.0% 90,000 15.0%
2017
2016
Net Sales
NAVARRO CORPORATION
Condensed Income Statements
For the Years Ended December 31
E18-2 Solution to additional questions
1. Suppose that the amount of net sales in 2017 changed to $775,000. Show the impact on the
vertical analysis for 2017. Round percentages to one decimal point.
Amount Percentage Amount Percentage
$775,000 100.0% $600,000 100.0%
Cost of goods sold
465,000 60.0% 390,000 65.0%
Gross profit 310,000 40.0% 210,000 35.0%
Income before income taxes 145,000 18.7% 90,000 15.0%
Income tax expenses 36,000 4.6% 27,000 4.5%
2.
Suppose that the cost of goods sold for 2016 changed to $380,000. Show the impact on the
vertical analysis for 2016. Round percentages to one decimal point.
Amount Percentage Amount Percentage
$775,000 100.0% $600,000 100.0%
Administrative expenses 60,000 7.7% 54,000 9.0%
Total operating expenses 165,000 21.3% 120,000 20.0%
Net Sales
Net Sales
NAVARRO CORPORATION
Condensed Income Statements
For the Years Ended December 31
2017
2016
NAVARRO CORPORATION
Condensed Income Statements
For the Years Ended December 31
2017
2016

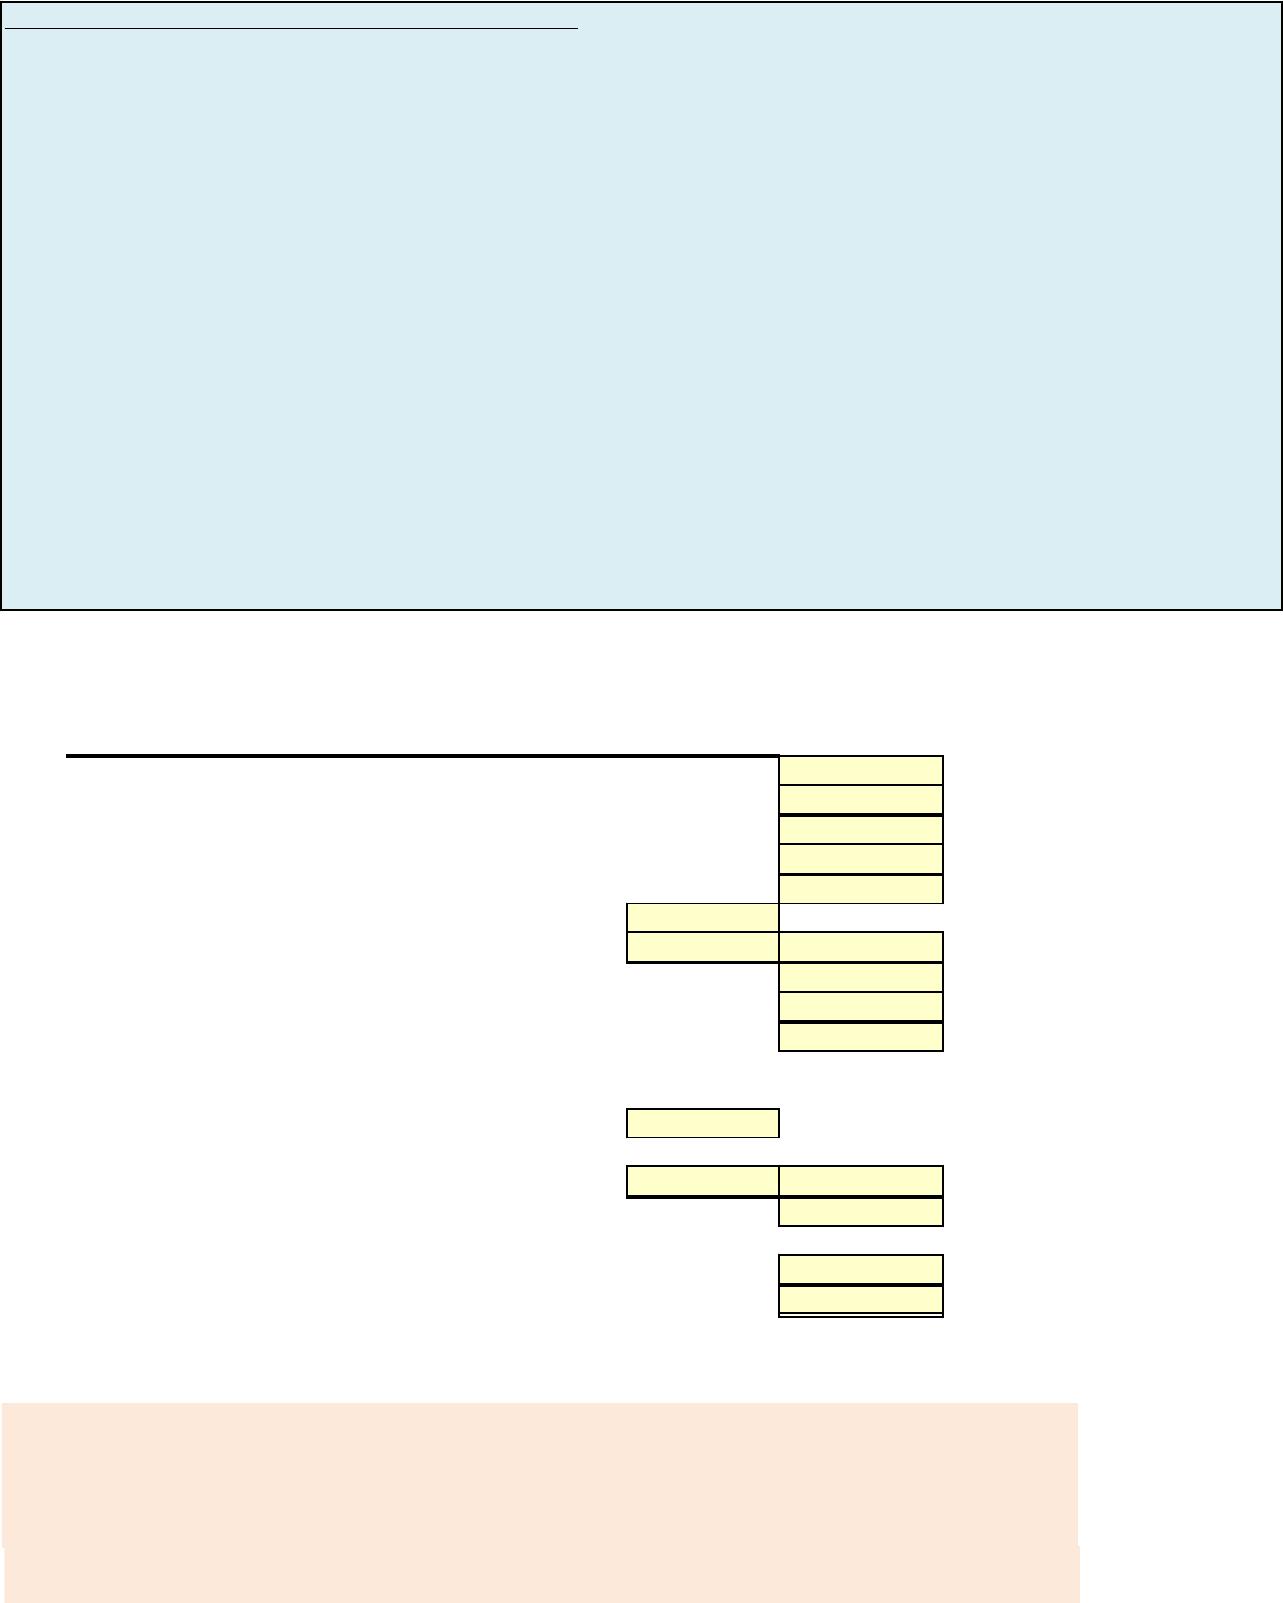
P18-3 Perform ratio analysis, and evaluate financial position and operating results.
Consolidated balance sheet and income statement data for Landwehr Corporation appear below.
2018 2017 2016
$25,000 $20,000 $18,000
Accounts receivable (net) 50,000 45,000 48,000
Other current assets 90,000 95,000 64,000
Investments 75,000 70,000 45,000
Plant and equipment (net) 400,000 370,000 358,000
$640,000 $600,000 $533,000
Current liabilities $75,000 $80,000 $70,000
Long-term debt 80,000 85,000 50,000
Common stock, $10 par 340,000 310,000 300,000
Retained earnings 145,000 125,000 113,000
$640,000 $600,000 $533,000
2018 2017
Sales revenue $740,000 $700,000
Less: Sales returns and allowances 40,000 50,000
Net sales 700,000 650,000
Cost of goods sold 420,000 400,000
Gross Profit 280,000 250,000
Operating expenses (including income tax) 235,000 220,000
Net income $45,000 $30,000
Additional information:
1. The market price of Landwehr’s common stock was $4.00, $5.00, and $8,00 for 2016, 2017,
and 2018, respectively.
2. All dividends were paid in cash.
Instructions
(a) Compute the following ratios for 2017 and 2018. (Round ratios to one decimal point; round earnings per share
to two decimal points)
(1) Profit margin.
(2) Asset turnover.
(3) Earnings per share. (Weighted-average common shares in 2018 were 32,000 and
in 2017 were 31,000).
(4) Price-earnings ratio.
(5) Payout ratio.
(6) Debt to assets ratio.
(b) Based on the ratios calculated, discuss briefly the improvement or lack thereof in financial
position and operating results from 2017 to 2018 of Landwehr Corporation.
NOTE: Enter a number in cells requesting a value; enter either a number or a formula in cells with a “?” .
For the Years Ended December 31
Cash
LANDWEHR CORPORATION
Balance Sheets
December 31
LANDWEHR CORPORATION
Income Statement
(a)(1) Profit Margin: 2017 2018
Net Income Value Value
Net Sales Value Value
? ?
(a)(2) Asset Turnover: 2017 2018
2016 Total Assets Value
2017 Total Assets Value Value
2018 Total Assets Value
Average Total Assets ? ?
2017 2018
Net Sales Value Value
Average Total Assets Value Value
? ?
(a)(3) Earnings per share: 2017 2018
Net Income Value Value
Weighted-Average
Common Shares
Outstanding
Value Value
? ?
(a)(4) Price-earnings ratio: 2017 2018
Market Price per Share Value Value
Earnings per Share Value Value
? ?
(a)(5) Payout ratio: 2017 2018
Cash Dividends Value Value
Net income Value Value
? ?
(a)(6) Debt to assets ratio: 2017 2018
Debt Value Value
Assets Value Value
? ?
(b)
After you have completed the requirements of P18-3, consider the additional question.
Answers are on the other tab in this file. (Round ratios to one decimal point, round earnings per share
to two decimal points).
1. Assume market price, total assets and weighted-average common shares outstanding in 2018
changed to $9 per share, $650,000 and 35,000 respectively. Show the impact of these changes on
the calculation of the ratios.
Response:
P18-3 Solution
(a)(1) Profit Margin: 2017 2018
Net Income $30,000 $45,000
Net Sales $650,000 $700,000
4.6% 6.4%
(a)(2) Asset Turnover: 2017 2018
2016 Total Assets $533,000
2017 2018
Net Sales $650,000 $700,000
Average Total Assets $566,500 $620,000
1.1 1.1
(a)(3) Earnings per share: 2017 2018
Net Income $30,000 $45,000
(a)(4) Price-earnings ratio: 2017 2018
Market Price per Share $5.00 $8.00
Earnings per Share $0.97 $1.41
5.2 5.7
(a)(5) Payout ratio: 2017 2018
Net Income $30,000 $45,000
(a)(6) Debt to assets ratio: 2017 2018
2018 Total Assets $640,000
Average Total Assets $566,500 $620,000
P18-3 Solution to additional question
1. Assume market price, total assets and weighted-average common shares outstanding in 2018
changed to $9 per share, $650,000 and 35,000 respectively. Show the impact of these changes on
the calculation of the ratios. ( Round ratios to one decimal point, round earnings per share to
two decimal points).
Asset Turnover: 2017 2018
2017 2018
Net Sales $650,000 $700,000
Earnings per share: 2017 2018
Net Income $30,000 $45,000
Price-earnings ratio: 2017 2018
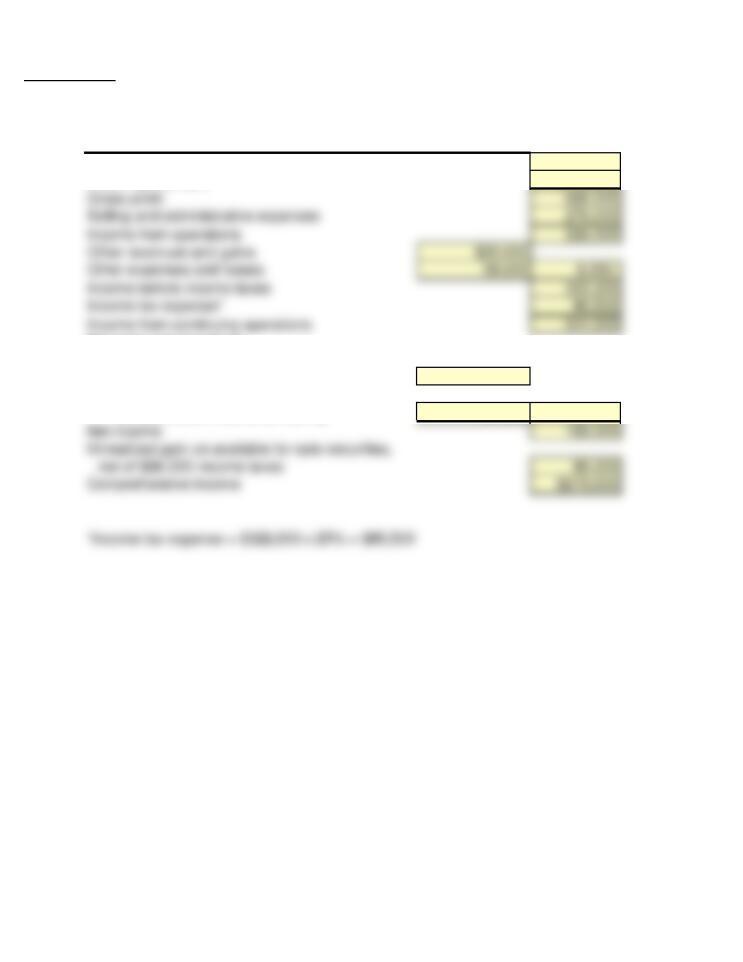
P18-9 Prepare a statement of comprehensive income
The ledger of Jaime Corporation at December 31, 2017, contains the following summary data.
$1,700,000 $1,100,000
120,000 Administrative expenses 150,000
20,000
Other expenses and losses
28,000
Your analysis reveals the following additional information that is not included in the above
data.
1. The entire Puzzles division was discontinued on August 31. The income from operations
for this division before income taxes was $20,000. The Puzzles Division was sold at a loss
of $90,000 before income taxes.
2. The company had an unrealized gain on available-for-sale securities of $120,000 before
income taxes for the year.
3. The income tax rate on all items is 25%.
Instructions
Prepare a statement of comprehensive income for the year ended December 31, 2017.
NOTE: Enter a number in cells requesting a value; enter either a number or a formula in cells with a “?” .
Net Sales Value
Cost of goods sold
Value
Gross profit ?
Selling and administrative expenses Value
Income from operations ?
Other revenues and gains Value
Other expenses and losses Value Value
Income before income taxes ?
Income tax expense ?
Income from continuing operations ?
Discontinued operations
Income from operations of discontinued division,
net of $5,000 income taxes Value
Loss on sale of discontinued division,
net of $22,500 income tax saving Value Value
Net income ?
Unrealized gain on available for sale securities,
net of $30,000 income taxes
Comprehensive income ?
After you have completed the requirements of P18-9, consider the additional question.
Answers are on the other tab in this file.
1. Suppose that the income from operations of discontinued division changed to $50,000
and the loss on the sale of the discontinued division changed to $75,000. Show impact
JAIME CORPORATION
Statement of Comprehensive Income
For the Year Ended December 31, 2017
Net sales
Selling expenses
Other revenues and gains
Cost of goods sold
of these changes on the statement of comprehensive income.
P18-9 Solution
Net Sales $1,700,000
Cost of goods sold
1,100,000
Other revenues and gains $20,000
Other expenses and losses 28,000 8,000
Discontinued operations
Income from operations of discontinued division,
net of $5,000 income taxes 15,000
Loss on sale of discontinued division,
net of $22,500 income tax saving 67,500 52,500
JAIME CORPORATION
Statement of Comprehensive Income
For the Year Ended December 31, 2017
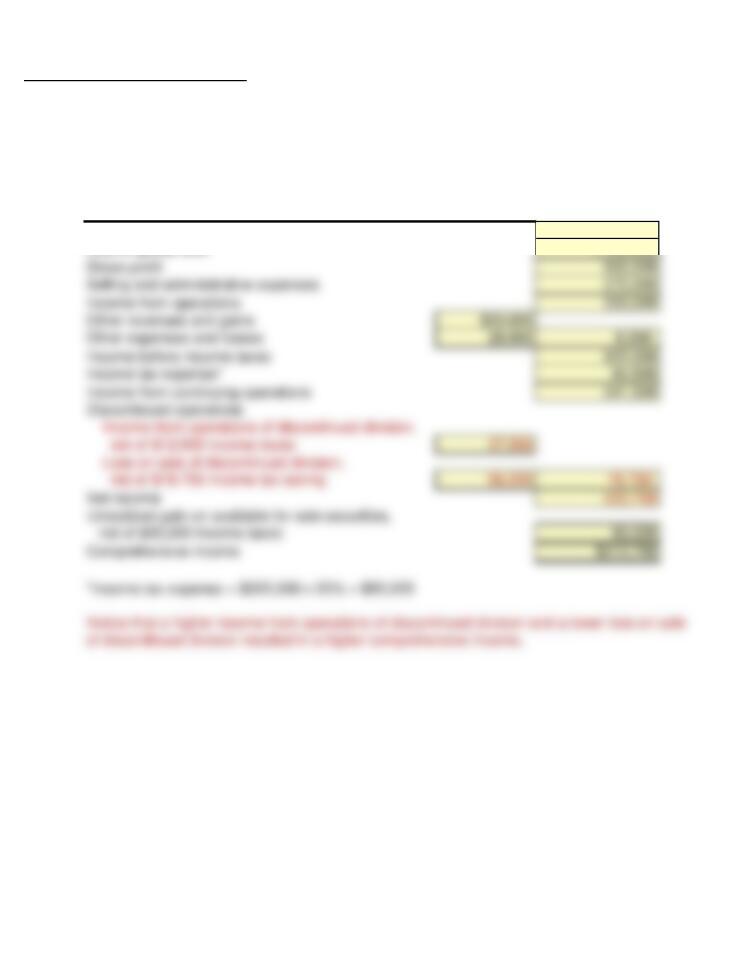
P18-9 Solution to additional question
1. Suppose that the income from operations of discontinued division changed to $50,000
and the loss on the sale of the discontinued division changed to $75,000. Show impact
of these changes on the statement of comprehensive income.
Net Sales $1,700,000
Cost of goods sold 1,100,000
Other revenues and gains $20,000
Other expenses and losses 28,000 8,000
Discontinued operations
Income from operations of discontinued division,
net of $12,500 income taxes 37,500
JAIME CORPORATION
Statement of Comprehensive Income
For the Year Ended December 31, 2017