Wild and Shaw, Financial & Managerial Accounting, 8e Solutions Manual: Chapter 18
1059
Chapter 18
Cost Behavior and
Cost-Volume-Profit Analysis
QUESTIONS
1. A variable cost is one that varies proportionately with the volume of activity. For
2. Variable costs per unit stay the same (remain constant) when output volume
3. Fixed costs per unit decrease when output volume increases. This is because the
total amount of fixed costs remains the same while it is being divided among more
units within the relevant range of activity.
4. Cost-volume-profit analysis is especially useful in the planning phase for a
5. A step-wise cost remains constant over a limited range of output activity, outside of
6. Contribution margin ratio means that for each sales dollar a specified percent is
7. Definition: Contribution margin ratio = Contribution margin / Sales price per unit.
The contribution margin ratio tells what percent of each sales dollar is available to
cover fixed costs, with the remainder being profit.
8. Definition: Unit contribution margin = Sales price per unit – Variable costs per unit.
9. A CVP analysis for a manufacturing company is simplified by assuming that the
Wild and Shaw, Financial & Managerial Accounting, 8e Solutions Manual: Chapter 18
10. The first is that although individual costs classified as fixed or variable might not
behave precisely in those patterns, some variations of individual components in the
11. By assuming a relevant range for operating activity, management can more
justifiably assume either fixed or variable relations between costs and volume, and
12. Three common methods for measuring cost behavior are: the scatter diagram, the
high-low method, and least-squares regression.
13. A scatter diagram is used to display the relation between past costs and sales
14. At break-even, profits are zero. Break-even is the point where sales equals fixed
plus variable costs.
15. This line represents total cost, which equals the sum of the fixed and variable costs
16. Fixed costs are depicted as a horizontal line on a CVP chart because they remain the
same (constant) at all volume levels within the relevant range.
17. Company A has a contribution margin of 50% [($20,000 – $10,000) / ($20,000)] and
Company B has a contribution margin of 80% [($20,000 – $4,000) / ($20,000)]. This
18. Margin of safety reflects the expected sales in excess of the level of break-even
sales.
19. Apple’s primary variable costs in making tablet computers are: labor, energy,
manufacturing and inventory-related costs. The costs of operating the plant and
20. Apple designs, manufactures, and markets mobile communication and media
devices, personal computers, and portable digital music players, and sells a variety
21. A 65% increase in sales of a popular smartphone model of Samsung is likely viewed
as a substantial increase. When this occurs, the sales and cost structures are likely
to change. Specifically, the selling price per unit, fixed costs, and variable costs are

Wild and Shaw, Financial & Managerial Accounting, 8e Solutions Manual: Chapter 18
1061
Wild and Shaw, Financial & Managerial Accounting, 8e Solutions Manual: Chapter 18
22. If units produced equals units sold, no conversion is necessary. If production
exceeds sales, absorption costing income can be determined by adding [increase in
units of ending inventory times the fixed costs per unit] to the variable costing
Wild and Shaw, Financial & Managerial Accounting, 8e Solutions Manual: Chapter 18
QUICK STUDIES
Quick Study 18-1 (10 minutes)
Quick Study 18-2 (10 minutes)
1. Variable 4. Variable 7. Fixed
Quick Study 18-3 (10 minutes)
Quick Study 18-4 (15 minutes)
1. The scatter diagram shows a mixed cost.
Quick Study 18-5 (10 minutes)
Contribution margin $5,000 – $3,000 = $2,000
Quick Study 18-6 (10 minutes)
Quick Study 18-7 (10 minutes)
1. I 4. I
Quick Study 18-8 (10 minutes)
Quick Study 18-9 (5 minutes)
Quick Study 18-10 (5 minutes)
Wild and Shaw, Financial & Managerial Accounting, 8e Solutions Manual: Chapter 18
1065
Quick Study 18-11 (10 minutes)
Sales at expected level (10,000 x $175) ………………………………………
$1,750,000
Quick Study 18–12 (10 minutes)
ZHAO CO.
Contribution Margin Income Statement (at Expected Sales Level)
For Year Ended December 31, 2019
Sales (10,000 x $175) ………………………………………………………………..
$1,750,000
Quick Study 18-13 (5 minutes)
Wild and Shaw, Financial & Managerial Accounting, 8e Solutions Manual: Chapter 18
1066
Quick Study 18-14 (10 minutes)
Break-even point in composite units = $105,000 / $125 = 840 composite units
Quick Study 18-15 C (10 minutes)
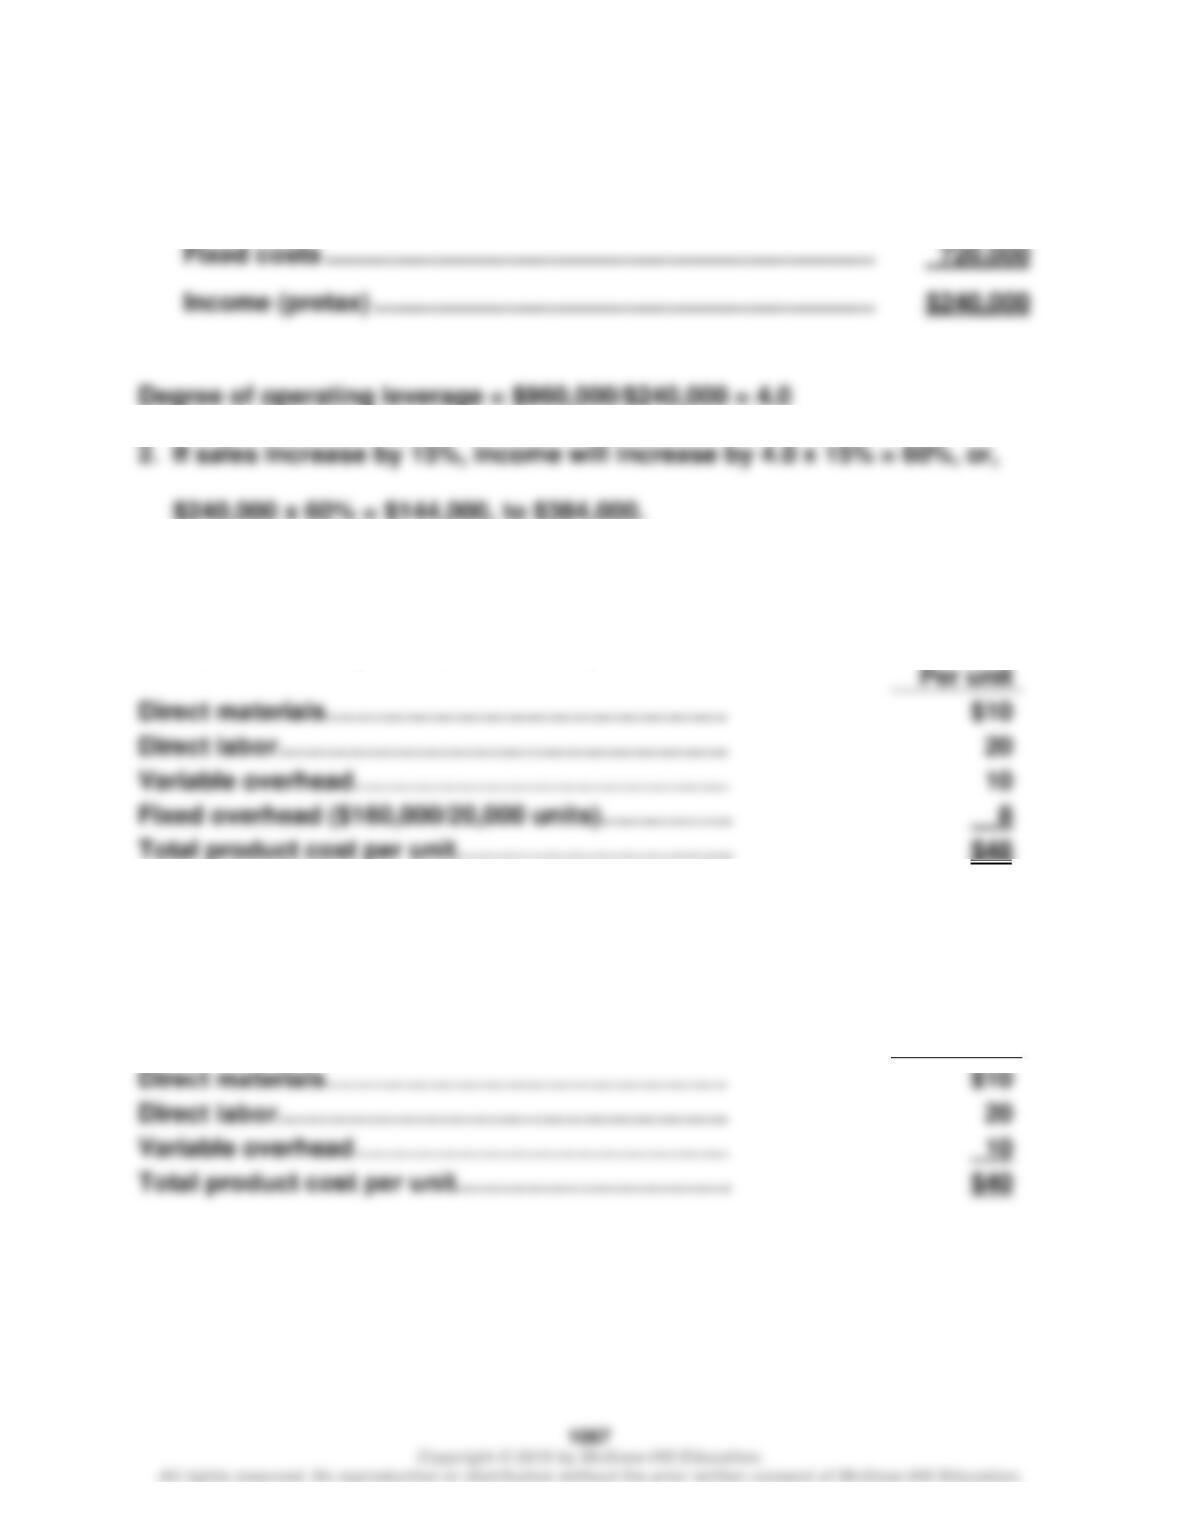
CVP Chart
Notes: Expected sales are 400,000 units ($34 million), thus selling price is $85 per unit.
Fixed costs are $17.5 million, and variable costs are $35 per unit.
Wild and Shaw, Financial & Managerial Accounting, 8e Solutions Manual: Chapter 18
Quick Study 18–16 (10 minutes)
1.
Contribution margin ………………………………………………………………..
$960,000
Quick Study 18–17 B (10 minutes)
Cost per unit using absorption costing
Per unit
Variable overhead………………………………………
Total product cost per unit………………………..…..
Quick Study 18–18 B (10 minutes)
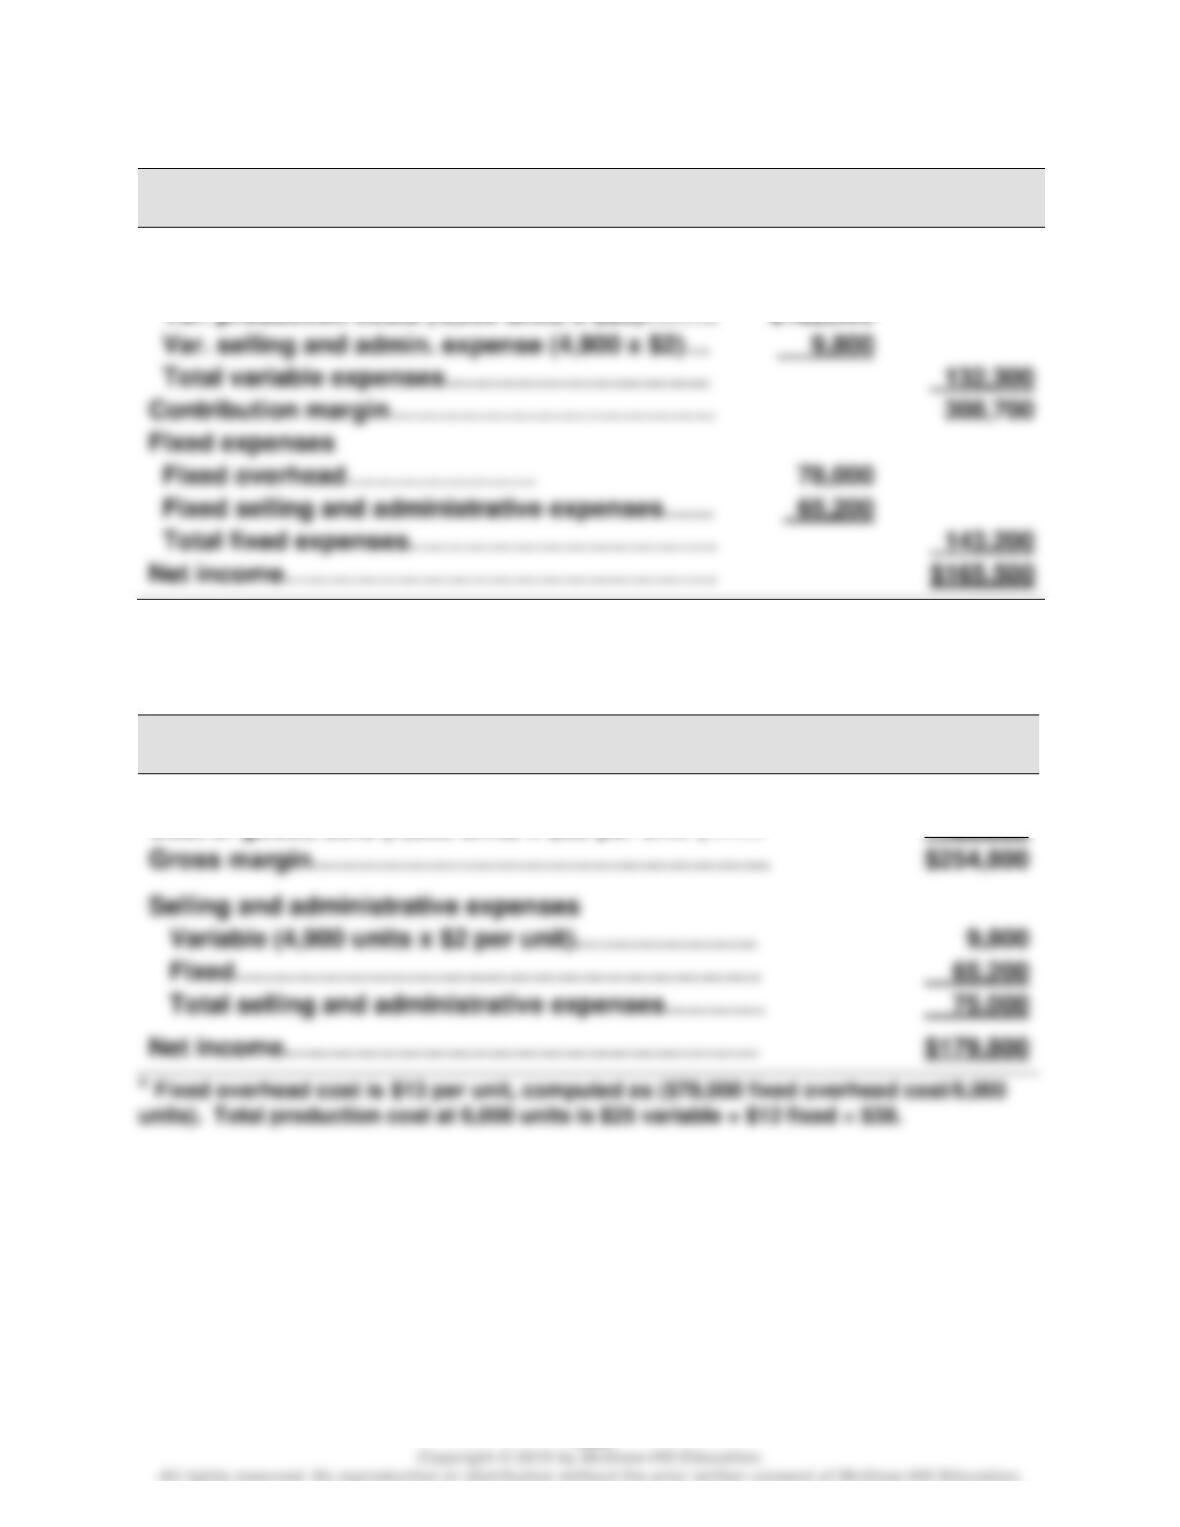
Cost per unit using variable costing
Per unit
Direct labor………………………………………………
Variable overhead………………………………………
Wild and Shaw, Financial & Managerial Accounting, 8e Solutions Manual: Chapter 18
1068
Quick Study 18–19B (15 minutes)
ACES INC.
Variable Costing Income Statement
Sales (4,900 units x $90 per unit)………………..
$441,000
Variable expenses
Var. production costs (4,900 units x $25)………
$122,500
Total variable expenses…………………………..
Fixed expenses
Fixed selling and administrative expenses……
Total fixed expenses……………………………….
Quick Study 18–20 B (10 minutes)
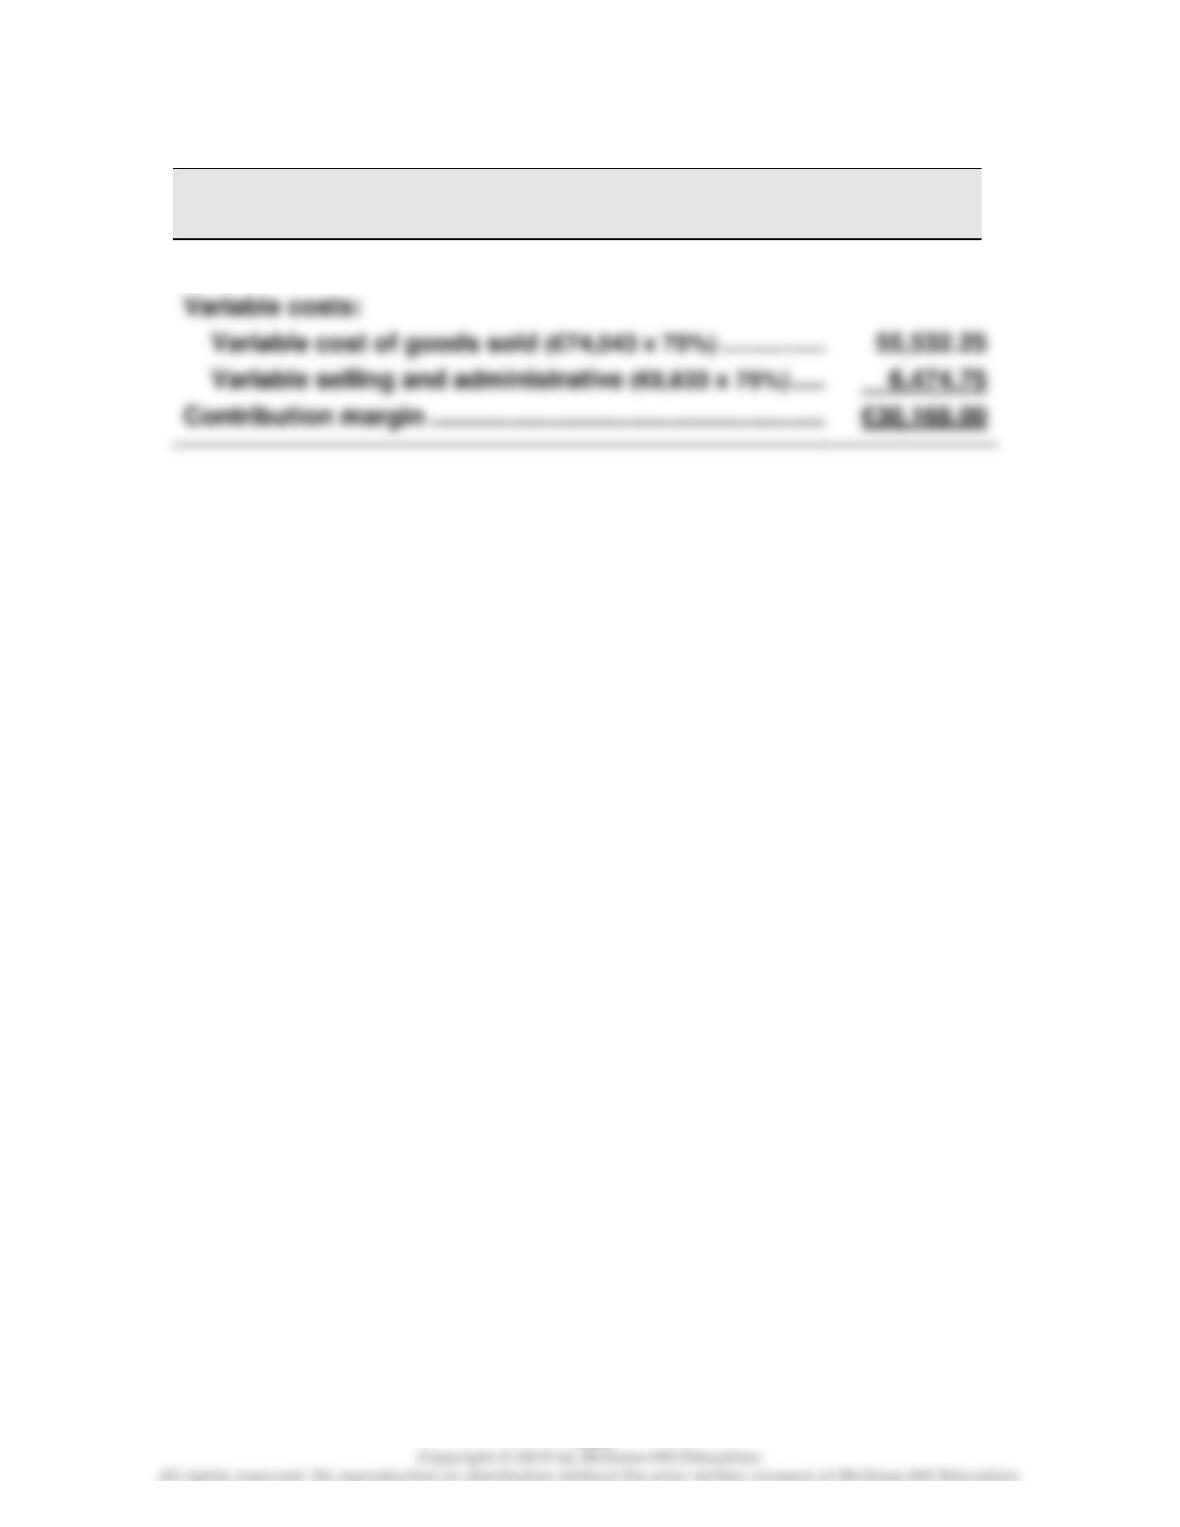
ACES INC.
Absorption Costing Income Statement
Sales (4,900 units x $90 per unit)………………………
$441,000
Cost of goods sold (4,900 units x $38 per unit*)…….
186,200
Fixed………………………………………………………
Wild and Shaw, Financial & Managerial Accounting, 8e Solutions Manual: Chapter 18
1069
Quick Study 18-21 (10 minutes)
BMW Automotive Group
Contribution Margin Statement (in € millions)
Sales …………………………..……………………………………………………….
€92,175.00
Wild and Shaw, Financial & Managerial Accounting, 8e Solutions Manual: Chapter 18
EXERCISES
Exercise 18-1 (15 minutes)
1. Graph #1 Variable cost
Graph #2 Fixed cost
2. a. Graph #5
b. Graph #2
Exercise 18-2 (10 minutes)
1. A
Exercise 18-3 (15 minutes)
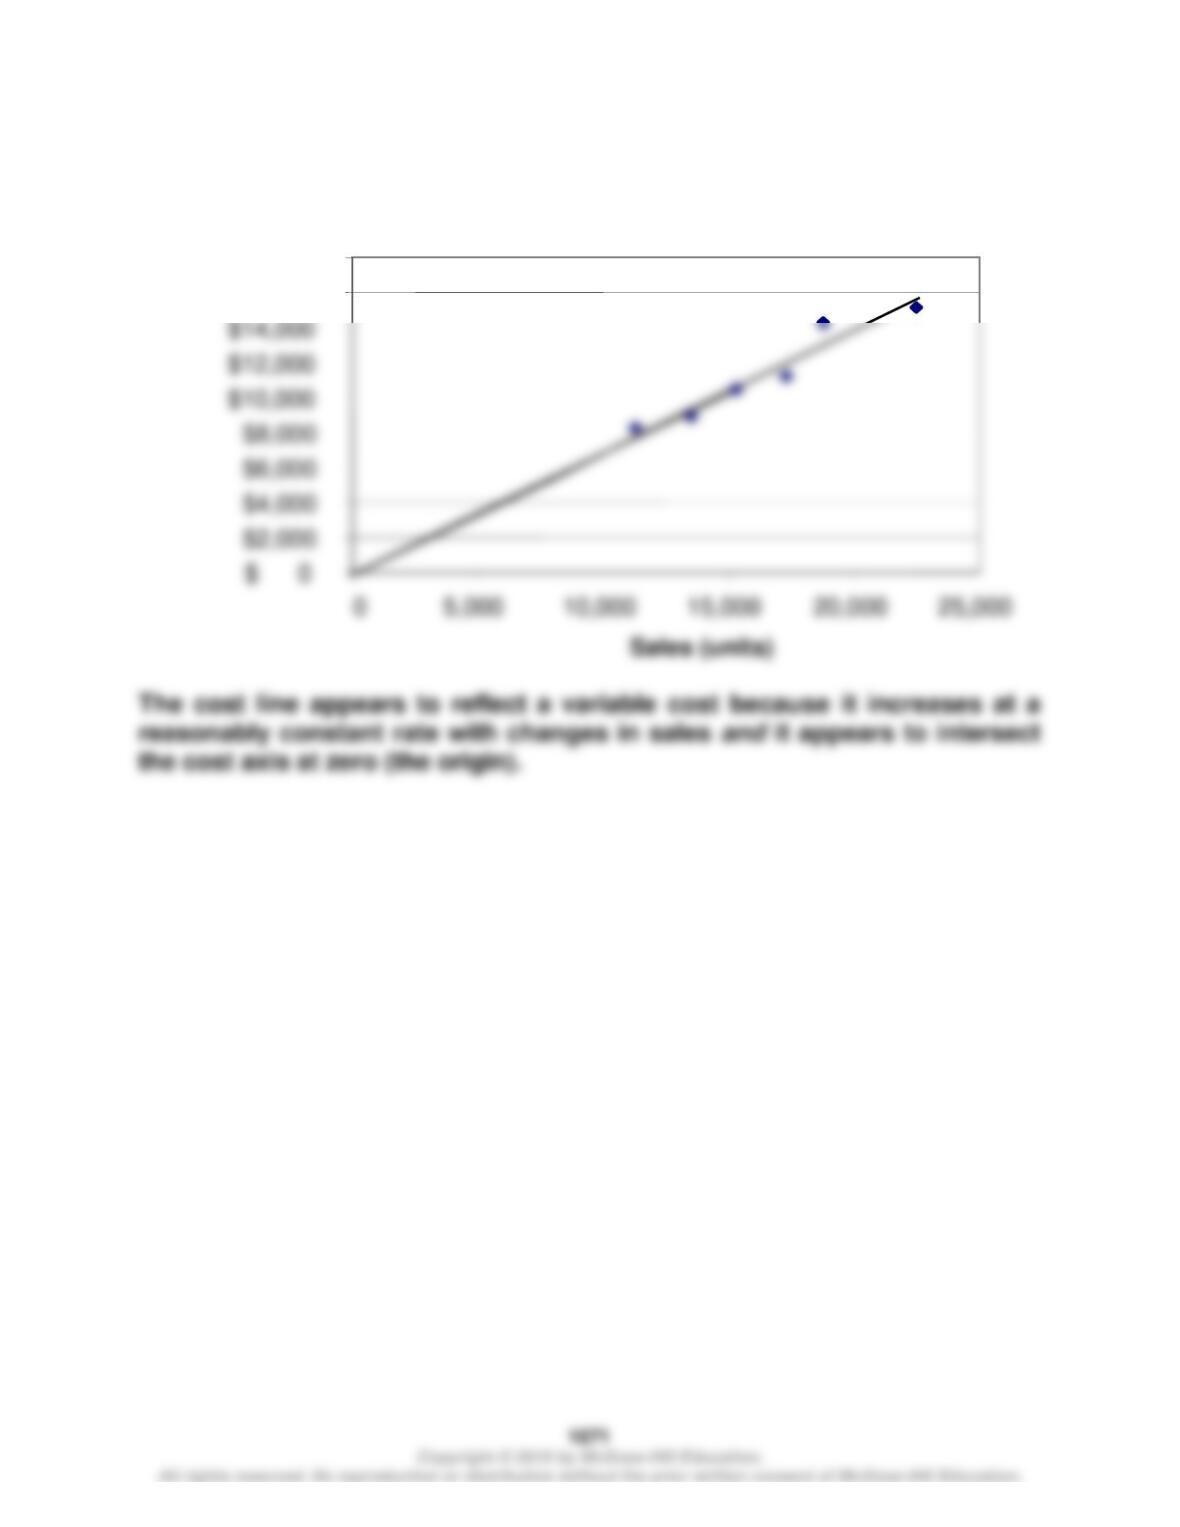
Series A Variable cost
Wild and Shaw, Financial & Managerial Accounting, 8e Solutions Manual: Chapter 18
Exercise 18-4A (20 minutes)
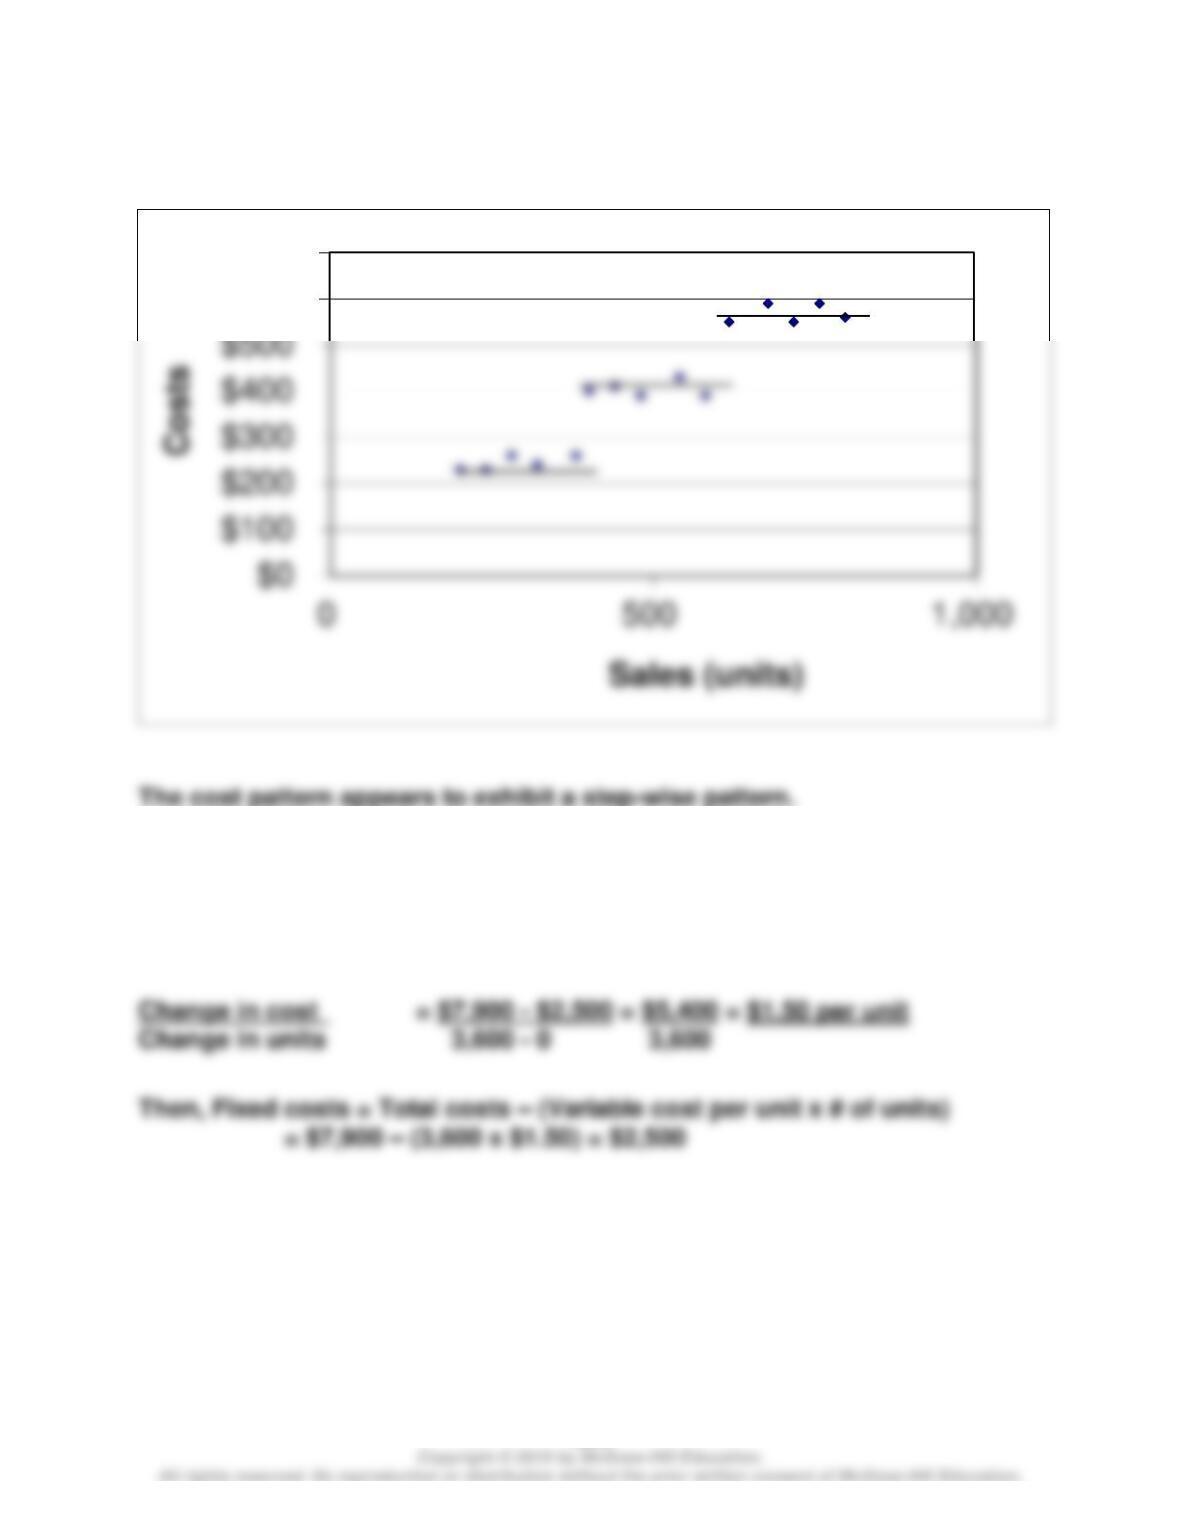
The scatter diagram and its estimated line of cost behavior appear below.
$16,000
$18,000
Cost of sales
$8,000
$10,000
$12,000
$14,000
Wild and Shaw, Financial & Managerial Accounting, 8e Solutions Manual: Chapter 18
1072
Exercise 18-5A (20 minutes)
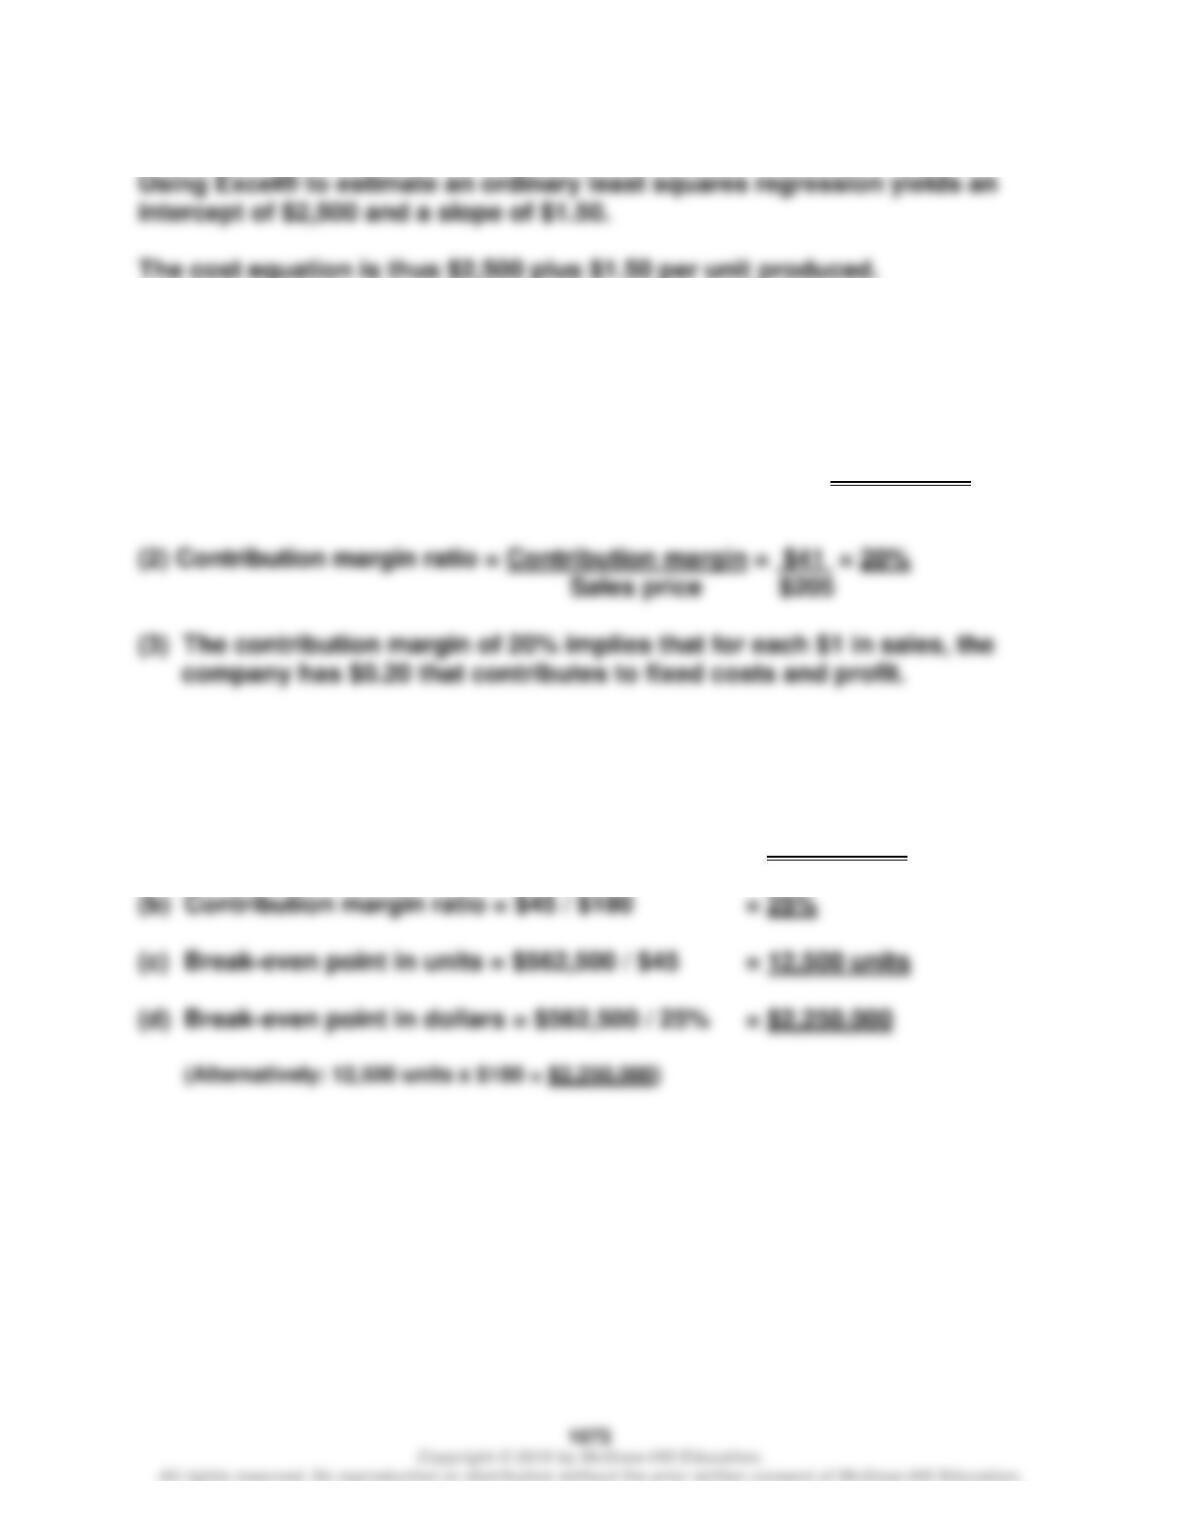
The scatter diagram and its estimated line of cost behavior appear below.
Exercise 18-6 (20 minutes)
Using the high-low method yields variable costs per unit of:
If 3,000 units are produced, the estimated total cost is:
$2,500 + (3,000 units x $1.50 per unit) = $7,000.
$600
$700
Wild and Shaw, Financial & Managerial Accounting, 8e Solutions Manual: Chapter 18
Exercise 18-7A (20 minutes)
Exercise 18-8 (10 minutes)
(1) Contribution margin = Selling price – Variable costs
= $205 – $164 = $41 per unit
Exercise 18-9 (30 minutes)
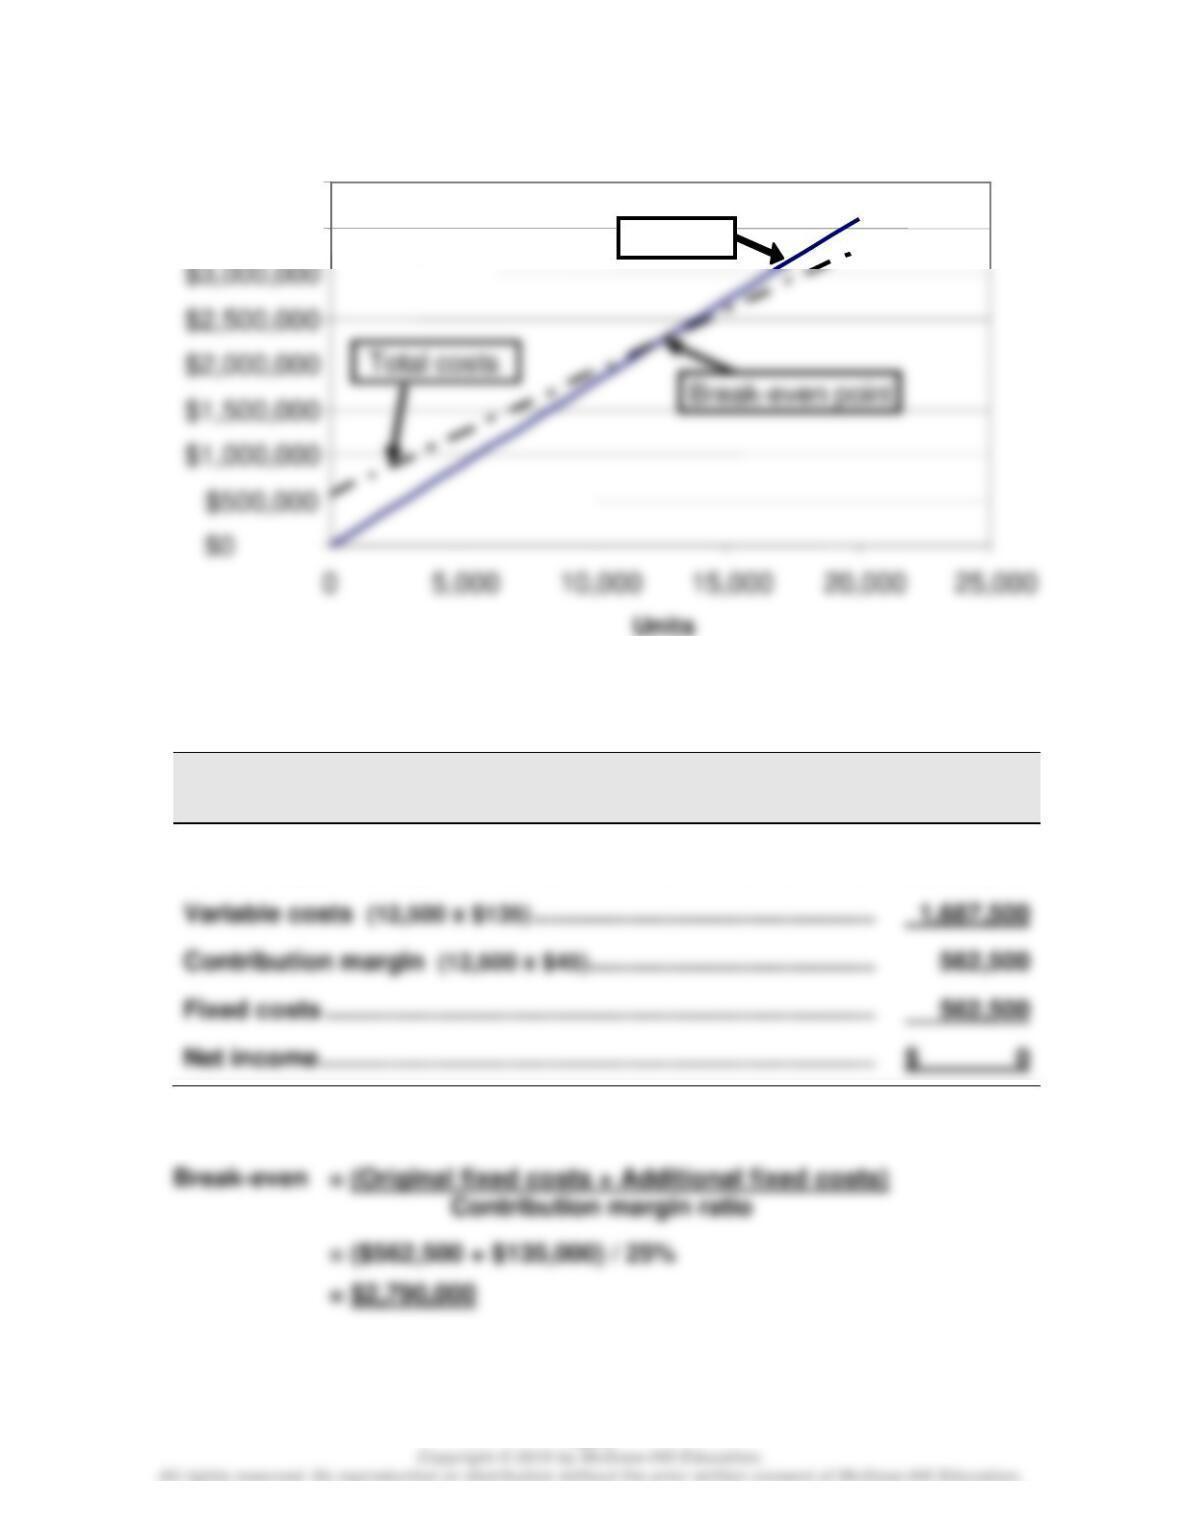
(a) Contribution margin per unit = $180 – $135 = $45 per unit
Wild and Shaw, Financial & Managerial Accounting, 8e Solutions Manual: Chapter 18
1074
Exercise 18–10C (15 minutes)
Exercise 18-11 (20 minutes)
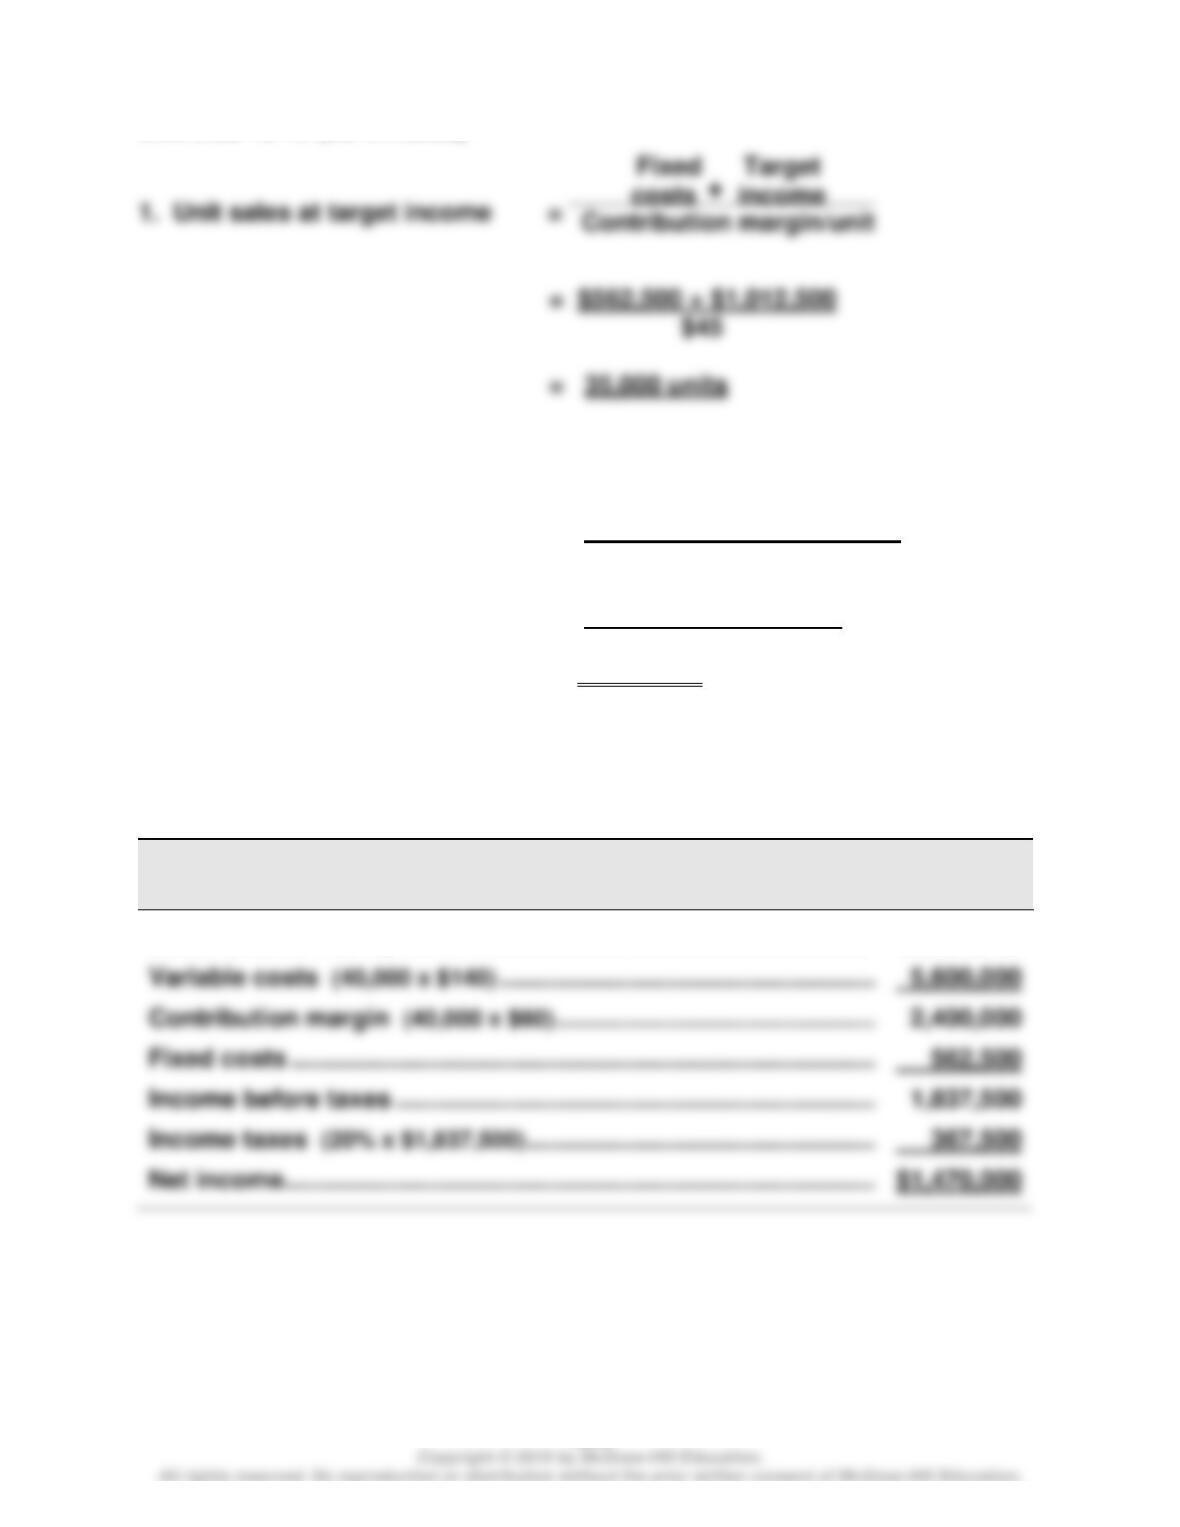
1.
BLANCHARD COMPANY
Contribution Margin Income Statement (at Break-Even)
Sales (12,500 x $180) ………………………………………………………………..
$2,250,000
2. Sales (in dollars) to break even with increased fixed costs
$1,500,000
$2,000,000
$2,500,000
$3,000,000
$3,500,000
$4,000,000
Sales
Wild and Shaw, Financial & Managerial Accounting, 8e Solutions Manual: Chapter 18
1075
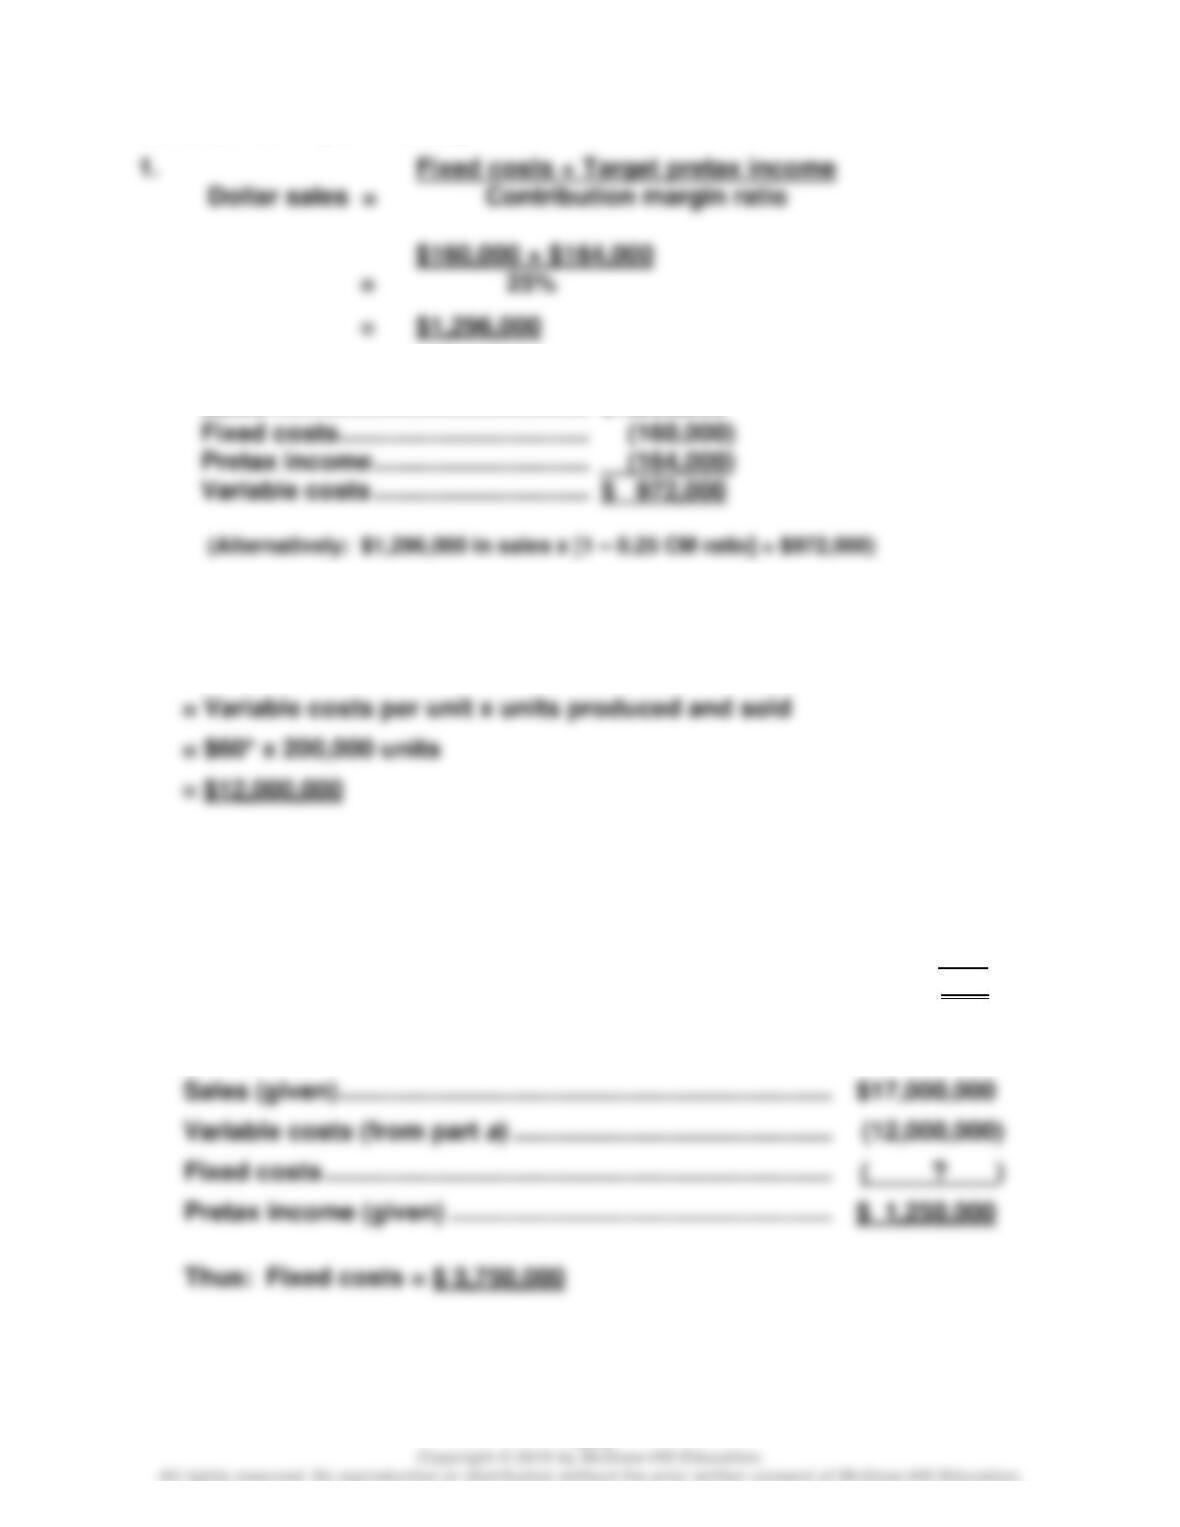
Exercise 18-12 (25 minutes)
Fixed + Target
2. Dollar sales at target income = costs income
Contribution margin ratio
= $562,500 + $1,012,500
25%
= $6,300,000
(Alternatively: 35,000 units x $180 = $6,300,000)
Exercise 18-13 (20 minutes)
BLANCHARD COMPANY
Forecasted Contribution Margin Income Statement
Sales (40,000 x $200) ………………………………………………………………..
$8,000,000
Wild and Shaw, Financial & Managerial Accounting, 8e Solutions Manual: Chapter 18
1076
Exercise 18–14 (10 minutes)
2.
Sales …………………………………………….
$1,296,000
Fixed costs …………………………..……….
Variable costs …………………………..
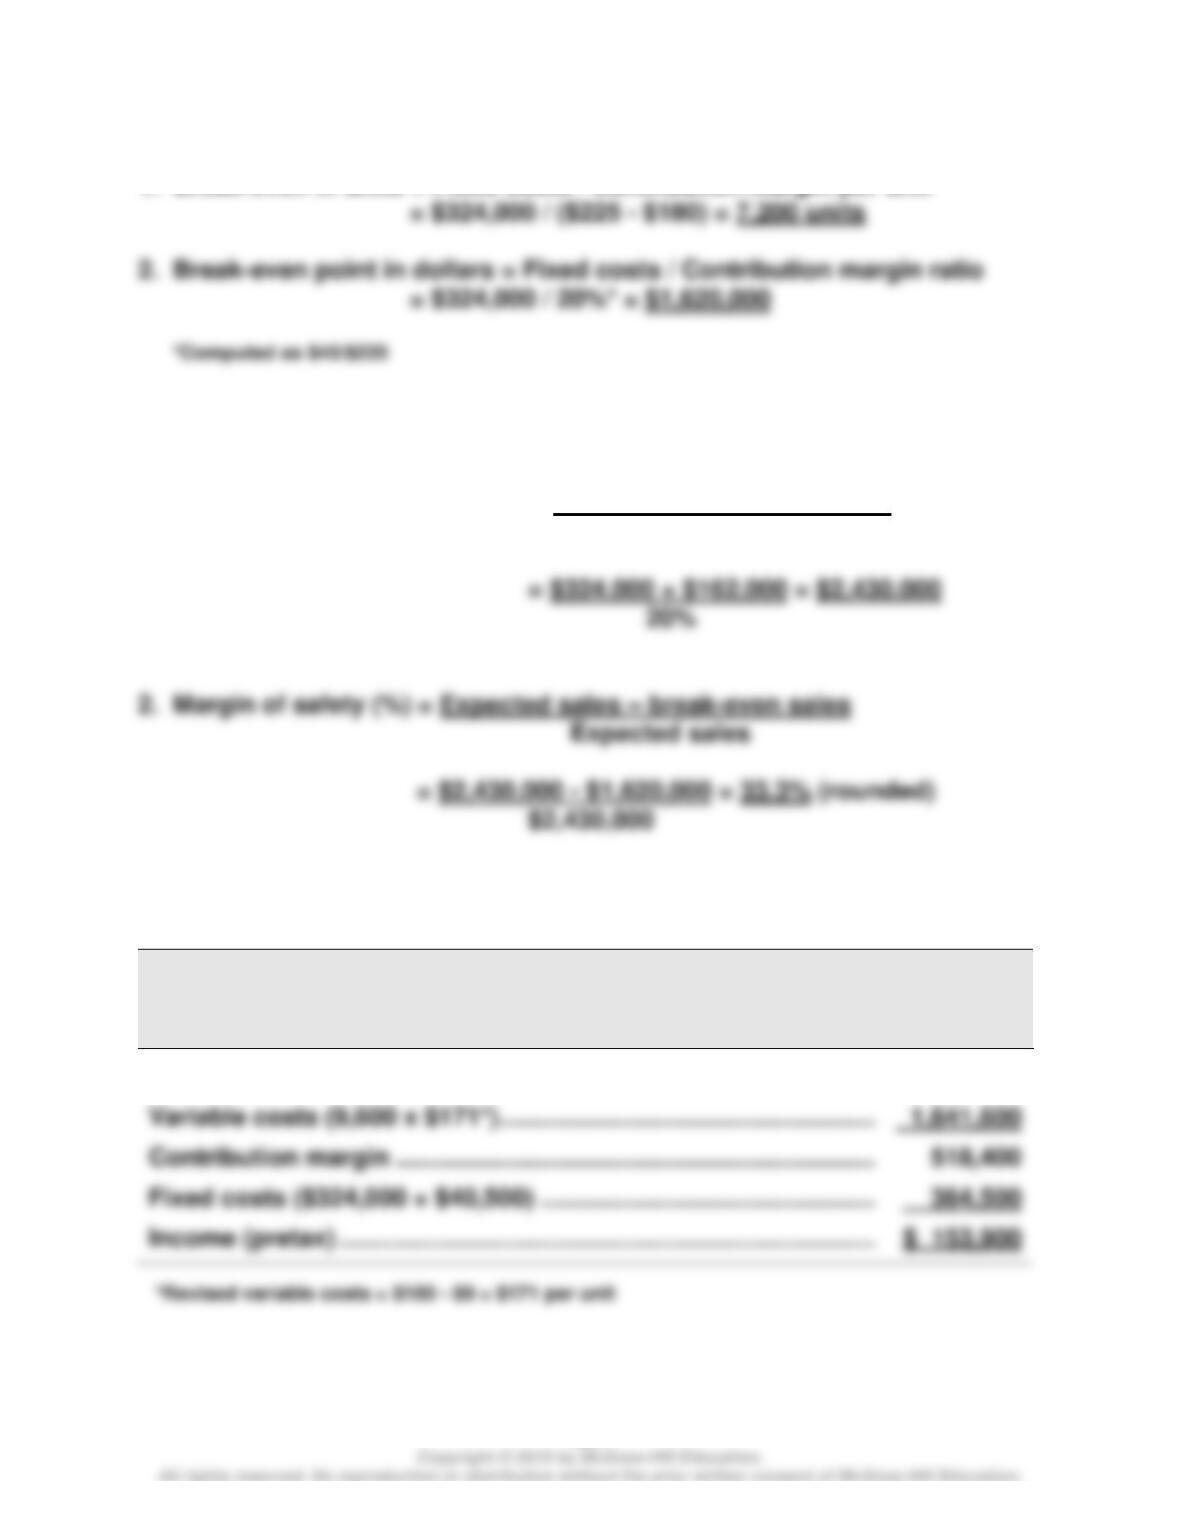
Exercise 18-15 (30 minutes)
(a) Total expected variable costs
*The $60 variable costs per unit is computed by determining (i) sales
price per unit and (ii) subtracting contribution margin per unit:
Sales price per unit ($17,000,000 / 200,000 units) …………………..
$ 85
Less: Contribution margin per unit (given) …………………………..
(25)
Variable costs per unit ………………………………………………………….
$ 60
(b) To solve, set up a brief contribution margin income statement
Variable costs (from part a) …………………………………………….
Fixed costs …………………………..………………………………………..
Wild and Shaw, Financial & Managerial Accounting, 8e Solutions Manual: Chapter 18
1077
Exercise 18-16 (10 minutes)
1. Break-even in units = Fixed costs / Contribution margin per unit
Exercise 18-17 (15 minutes)
1. Dollar sales for target income = Fixed costs + Target income
Contribution margin ratio
Exercise 18-18 (15 minutes)
HUDSON CO.
Forecasted Contribution Margin Income Statement
For Year Ended December 31, 2020
Sales (9,600 x $225) …………………………………………………………………
$2,160,000
Wild and Shaw, Financial & Managerial Accounting, 8e Solutions Manual: Chapter 18
1078
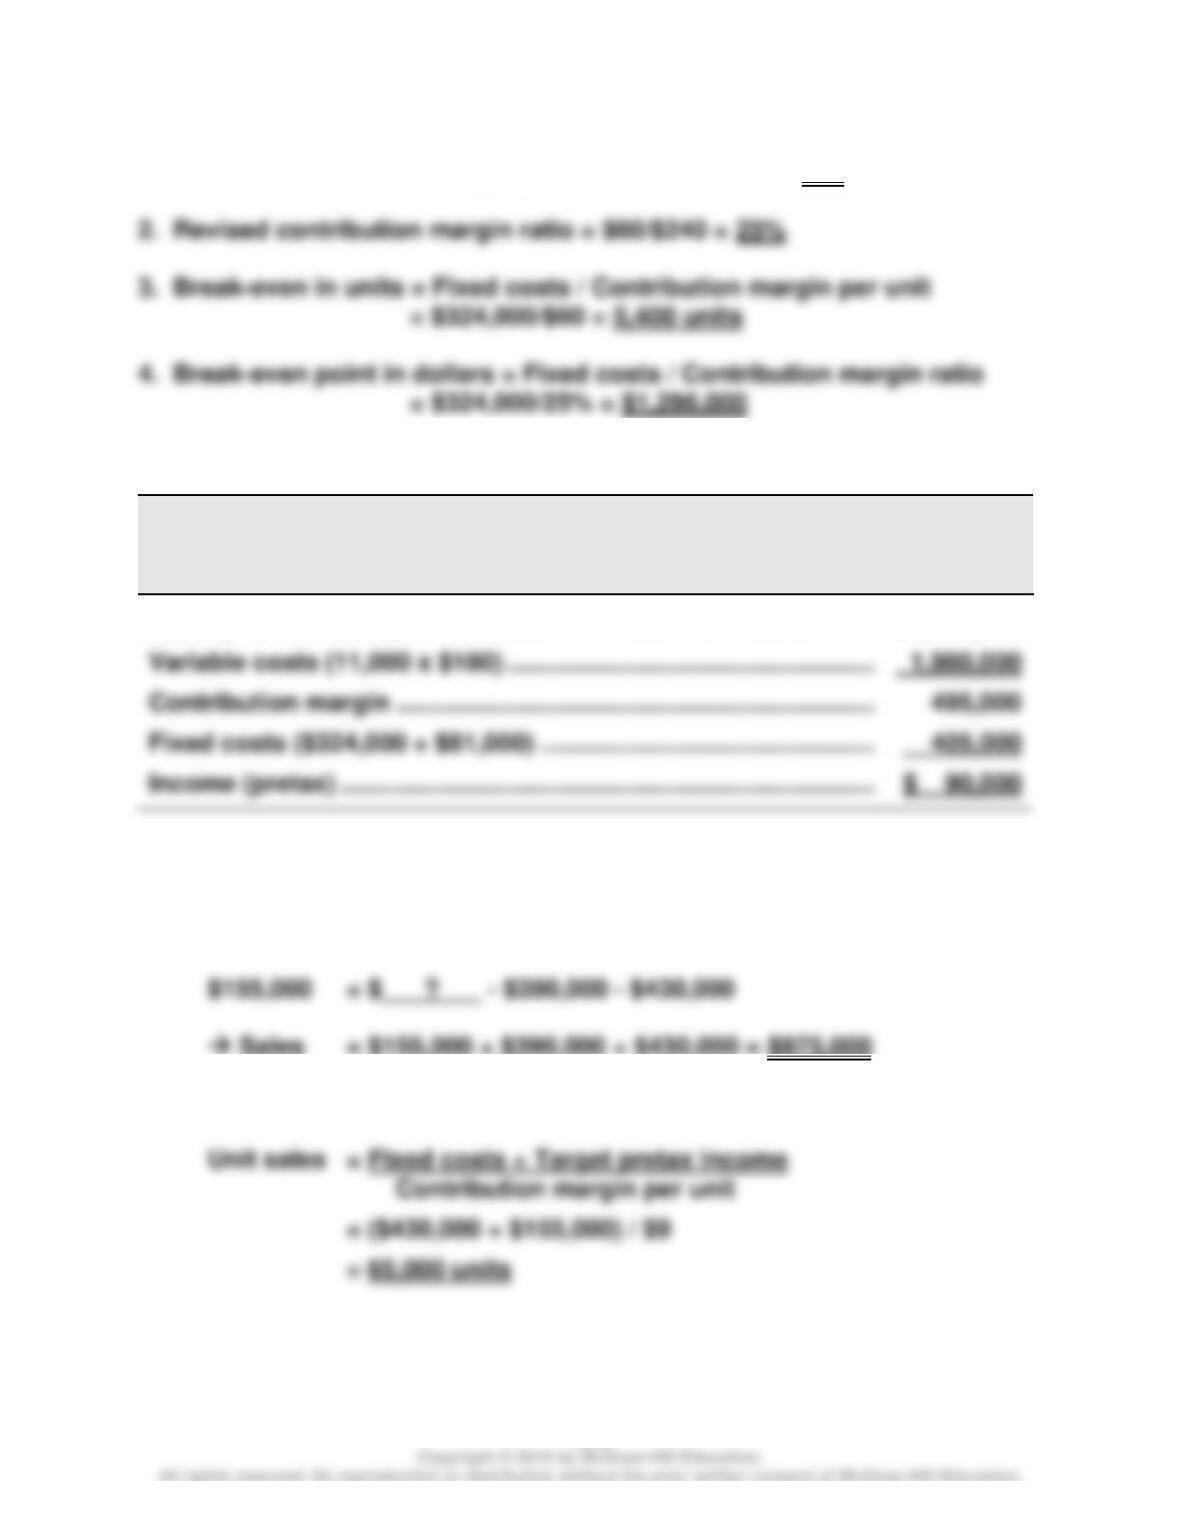
Exercise 18-19 (10 minutes)
1. Revised contribution margin per unit = $240 – $180 = $60
Exercise 18–20 (15 minutes)
HUDSON CO.
Forecasted Contribution Margin Income Statement
For Year Ended December 31, 2020
Sales (11,000 x $225) ……………………………………………………………….
$2,475,000
Variable costs (11,000 x $180) ………………………………………………….
Fixed costs ($324,000 + $81,000) ……………………………………………..
Exercise 18-21 (20 minutes)
1. Pretax income = Sales – Variable costs – Fixed costs
→ Sales = $155,000 + $390,000 + $430,000 = $975,000
2. Instructor note: Use equation in Exhibit 18.23;