1031
Problem 17–4B (Concluded)
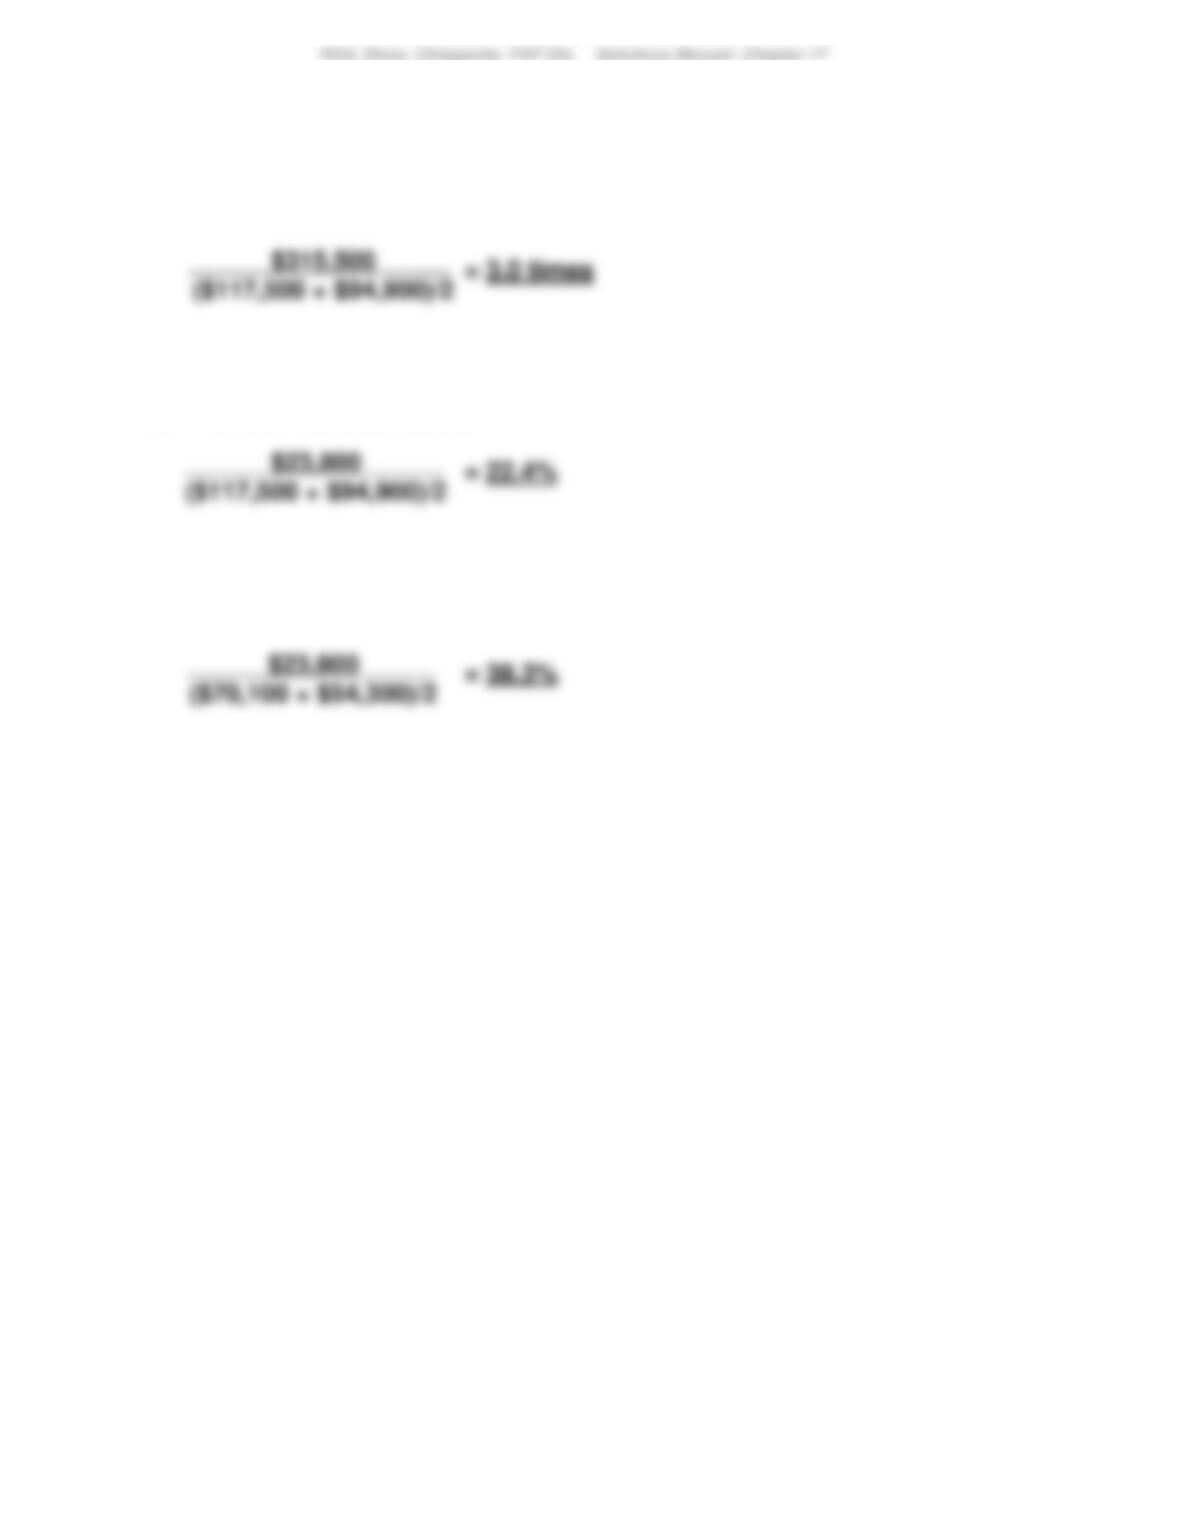
9. Total asset turnover
10. Return on total assets
11. Return on common stockholders’ equity
1032
Problem 17-5B (60 minutes)
Part 1
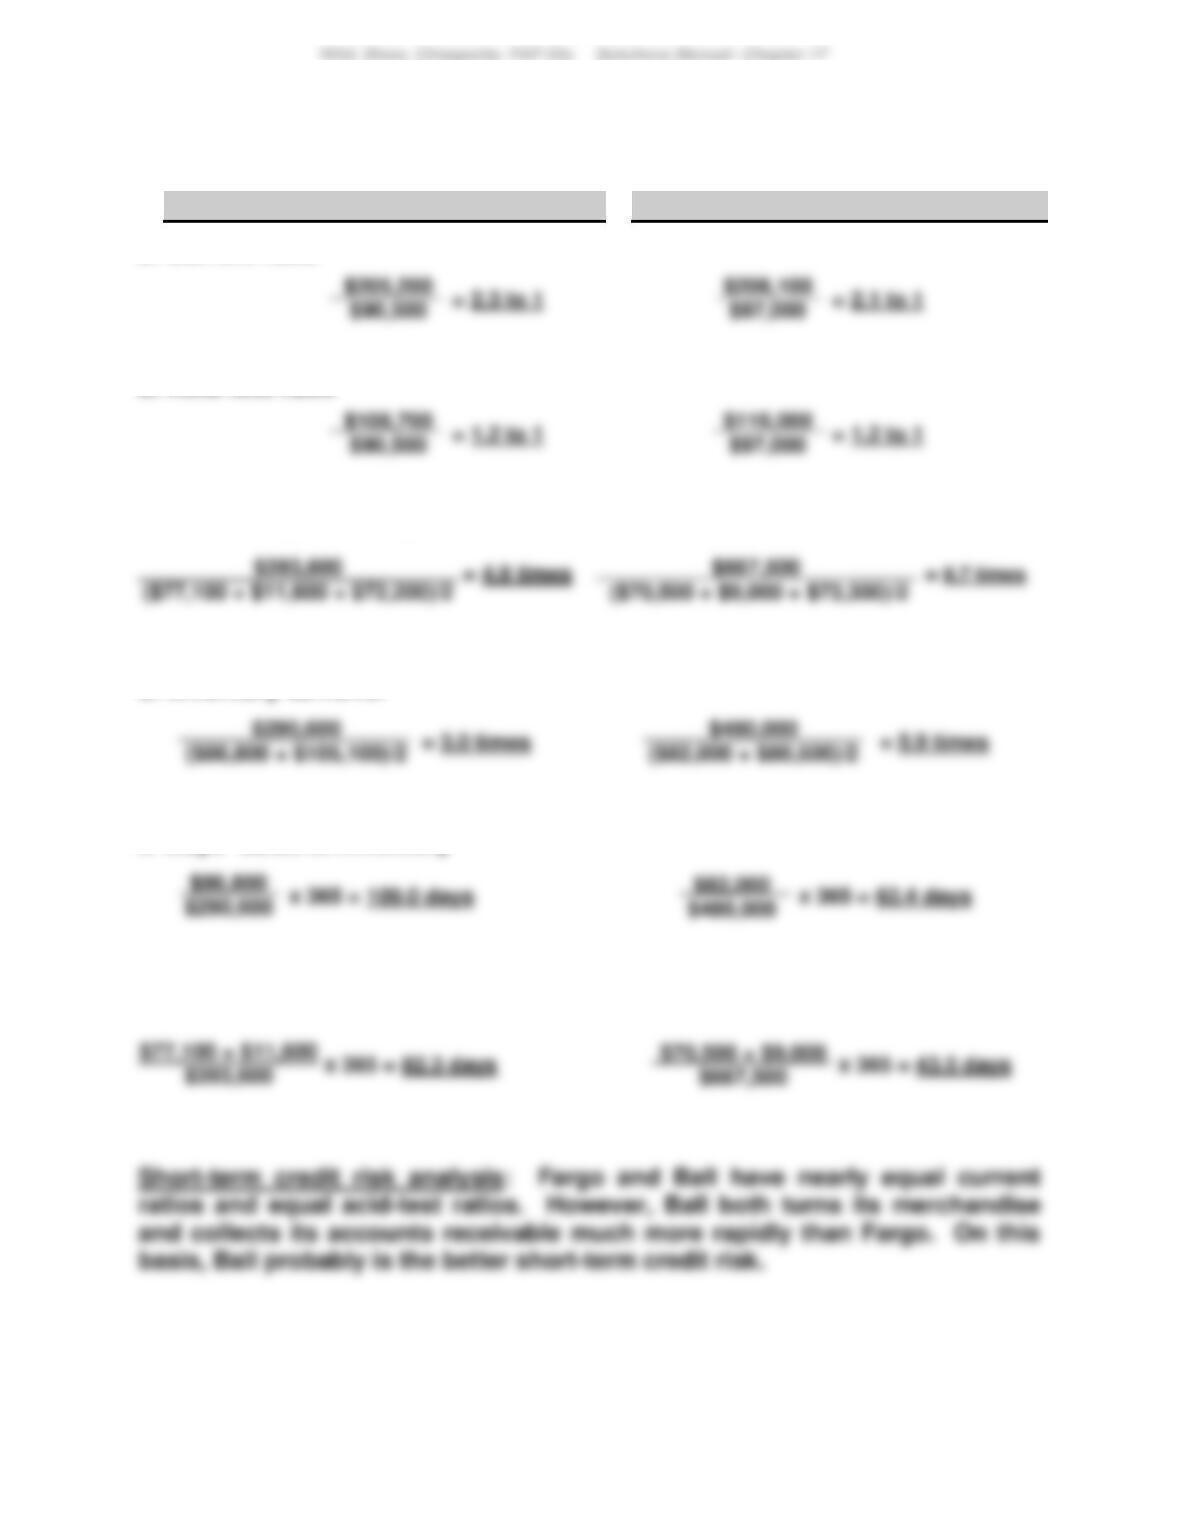
Fargo Company
Ball Company
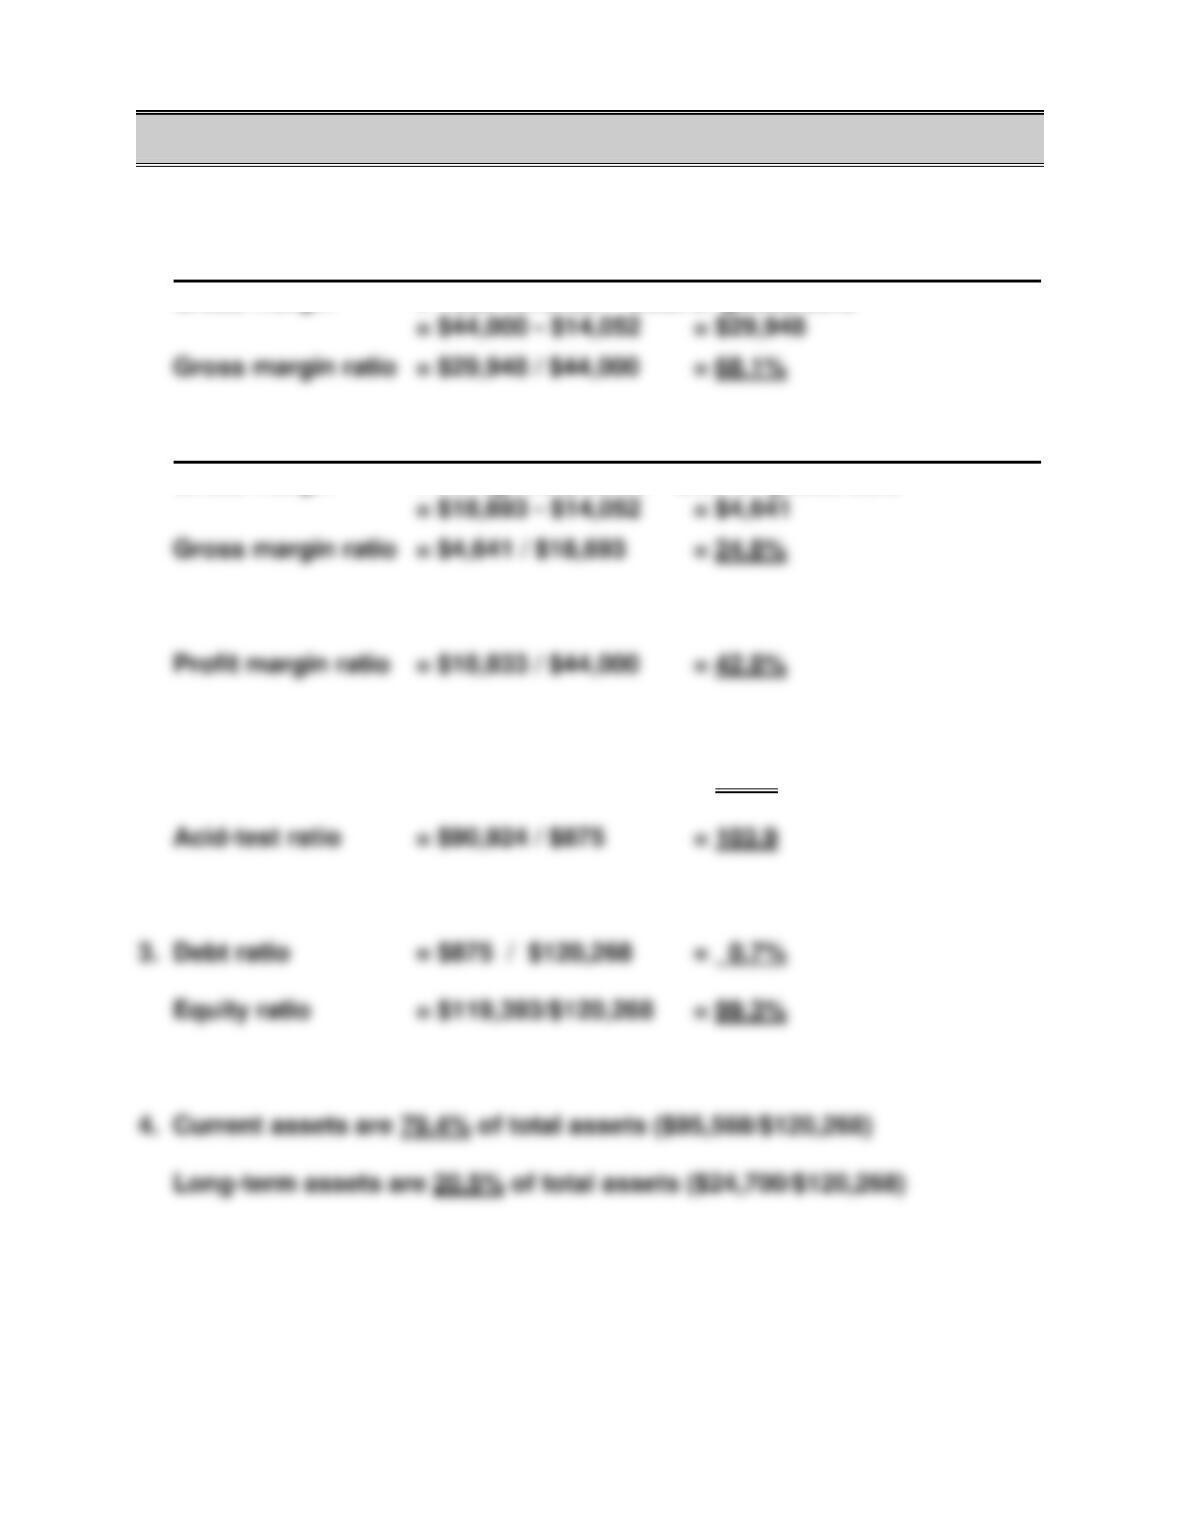
a. Current ratio
b. Acid-test ratio
c. Accounts (and notes) receivable turnover
d. Inventory turnover
e. Days’ sales in inventory
f. Days’ sales uncollected
1033
Problem 17-5B (Concluded)
Part 2
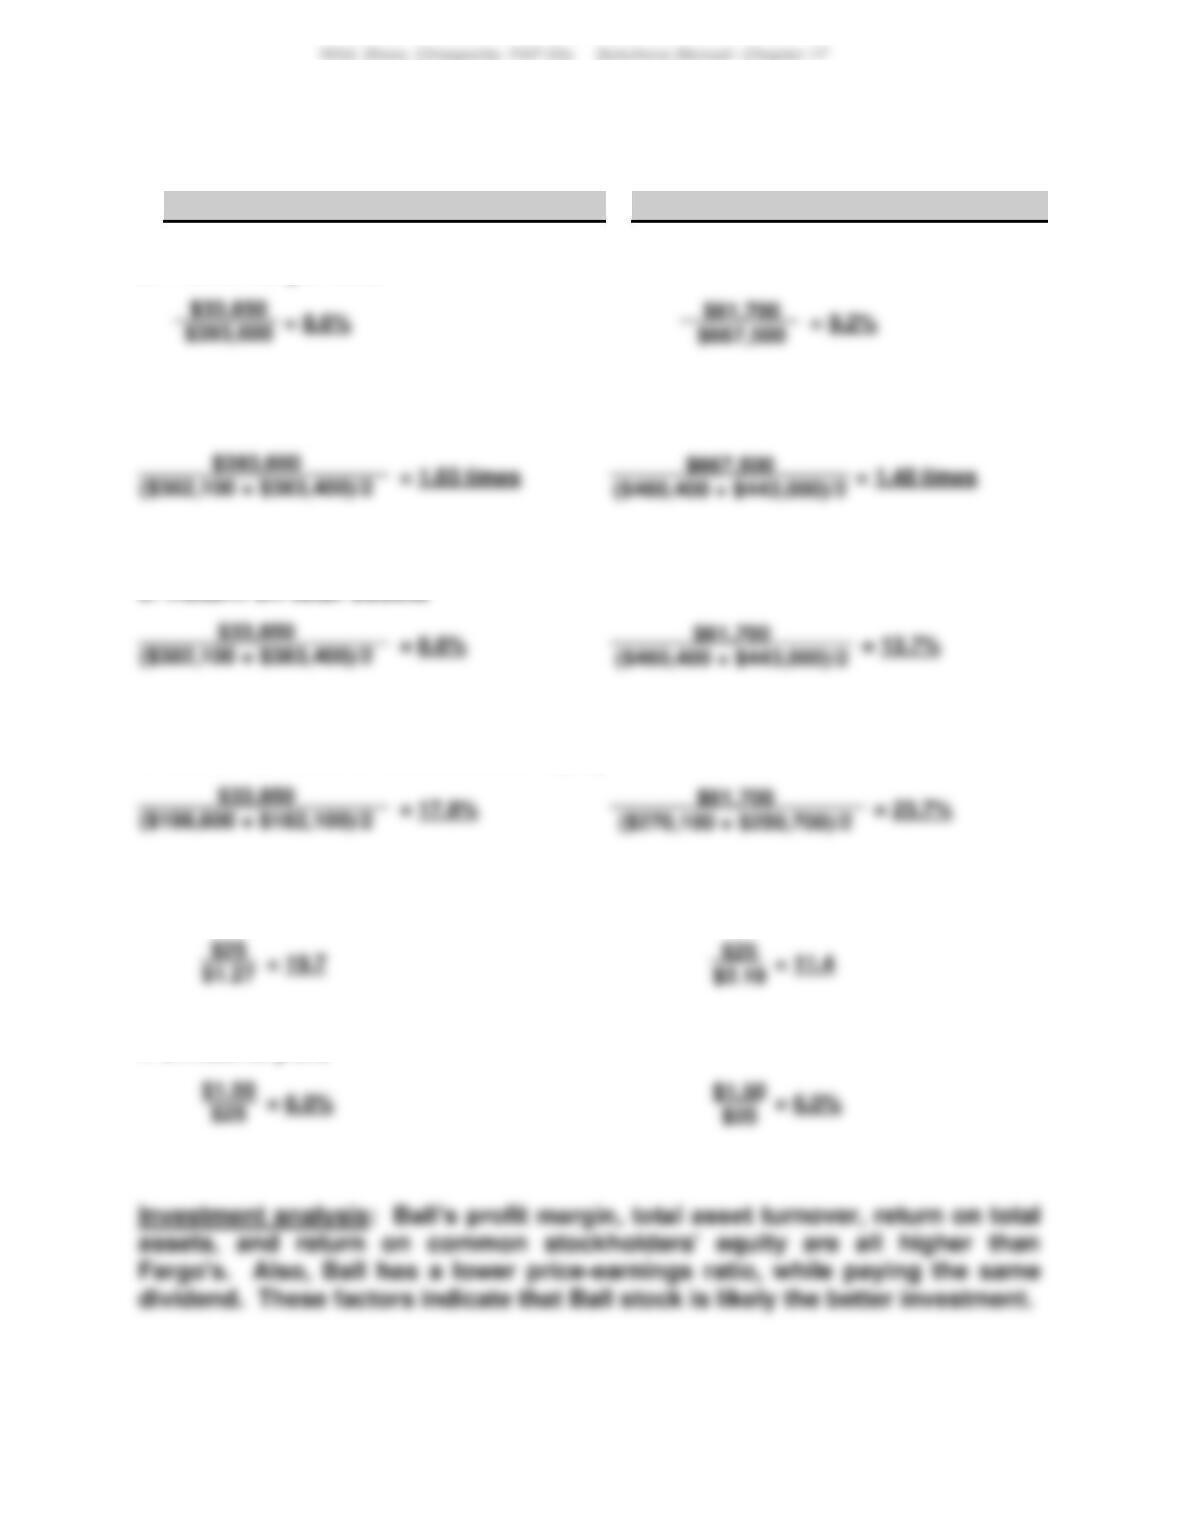
Fargo Company
Ball Company
a. Profit margin ratio
b. Total asset turnover
c. Return on total assets
d. Return on common stockholders’ equity
e. Price-earnings ratio
f. Dividend yield
1034
Problem 17–6BA (60 minutes)
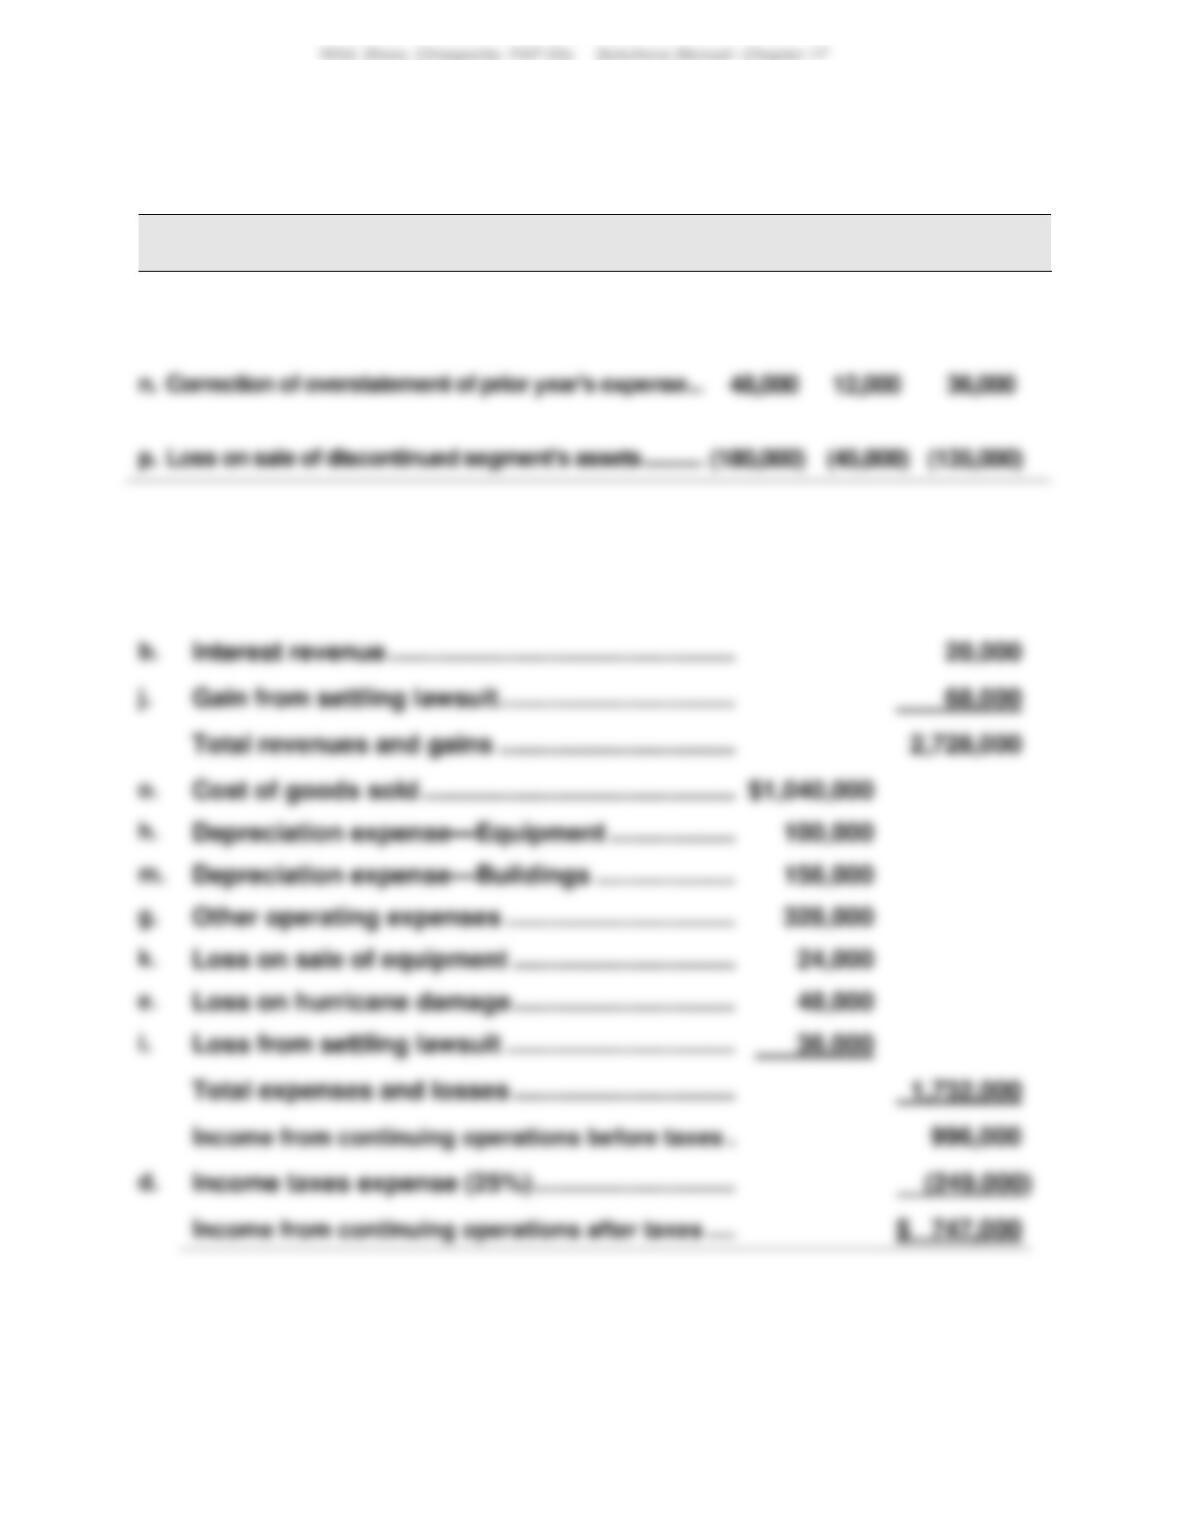
Part 1 Effect of income taxes (debits or losses in parentheses)
Pretax
25% Tax
Effect
After–Tax
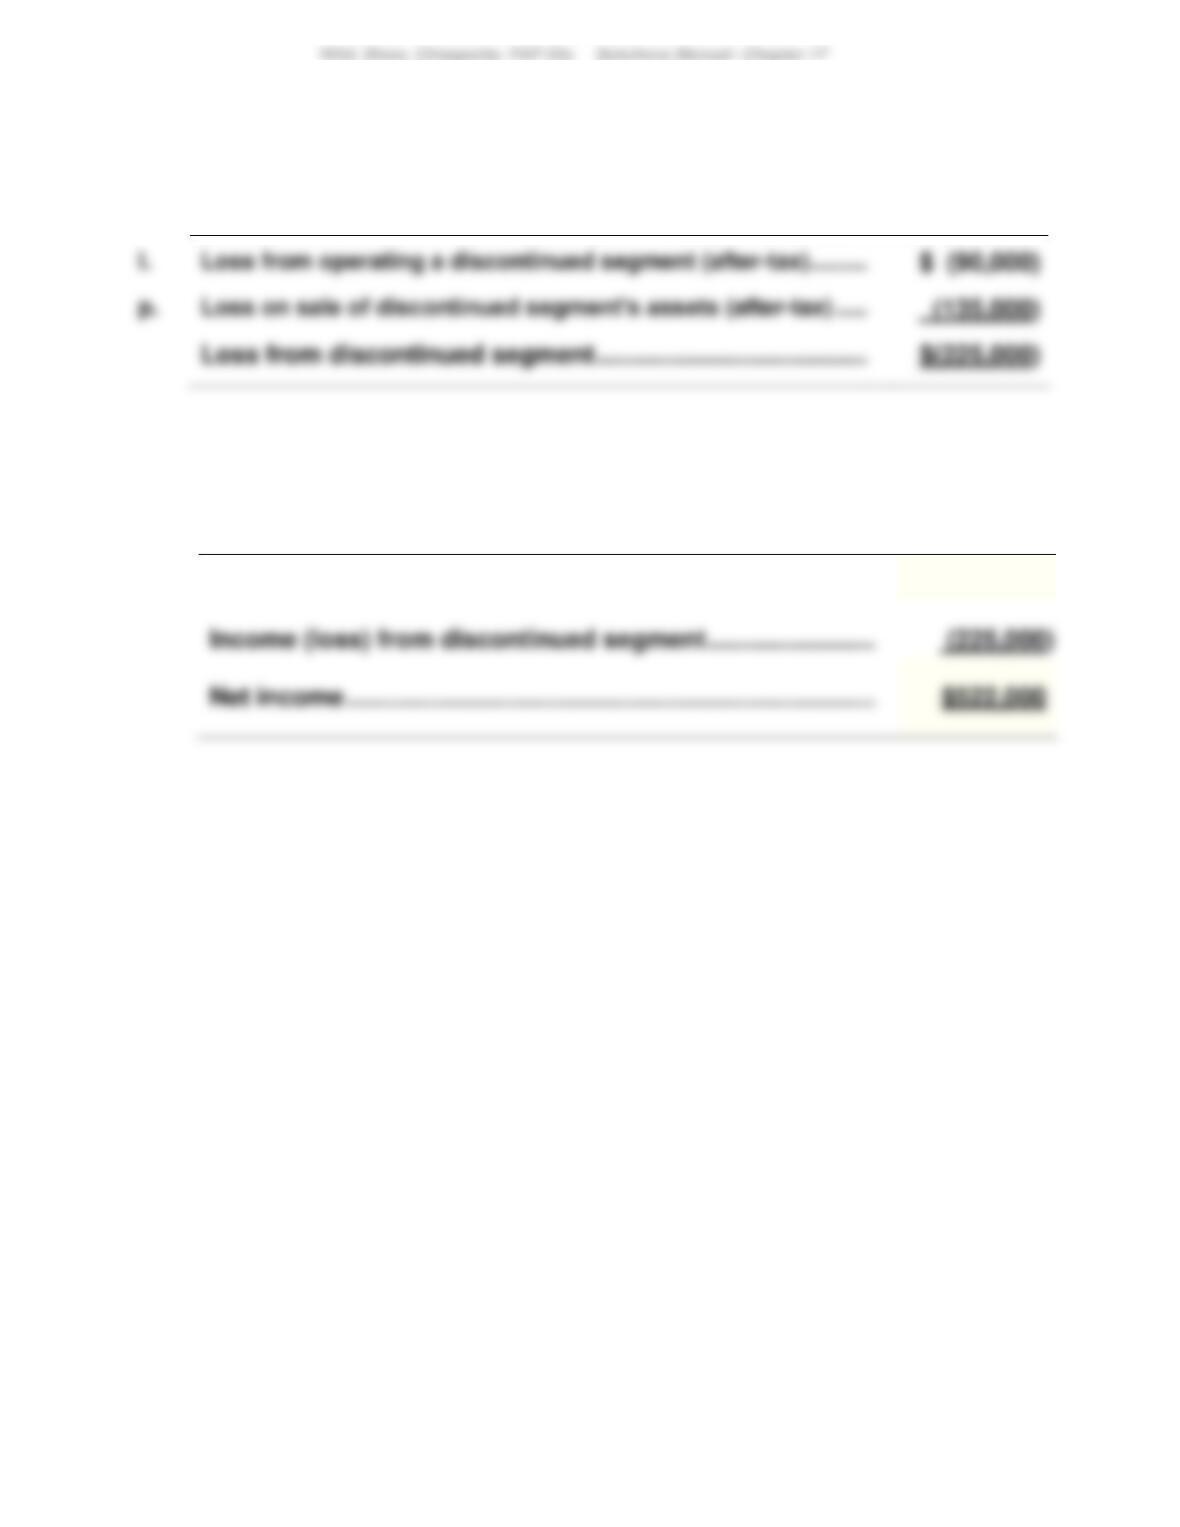
l. Loss from operating a discontinued segment …………………….
(120,000)
(30,000)
(90,000)
12,000
Part 2 Income from continuing operations (and its components)
c.
Net sales ……………………………………………………….
$2,640,000
Depreciation expense—Equipment ………………………..
k.
1035
Problem 17–6BA (Concluded)
Part 3 Income from discontinued segment
Part 4 Net income
Income from continuing operations after taxes …………………………..
$747,000
Income (loss) from discontinued segment …………………………..
Wild, Shaw, Chiappetta, FAP 23e Solutions Manual: Chapter 17
1036
SERIAL PROBLEM — SP 17
Serial Problem — SP 17, Business Solutions (45 minutes)
1. Gross margin with services revenue
Gross margin = Total revenue – Cost of goods sold
Gross margin without services revenue
Gross margin = Net (goods) sales – Cost of goods sold
2. Current ratio = $95,568 / $875 = 109.2
Wild, Shaw, Chiappetta, FAP 23e Solutions Manual: Chapter 17
1037
Reporting in Action — BTN 17-1
1. Trend percents for selected income statement accounts
($ in millions)
Fiscal
2015
Fiscal
2014
Fiscal
2013
Net Sales ………………………………………………………
136.7%
107.0%
100.0%
$233,715
$182,795
$170,910
2. Common–size percents for asset categories and accounts
($ in millions)
Sep. 26, 2015
Sep. 27, 2014
Total current assets ………………………………………
30.8%
29.6%
Property, plant and equipment, net ……………….
3.
• For fiscal 2015 & 2014, net sales grew at a larger percent than cost of sales.
• Operating income slightly increased in 2014 but greatly increased in 2015.
131.4%
105.3%
100.0%
$140,089
$112,258
$106,606
107.2%
100.0%
100.0%
145.8%
106.5%
100.0%
106.7%
100.0%
Wild, Shaw, Chiappetta, FAP 23e Solutions Manual: Chapter 17
1038
Comparative Analysis — BTN 17-2
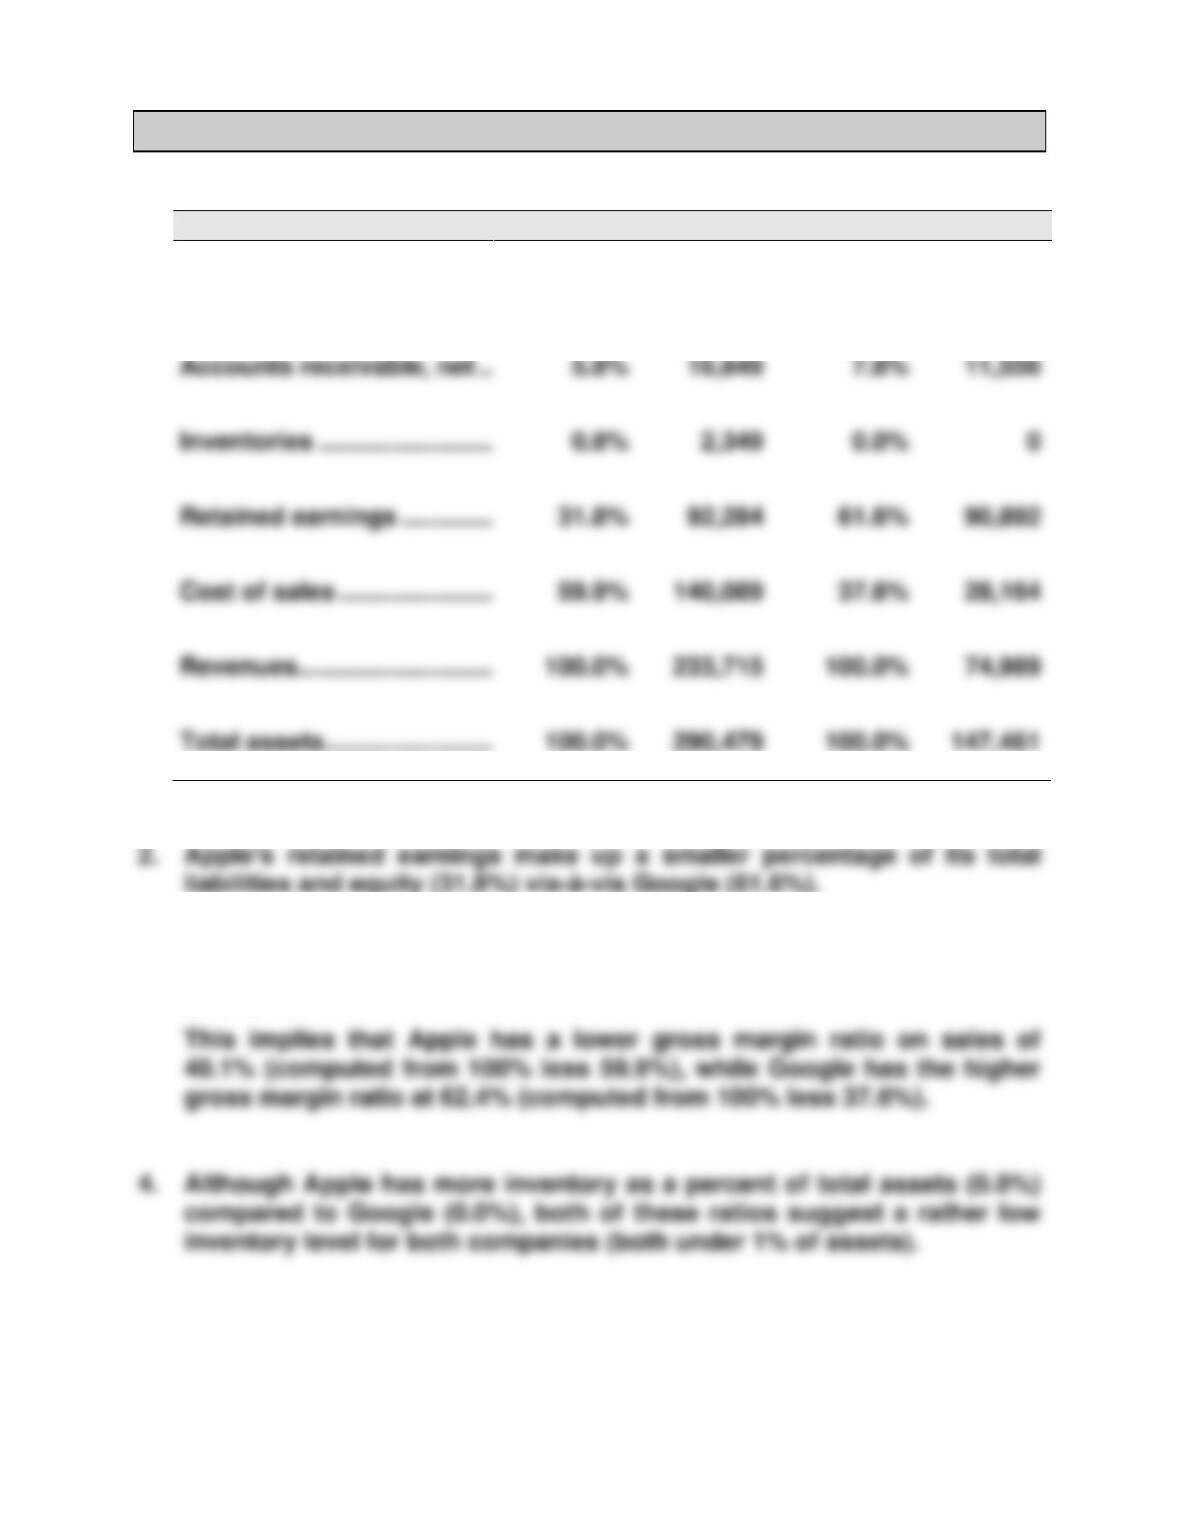
1.
Key figures ($ millions)
Apple
Google
Cash and equivalents …………
7.3%
$21,120
11.2%
$16,549
3. Apple’s cost of sales percent is higher at 59.9% compared to Google’s
at 37.6%.
140,089
Wild, Shaw, Chiappetta, FAP 23e Solutions Manual: Chapter 17
1039
Ethics Challenge — BTN 17-3
1. The CEO appears to have selectively chosen from the 11 available
ratios to present only the ones that show trends that are favorable to
2. The consequences of this action by the CEO might be mixed. It is likely
that the analysts will ask other questions that may reveal some
Communicating in Practice — BTN 17-4
There is no set solution to this activity. Each team’s memorandum will
vary based on the industry and companies chosen for analysis.
Wild, Shaw, Chiappetta, FAP 23e Solutions Manual: Chapter 17
1040
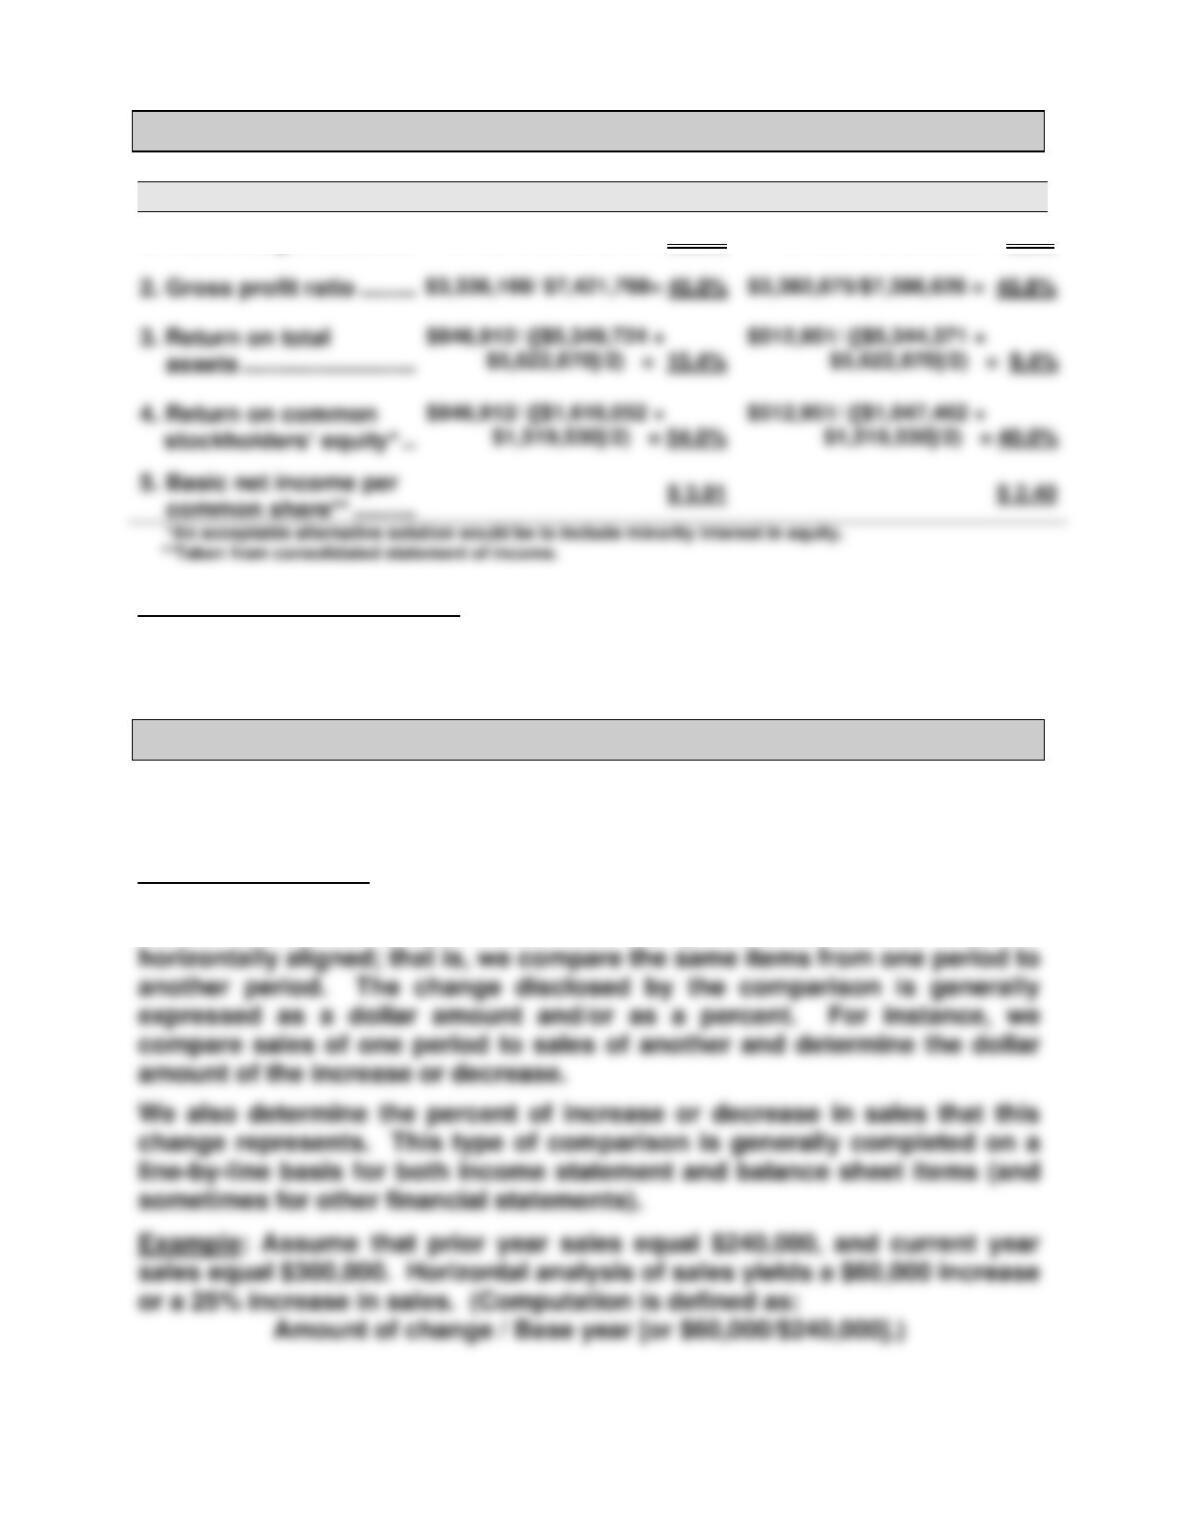
Taking It to the Net — BTN 17–5
($ thousands)
As of 12/31/2014
As of 12/31/2015
1. Profit margin ratio ……………..
$846,912/$7,421,768 = 11.4%
$512,951/$7,386,626 = 6.9%
Analysis and Interpretation: Hershey’s performance generally worsened in
all areas evaluated for the profitability metrics reported in the table above
with the exception of gross profit.
Teamwork in Action — BTN 17-6
Part 1
Team reports should look something like the following:
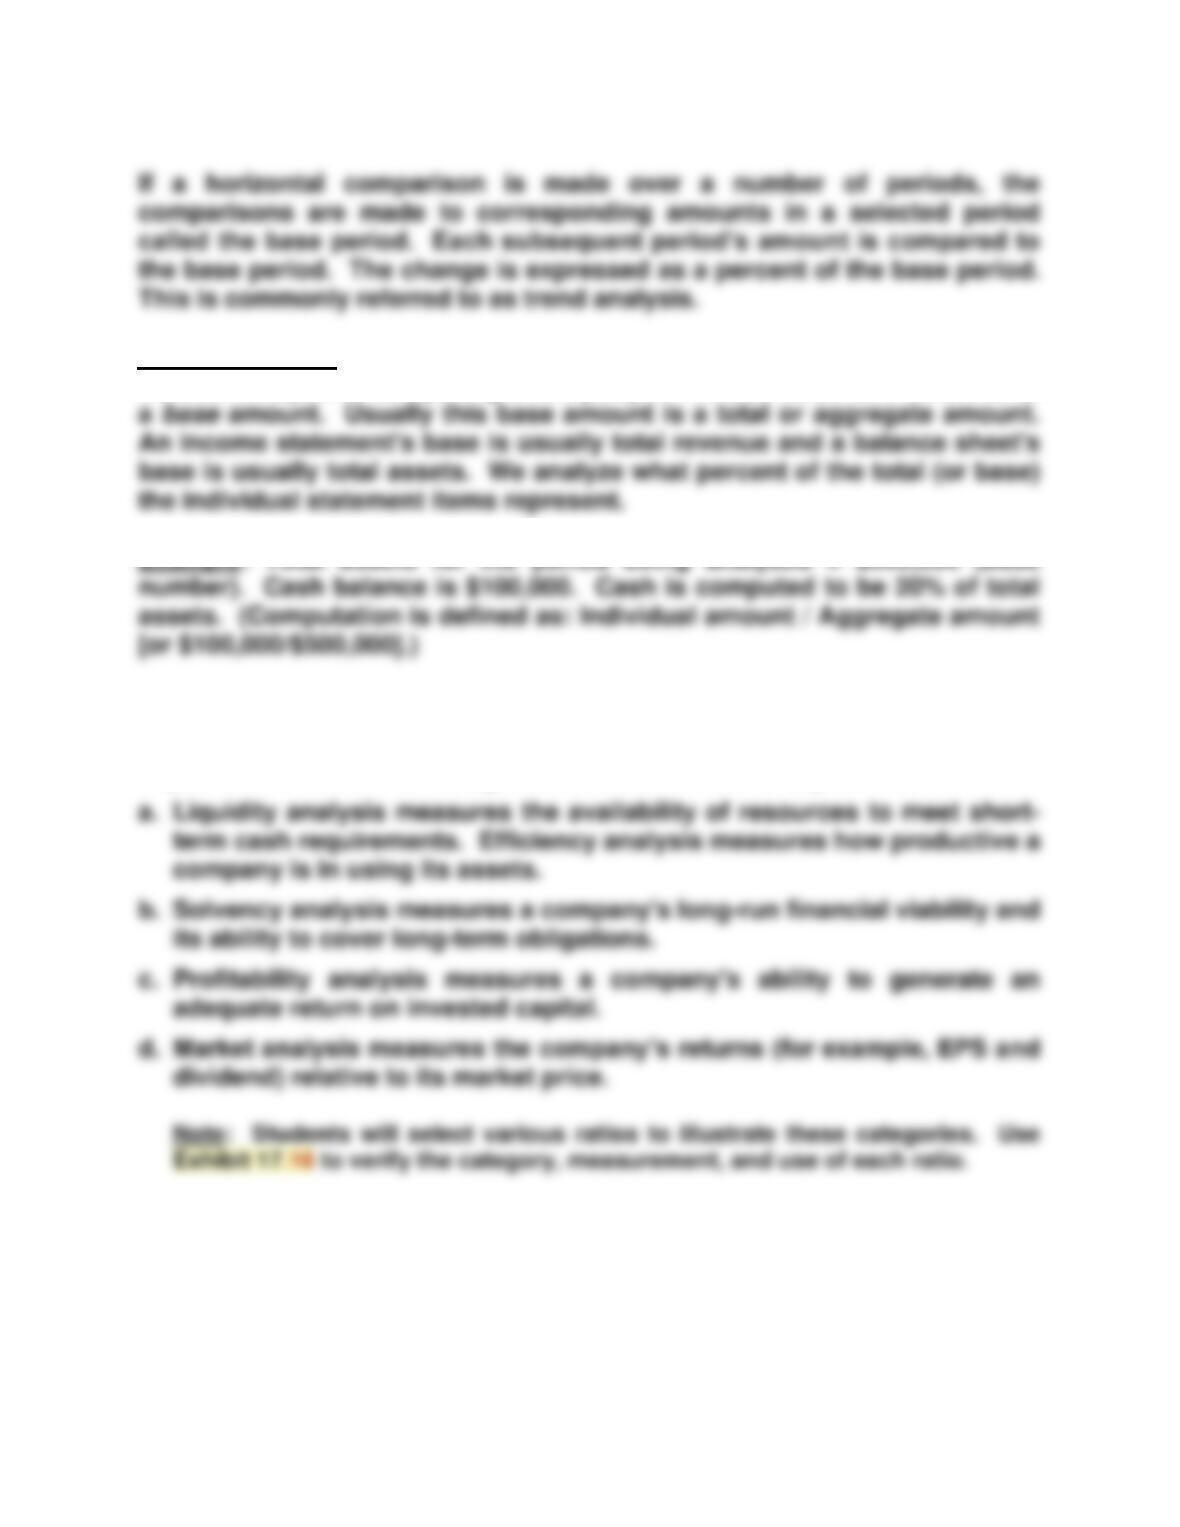
Horizontal Analysis
Horizontal analysis is comparing a company’s financial statement amounts
across time. We compare data from comparative statements that are
2. Gross profit ratio ………………
Wild, Shaw, Chiappetta, FAP 23e Solutions Manual: Chapter 17
1041
Teamwork in Action (Concluded)
Vertical Analysis
Vertical analysis is comparing a company’s financial statement amounts to
Part 2
Explanations of the four categories or areas of ratio analysis follow:
Part 3
Each team member presents results to the entire team.
Wild, Shaw, Chiappetta, FAP 23e Solutions Manual: Chapter 17
Entrepreneurial Decision — BTN 17–7
1. No. Although the current ratio improved over the three-year period, the
acid-test ratio declined and accounts receivable and merchandise
Hitting the Road — BTN 17-8
One possible strategy to fulfill the requirements of this assignment is:
Wild, Shaw, Chiappetta, FAP 23e Solutions Manual: Chapter 17
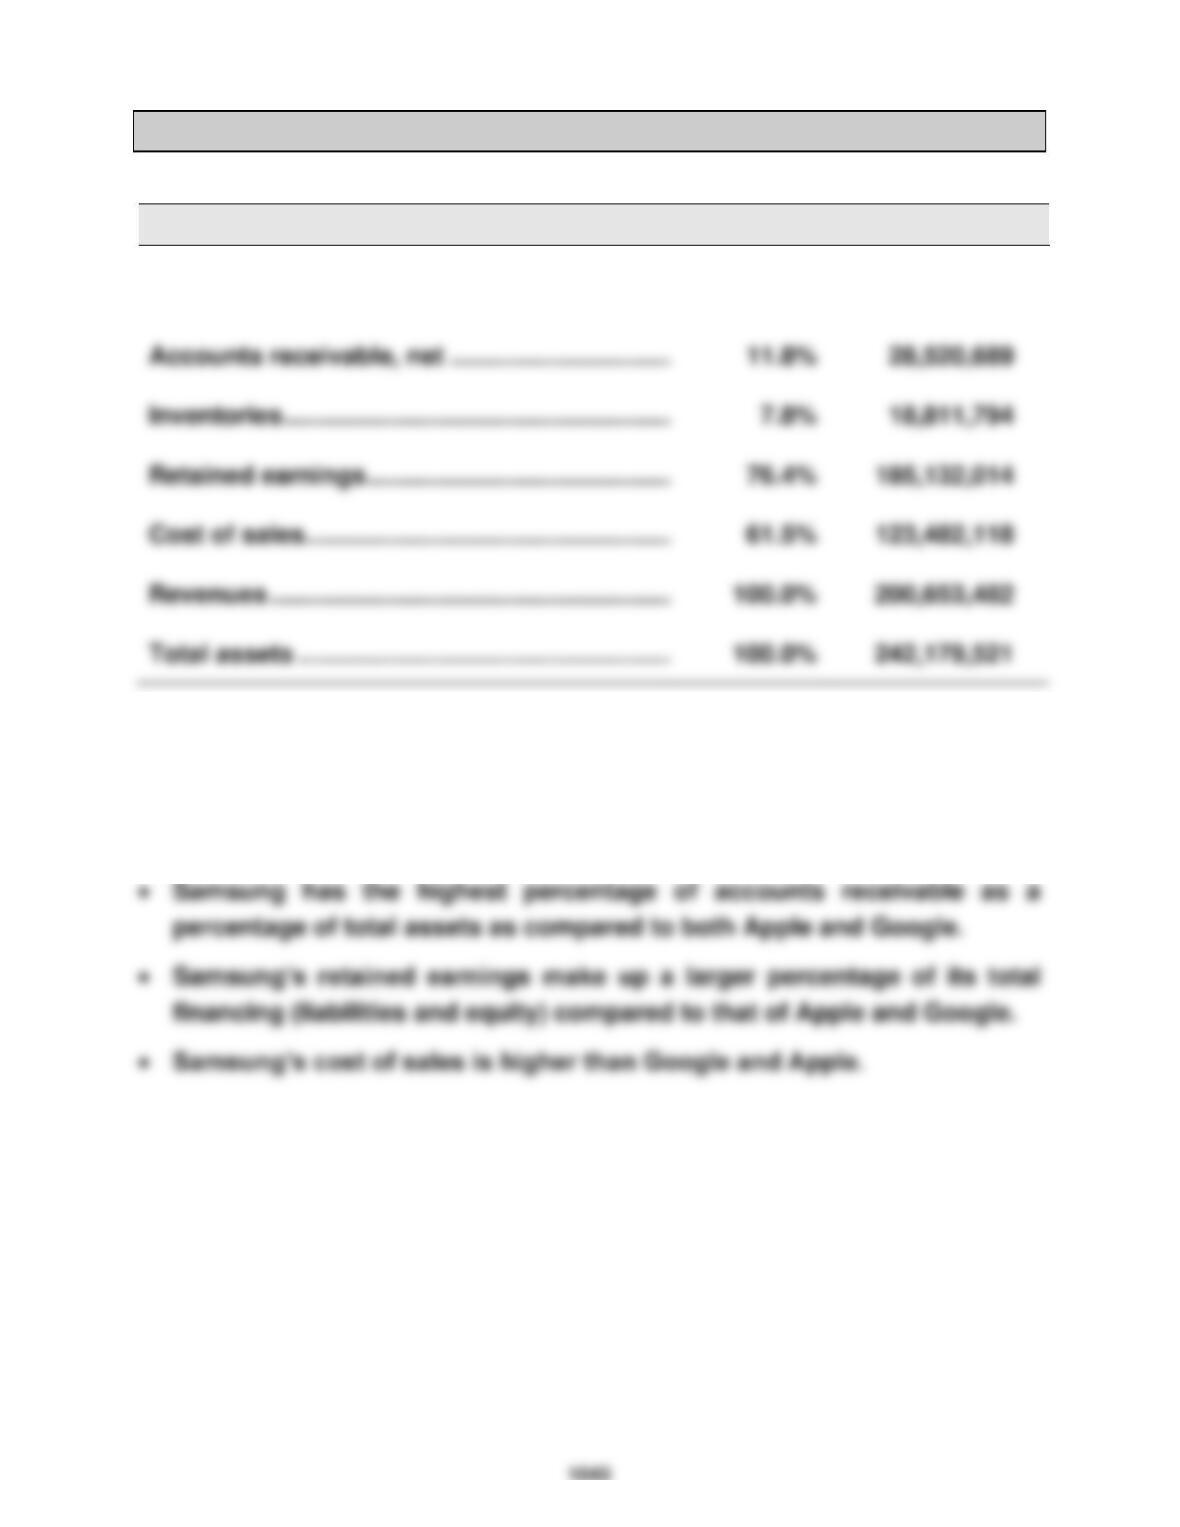
Global Decision — BTN 17–9
1.
Key figures (KRW in millions)
Samsung
Cash and equivalents …………………………………..
9.3%
₩ 22,636,744
Accounts receivable, net …………………………..
7.8%
Revenues …………………………………………………….
2. Comparisons and comments:
• Samsung’s cash and equivalents is greater than Apple and less than
Google as a percent of assets.