1. Horizontal analysis is the percentage analysis of increases and decreases in corresponding
statements. The percent change in the cash balances at the end of the preceding year from the
2. Comparative statements provide information as to changes between dates or periods. Trends
p
3. Before this question can be answered, the increase in net income should be compared with
changes in sales, expenses, and assets devoted to the business for the current year. The return
5. a. A high inventory turnover minimizes the amount invested in inventories, thus freeing
funds for more advantageous use. Storage costs, administrative expenses, and losses
b
b
6. The ratio of fixed assets to long-term liabilities increased from 3.4 for the preceding year to
p
7. a. The rate earned on total assets adds interest expense to the net income, which is divided
b
y average total assets. It measures the profitability of the total assets, without regard for how
CHAPTER 17
FINANCIAL STATEMENT ANALYSIS
DISCUSSION QUESTIONS
17-1
p
CHAPTER 17 Financial Statement Analysis
DISCUSSION QUESTIONS (Concluded)
8. a. Due to leverage, the rate on stockholders’ equity will often be greater than the rate on
total assets. This occurs because the amount earned on assets acquired through the use of
10. One report is the Report on Internal Control, which verifies management’s conclusions on
17-2
CHAPTER 17 Financial Statement Analysis
PE 17–1A
PE 17–1B
PE 17–2A
Amount Percentage
PE 17–2B
Amount Percentage
PE 17–3A
a. Current Ratio = Current Assets ÷ Current Liabilities
PRACTICE EXERCISES
17-3
PE 17–3B
a. Current Ratio = Current Assets ÷ Current Liabilities
PE 17–4A
a. Accounts Receivable Turnover = Net Sales ÷ Average Accounts Receivable
PE 17–4B
a. Accounts Receivable Turnover = Net Sales ÷ Average Accounts Receivable
17-4
CHAPTER 17 Financial Statement Analysis
PE 17–5A
a. Inventory Turnover = Cost of Goods Sold ÷ Average Inventory
PE 17–5B
a. Inventory Turnover = Cost of Goods Sold ÷ Average Inventory
PE 17–6A
PE 17–6B
PE 17–7A
PE 17–7B
Fixed Assets
Long-Term Liabilities
Income Before Income Tax +
Interest Expense
Interest Expense
Ratio of Fixed Assets to Long-Term Liabilities
Ratio of Fixed Assets to Long-Term Liabilities
Number of Times
Interest Charges Are Earned =
Number of Times
Interest Charges Are Earned
Interest Expense
Interest Expense
=
Income Before Income Tax +
Fixed Assets
Long-Term Liabilities
a.
=
a. =
17-6
CHAPTER 17 Financial Statement Analysis
PE 17–8A
PE 17–8B
PE 17–9A
PE 17–9B
Rate Earned on Total Assets = Net Income + Interest Expense
Average Total Assets
Rate Earned on Total Assets =
Net Income + Interest Expense
Average Total Assets
17-7
CHAPTER 17 Financial Statement Analysis
PE 17–10A
PE 17–10B
a. Rate Earned on Stockholders’ Equity = Net Income
Average Stockholders’ Equity
a. Rate Earned on Stockholders’ Equity = Net Income
Average Stockholders’ Equity
17-8
CHAPTER 17 Financial Statement Analysis
PE 17–11A
PE 17–11B
a. Net Income – Preferred Dividends
Shares of Common Stock Outstanding
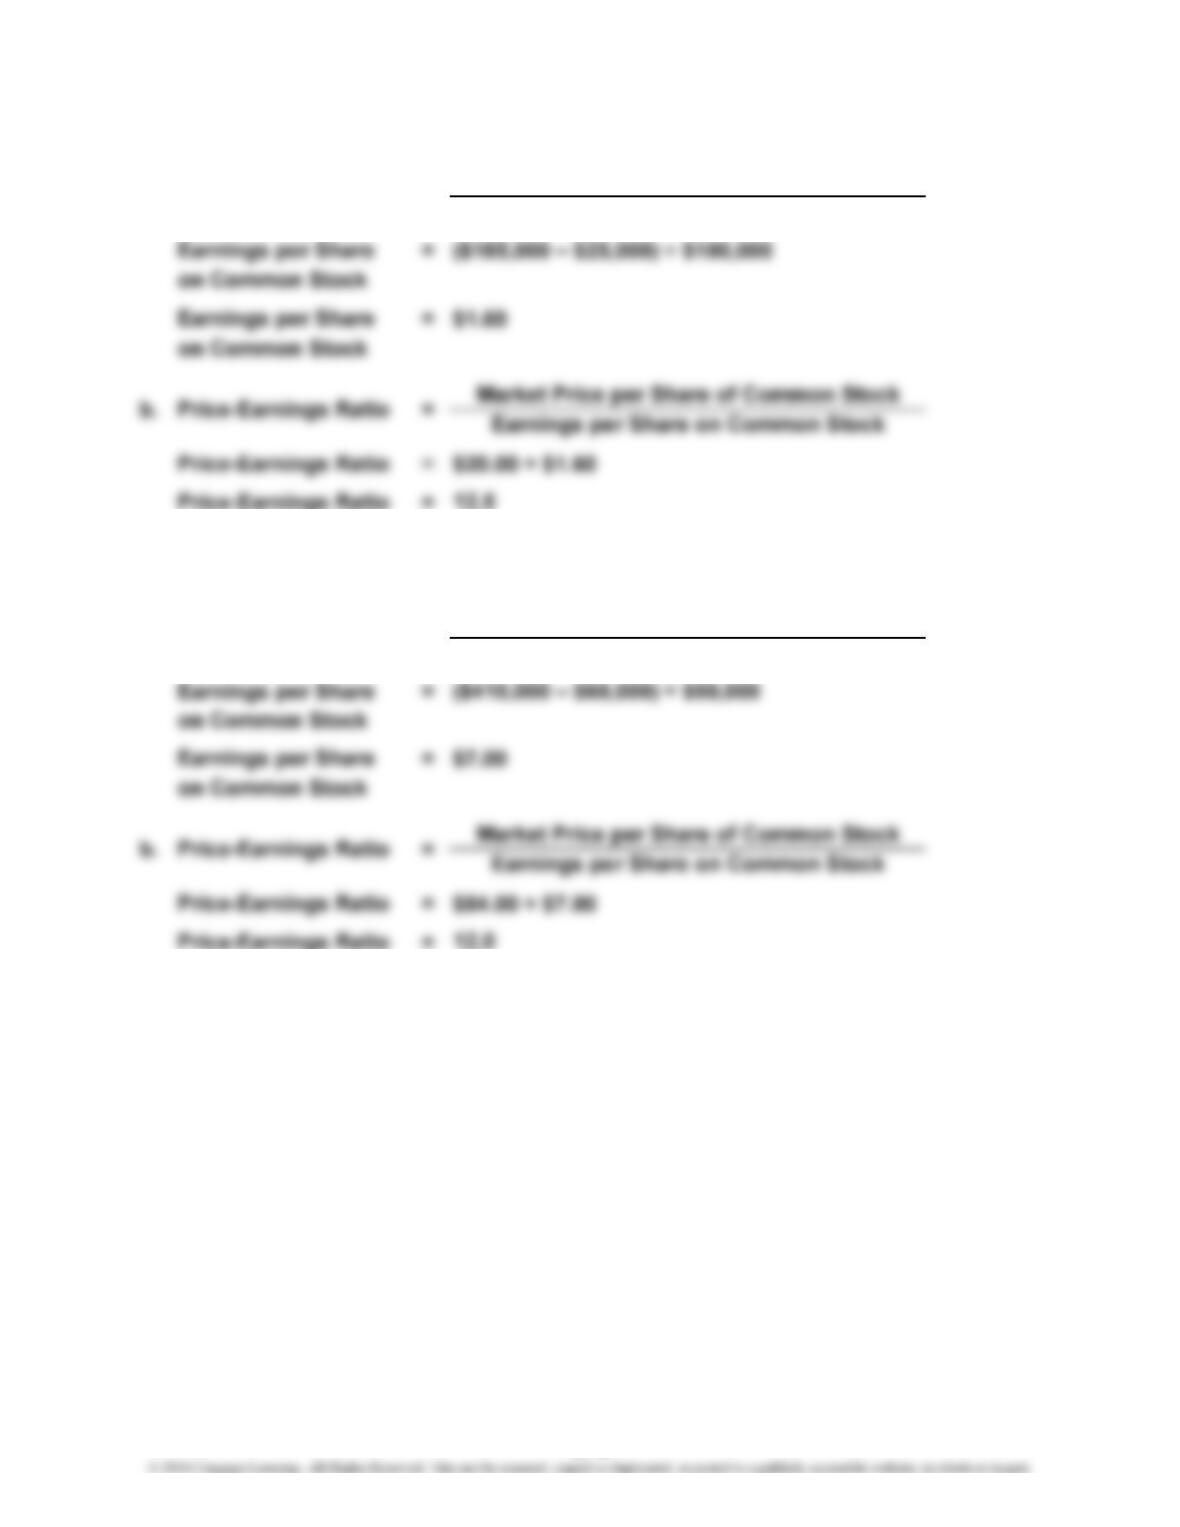
Earnings per Share
on Common Stock =
a. =
Earnings per Share
on Common Stock
Net Income – Preferred Dividends
Shares of Common Stock Outstanding
17-9
CHAPTER 17 Financial Statement Analysis
Ex. 17–1
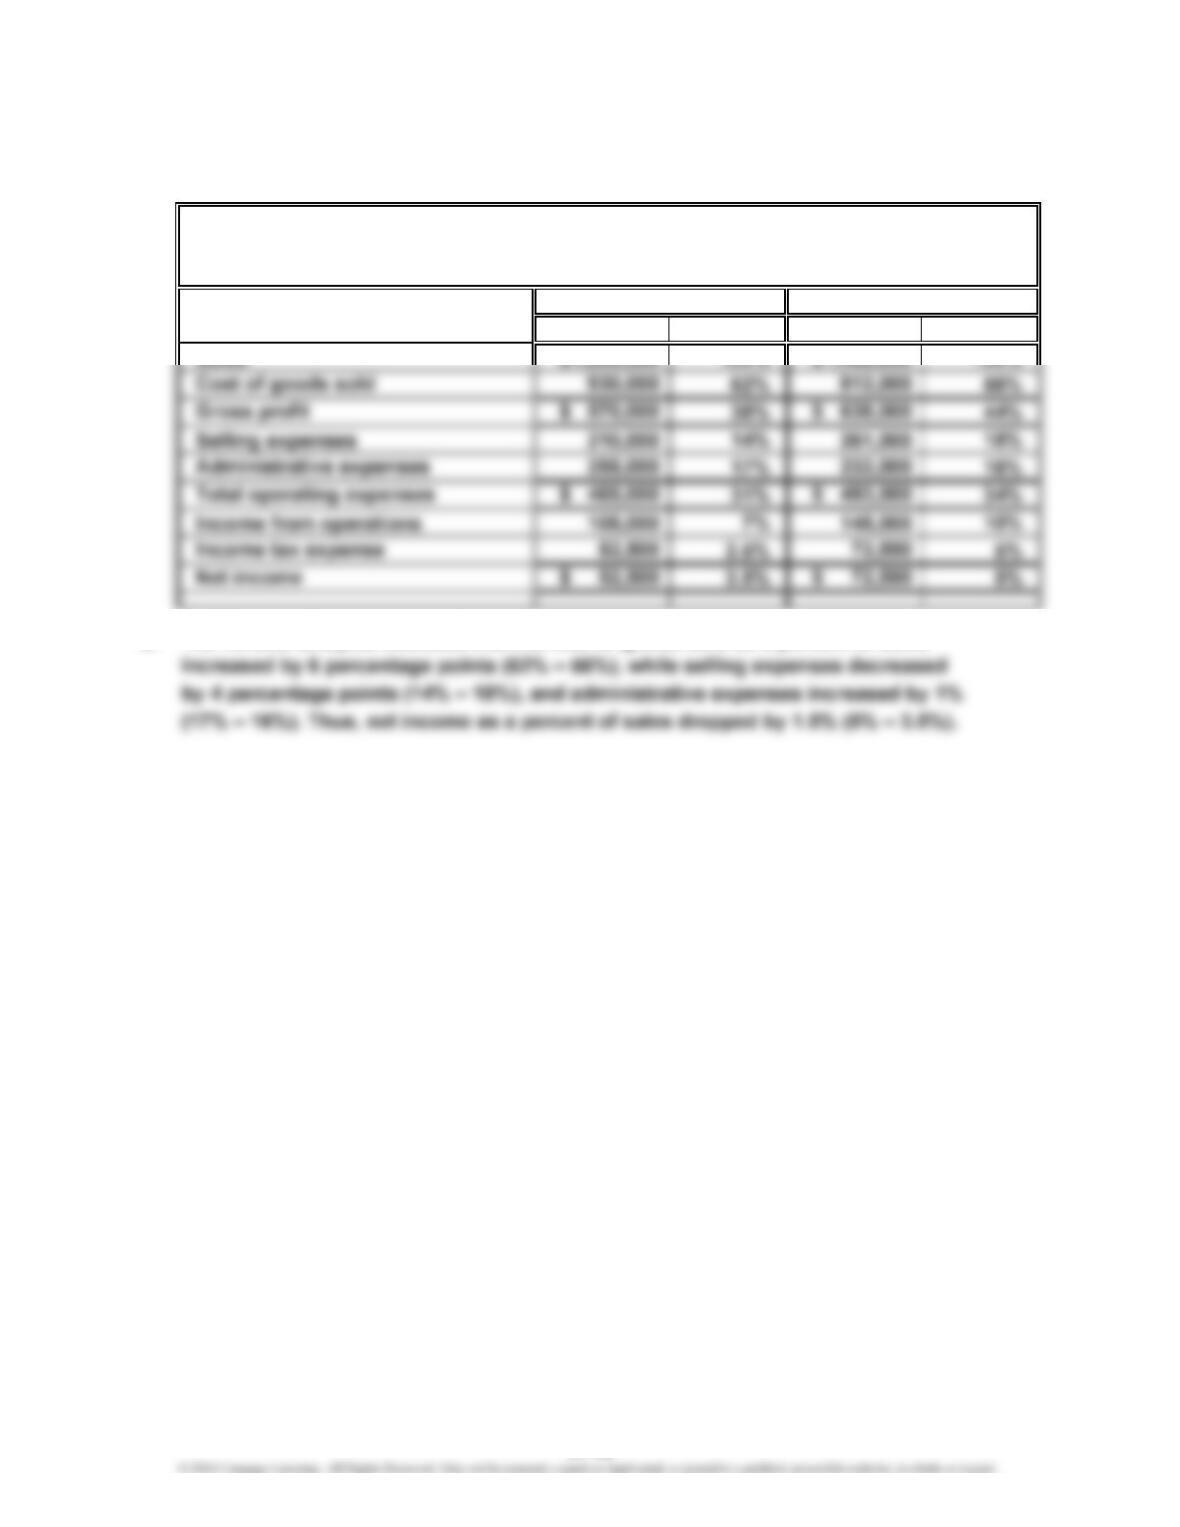
a.
Amount Percent Amount Percent
b. The vertical analysis indicates that the cost of goods sold as a percent of sales
2014 2013
EXERCISES
SOLDNER, Inc.
Comparative Income Statement
For the Years Ended December 31, 2014 and 2013
17-10
CHAPTER 17 Financial Statement Analysis
Ex. 17–2
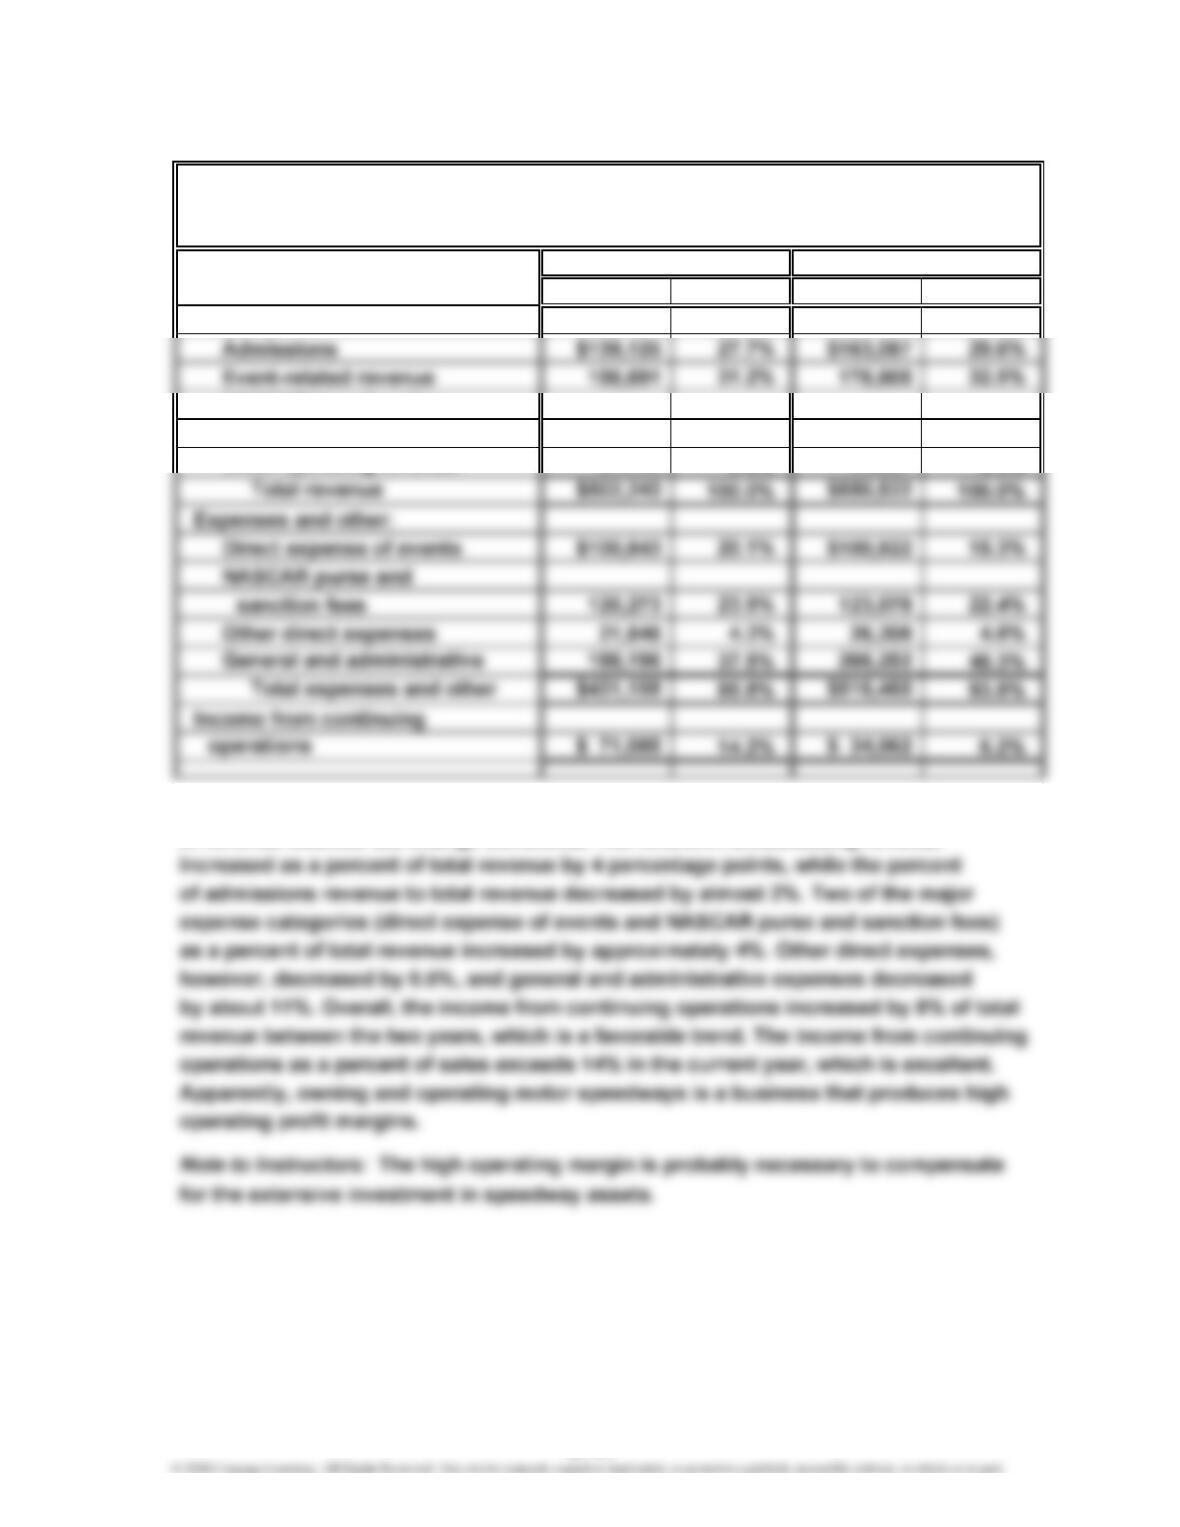
a.
Amount Percent Amount Percent
Revenues:
NASCAR broadcasting
revenue 178,722 35.6% 173,803 31.6%
Other operating revenue 27,705 5.5% 34,827 6.3%
b. While overall revenue decreased some between the two years, the overall mix
of revenue sources did change somewhat. The NASCAR broadcasting revenue
Current Year Prior Year
SPEEDWAY MOTORSPORTS, INC.
Comparative Income Statement (in thousands of dollars)
For the Years Ended December 31
17-11
CHAPTER 17 Financial Statement Analysis
Ex. 17–3
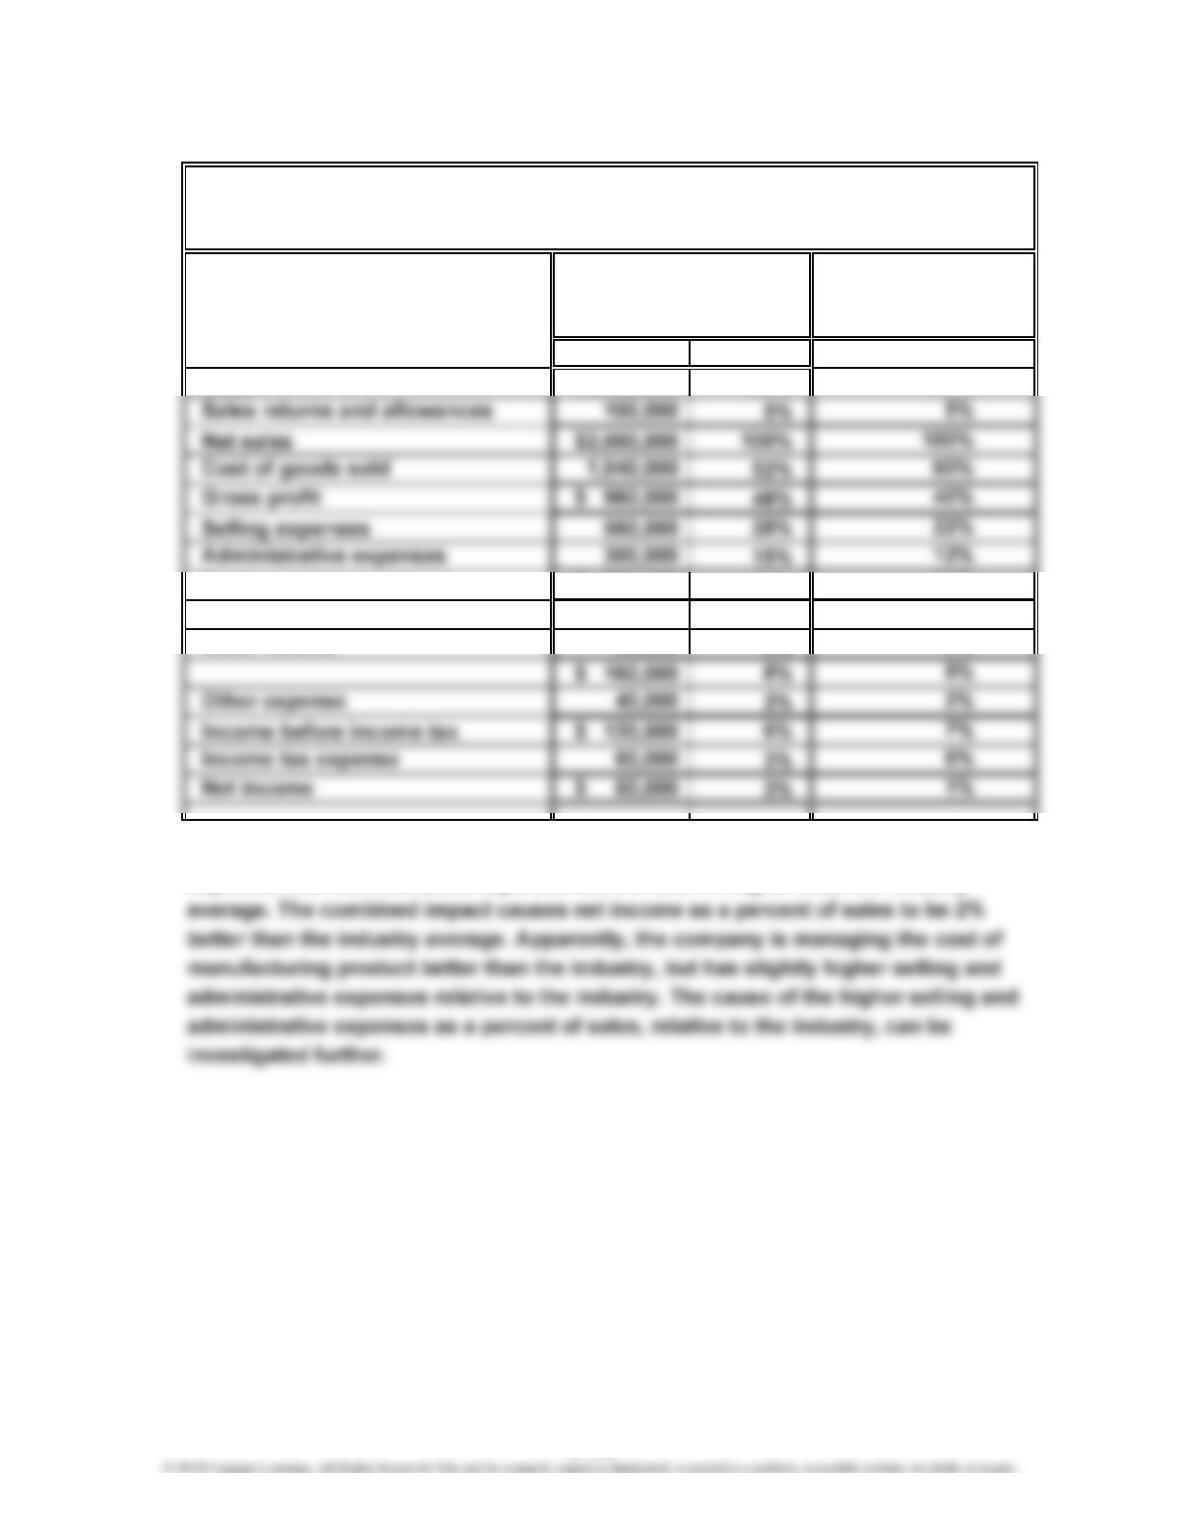
a.
Amount Percent
Sales $2,100,000 105%
Total operating expenses $ 860,000 43%
Operating income 100,000 5%
Other income 60,000 3%
b. The cost of goods sold is 8% lower than the industry average, but the selling
expenses and administrative expenses are 6% and 3% higher than the industry
Bull Run
Company
Industry
Average
Electronics
BULL RUN COMPANY
Common-Sized Income Statement
For the Year Ended December 31, 20—
6%
3%
105%
34%
17-12
CHAPTER 17 Financial Statement Analysis
Ex. 17–4
Amount Percent Amount Percent
Current assets $1,050,000 30% $ 750,000 25%
Ex. 17–5
a.
2014 2013
Amount Amount Amount Percent
Sales $840,000 $600,000 $240,000 40.0%
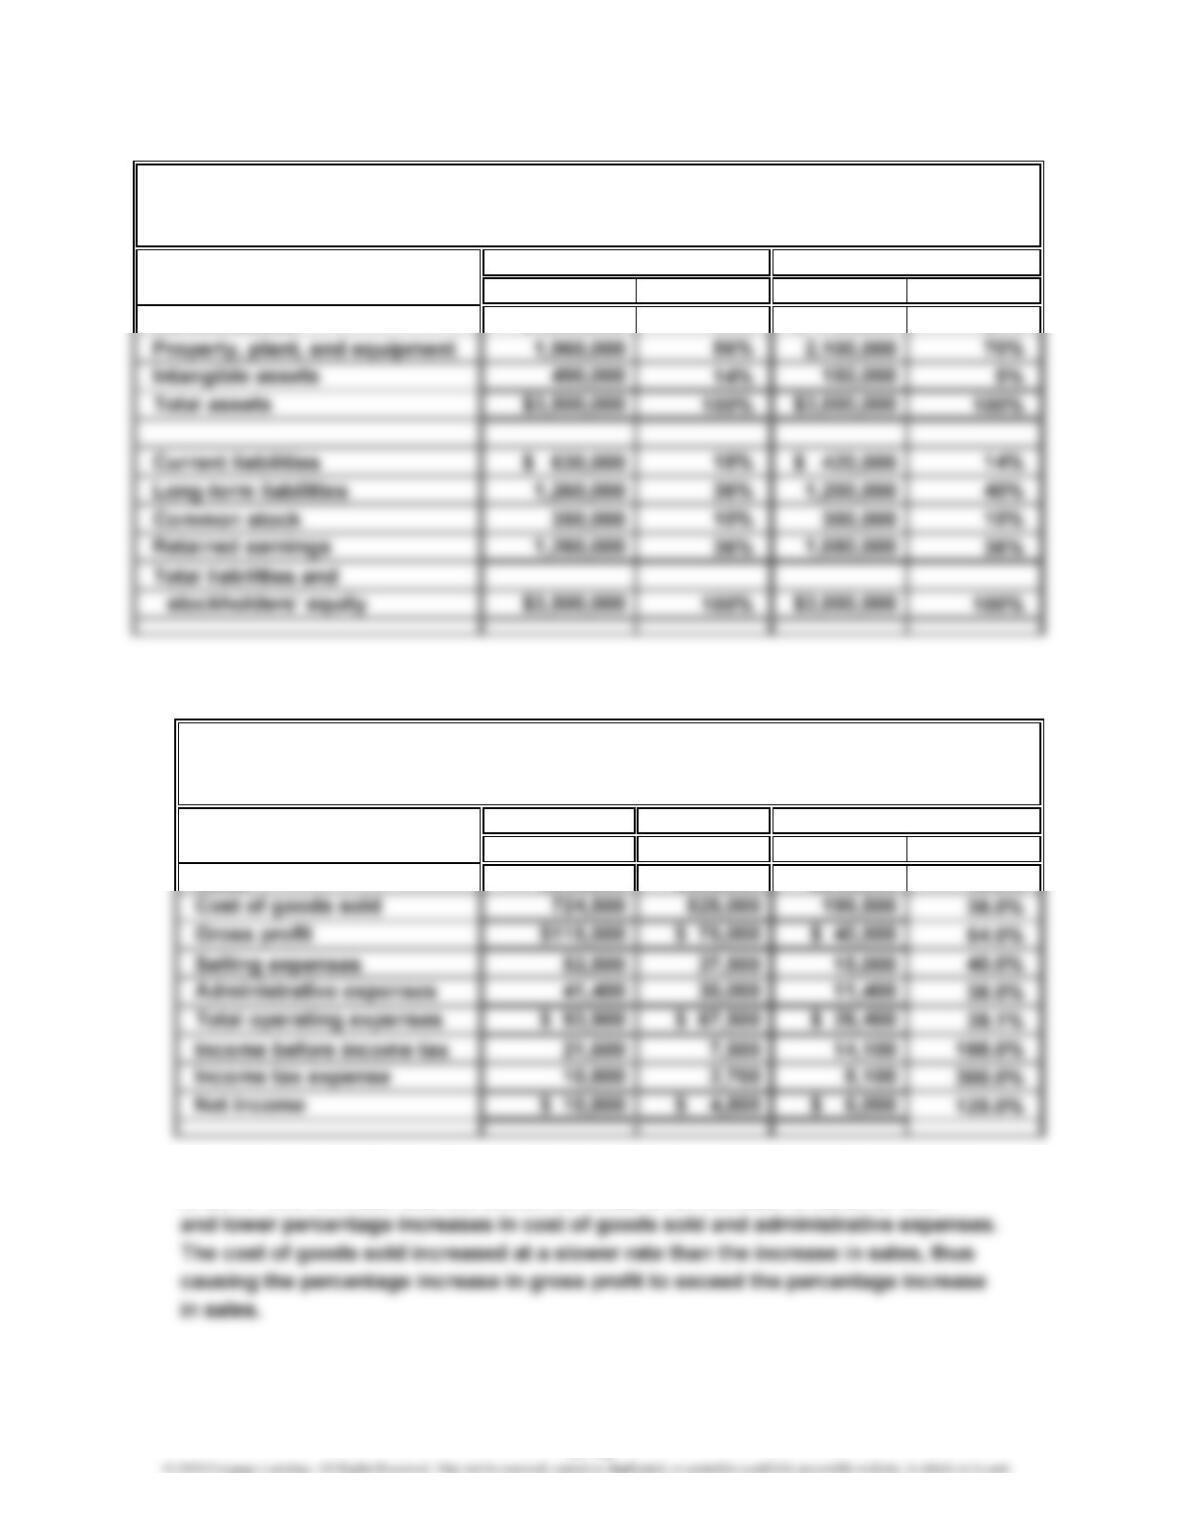
b. The net income for Bezos Company increased by approximately 125% from 2013
to 2014. This increase was the combined result of an increase in sales of 40%
PEACOCK COMPANY
Comparative Balance Sheet
December 31, 2014 and 2013
Increase (Decrease)
BEZOS COMPANY
Comparative Income Statement
For the Years Ended December 31, 2014 and 2013
2014 2013
17-13
CHAPTER 17 Financial Statement Analysis
Ex. 17–6
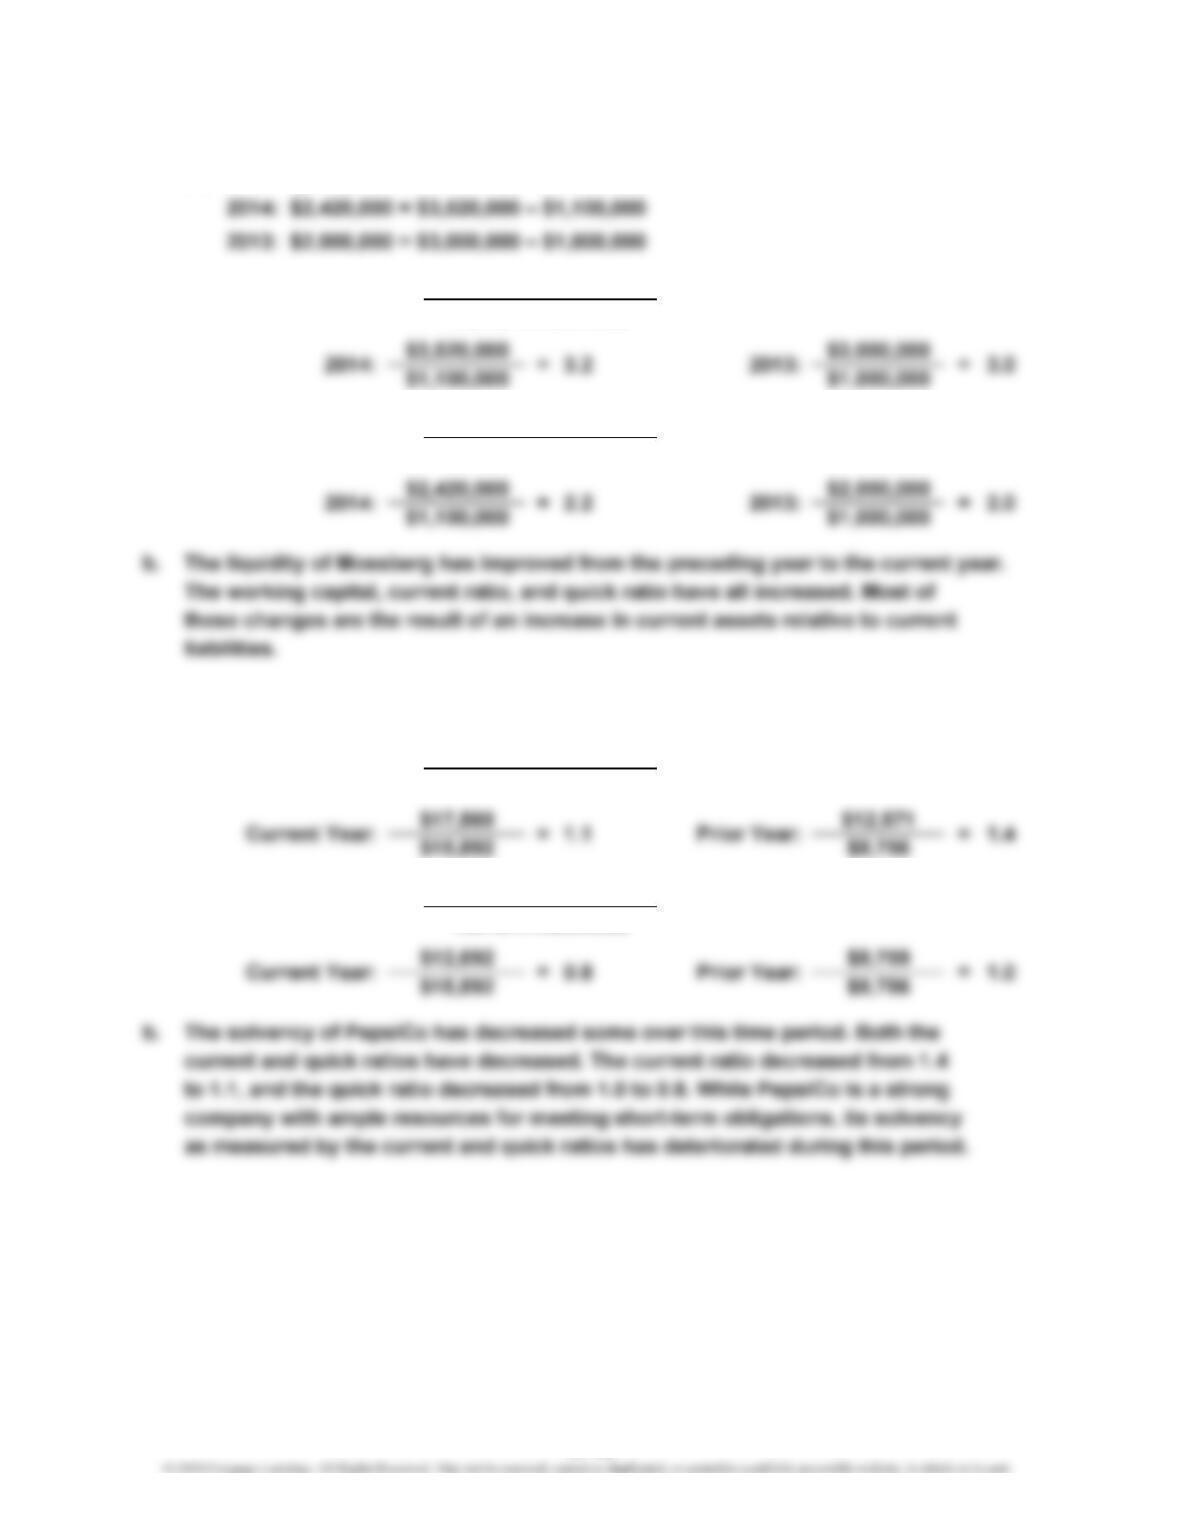
a. (1) Working Capital = Current Assets – Current Liabilities
Ex. 17–7
Current Assets
Current Liabilities
Quick Assets
Current Liabilities
Current Assets
Current Liabilities
Quick Assets
a.
=(2) Current Ratio
(1) Current Ratio =
(3) Quick Ratio =
(2)
Quick Ratio = Current Liabilities
17-14
CHAPTER 17 Financial Statement Analysis
Ex. 17–8
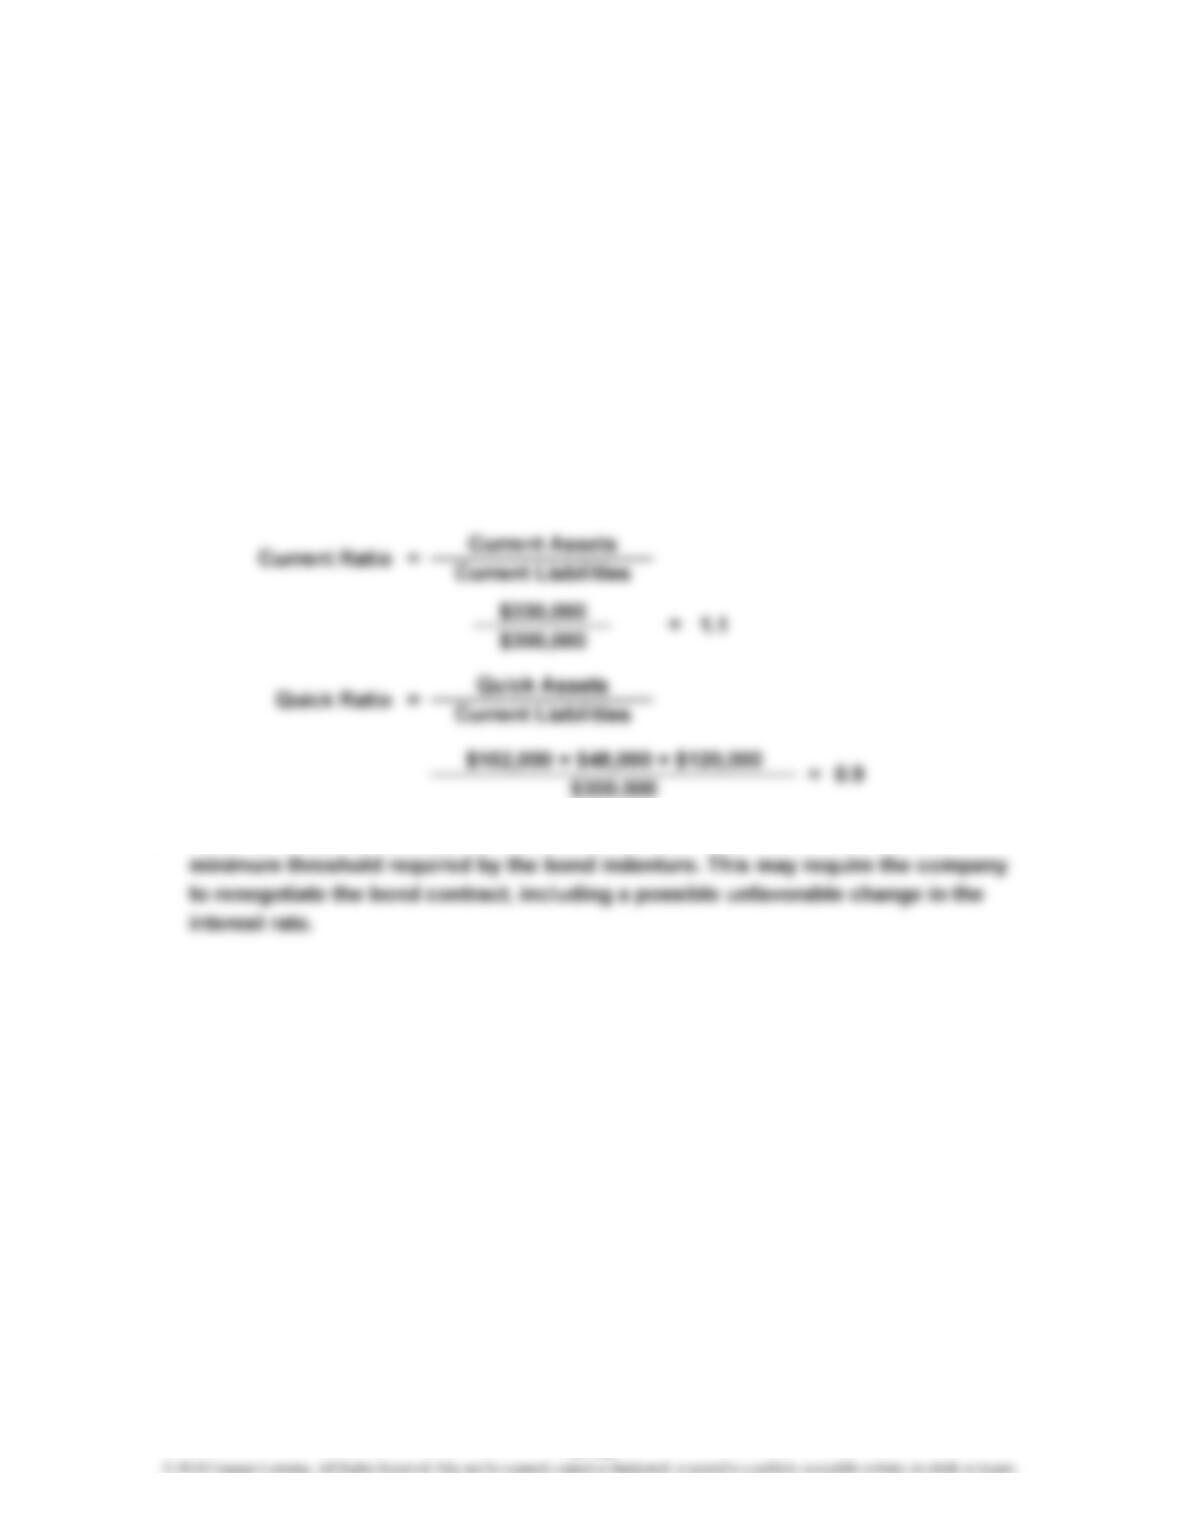
a. The working capital, current ratio, and quick ratio are calculated incorrectly. The
working capital and current ratio incorrectly include intangible assets and property,
plant, and equipment as a part of current assets. Both are noncurrent. The quick
ratio has both an incorrect numerator and denominator. The numerator of the quick
ratio is incorrectly calculated as the sum of inventories, prepaid expenses, and
property, plant, and equipment ($36,000 + $24,000 + $55,200). The denominator is
also incorrect, as it does not include accrued liabilities. The denominator of the
quick ratio should be total current liabilities.
The correct calculations are as follows:
= Current Assets – Current Liabilities
= $330,000 – $300,000
b. Unfortunately, the working capital, current ratio, and quick ratio are below the
Working Capital
$30,000
17-15
CHAPTER 17 Financial Statement Analysis
Ex. 17–9
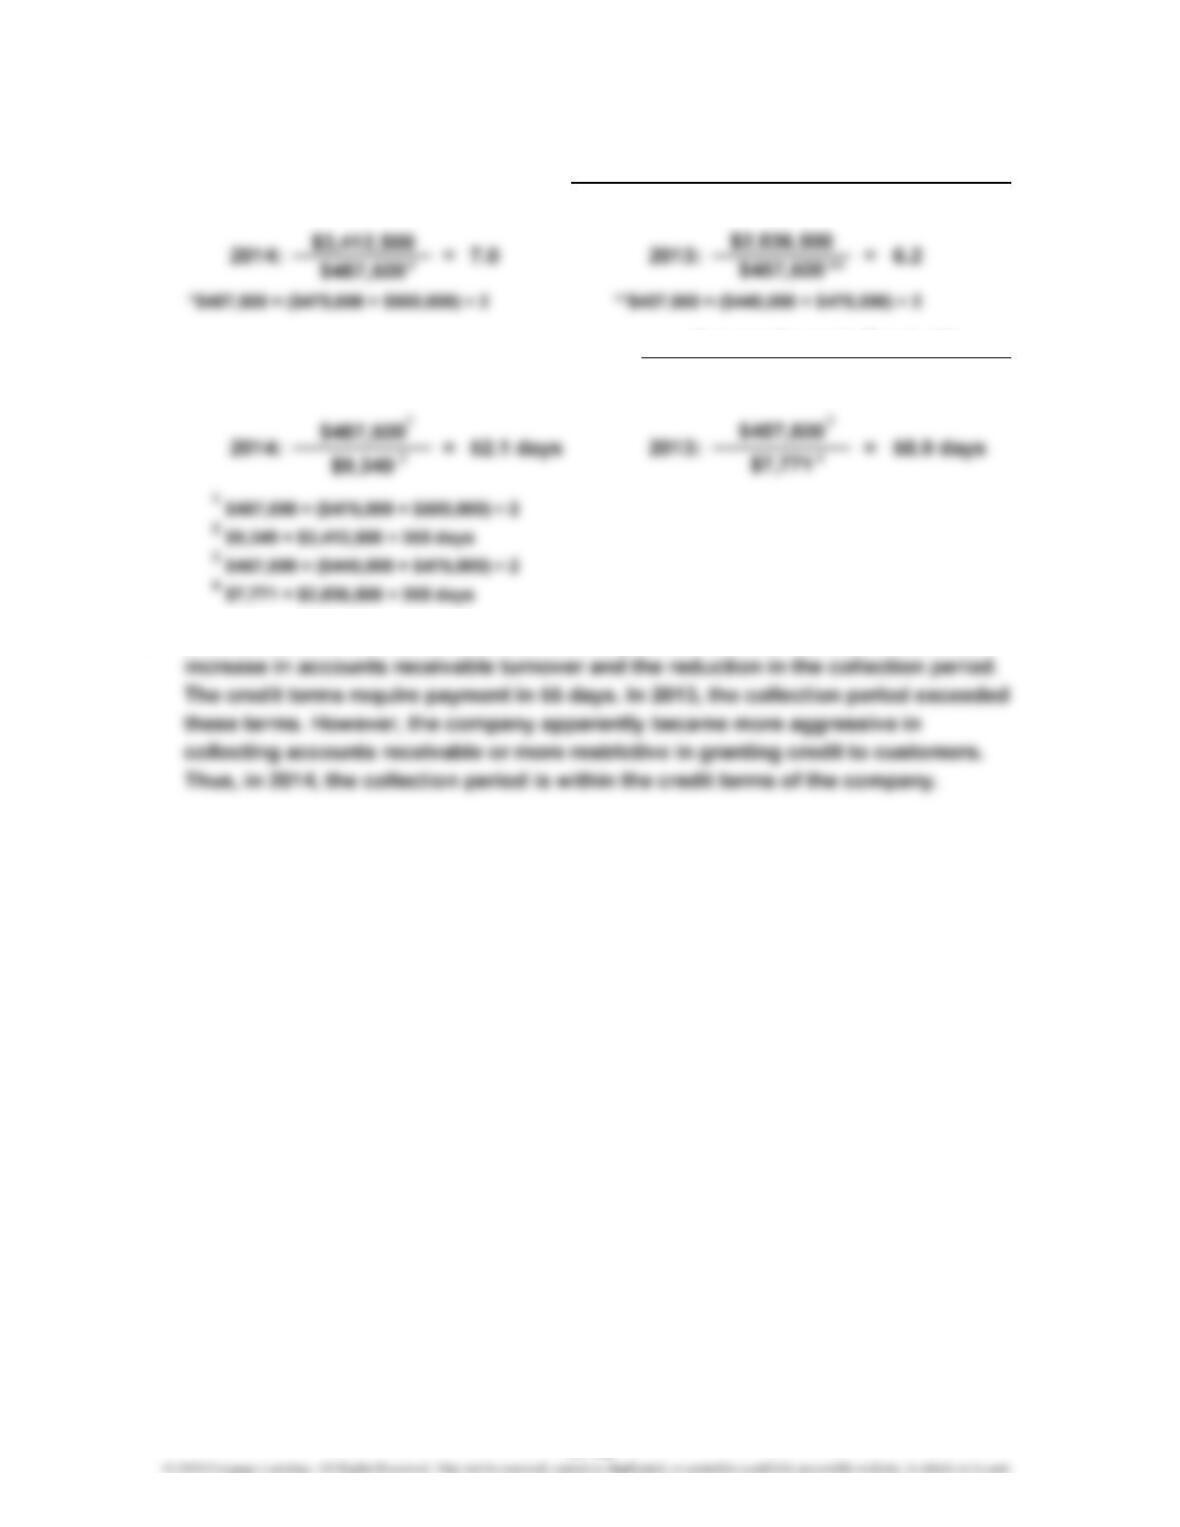
b. The collection of accounts receivable has improved. This can be seen in both the
Number of Days’ Sales in Receivables
Average Accounts Receivable
Average Accounts Receivable
Average Daily Sales
Net Sales
(2)
=
a. (1) =
Accounts Receivable Turnover
17-16
CHAPTER 17 Financial Statement Analysis
Ex. 17–10
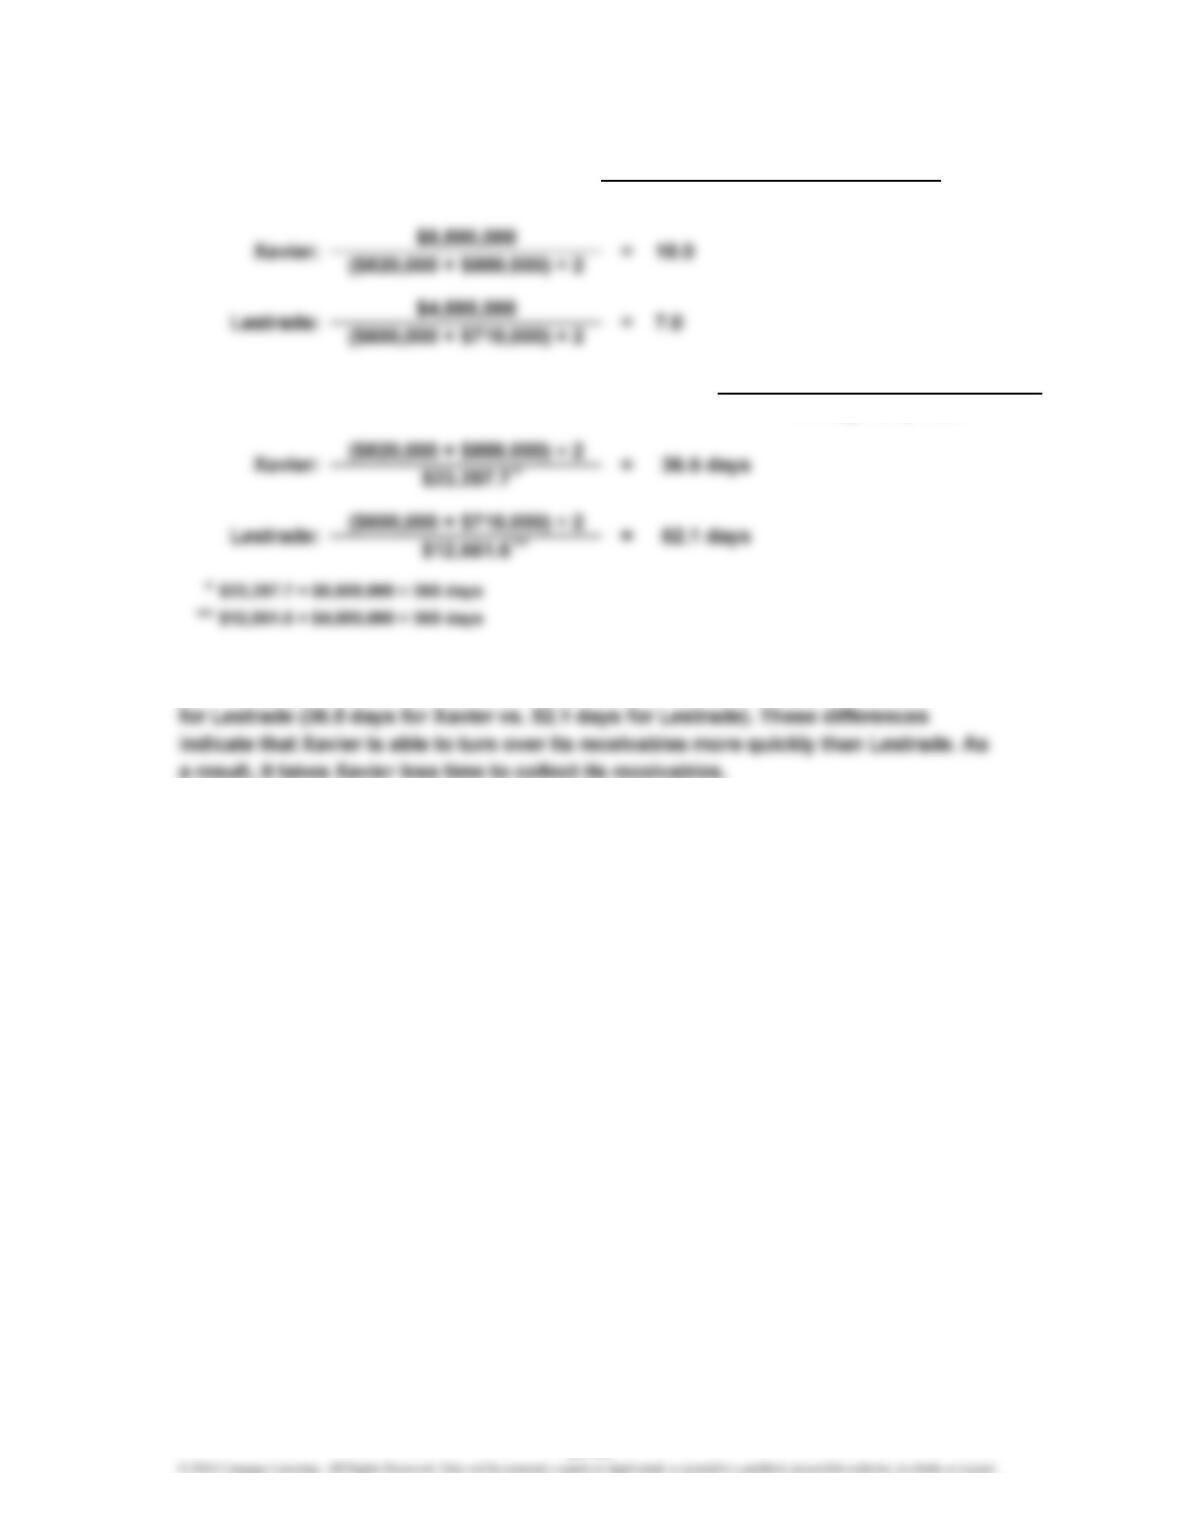
b. Xavier’s accounts receivable turnover is much higher than Lestrade’s (10.0 for Xavier
vs. 7.0 for Lestrade). The number of days’ sales in receivables is lower for Xavier than
(2)
Accounts Receivable Turnover Average Accounts Receivable
Net Sales
a. (1) =
Average Accounts Receivable
Average Daily Sales
Number of Days’ Sales in Receivables
=
17-17
CHAPTER 17 Financial Statement Analysis
Ex. 17–11
Number of Days’ Sales in Inventory
Inventory Turnover
a. (1) =
Cost of Goods Sold
Average Inventory
(2)
=Average Inventory
Average Daily Cost of Goods Sold
17-18
CHAPTER 17 Financial Statement Analysis
Ex. 17–12
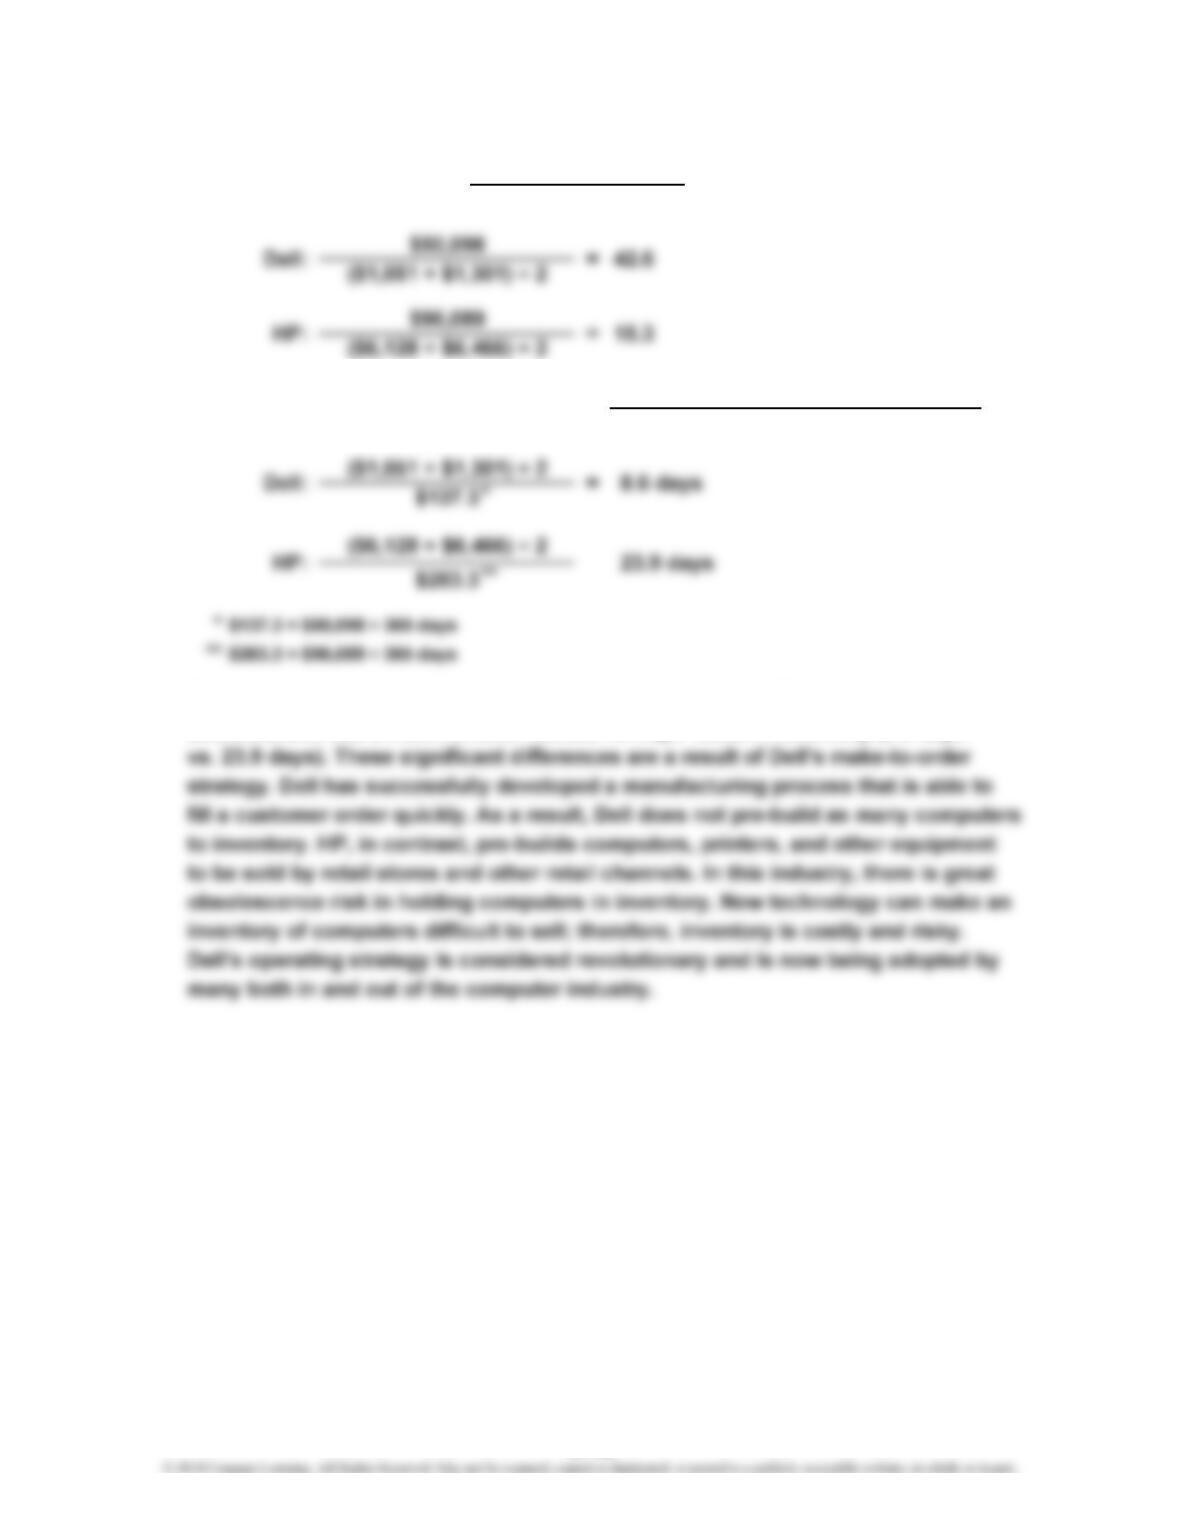
b. Dell has a much higher inventory turnover ratio than does HP (42.6 vs. 15.3).
Likewise, Dell has a much smaller number of days’ sales in inventory (8.6 days
=
Average Inventory
a. (1) Inventory Turnover =
(2)
Cost of Goods Sold
Number of Days’ Sales in Inventory Average Inventory
Average Daily Cost of Goods Sold
17-19
CHAPTER 17 Financial Statement Analysis
Ex. 17–13
a.
b.
Number of Times Bond
Interest Charges Are Earned
=Ratio of Liabilities to Stockholders’ Equity Total Stockholders’ Equity
Total Liabilities
=
Income Before Income Tax + Interest Expense
Interest Expense
17-20