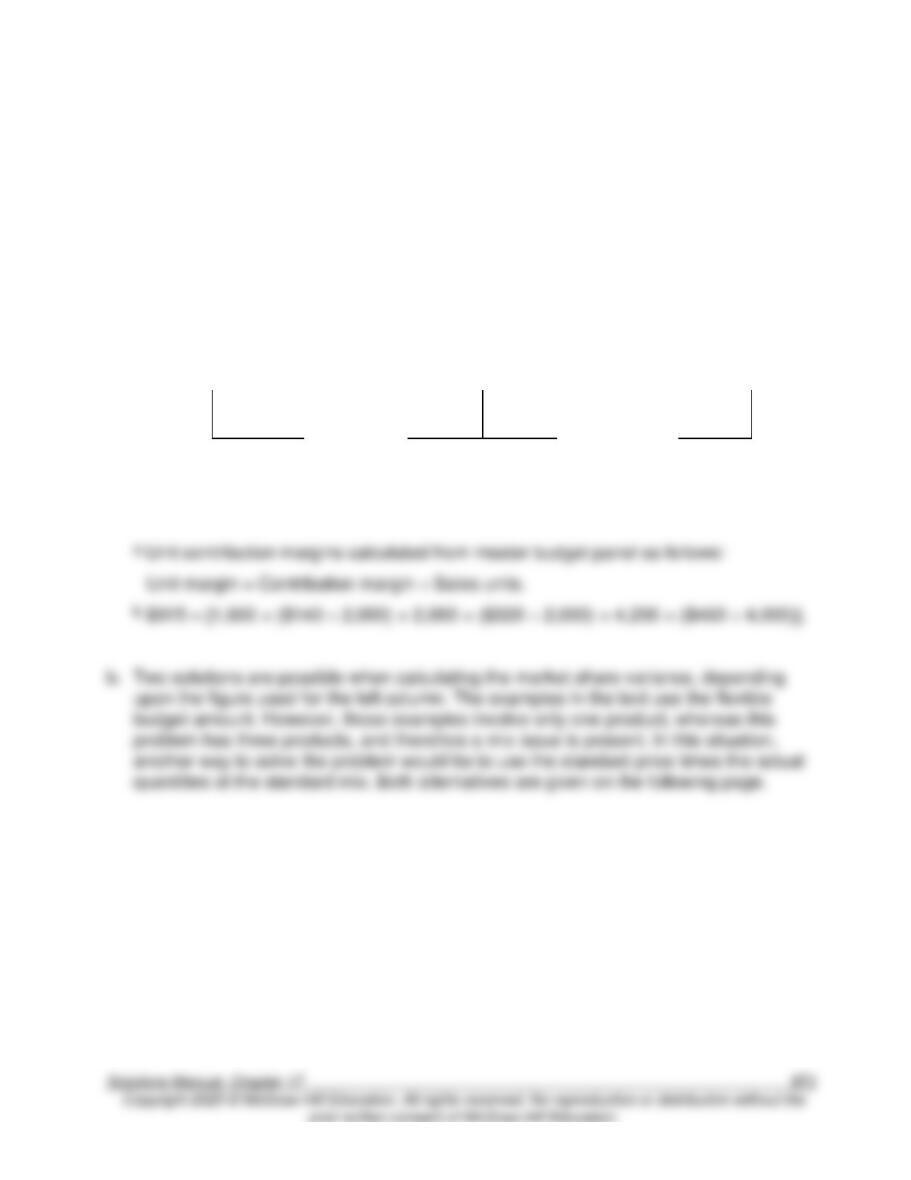
17–49. Revenue Analysis Using Industry Data and Multiple Product Lines: Peninsula
Candy Co.
a. Sales price and activity variances.
Flexible
Master
budget
budget
(AP – SV) × AQ
(SP – SV) × AQ
(SP – SV) × SQ
(1,600 × $0.03a)
+ (2,000 × $0.04)
$1,162 – $915b
+ (4,200 × $0.035)
$1,200 – $920
= $247
= $275
= $280
$28 U
$5 U
Sales price
Sales activity
variance
variance
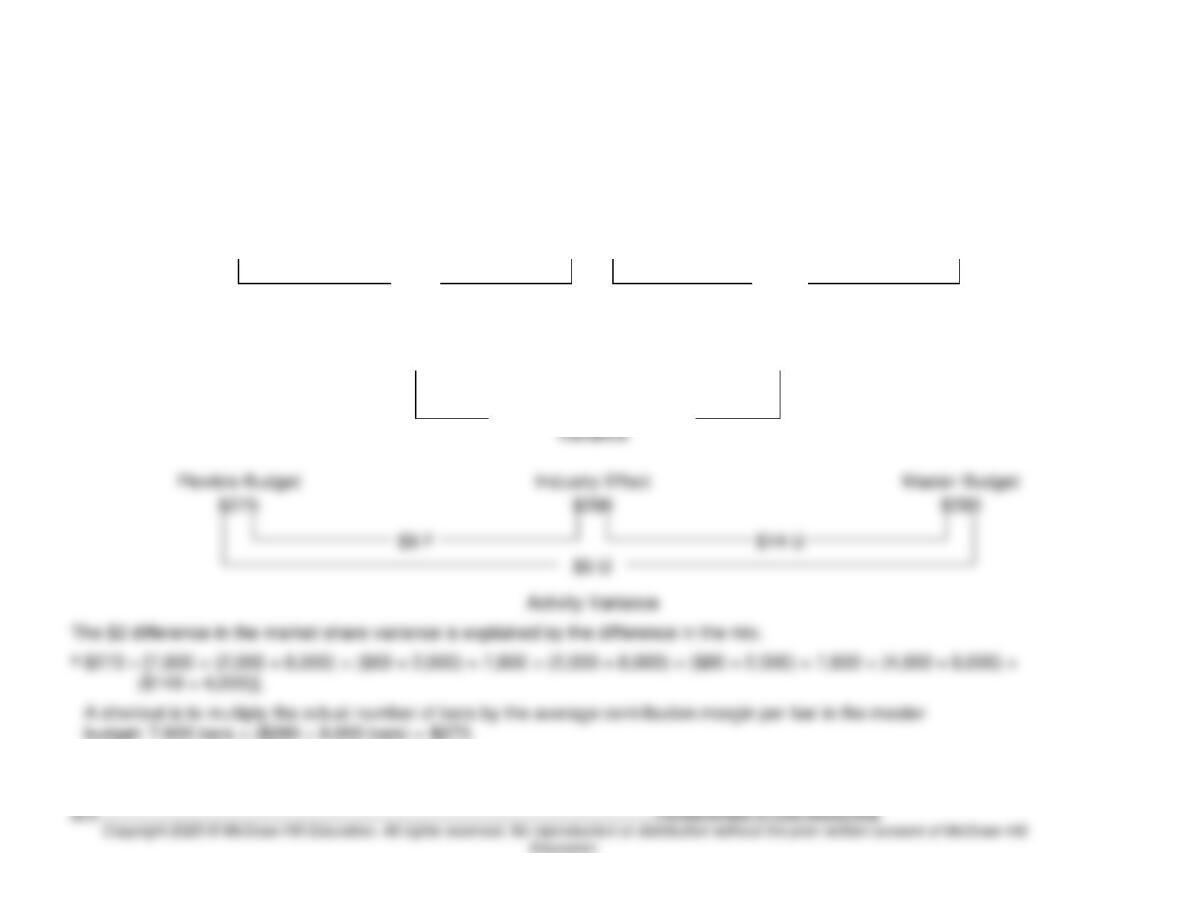
17–49. (continued)
Contribution margin variance
Actual Quantities at
Standard Mix and
Industry
Master
Standard Prices
Effect
Budget
$280 × (76,000 ÷ 80,000)
$273a
= $266
$280
$7 F
$14 U
Market Share
Variance
Industry Variance
$7 U
Quantity
Variance
$275
$9 F
$14 U
budget: 7,800 bars × ($280 ÷ 8,000 bars) = $273.
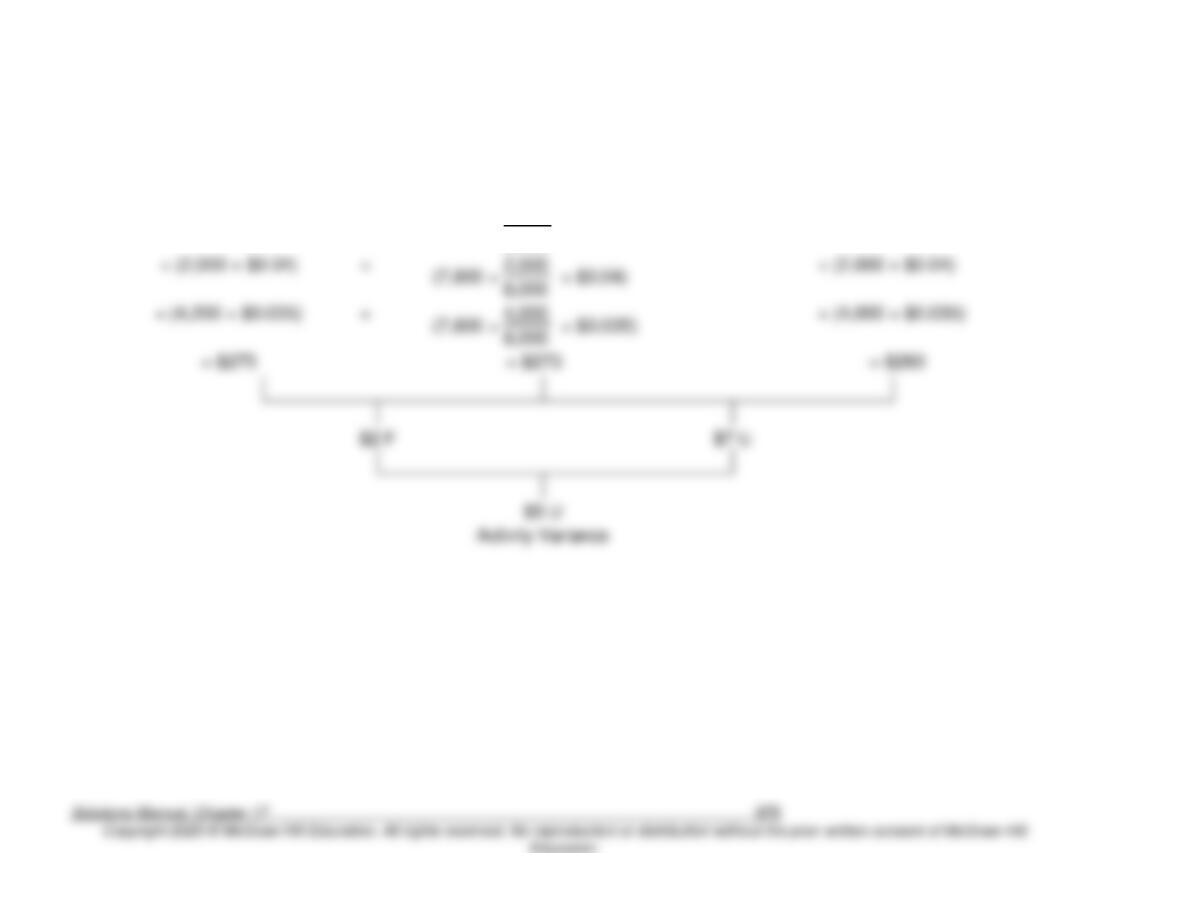
17–50. (20 min.) Sales Mix And Quantity Variances: Peninsula Candy Co.
Flexible Budget
Mix
Variance
Quantity
Variance
Master Budget
(SP – SV) × AQ
(SP – SV) × ASQ
(SP – SV) × SQ
(1,600 × $0.03)
(7,800 ×
2,000
× $0.03)
(2,000 × $0.03)
8,000
2,000
+ (2,000 × $0.04)
8,000
(7,800 ×
4,000
× $0.035)
+ (4,000 × $0.035)
8,000
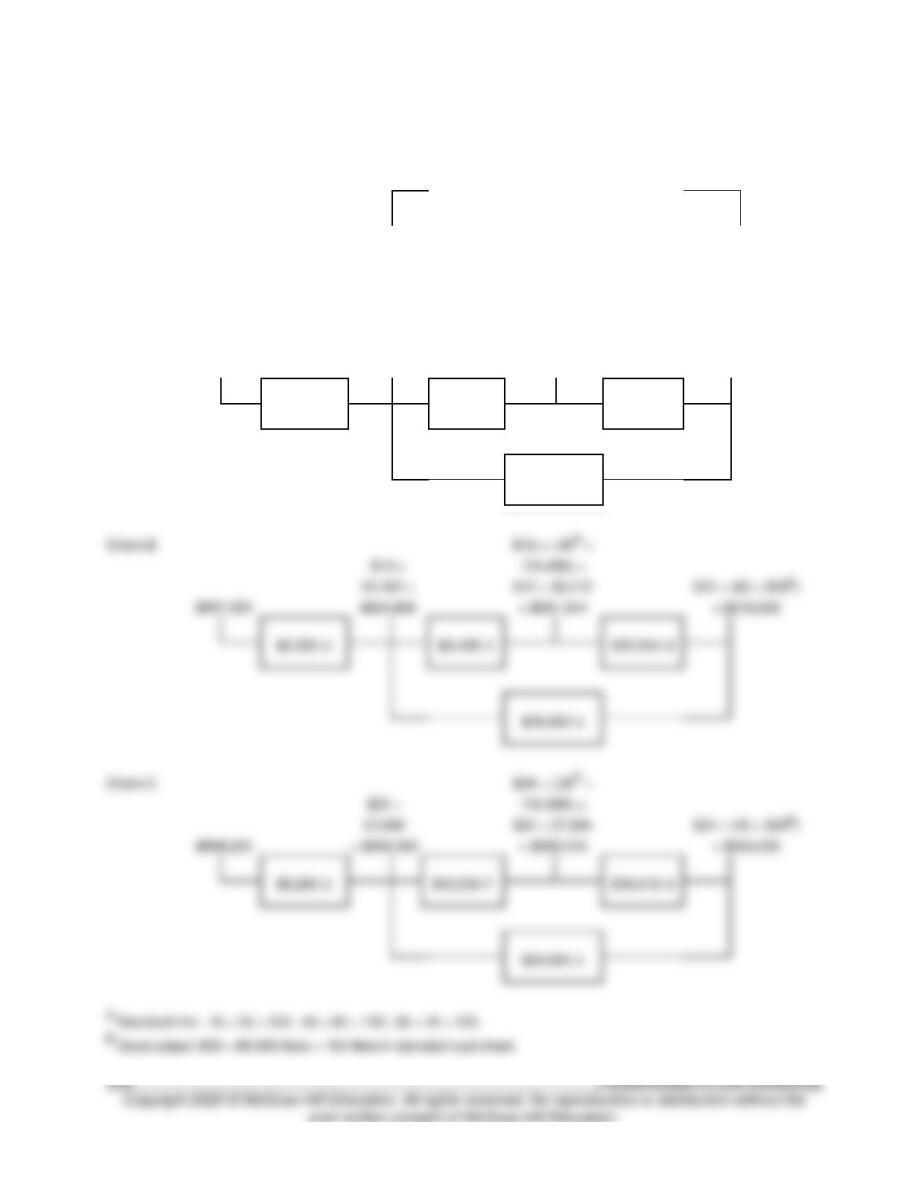
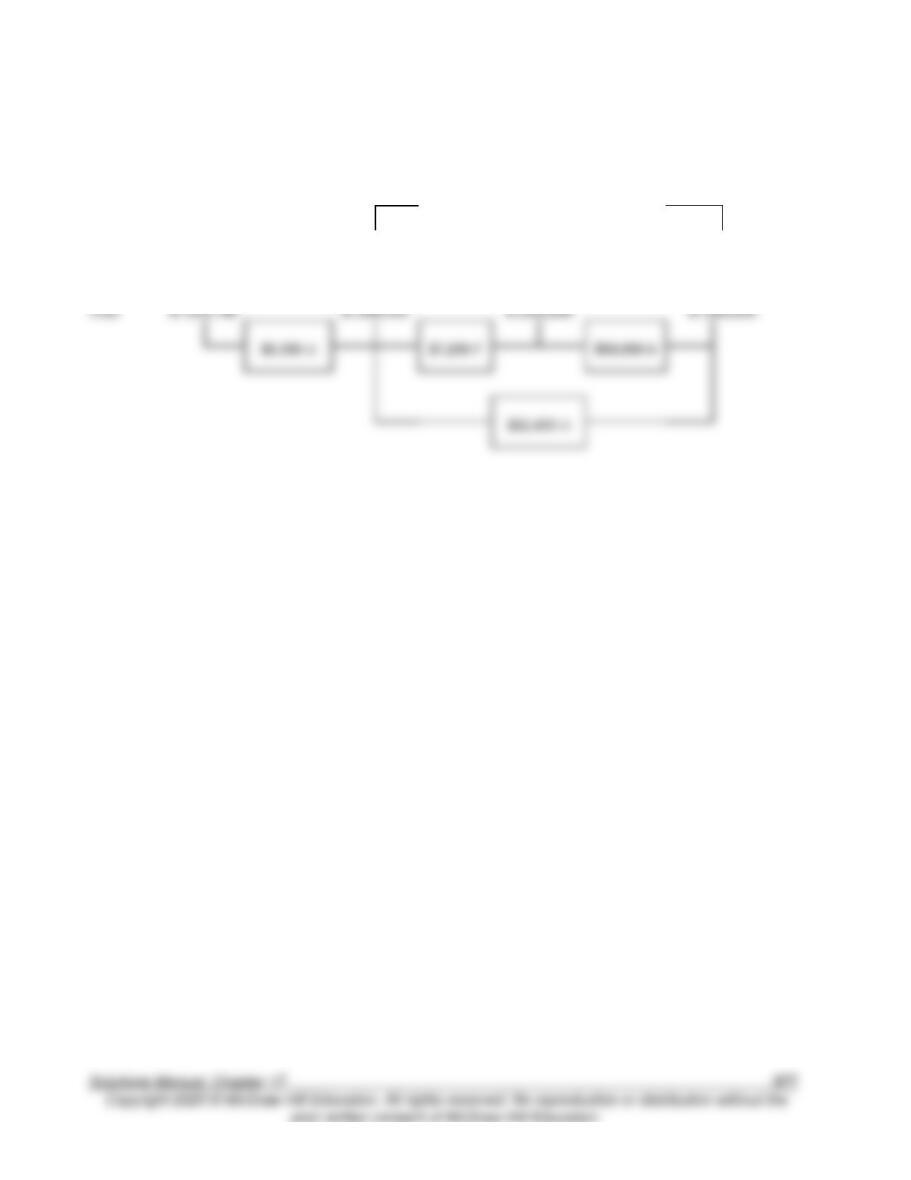
17–51. (45 min.) Materials Mix And Yield Variances: Plano Products.
a. and b.
Efficiency Variance
Material
Actual
(AP ×
AQ)
Purchase
Price
Variance
(SP × AQ)
Mix
Variance
(SP × ASQ)
Yield
Variance
Flexible
Production
Budget
Chem-A
$149,248
$9 ×
16,960 =
$152,640
$9 × (.16a ×
104,400) =
$9 × 16,704
= $150,336
$9 × (20 × 800b)
= $144,000
$3,392 F
$2,304 U
$6,336 U
$8,640 U
$898,220
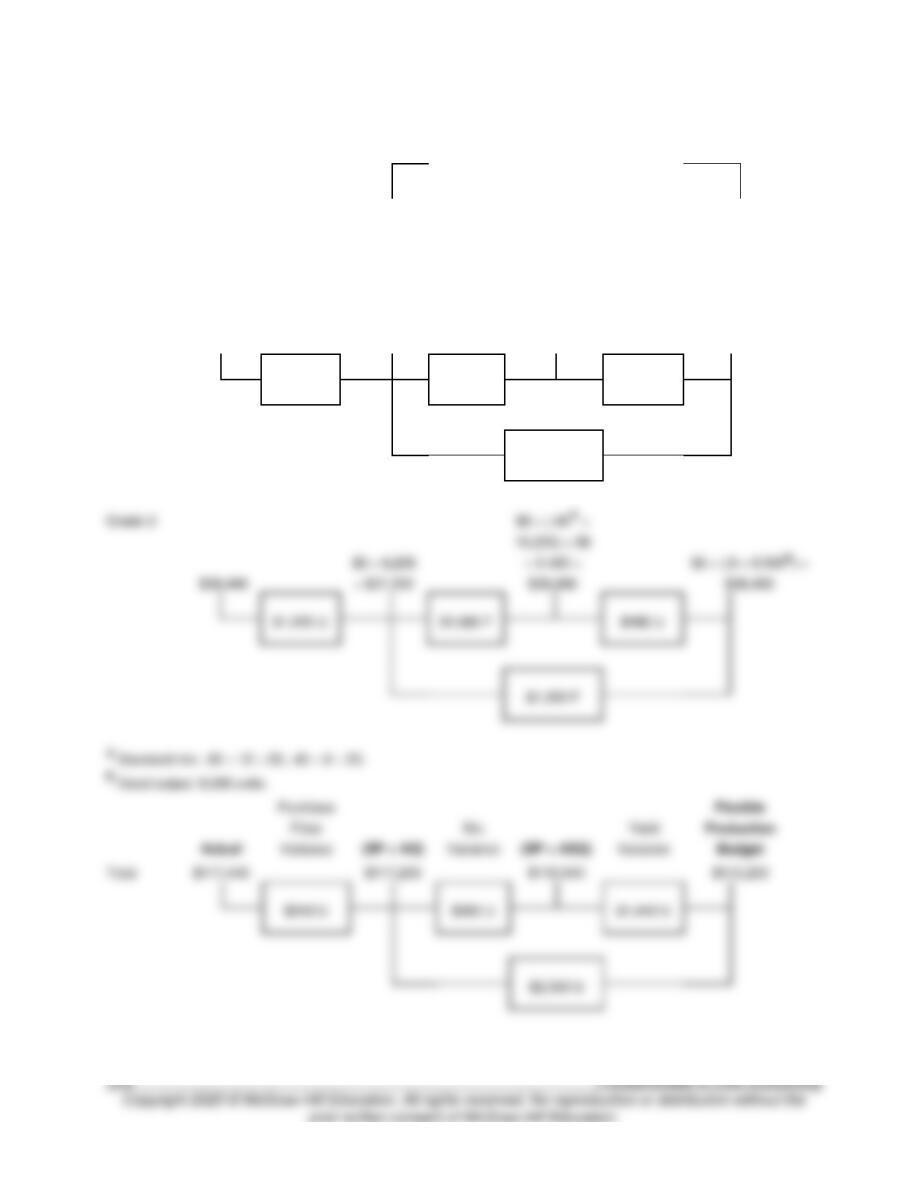
17–51. (continued)
Efficiency Variance
Actual
Purchase
Price
Variance
(SP × AQ)
Mix
Variance
(SP × ASQ)
Yield
Variance
Flexible
Production
Budget
Total
$1,654,788
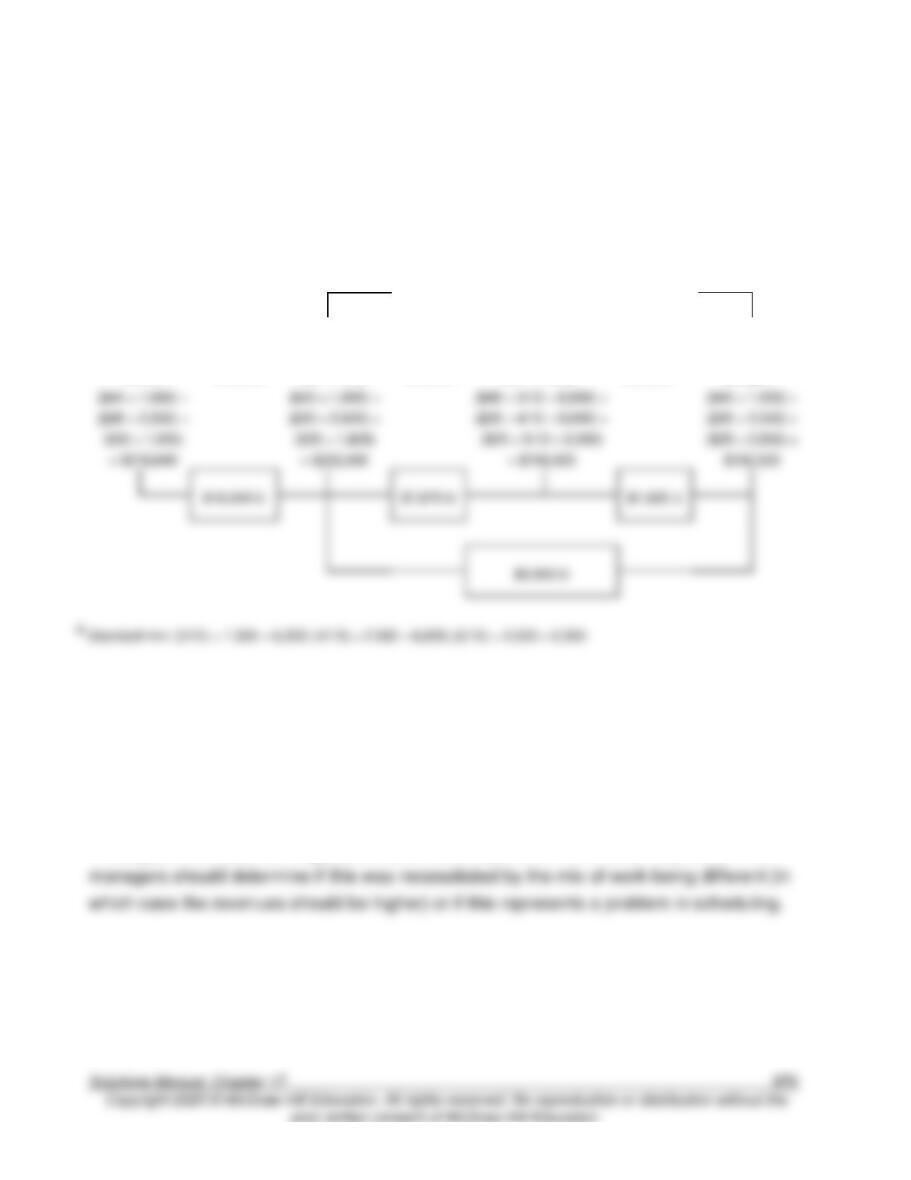
17–52. (30 min.) Materials Mix and Yield Variances: Pinnuck Products.
Efficiency Variance
Material
Actual
(AP ×
AQ)
Purchase
Price
Variance
(SP × AQ)
Mix
Variance
(SP × ASQ)
Yield
Variance
Flexible
Production
Budget
Grade-1
$79,000
$8 × 10,000
= $80,000
$8 × (.60a ×
16,200)
= $8 × 9,720
= $77,760
$8 × (1.2 × 8,000b)
= $76,800
$1,000 F
$2,240 U
$960 U
$3,200 U
$38,440
Mix
Yield
Total
$1,440 U
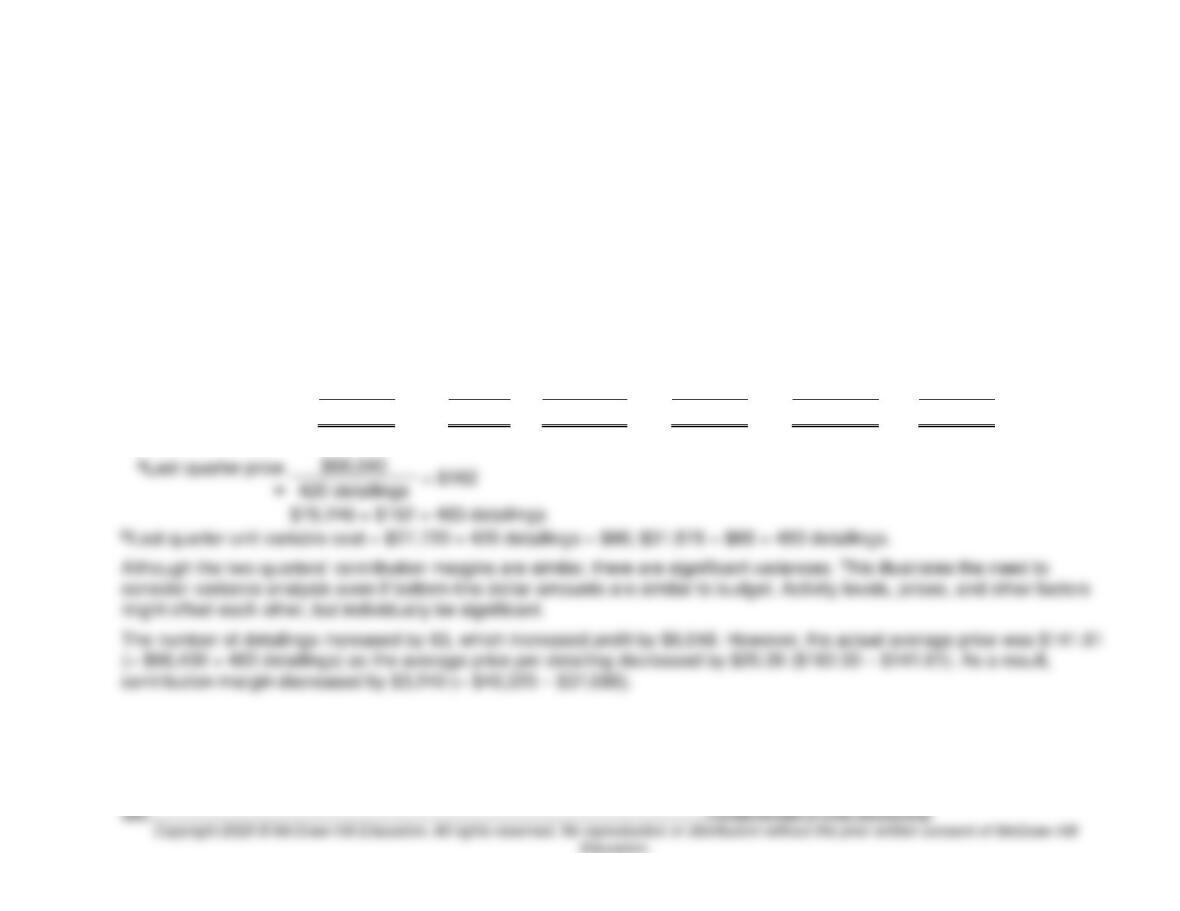
17–53. (30 min.) Labor Mix and Yield Variances: Matthews & Bros.
a. and b.
Efficiency Variance
Actual
Purchase
Price
Variance
(SP × AQ)
Mix
Variance
(SP × ASQ)
Yield
Variance
Flexible
Production
Budget
17–54. (10 min.) Investigating Variances: Matthews & Bros.
Answers will vary. From the variance analysis above, the purchase price variance is fairly
large. Depending on how much control Matthews has over the wages, it might be useful to
investigate this variance. It appears that a more expensive mix of labor was used. The
17–55. (20 min.) Derive Amounts for Profit Variance Analysis: Classics Ltd.
Hint: Use last quarter’s actual as master budget.
Actual (based
on actual
activity of
483
detailings)
Variable
Cost
Variance
Sales
Price
Variance
Flexible Budget
(based on
actual activity
of 483
detailings)
Sales
Activity
Variance
Master Budget
(based on a
prediction of
420 detailings)
Sales revenue …………………………..
$68,400
$9,846 U
$78,246
a
$10,206 F
$68,040
Less:
Variable costs …………………………..
31,320
$558 F
31,878
b
4,158 U
27,720
Contribution margin …………………………..
$37,080
$558 F
$9,846 U
$46,368
$6,048 F
$40,320
$78,246 = $162 × 483 detailings
17–56. (20 min.) Flexible Budget: Oak Hill Township.
Flexible budget is based on actual activity of 94,500 miles for costs that vary per mile.
a. $8,505; $10 over budget.
$6,750 × (94,500 miles ÷ 75,000 miles) = $8,505
b. $756; $4 over budget.
$600 × (94,500 miles ÷ 75,000 miles) = $756
Solutions to Case
17–57. Comprehensive Overview of Budgets and Variances: Racketeer, Inc.
The following solution is based on a report by Tom Terpstra.
Because the profit graph is based on standard costs, the profit it shows will be the actual
profit only in those very rare cases when the variances net out to zero. Racketeer has
some significant variances listed on the income statement, so Elmo should expect that the
actual profit would differ from the profit on the graph. These variances are:
Material ……………………………..
$490
U
Labor ………………………………..
392
U
Overhead …………………………..
190
U
Selling and administrative …….
300
F
Total …………………………………
$772
U
The overhead amount differs from the figure on the income statement, because the
income statement overhead variance includes a production volume variance of $470
(= $0.47 × 1,000). But that variance does not reflect a difference between actual and
budget or standard costs when fixed manufacturing costs are not unitized.
(Before Elmo starts to complain about the accountants’ use of full-absorption, one should
remind him that, in those quarters when production exceeds sales, the full-absorption
method would expense less fixed costs than variable costing, so it evens out in the long
run.)
17–57. (continued)
Now the two results can be reconciled:
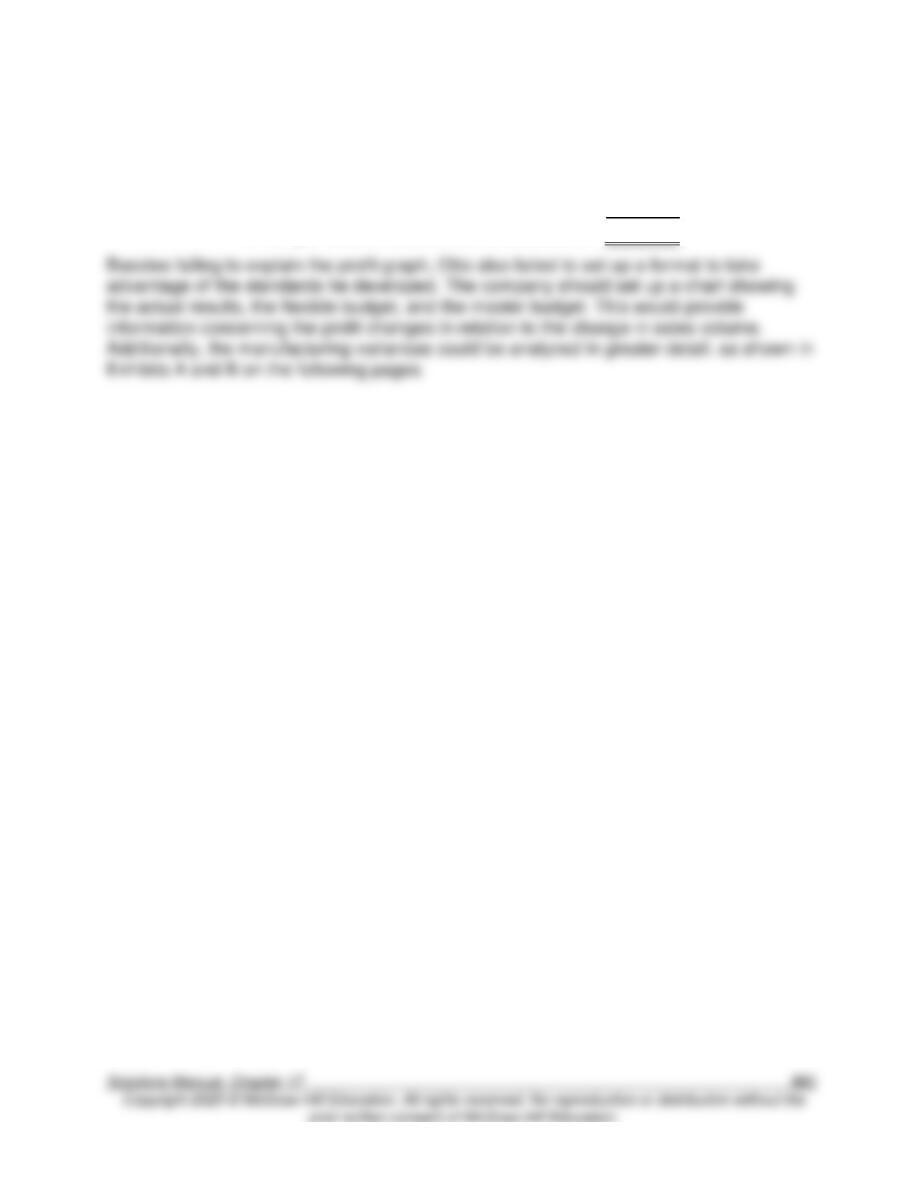
Profit per chart ……………………………………..
$20,940
Less:
Cost variances …………………………………..
772
Additional fixed costs in full-absorption …
1,410
Profit per Income Statement …………………..
$18,758
17–57. (continued)
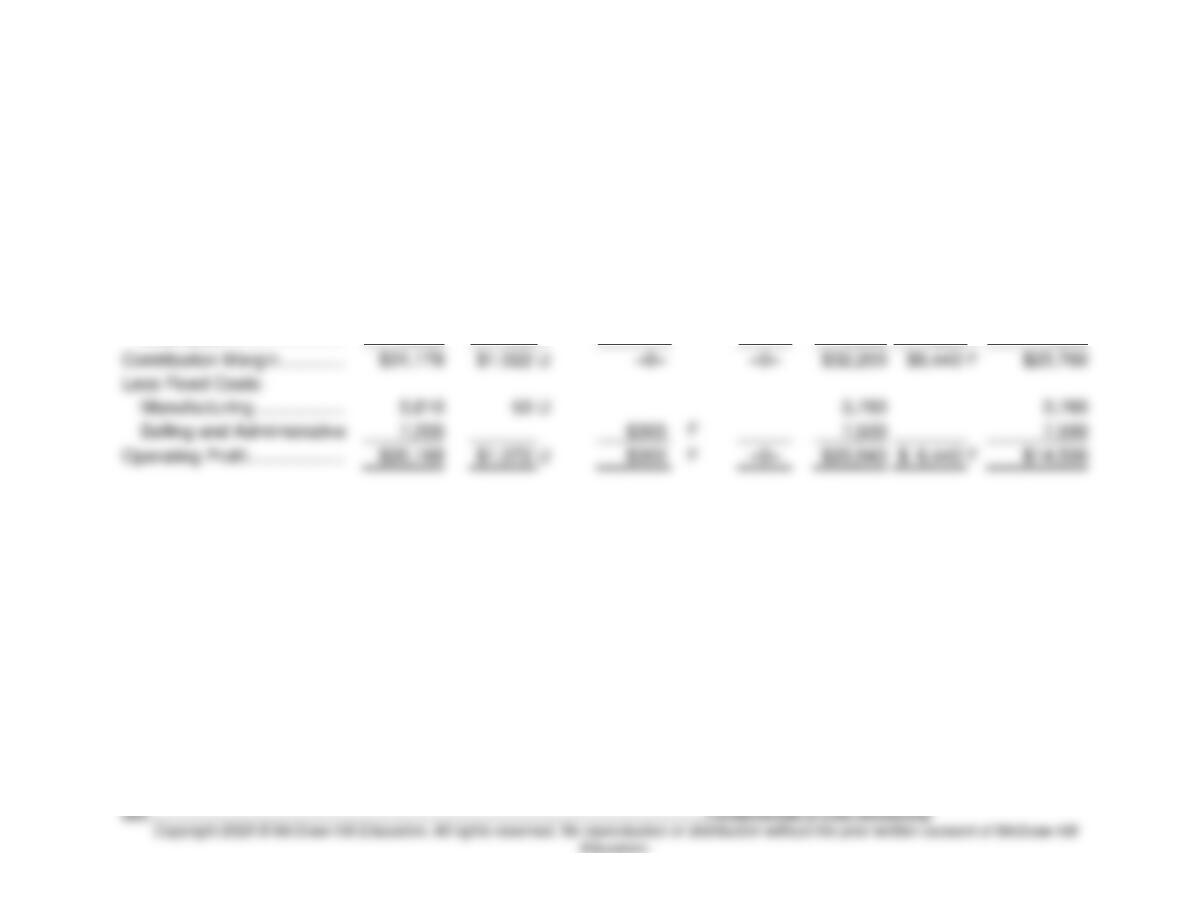
Exhibit A Comparison of Master Budget to Actual Results.
Actual
Manufacturing
Variance
Selling and
Administrative
Variance
Sales Price
Variance
Flexible
Budget
Activity
Variance
Master
Budget
Sales revenue …………………
$90,000
–0–
–0–
$90,000
$18,000
F
$72,000
Less Variable Costs:
Materials ……………………..
37,990
$ 490
U
37,500
7,500
U
30,000
Labor ………………………….
19,392
392
U
19,000
3,800
U
15,200
Overhead …………………….
1,440
140
U
1,300
260
U
1,040
Contribution Margin ………….
$31,178
$1,022
U
–0–
–0–
$32,200
$6,440
F
$25,760
Less Fixed Costs:
Manufacturing ………………
U
3,760
Selling and Administrative
7,200
7,500
7,500
Operating Profit ……………….
$1,072
U
F
17–57. (continued)
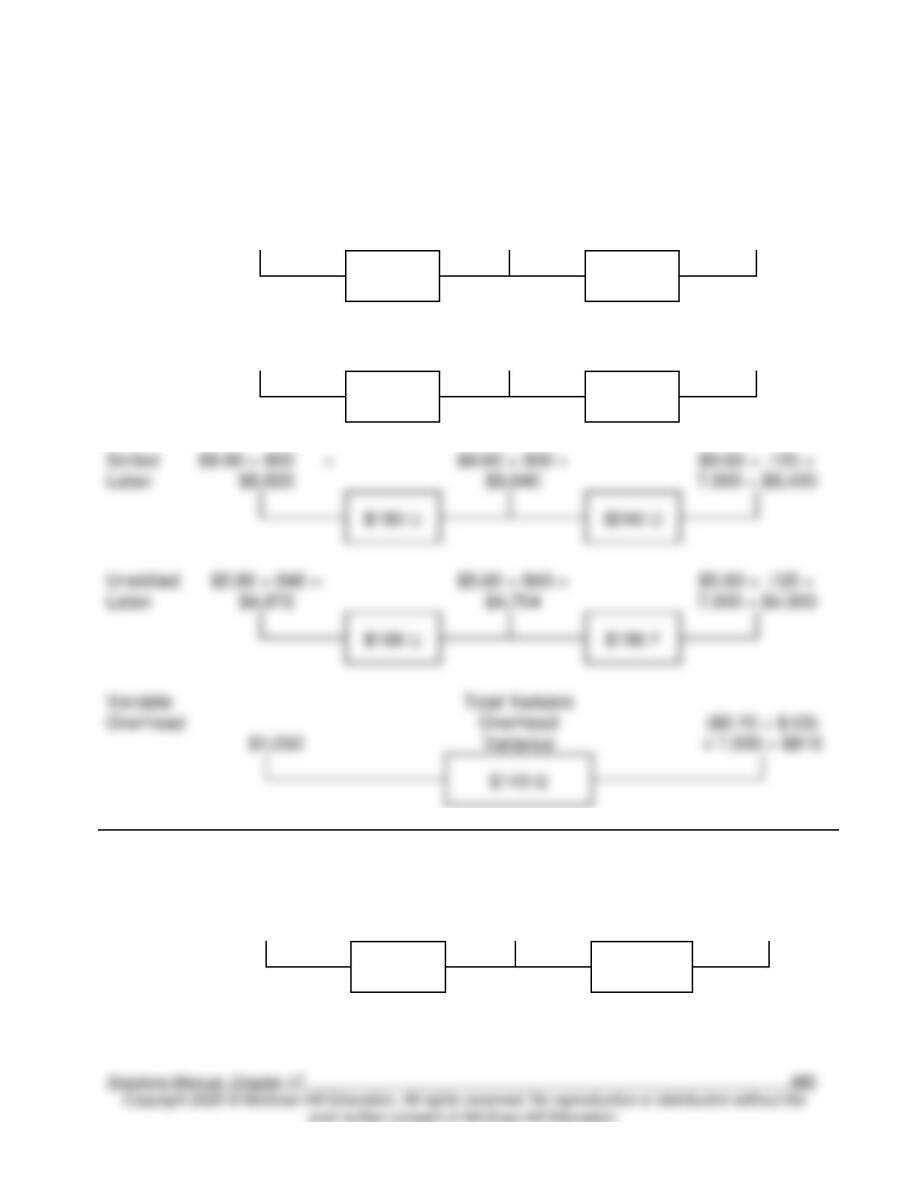
Exhibit B Manufacturing Cost Variances.
Actual Costs
Price
Variance
Actual Inputs
at Standard
Price
Efficiency
Variance
Flexible Budget
String
$0.025 × 175,000
= $4,375
$0.03 × 175,000
= $5,250
$0.03 × 20 ×
7,000 = $4,200
$875 F
$1,050 U
Frames
$3.15 × 7,100 =
$22,365
$3.15 × 7,100 =
$22,365
$3.15 × 7,000 =
$22,050
$-0-
$315 U
Skilled
$180 U
$240 U
Unskilled
$168 U
$196 F
Variable
$1,050
Actual Costs
Price
Variance
Budget
Production
Volume
Variance
Applied
Fixed
Overhead
$3,810
$0.47 × 8,000 =
$3,760
($0.47 × 7,000)
= $3,290
$50 U
$470 U
17–57. (continued)
The variance breakdown in Exhibits A and B highlights the areas that Elmo and Otto
should research. One area involves the strings. Is the combination of a favorable price
variance and unfavorable efficiency variance an indicator that low quality string was
purchased? Another point for investigation is the apparent waste of 100 racket frames. Is
there something in the production process that causes frames to break? Or are the