CHAPTER 17 Financial Statement Analysis
Ex. 17-14
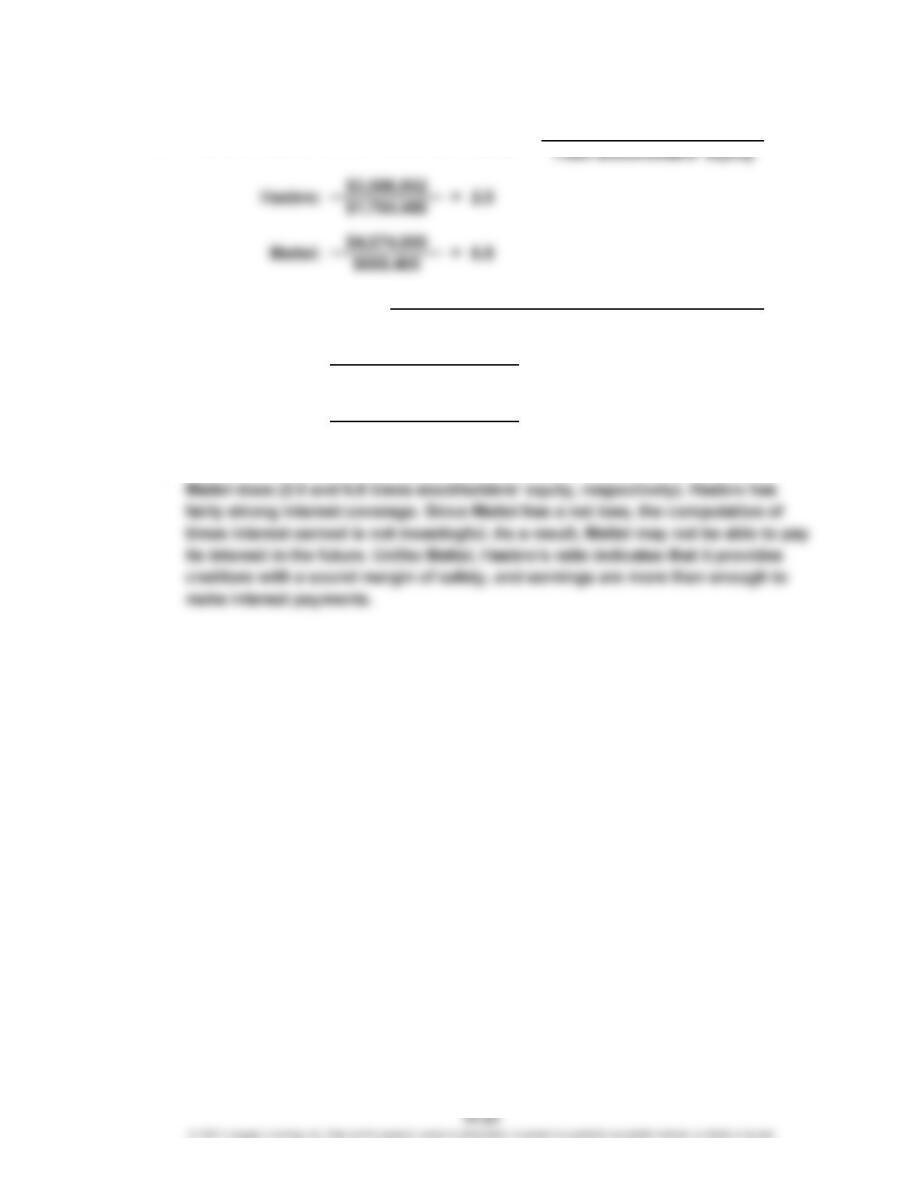
c. Hasbro carries a smaller proportion of debt to the stockholders’ equity than
a. Ratio of Liabilities to Stockholders’ Equity =
Total Liabilities
$270,402 + $90,826 =
Times Interest Earned Income Before Income Tax + Interest Expense
Interest Expense
b. =
Mattel:
Hasbro: 4.0
$90,826
$(419,261) + $181,886 =
$181,886 (1.3)
CHAPTER 17 Financial Statement Analysis
Ex. 17-15
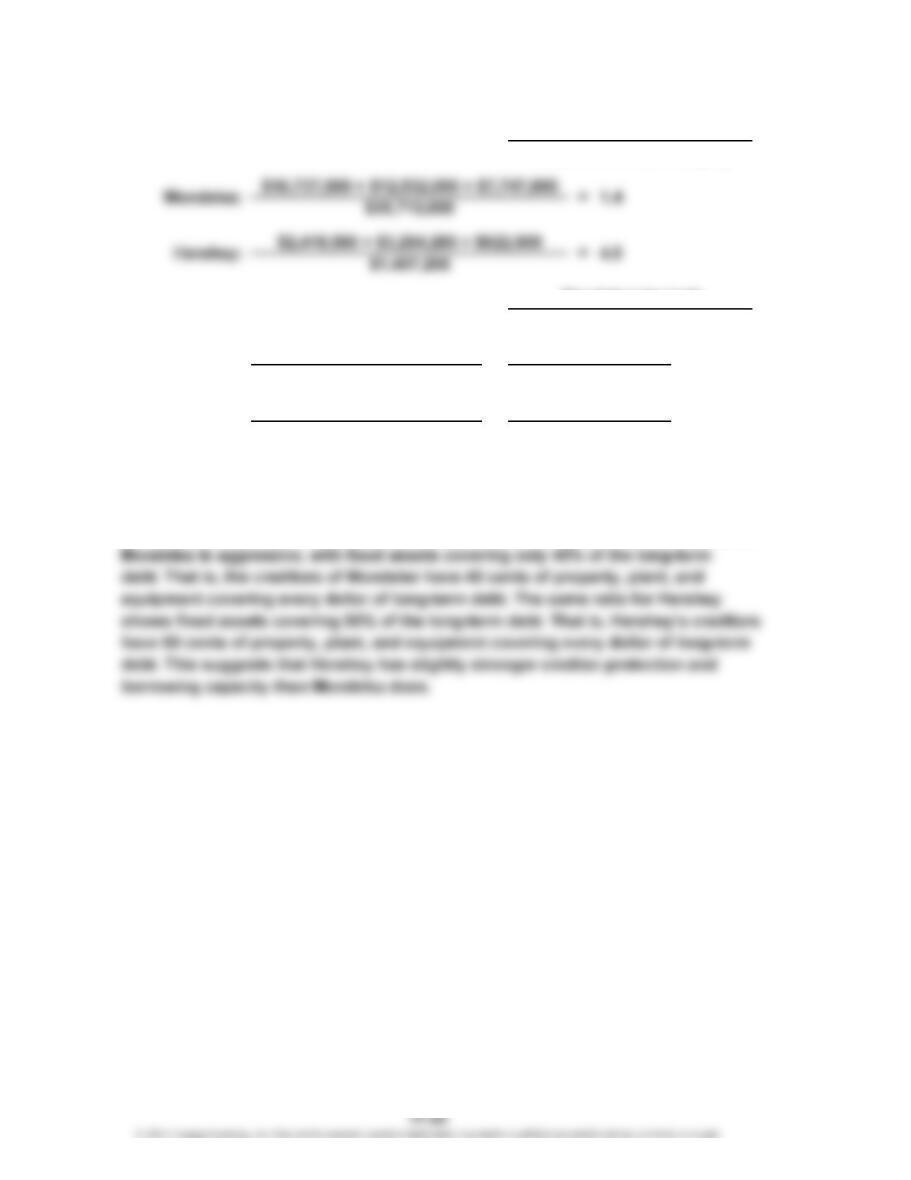
c. Hershey uses more debt than Mondelez does. As a result, Hershey’s total liabilities
to stockholders’ equity ratio is higher than Mondelez’s (4.5 vs. 1.4). Mondelez has
a lower ratio of fixed assets to long-term liabilities than Hershey does. This ratio
divides the property, plant, and equipment (net) by the long-term debt. The ratio for
$2,130,294
$3,877,188
$12,532,000 + $7,747,000 =
=
$2,130,294
$3,254,280 + $622,908
Hershey:
=
=Mondelez:
0.5
$8,482,000
=Total Liabilities
Total Stockholders’ Equity
Ratio of Liabilities to Stockholders’ Equity
b. =
Ratio of Fixed Assets to Long-Term Liabilities Fixed Assets (net)
Long-Term Liabilities
a.
0.4
$8,482,000
$20,279,000
CHAPTER 17 Financial Statement Analysis
Ex. 17-16
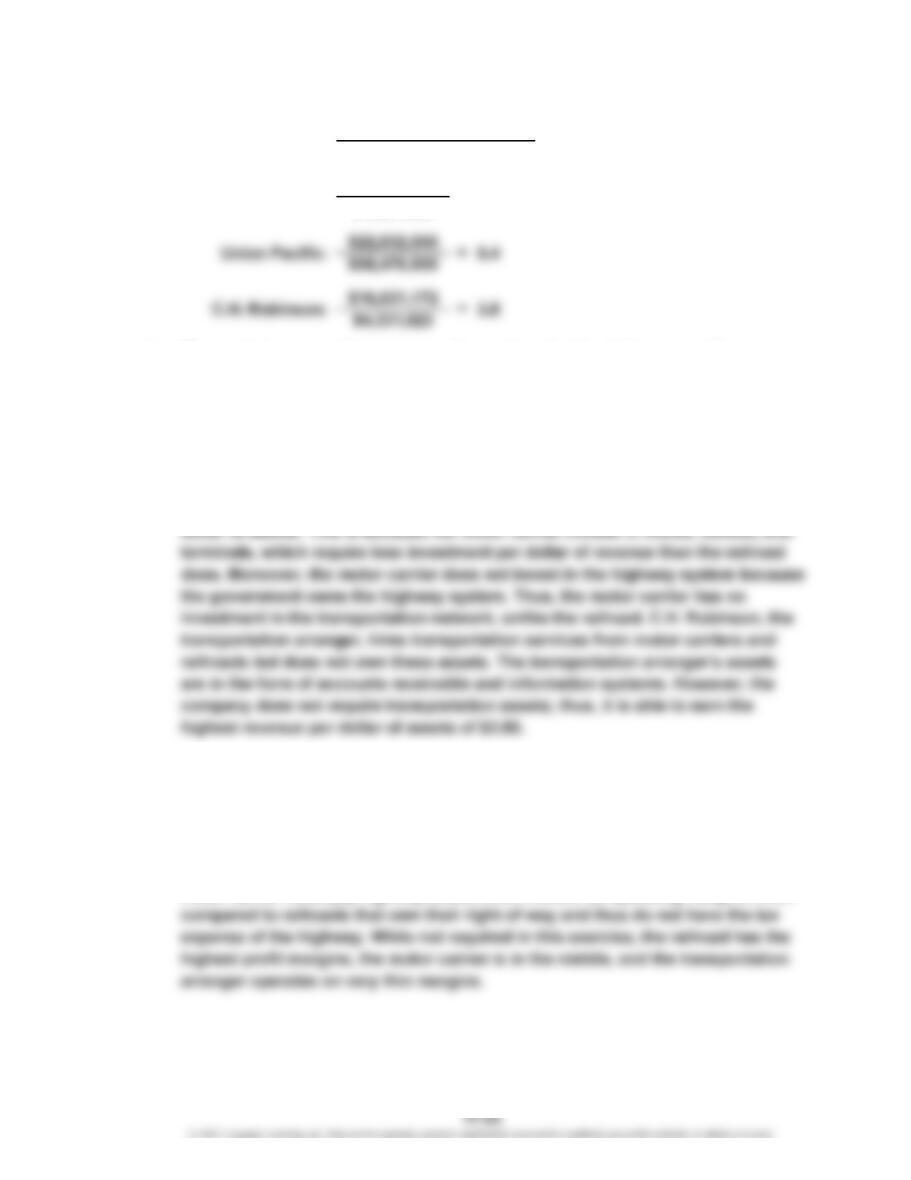
b. The asset turnover ratio measures the number of sales dollars earned for
each dollar of assets. The greater the number of sales dollars earned for every
dollar of assets, the more efficient a firm is in using assets. Thus, the ratio is a
measure of each company’s asset efficiency. Union Pacific earns only 40 cents
for every dollar of assets. This is because railroads are very asset-intensive.
The company must invest in locomotives, railcars, terminals, tracks, right-of-way,
and information systems in order to earn revenues. These investments are
significant. YRC has a higher asset turnover ratio and is able to earn $3.20 for every
Note to Instructors: Students may wonder how asset-intensive companies
overcome their asset efficiency disadvantages to competitors with better asset
efficiencies, as in the case between railroads and motor carriers. Asset efficiency
is part of the financial equation; the other part is the profit margin made on each
dollar of sales. Thus, companies with high asset efficiency often operate on
thinner margins than do companies with lower asset efficiency. For example, the
=
a. =Asset Turnover Sales
Average Total Assets
3.2
$5,092,000
$1,601,300
YRC:
CHAPTER 17 Financial Statement Analysis
Ex. 17-17
1
Interest expense = $2,500,000 × 6%
2
Average total assets = ($5,200,000 + $5,000,000) ÷ 2
3
Interest expense = $2,500,000 × 6%
4
Average total assets = ($5,000,000 + $4,800,000) ÷ 2
*
Average total stockholders’ equity = ($2,324,000 + $1,972,000) ÷ 2
**
Average total stockholders’ equity = ($1,972,000 + $1,500,000) ÷ 2
1
Preferred dividends = $500,000 × 2.5%
2
Average common stockholders’ equity = ($1,824,000 + $1,472,000) ÷ 2
3
Preferred dividends = $500,000 × 2.5%
4
Average common stockholders’ equity = ($1,472,000 + $1,000,000) ÷ 2
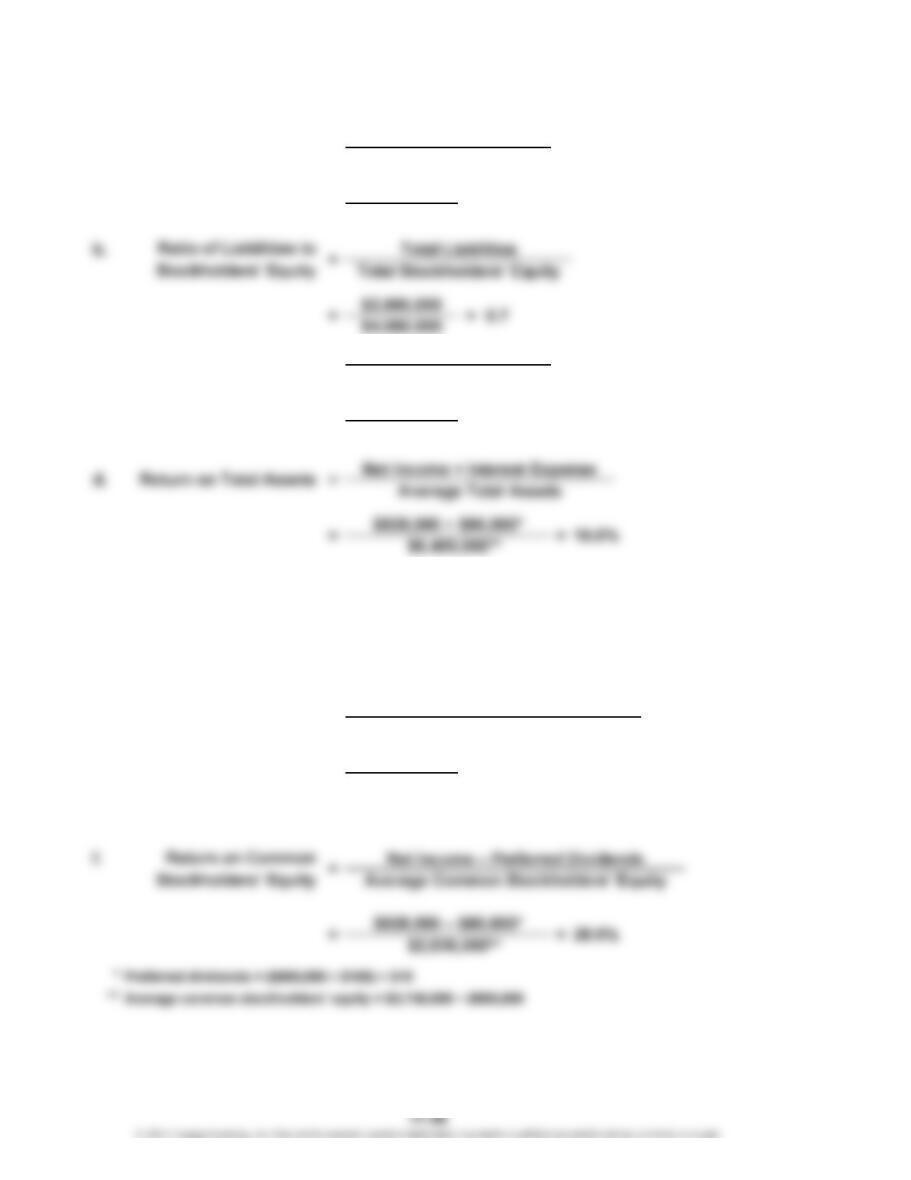
b. The profitability ratios indicate that the company’s profitability has deteriorated.
Most of this change is from net income falling from $462,500 in 20Y6 to $411,000
Return on Common
Stockholders’ Equity
Net Income – Preferred Dividends
Average Common Stockholders’ Equity
20Y7:
Return on Total Assets Net Income + Interest Expense
Average Total Assets
a. =
$411,000 – $12,500
11.0%
=
=
$411,000 + $150,000
$5,100,000
20Y7:
$462,500 – $12,500 = 36.4%
$1,236,000
20Y6:
= 24.2%
$1,648,000
1
2
1
2
3
4
CHAPTER 17 Financial Statement Analysis
Ex. 17-18
($3,299,600 + $3,743,500) ÷ 2
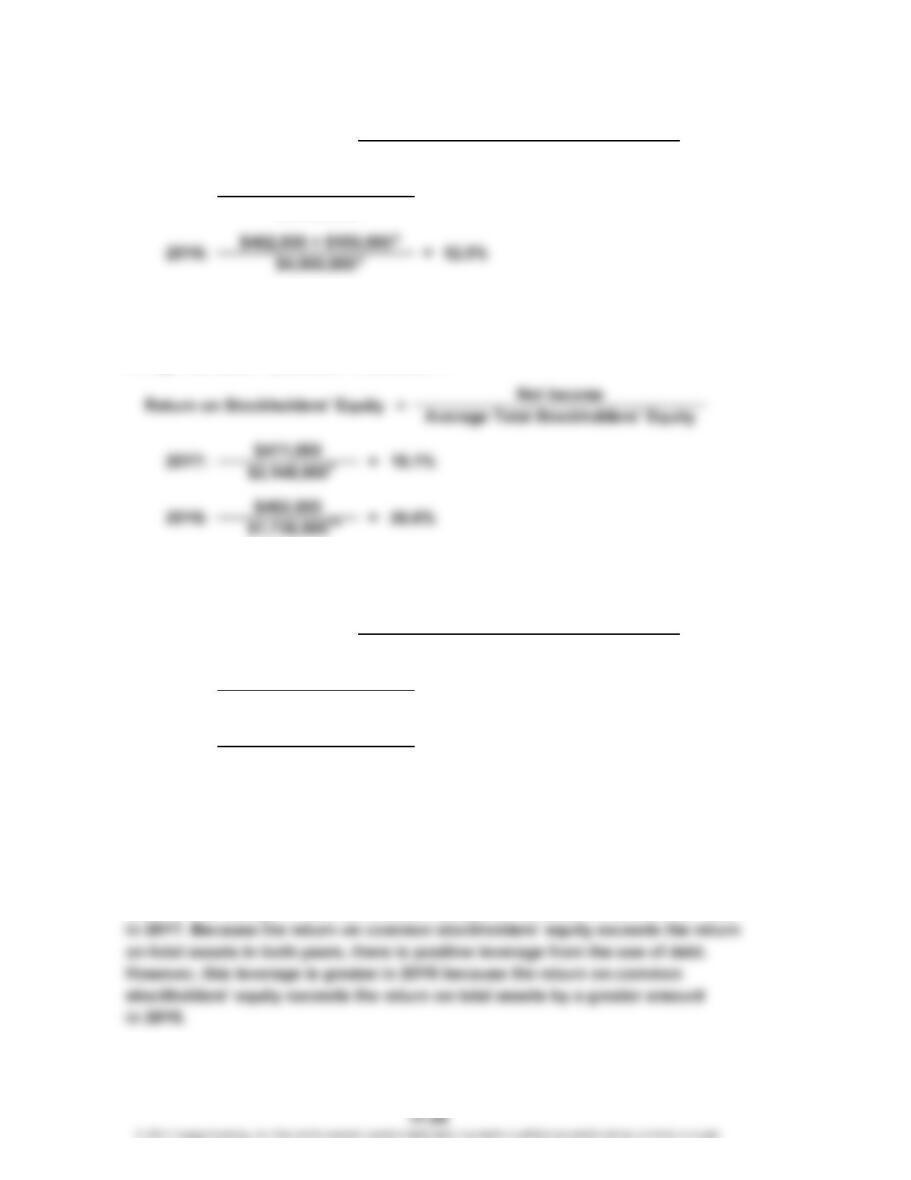
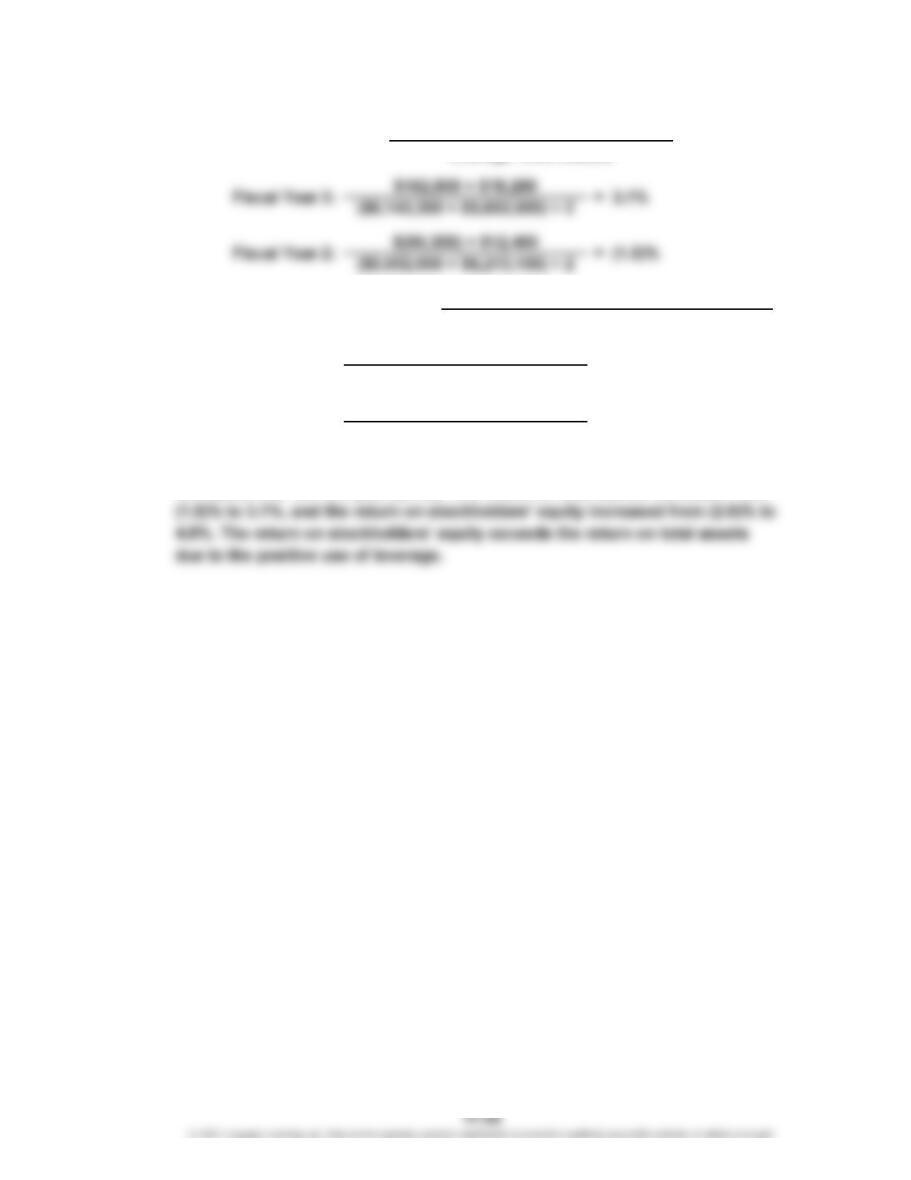
c. Both the return on total assets and the return on stockholders’ equity have
Return on Total Assets Net Income + Interest Expense
Return on Stockholders’ Equity Net Income
Average Total Stockholders’ Equity
a. =
b.
=
Fiscal Year 2:
Fiscal Year 3:
=
= 4.8%
(2.8)%
$162,800
($3,457,400 + $3,299,600) ÷ 2
$(99,300)
CHAPTER 17 Financial Statement Analysis
Ex. 17-19
a.
*
Interest expense = $1,600,000 × 6%
**
Average total assets = ($6,000,000 + $6,800,000***) ÷ 2
***
The total assets at the end of the year is the sum of the total liabilities ($2,800,000) and total
stockholders’ equity ($4,000,000) at the end of the year. Total assets ($6,800,000) = Total
liabilities ($2,800,000) + Total stockholders’ equity ($4,000,000).
e.
*
Average total stockholders’ equity = [($1,072,000 + $1,600,000 + $800,000) + $4,000,000] ÷ 2
Ratio of Fixed Assets to
Long-Term Liabilities
Fixed Assets (net)
Long-Term Liabilities
=
=
=
Average Total Assets
Sales
2.8
=
Stockholders’ Equity
Asset Turnover
=
c.
$6,400,000
$17,920,000
Return on Net Income
=
Average Total Stockholders’ Equity
$3,736,000 = 24.8%
1.9=$3,040,000
$1,600,000
=$928,000
*
**
CHAPTER 17 Financial Statement Analysis
Ex. 17-20
*
Interest expense = $7,500,000 bonds payable × 8%
d.
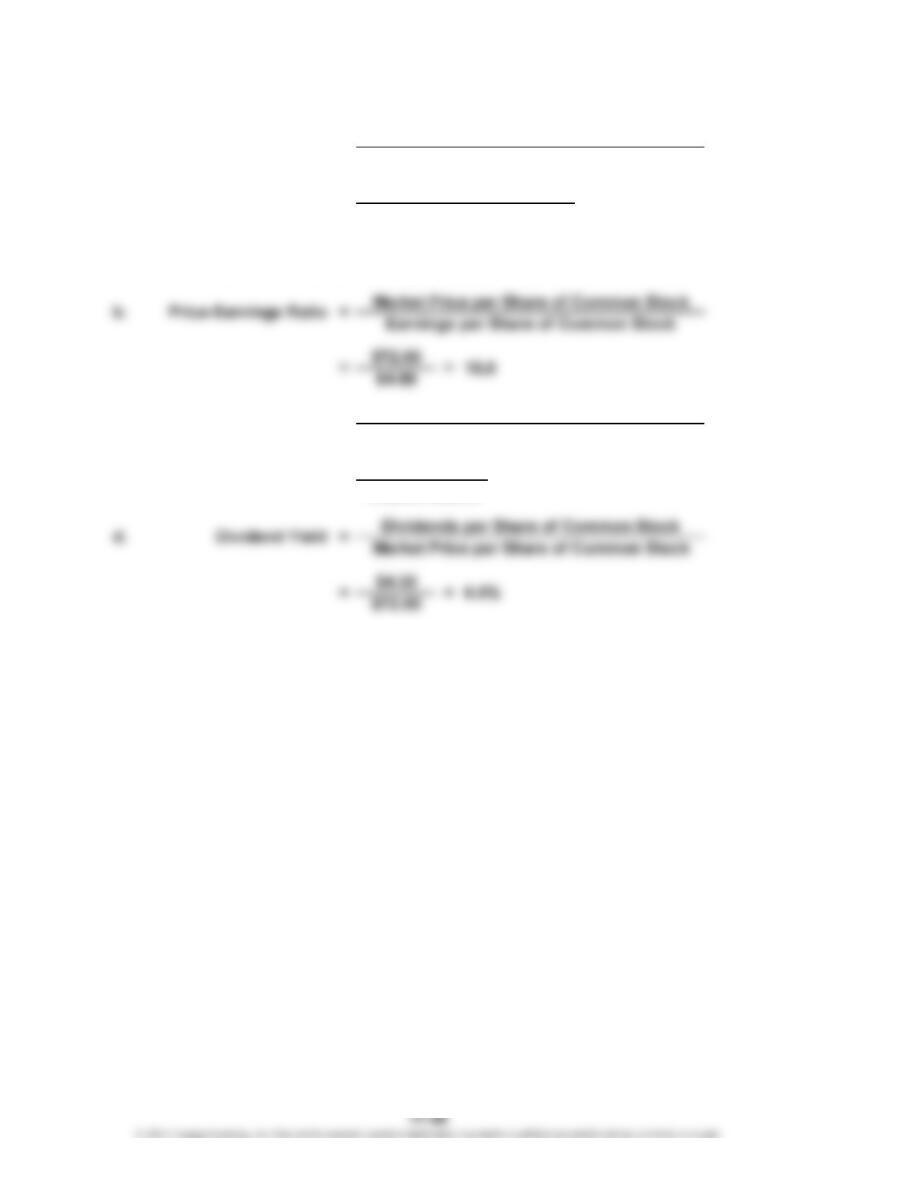
c. =Price-Earnings Ratio
Earnings per Share
=
=
a. =
=
Times Interest Earned
9.8 times
$5,280,000 + $600,000*
$600,000
=
$53.90
$4.90
Dividends per Share
Income Before Income Tax + Interest Expense
Interest Expense
Market Price per Share of Common Stock
=
11.0
Dividends on Common Stock
CHAPTER 17 Financial Statement Analysis
Ex. 17-21
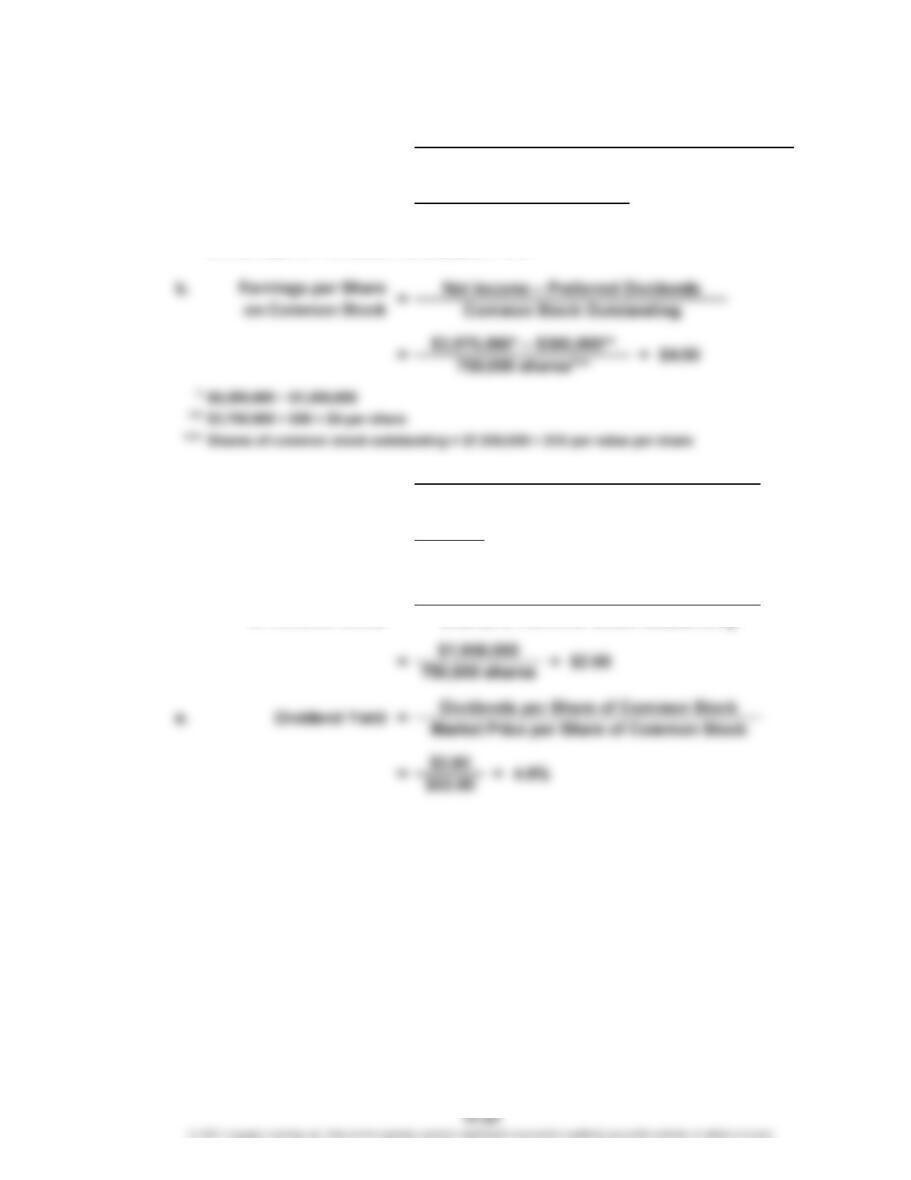
*
Preferred dividends = ($1,500,000 ÷ $50) × $3
**
Shares of common stock outstanding = $8,000,000 ÷ $20
=
=
a. =
$4.80
$2,010,000 – $90,000*
400,000 shares**
Earnings per Share
=
Net Income – Preferred Dividends
Shares of Common Stock Outstanding
$4.32
Dividends per Share Common Dividends
Shares of Common Stock Outstanding
==
c.
$1,728,000
400,000 shares
CHAPTER 17 Financial Statement Analysis
Ex. 17-22
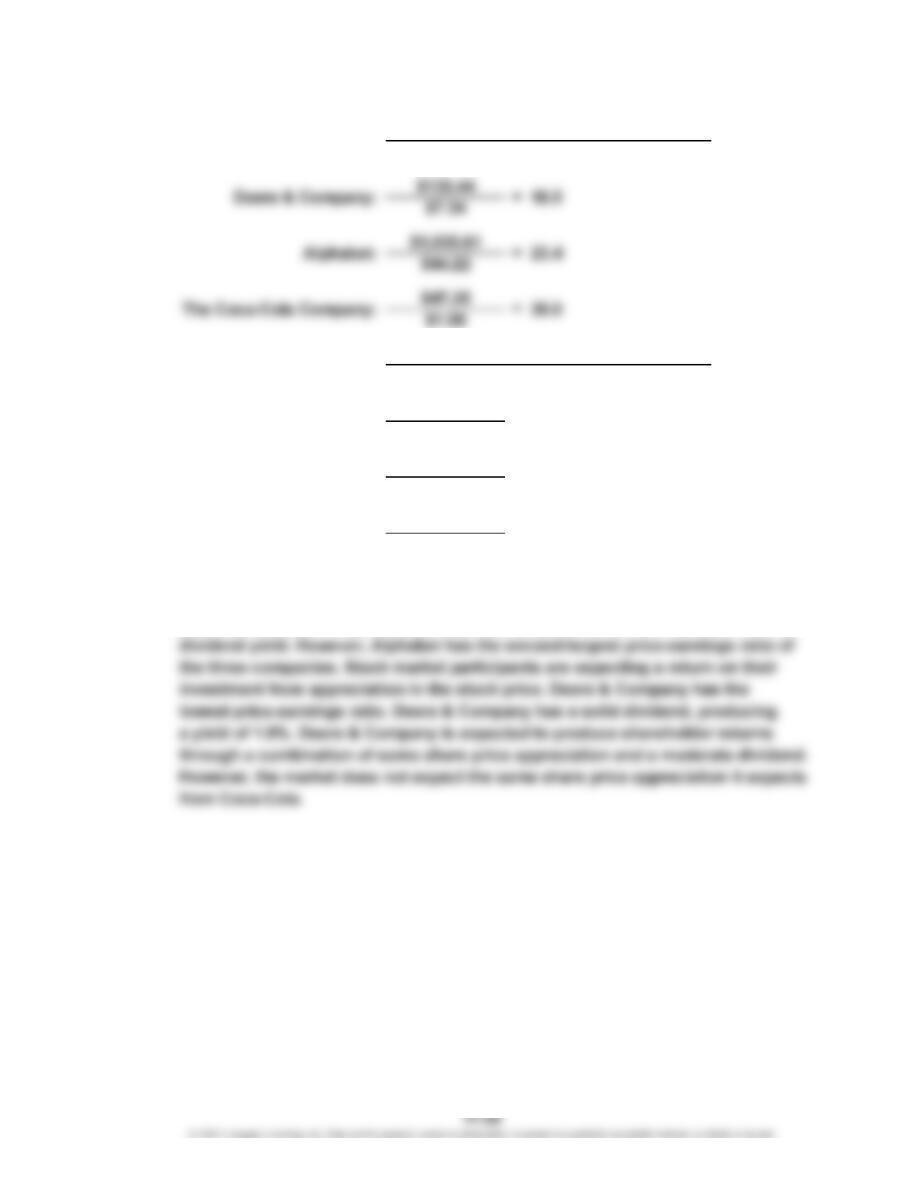
b. Coca-Cola has a large dividend yield and a high price-earnings ratio. Stock market
participants value Coca-Cola common stock on the basis of its dividend and its
potential share price appreciation. Alphabet pays no dividend and, thus, has no
a. =
Price-Earnings Ratio Earnings per Share
Market Price per Share of Common Stock
$1.56
=
=
1.9%
$47.35
=
$2.58
$135.44
Dividend Yield =Dividends per Share of Common Stock
Market Price per Share of Common Stock
Deere & Company:
Alphabet:
The Coca-Cola Company:
0.0%
$0.00
$1,035.61
3.3%
CHAPTER 17 Financial Statement Analysis
Appendix Ex. 17-23
a. Earnings per share on income before discontinued operations:
Net income………………………………………………………………………
…
$4,000,000
Less gain on discontinued operations……………………………………
…
400,000
Income before discontinued operations…………………………………… $3,600,000
b.
= $7.60 per share
500,000 shares
=
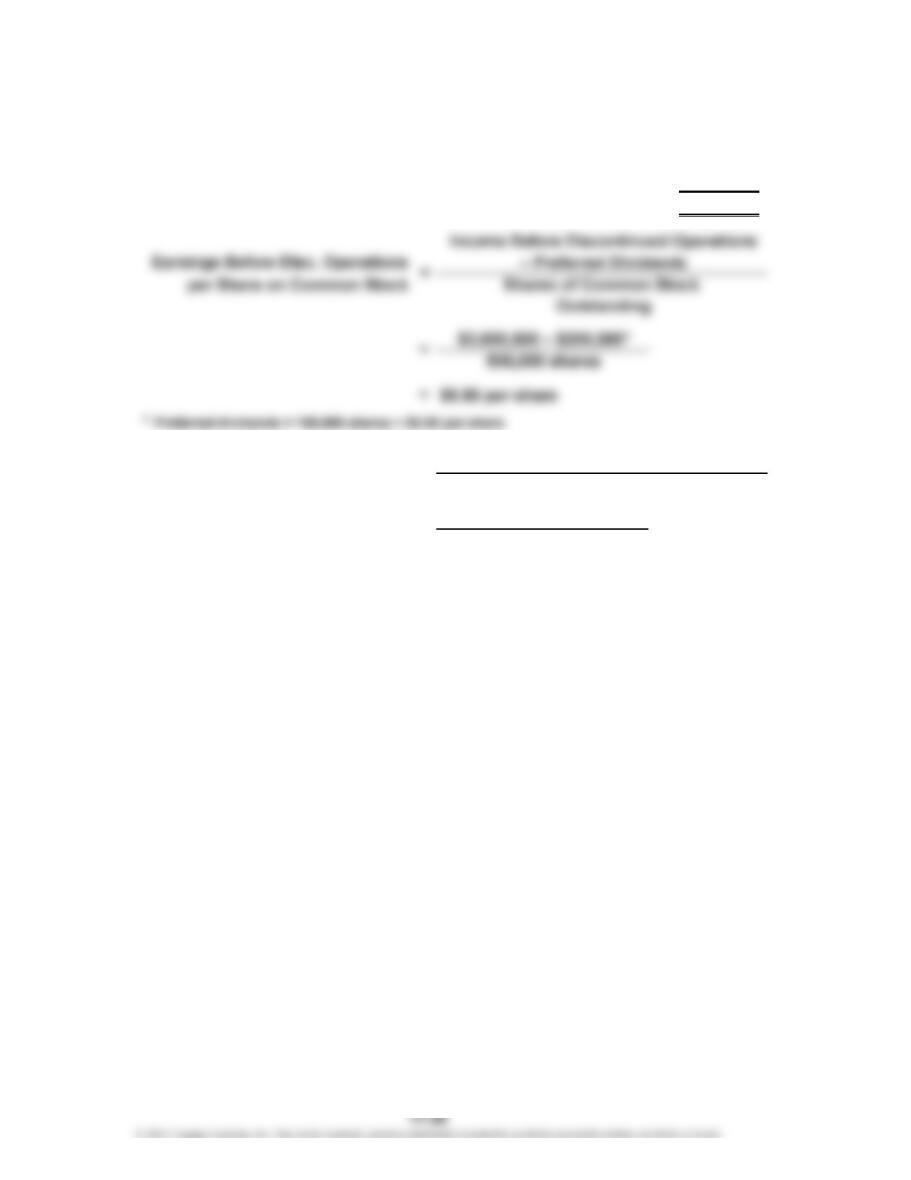
Earnings per Share on
Common Stock =Net Income – Preferred Dividends
Shares of Common Stock Outstanding
$4,000,000 – $200,000
CHAPTER 17 Financial Statement Analysis
Appendix Ex. 17-24
a.
Income from continuing operations before income tax expense $1,000,000
* Income tax expense = $1,000,000 × 40%
b.
Earnings per share:
Income from continuing operations $ 30.00
Loss from discontinued operations (12.00)
Net income $ 18.00
1
EPS on Income from continuing operations = $30.00 = $600,000 ÷ 20,000
2
EPS on Loss from discontinued operations = –$12.00 = $(240,000) ÷ 20,000
Appendix Ex. 17-25
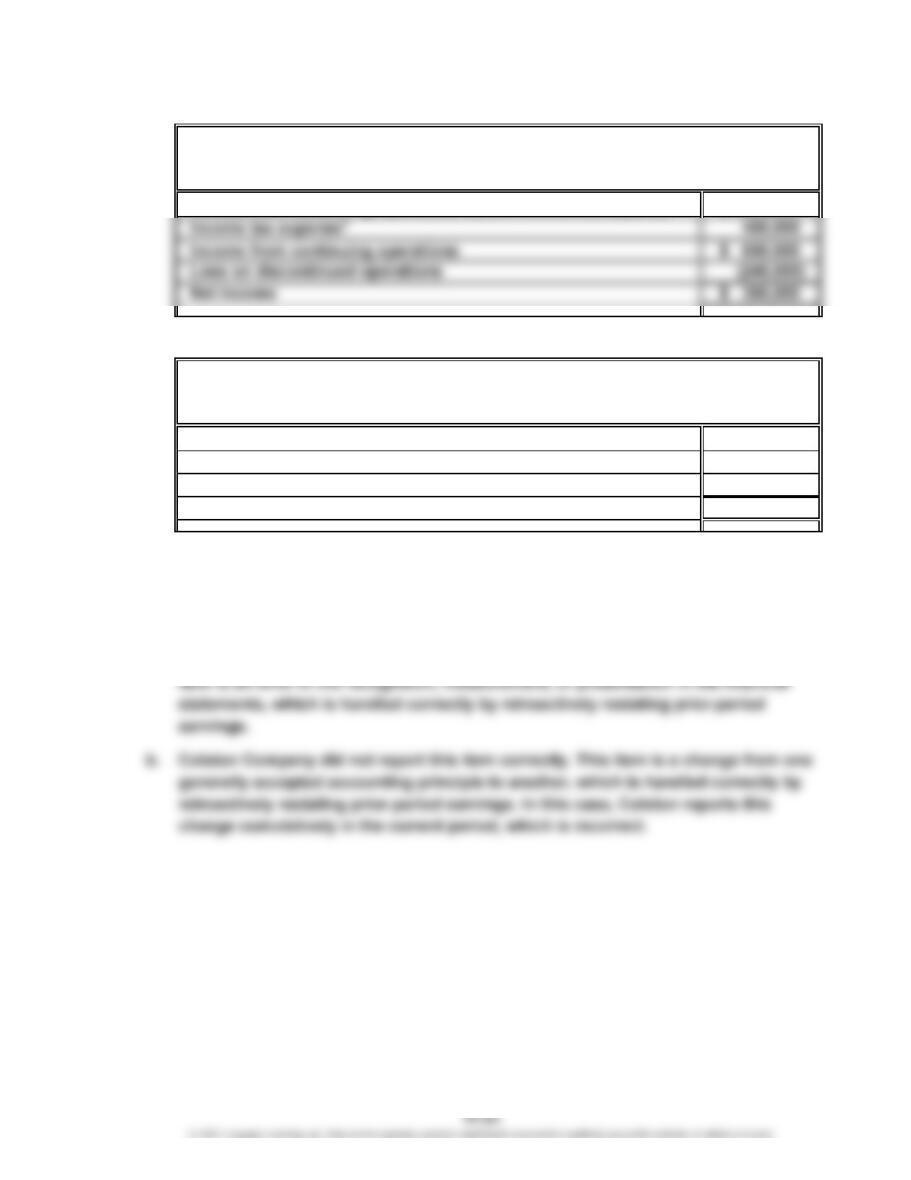
a. Colston Company reported this item correctly in the financial statements. This
Partial Income Statement
For the Year Ended December 31
Apex Inc.
Partial Income Statement
For the Year Ended December 31
Apex Inc.
1
2
CHAPTER 17 Financial Statement Analysis
Prob. 17-1A
1.
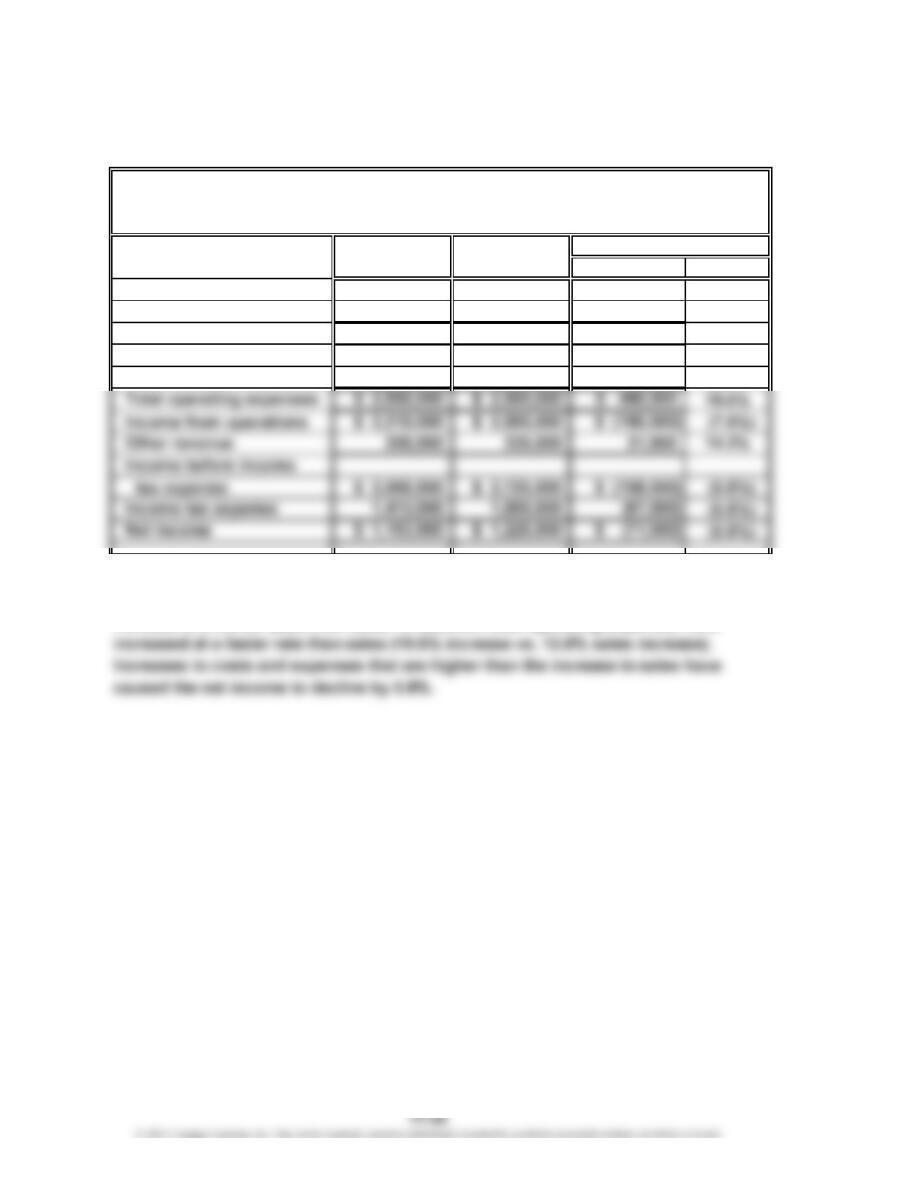
20Y2 20Y1 Amount Percent
Sales $16,800,000 $15,000,000 $1,800,000 12.0%
Cost of merchandise sold 11,500,000 10,000,000 1,500,000 15.0%
Gross profit $ 5,300,000 $ 5,000,000 $ 300,000 6.0%
Selling expenses $ 1,770,000 $ 1,500,000 $ 270,000 18.0%
Administrative expenses 1,220,000 1,000,000 220,000 22.0%
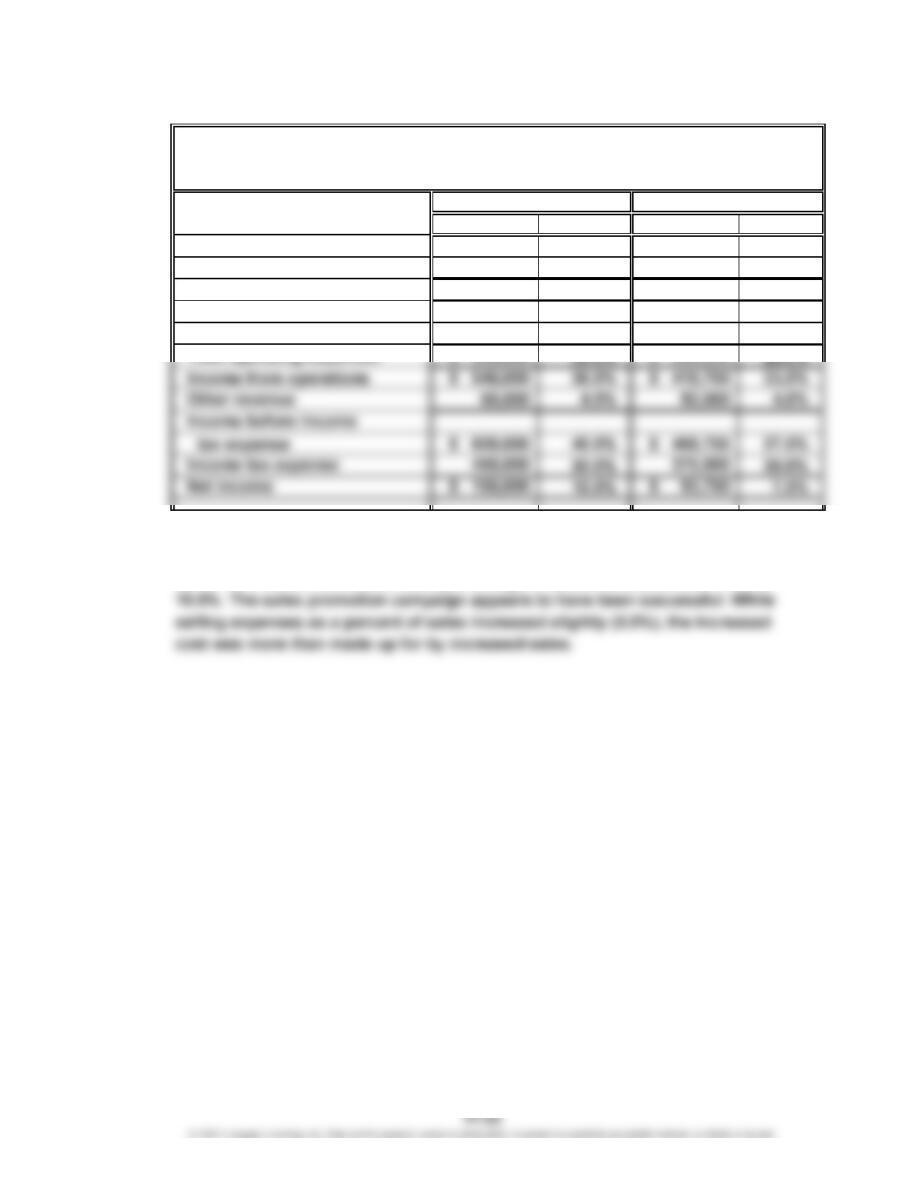
2. Net income has declined from 20Y1 to 20Y2. Sales have increased by 12.0%; however,
the cost of merchandise sold has increased by 15.0%, causing the gross profit to
PROBLEMS
Increase (Decrease)
McDade Company
Comparative Income Statement
For the Years Ended December 31, 20Y2 and 20Y1
CHAPTER 17 Financial Statement Analysis
Prob. 17-2A
1.
Amount Percent Amount Percent
Sales $1,500,000 100.0% $1,250,000 100.0%
Cost of merchandise sold 510,000 34.0% 475,000 38.0%
Gross profit $ 990,000 66.0% $ 775,000 62.0%
Selling expenses $ 270,000 18.0% $ 200,000 16.0%
Administrative expenses 180,000 12.0% 156,250 12.5%
2. The vertical analysis indicates that the costs other than selling expenses (cost of
merchandise sold and administrative expenses) improved as a percentage of
sales. As a result, net income as a percentage of sales increased from 7.5% to
20Y2 20Y1
Tri-Comic Company
Comparative Income Statement
For the Years Ended December 31, 20Y2 and 20Y1
CHAPTER 17 Financial Statement Analysis
Prob. 17-3A
1. a. = Current Assets – Current Liabilities
$900,000 = $1,650,000 – $750,000
2.
Working Quick
Capital Assets
$ 900,000 $ 900,000
900,000 775,000
900,000 900,000
900,000 800,000
Supporting Data
2.4 1.2 1,550,000
c.
d.
1.2 1,525,000
2.0 1.0 1,760,000
b.
= 2.2
Current Ratio = Current Assets
Current Liabilities
$1,650,000
=
Working Capital
Transaction
a.
b.
Assets
Current
Ratio
Quick
Ratio
Current
2.2 1.2 $1,650,000
2.4
$750,000
Current
Liabilities
$750,000
625,000
860,000
650,000
CHAPTER 17 Financial Statement Analysis
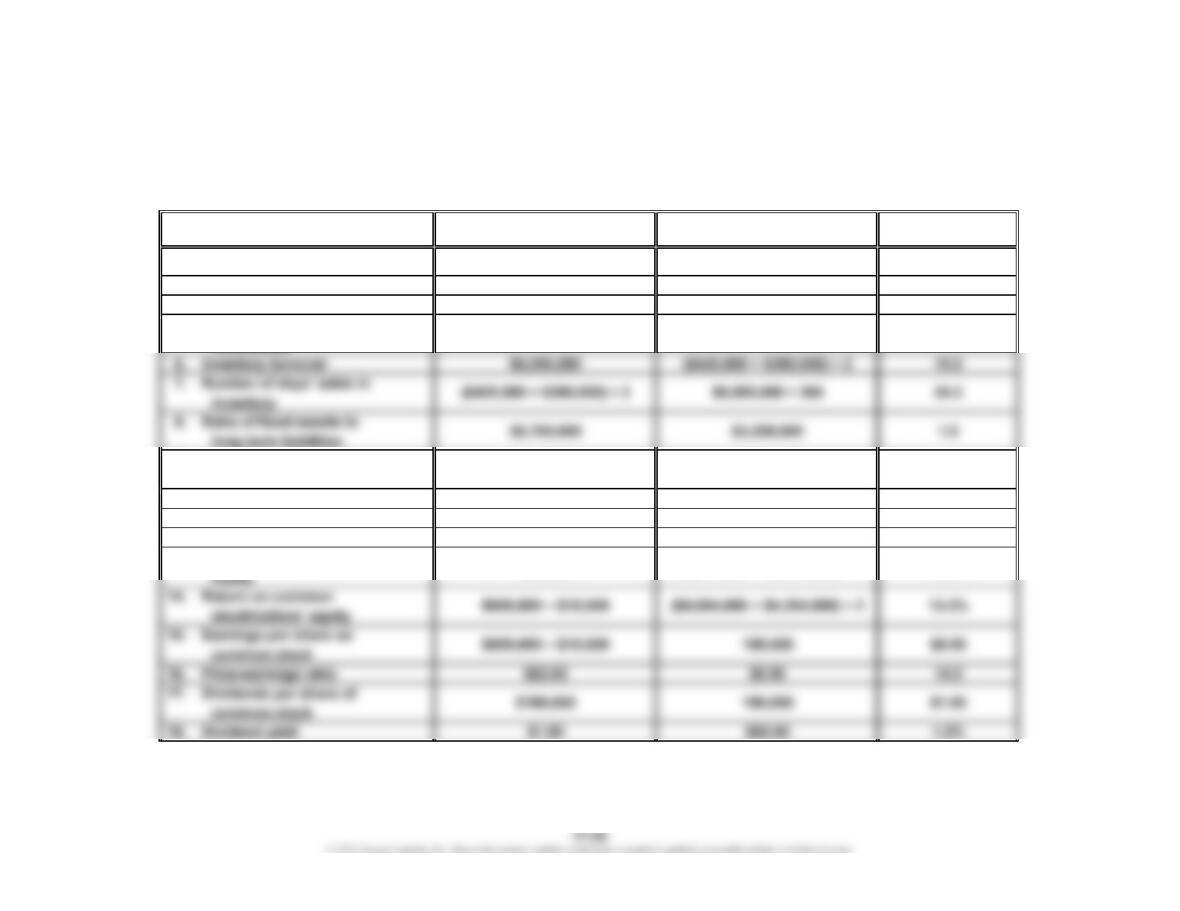
Prob. 17-4A
1. Working Capital: $2,464,000 – $880,000 = $1,584,000
Calculated
Numerator Denominator Value
2. Current ratio $2,464,000 $880,000 2.8
3. Quick ratio $1,936,000 $880,000 2.2
4. Accounts receivable turnover $10,850,000 ($585,000 + $500,000) ÷ 2 20.0
5. Number of days’ sales in
9. Ratio of liabilities to
stockholders’ equity
10. Times interest earned $1,020,000 + $132,000 $132,000 8.7
11. Asset turnover $10,850,000 ($9,024,000 + $8,254,000) ÷ 2 1.3
12. Return on total assets $600,000 + $132,000 ($9,024,000 + $8,254,000) ÷ 2 8.5%
13. Return on stockholders’
12.8%
($4,944,000 + $4,454,000) ÷ 2
$4,944,000
$600,000
0.8$4,080,000
18.3
($585,000 + $500,000) ÷ 2 $10,850,000 ÷ 365
Ratio
CHAPTER 17 Financial Statement Analysis
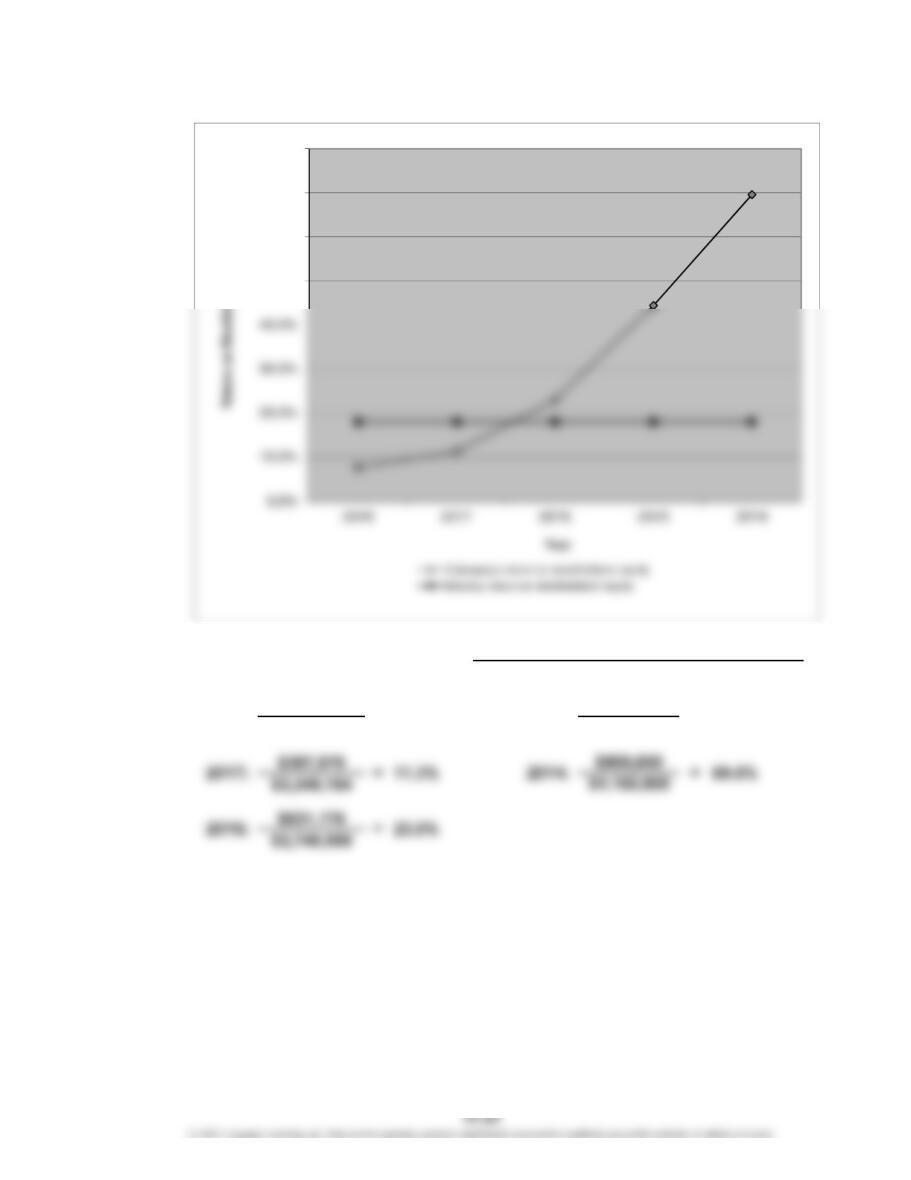
Prob. 17-5A
1. a.
$889,453
$4,270,764
Return on Total Assets =
$3,044,250
Net Income + Interest Expense
Average Total Assets
20.8%20Y8: =
20Y5: $1,379,000
45.3%
=
40.0%
50.0%
60.0%
CHAPTER 17 Financial Statement Analysis
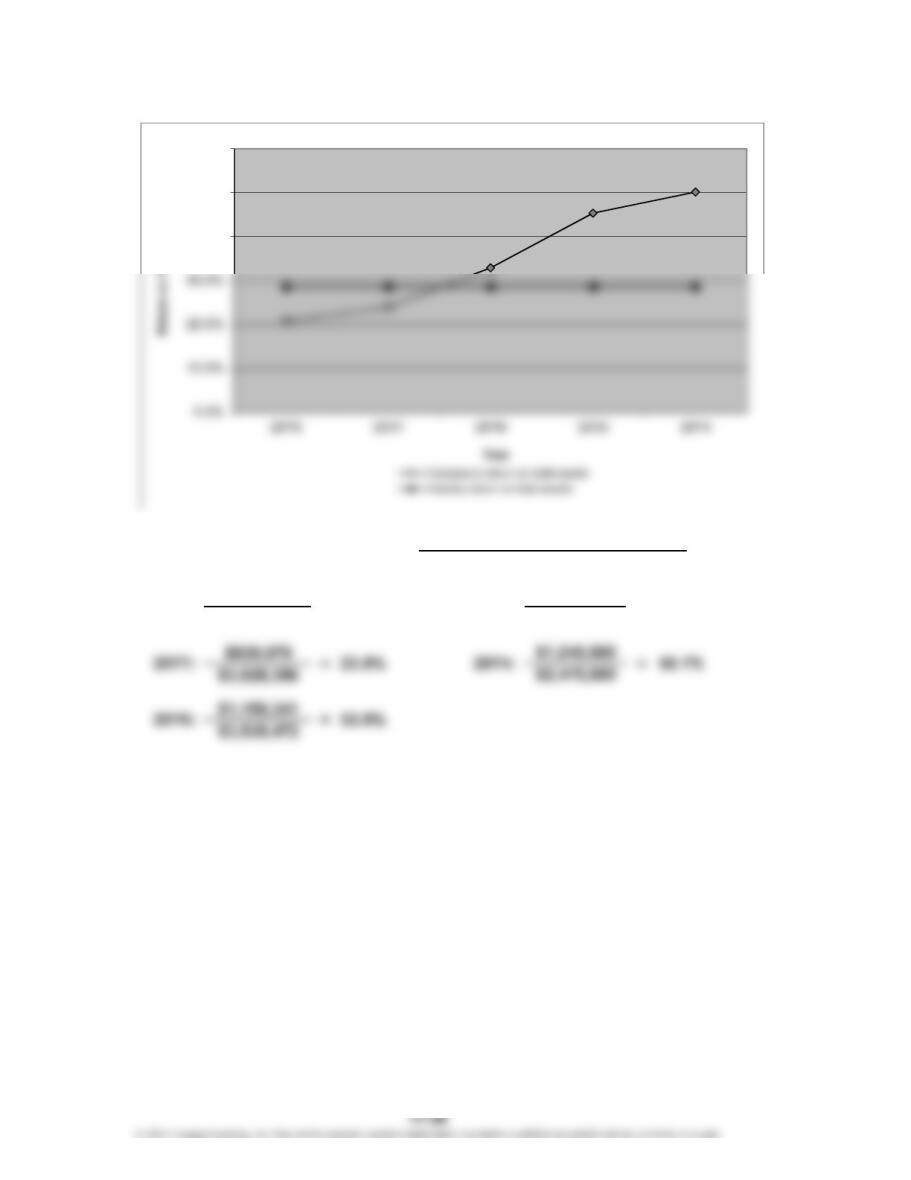
Prob. 17-5A (Continued)
1. b.
$273,406
$3,569,855
20Y8:
=
44.4%=
Average Total Stockholders’ Equity
Net Income
20Y5: $884,000
$1,992,000
7.7%
=Return on Stockholders’ Equity
50.0%
60.0%
70.0%
80.0%
CHAPTER 17 Financial Statement Analysis
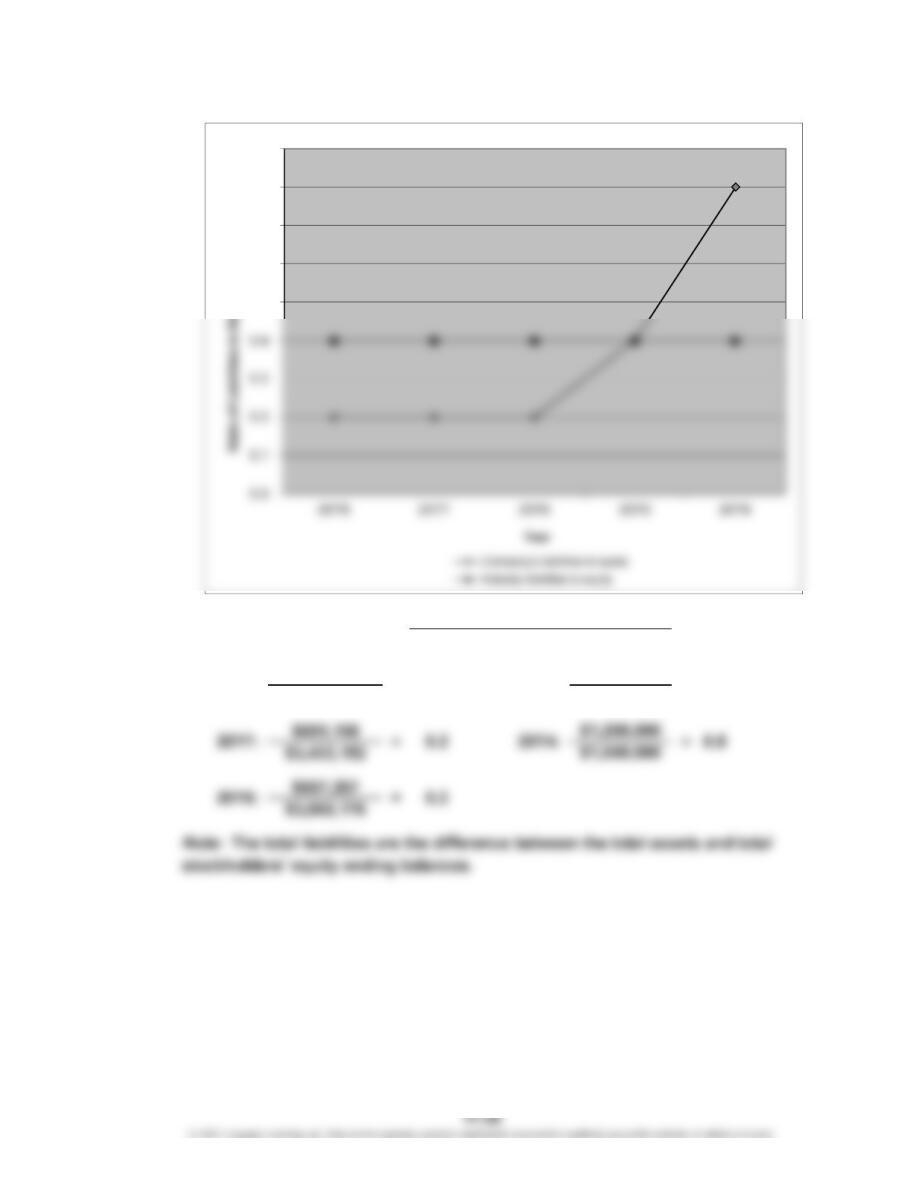
Prob. 17-5A (Continued)
1. c.
$921,202
$616,047
=
20Y8: =
Net Income + Income Tax Expense + Interest Expense
Interest Expense
Times Interest Earned
$1,539,000
$495,000 =20Y5:
3.1
1.5
2.0
2.5
3.0
3.5
CHAPTER 17 Financial Statement Analysis
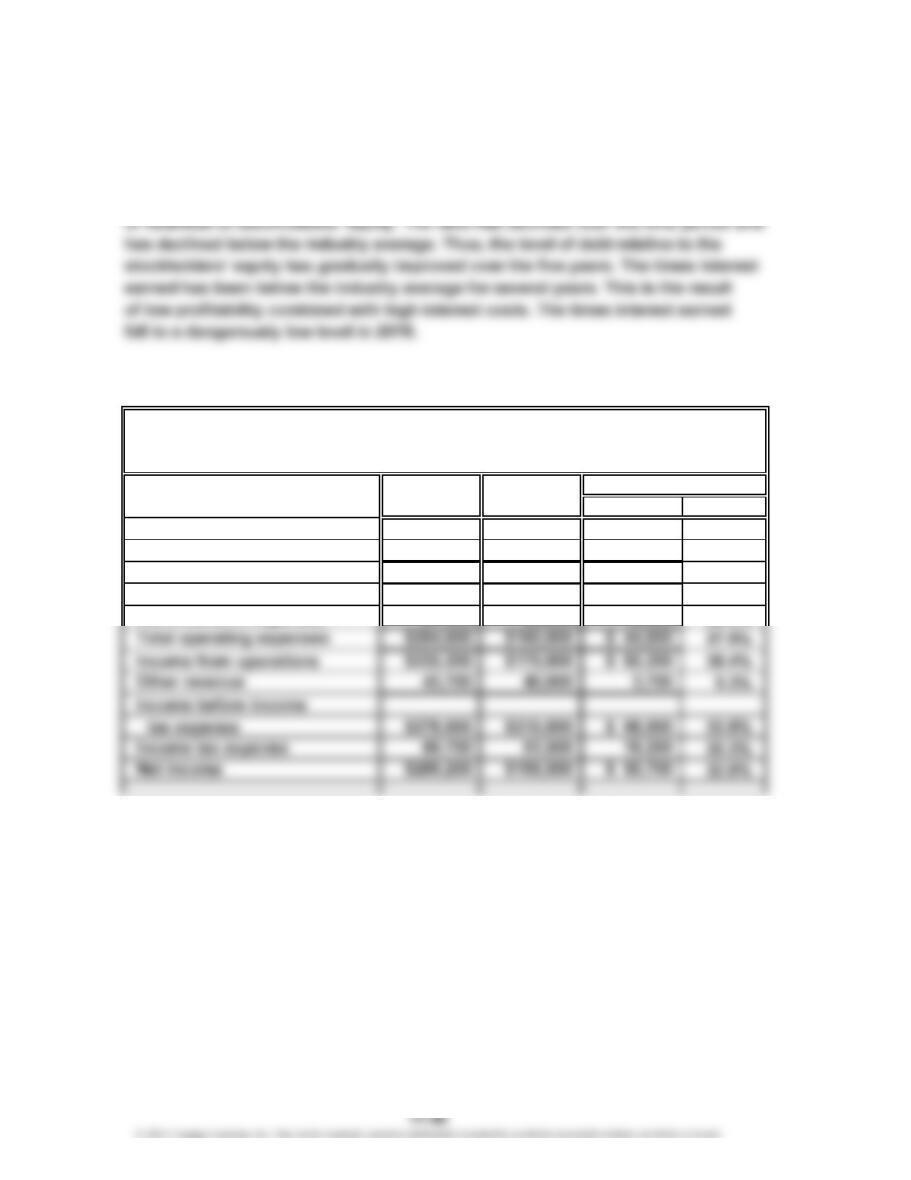
Prob. 17-5A (Continued)
1. d.
$710,621
$3,706,557
0.4
Total Liabilities
Total Stockholders’ Equity
$904,500
$2,434,000
=
20Y5:
Ratio of Liabilities to
Stockholders’ Equity =
=
20Y8: 0.2
0.5
0.6
0.7
0.8
0.9
CHAPTER 17 Financial Statement Analysis
Prob. 17-5A (Concluded)
2. Both the return on total assets and the return on stockholders’ equity have been
moving in a negative direction in the last five years. Both measures have moved
below the industry average over the last two years. The cause of this decline is
driven by a rapid decline in earnings. The use of debt can be seen from the ratio
Prob. 17-1B
1.
20Y2 20Y1 Amount Percent
Sales $805,200 $610,000 $195,200 32.0%
Cost of merchandise sold 365,400 280,000 85,400 30.5%
Gross profit $439,800 $330,000 $109,800 33.3%
Selling expenses $117,200 $ 92,000 $ 25,200 27.4%
2. The profitability has improved significantly from 20Y1 to 20Y2. Sales have
increased by 32.0% over the 20Y1 base year, while the cost of merchandise sold,
selling expenses, and administrative expenses grew at a slower rate. Increasing
sales combined with costs that increase at a slower rate results in strong earnings
growth. In this case, net income grew 32.0% over the base year.
Increase (Decrease)
Gerhardt Inc.
Comparative Income Statement
For the Years Ended December 31, 20Y2 and 20Y1