CHAPTER 17 Financial Statement Analysis
Ex. 17–14
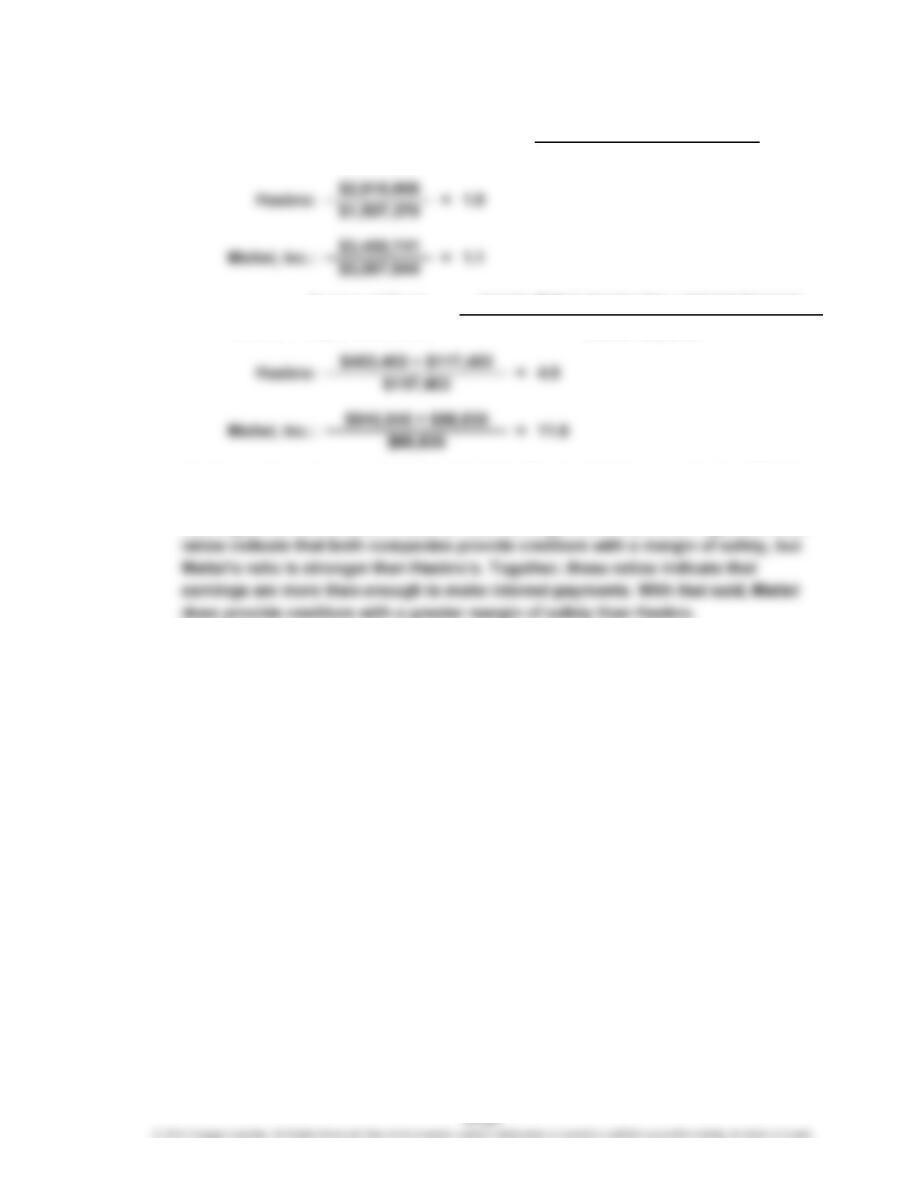
c. Hasbro carries a larger proportion of debt to the stockholders’ equity than Mattel
(1.9 and 1.1 times stockholders’ equity). Both companies have strong interest
coverage; however, Mattel’s ratio is much stronger than Hasbro’s. Together, these
Income Before Income Tax + Interest Expense
b. Number of Times
Interest Charges Are Earned Interest Expense
=
Total Liabilities
Total Stockholders’ Equity
a. Ratio of Liabilities to Stockholders’ Equity =
CHAPTER 17 Financial Statement Analysis
Ex. 17–15
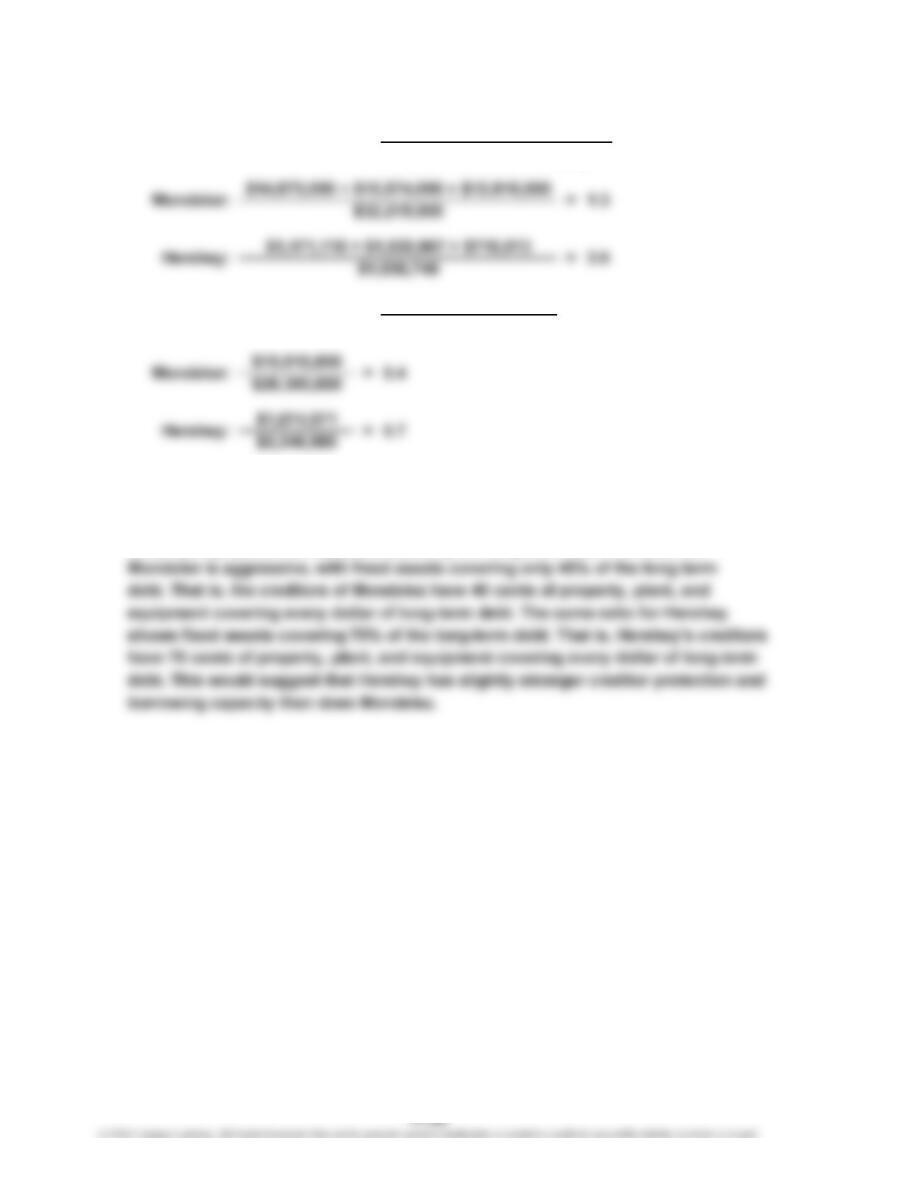
c. Hershey uses more debt than does Mondelez. As a result, Hershey’s total liabilities
to stockholders’ equity ratio is higher than Mondelez’s (3.6 vs. 1.3). Mondelelz has
a lower ratio of fixed assets to long-term liabilities than Hershey. This ratio divides
the property, plant, and equipment (net) by the long-term debt. The ratio for
Fixed Assets (net)
Long-Term Liabilities
a. =
Ratio of Liabilities to
Stockholders’ Equity
Total Liabilities
Total Stockholders’ Equity
b. Ratio of Fixed Assets to
Long-Term Liabilities =
CHAPTER 17 Financial Statement Analysis
Ex. 17–16
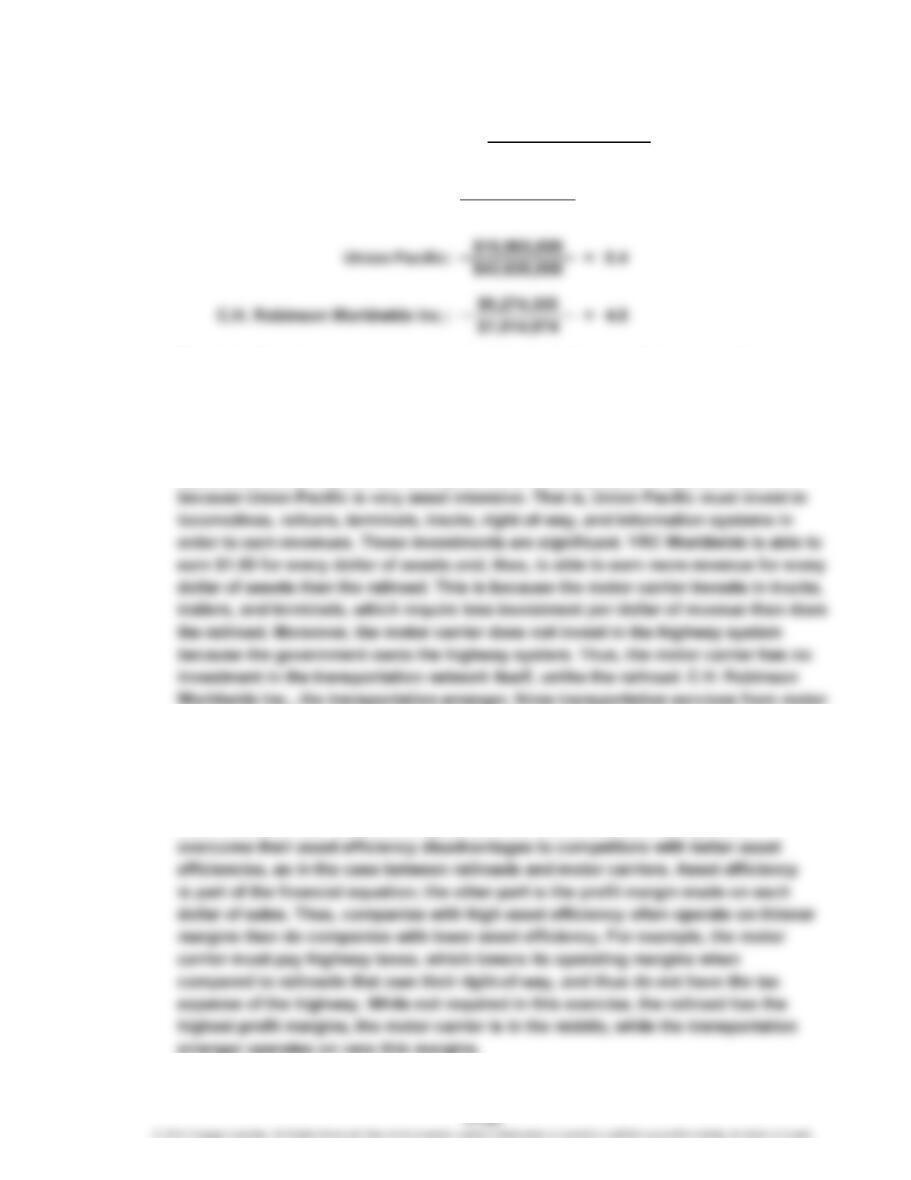
b. The ratio of sales to assets measures the number of sales dollars earned for
each dollar of assets. The greater the number of sales dollars earned for every
dollar of assets, the more efficient a firm is in using assets. Thus, the ratio is a
measure of the efficiency in using assets. The three companies are different in
their efficiency in using assets because they are different in the nature of their
operations. Union Pacific earns only 40 cents for every dollar of assets. This is
carriers and railroads but does not own these assets itself. The transportation
arranger has assets in accounts receivable and information systems but does not
require transportation assets; thus, it is able to earn the highest revenue per dollar
of assets.
Note to Instructors: Students may wonder how asset-intensive companies
$4,334,640 =
$2,812,504
a. =Sales
Average Total Assets
Ratio of Sales to Total Assets
YRC Worldwide: 1.5
CHAPTER 17 Financial Statement Analysis
Ex. 17–17
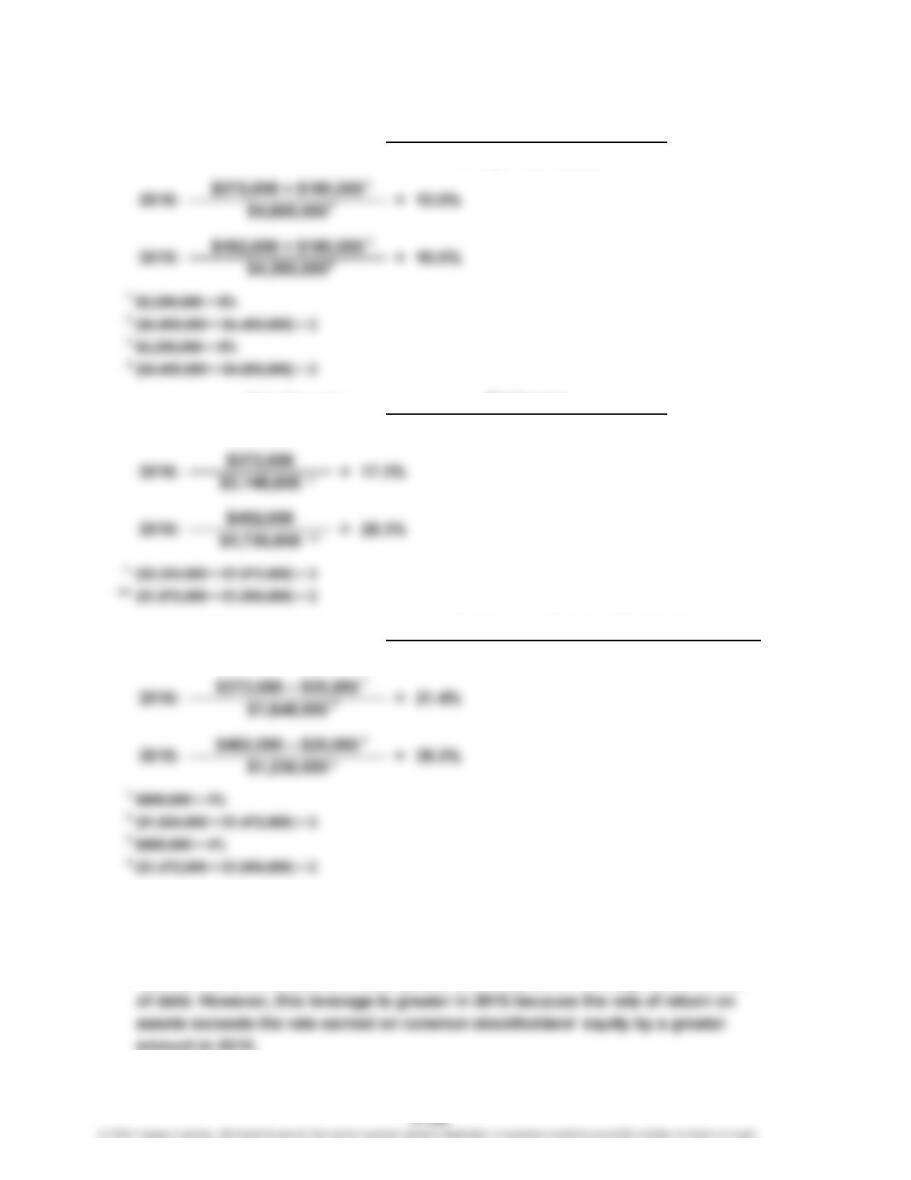
b. The profitability ratios indicate that Robinson Inc.’s profitability has deteriorated.
Most of this change is from net income falling from $492,000 in 2015 to $372,000
in 2016. Because the rate of return on common stockholders’ equity exceeds the
rate earned on total assets in both years, there is positive leverage from the use
=
Rate Earned on
Stockholders’ Equity
Average Total Stockholders’ Equity
a.
=
Rate Earned on Total Assets
Average Total Assets
Net Income + Interest Expense
Net Income
Rate Earned on Common
Stockholders’ Equity =Average Common Stockholders’ Equity
Net Income – Preferred Dividends
CHAPTER 17 Financial Statement Analysis
Ex. 17–18
c. Both the rate earned on total assets and the rate earned on stockholders’
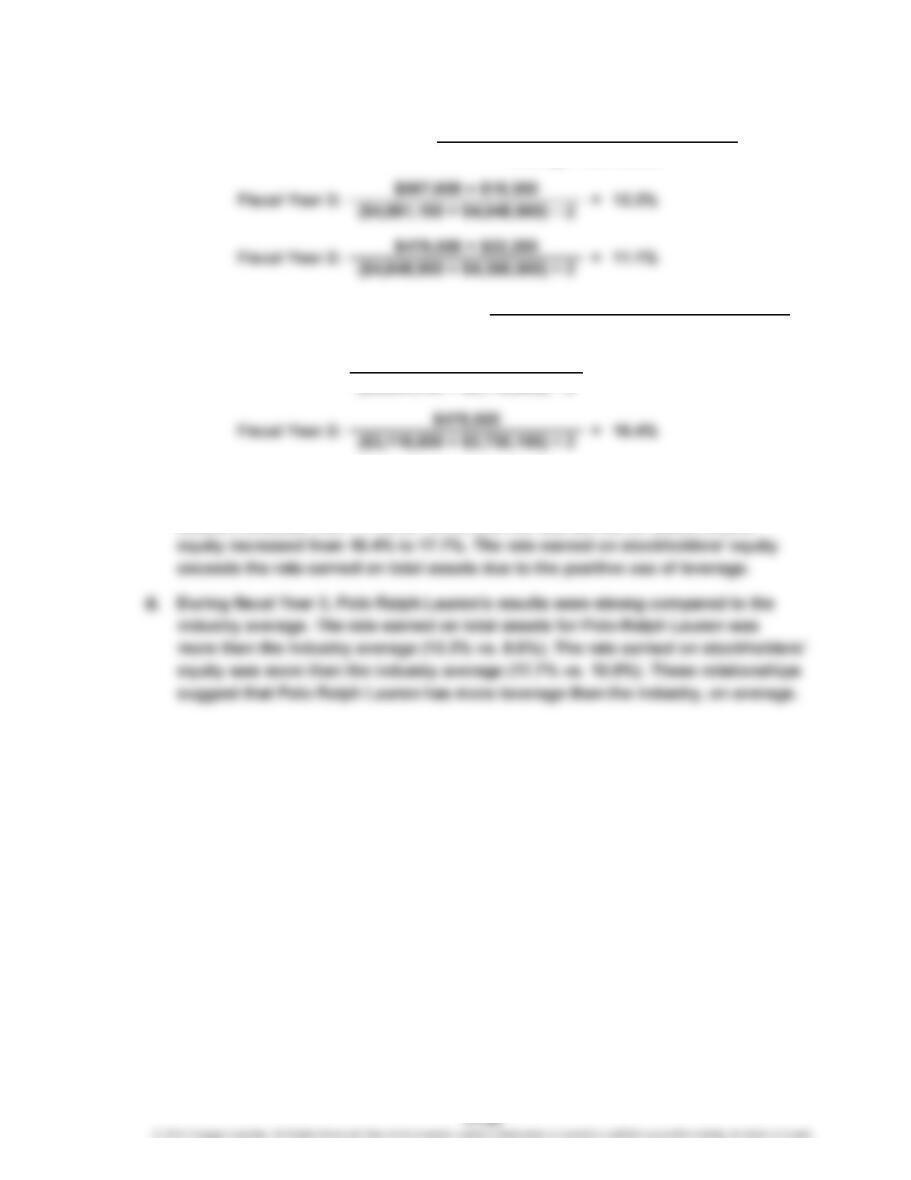
equity have increased over the two-year period. The rate earned on total
assets increased from 11.1% to 12.2%, and the rate earned on stockholders’
b.
17.7%
=
=Average Total Stockholders’ Equity
Net Income
a. =
Rate Earned on Total Assets Net Income + Interest Expense
Average Total Assets
Rate Earned on Stockholders’ Equity
($3,304,700 + $3,116,600) ÷ 2
$567,600
Fiscal Year 3:
CHAPTER 17 Financial Statement Analysis
Ex. 17–19
14.0%
$7,500,000
Rate Earned on Total Assets = Net Income + Interest Expense
Average Total Assets
=Net Income
Average Total Stockholders’ Equity
c.
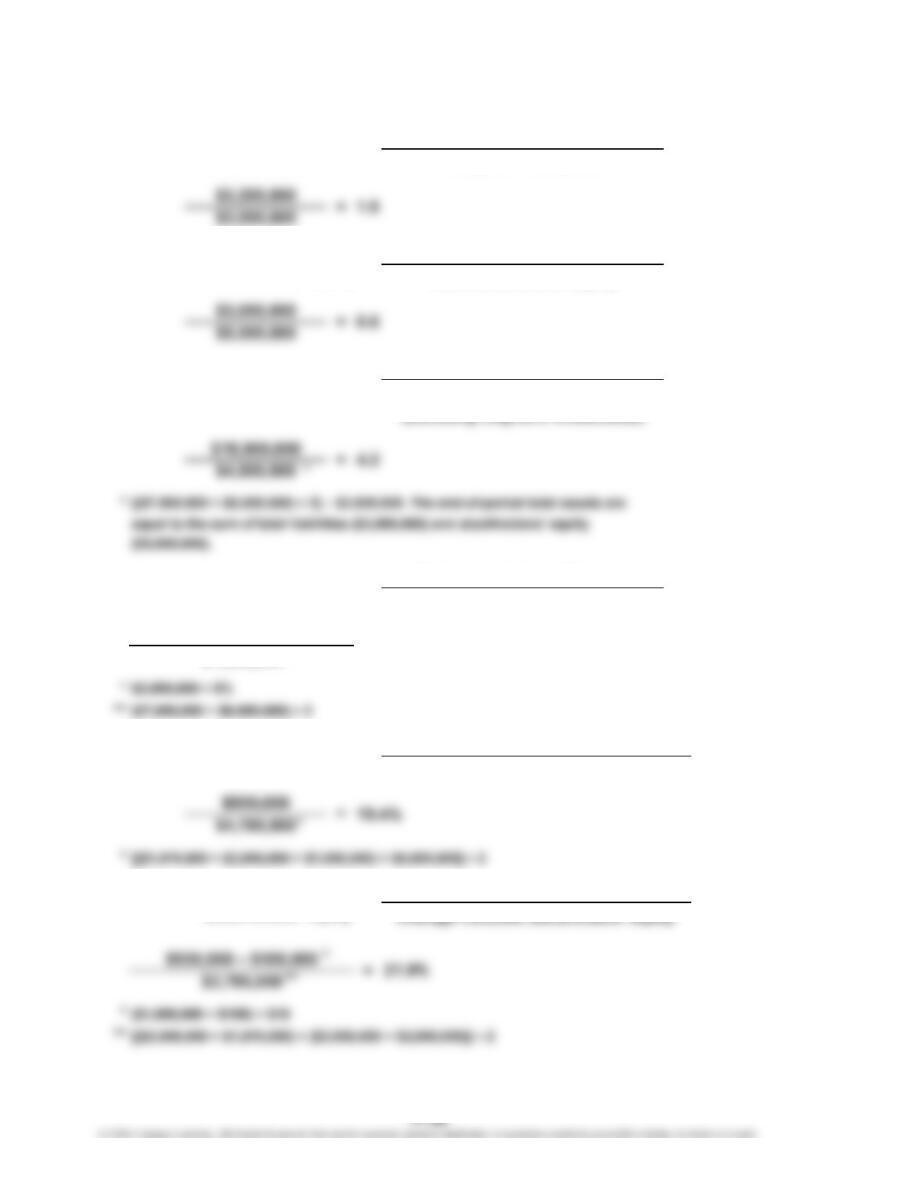
Ratio of Sales to Assets = Average Total Assets
d.
$930,000 + $120,000 =
b.
Ratio of Liabilities to
Stockholders’ Equity =Total Liabilities
Total Stockholders’ Equity
e.
f.
Rate Earned on Common
Stockholders’ Equity
Rate Earned on
Stockholders’ Equity
=
Sales
a.
=
Ratio of Fixed Assets to
Long-Term Liabilities Long-Term Liabilities
Fixed Assets (net)
(excluding long-term investments)
Net Income – Preferred Dividends
**
*
CHAPTER 17 Financial Statement Analysis
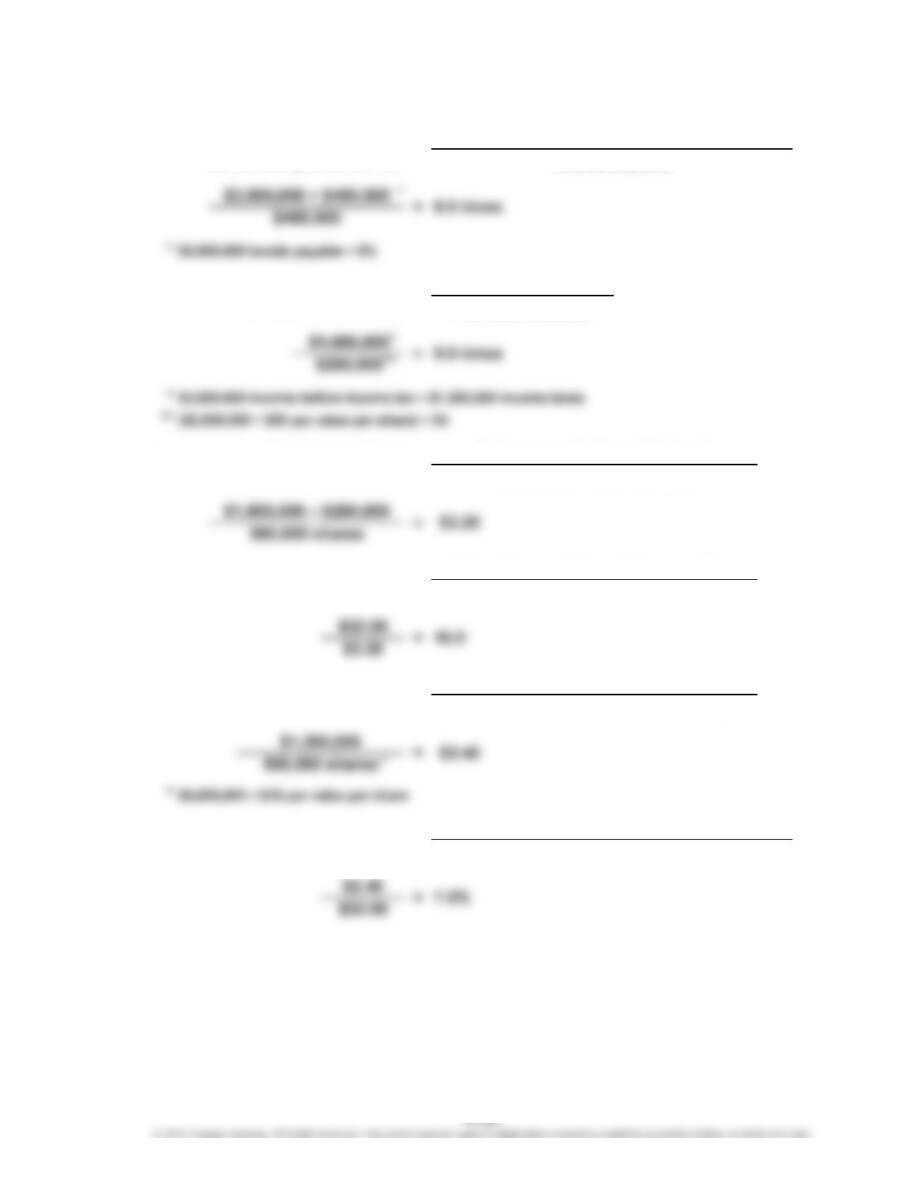
Ex. 17–20
Preferred Dividends
Dividends per Share of Common Stock
Market Price per Share of Common Stock
Market Price per Share of Common Stock
a.
=
Number of Times Bond
Interest Charges Are Earned
e.
Income Before Income Tax + Interest Expense
c.
Earnings per Share
on Common Stock
Interest Expense
Net Income – Preferred Dividends
Net Income
Common Stock Outstanding
f.
Dividend Yield
=
Dividends per Share
of Common Stock =
d.
=Earnings per Share
b.
Number of Times Preferred
Dividends Are Earned =
=
Dividends on Common Stock
Shares of Common Stock Outstanding
Price-Earnings Ratio
CHAPTER 17 Financial Statement Analysis
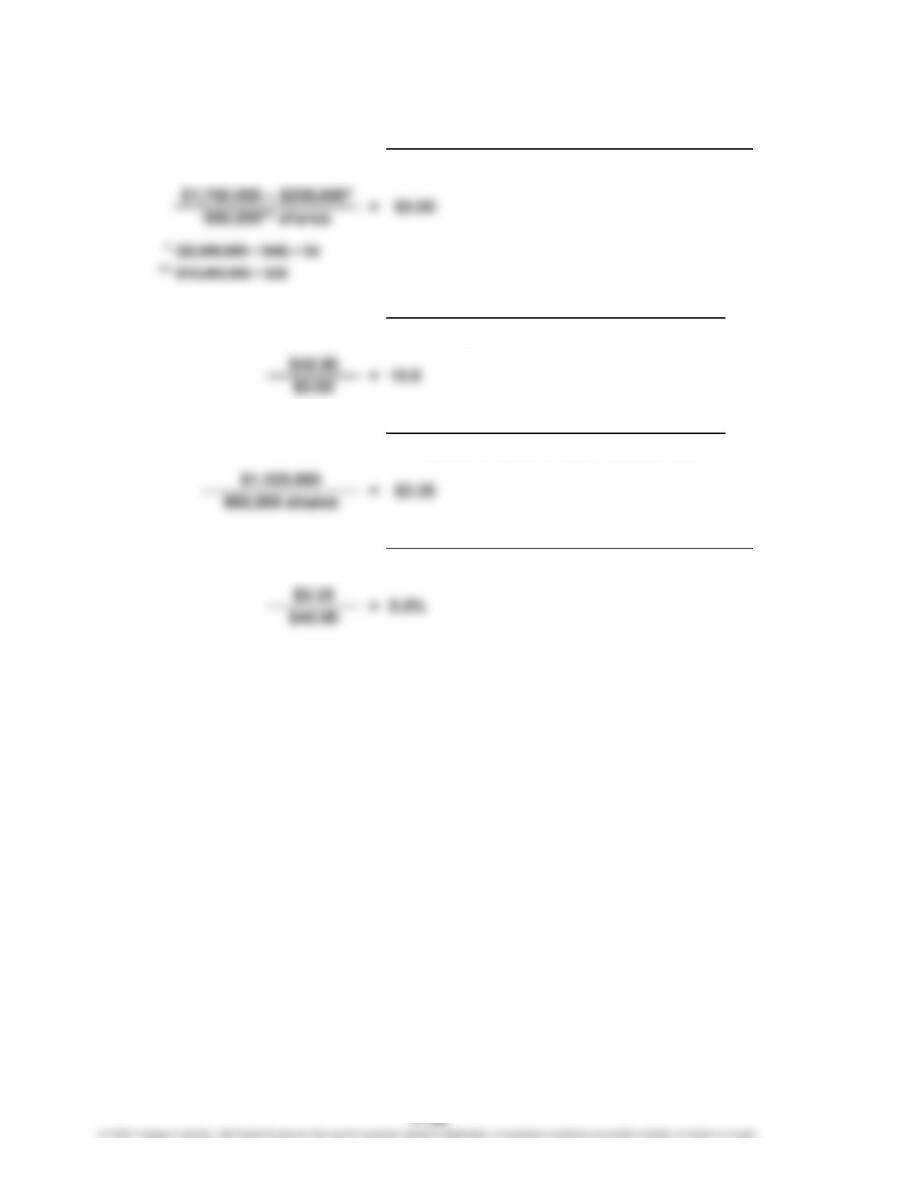
Ex. 17–21
Market Price per Share of Common Stock
a.
=Earnings per Share
b.
=
Price-Earnings Ratio =
d.
Dividend Yield
Dividends per Share
c.
Market Price per Share of Common Stock
Earnings per Share of Common Stock
Net Income – Preferred Dividends
Shares of Common Stock Outstanding
Common Dividends
Shares of Common Stock Outstanding
=Dividends per Share of Common Stock
CHAPTER 17 Financial Statement Analysis
Ex. 17–22
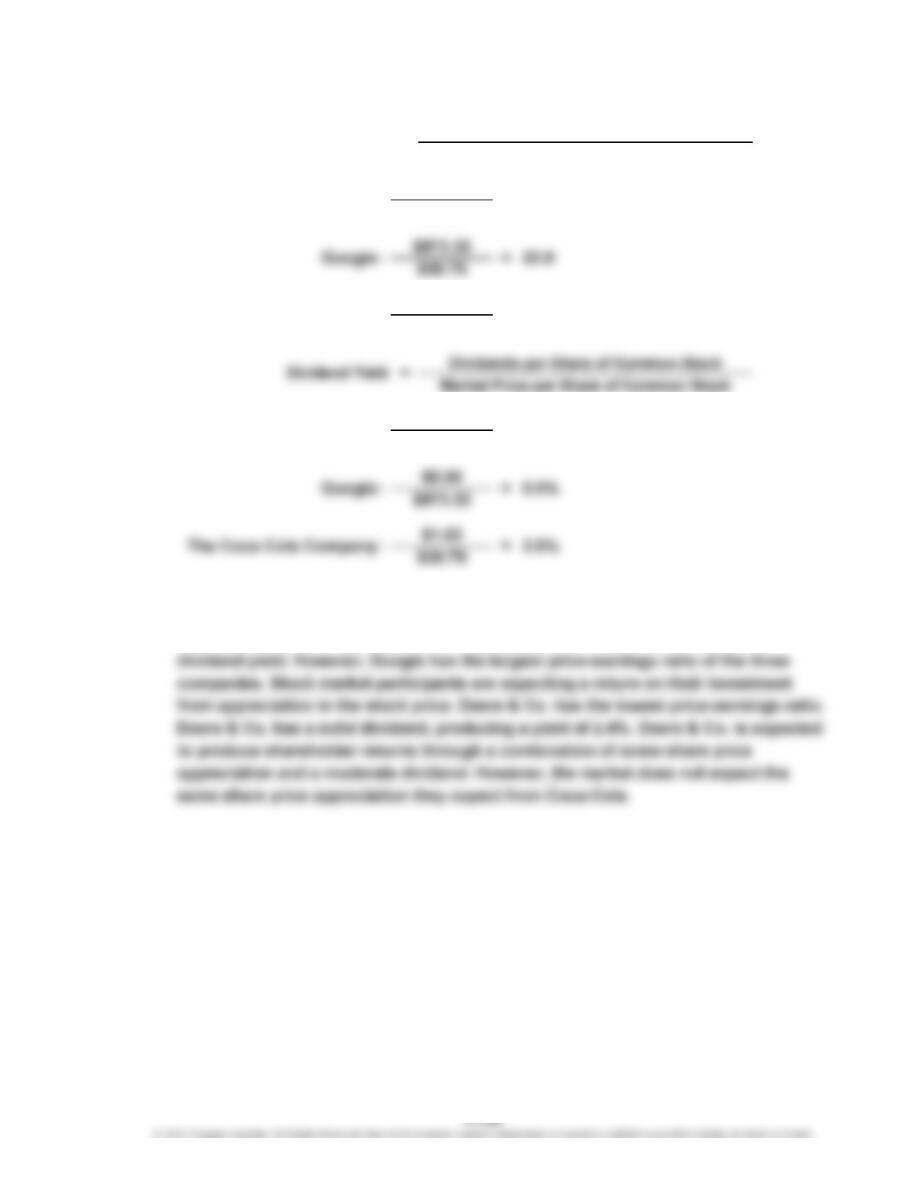
b. Coca-Cola has a large dividend yield and a high price-earnings ratio. Stock market
participants value Coca-Cola common stock on the basis of both its dividend and its
potential share price appreciation. Google pays no dividend and, thus, has no
$1.97
Deere & Co.: $2.04
$86.20 = 2.4%
=
$39.79
a. =Price-Earnings Ratio Earnings per Share
Market Price per Share of Common Stock
The Coca-Cola Company:
Deere & Co.: $86.20 =
$8.71 9.9
20.2
CHAPTER 17 Financial Statement Analysis
Ex. 17–23
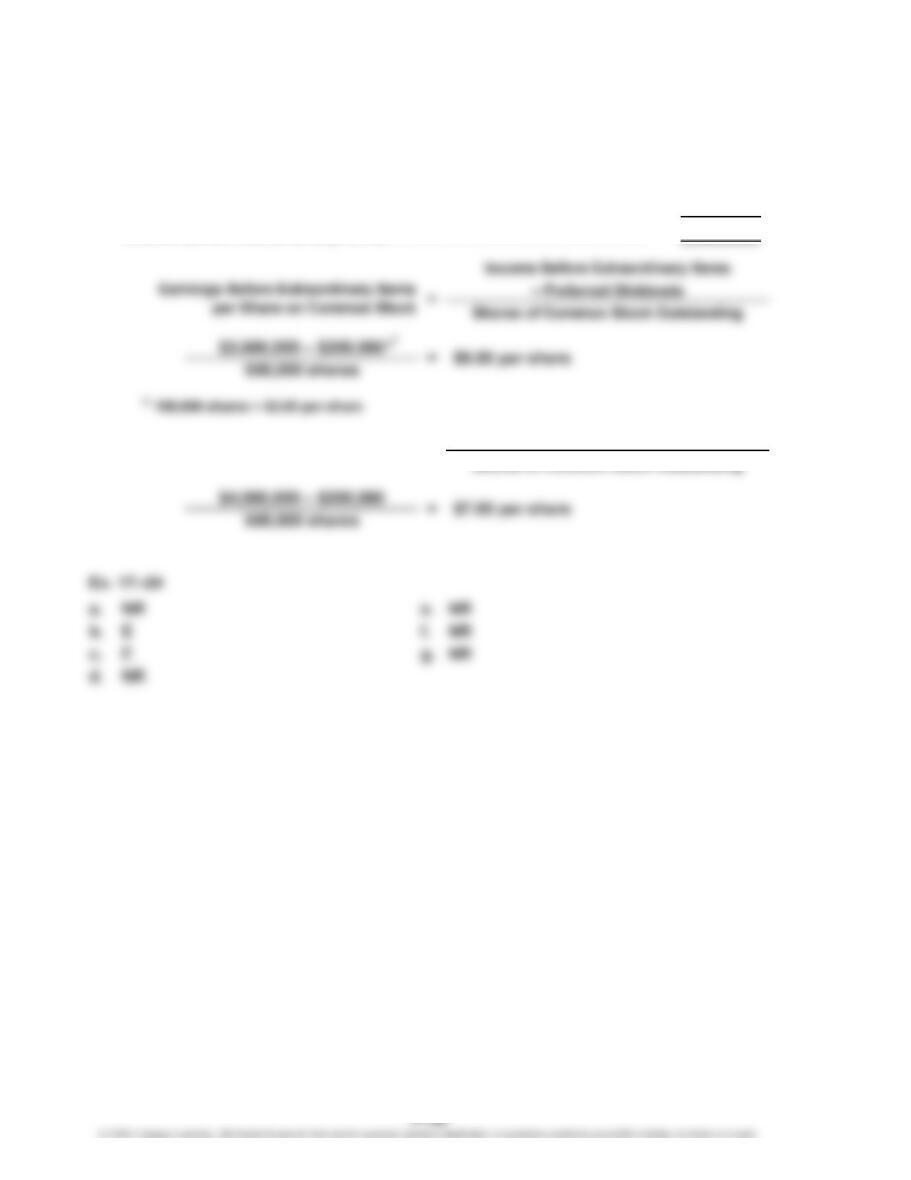
a. Earnings per share on income before extraordinary items:
Net income………………………………………………………………………
…
$4,000,000
Less gain on condemnation…………………………………………………
…
(800,000)
Plus loss from flood damage………………………………………………… 400,000
Income before extraordinary items…………………………………………
…
$3,600,000
=Net Income – Preferred Dividends
Shares of Common Stock Outstanding
b.
Earnings per Share on Common Stock
CHAPTER 17 Financial Statement Analysis
Ex. 17–25
a.
Income from continuing operations before income tax $1,000,000
Income tax expense* 400,000
b.
Earnings per common share:
Income from continuing operations $30.00
Ex. 17–26
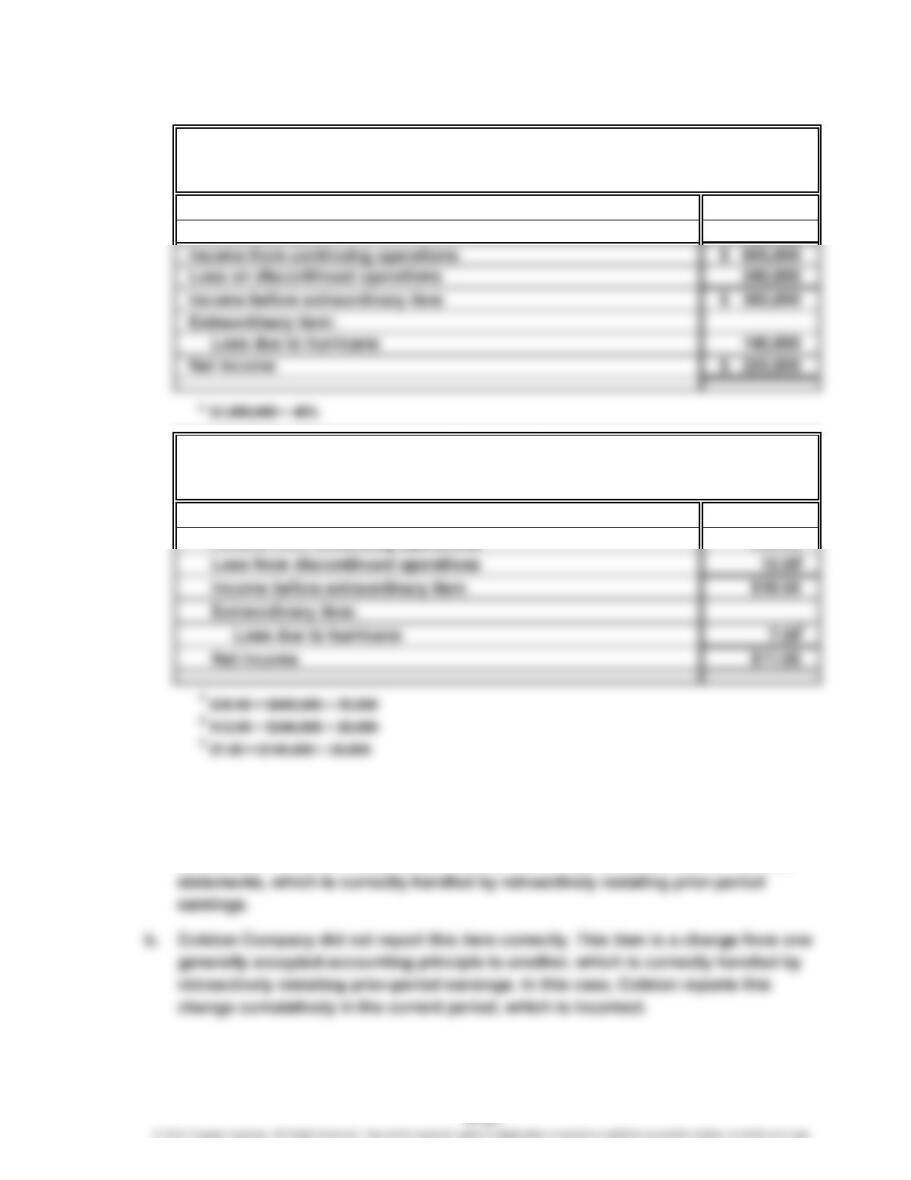
a. Colston Company reported this item correctly in the financial statements. This
item is an error in the recognition, measurement, or presentation in the financial
Partial Income Statement
For the Year Ended December 31, 20—
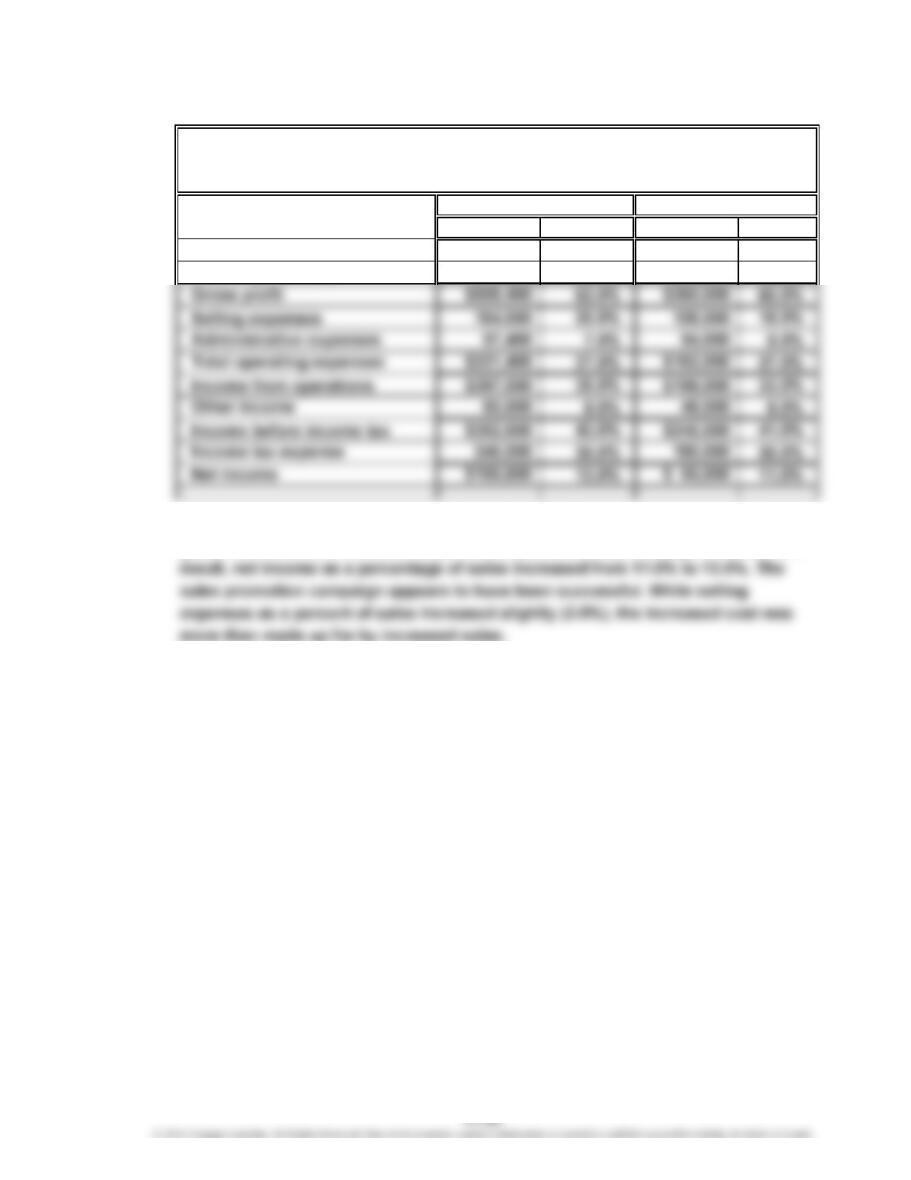
APEX, INC.
Partial Income Statement
For the Year Ended December 31, 20—
APEX, INC.
1
1.
2016 2015 Amount Percent
Sales $6,750,000 $6,000,000 $ 750,000 12.5%
Cost of goods sold 2,480,000 2,000,000 480,000 24.0%
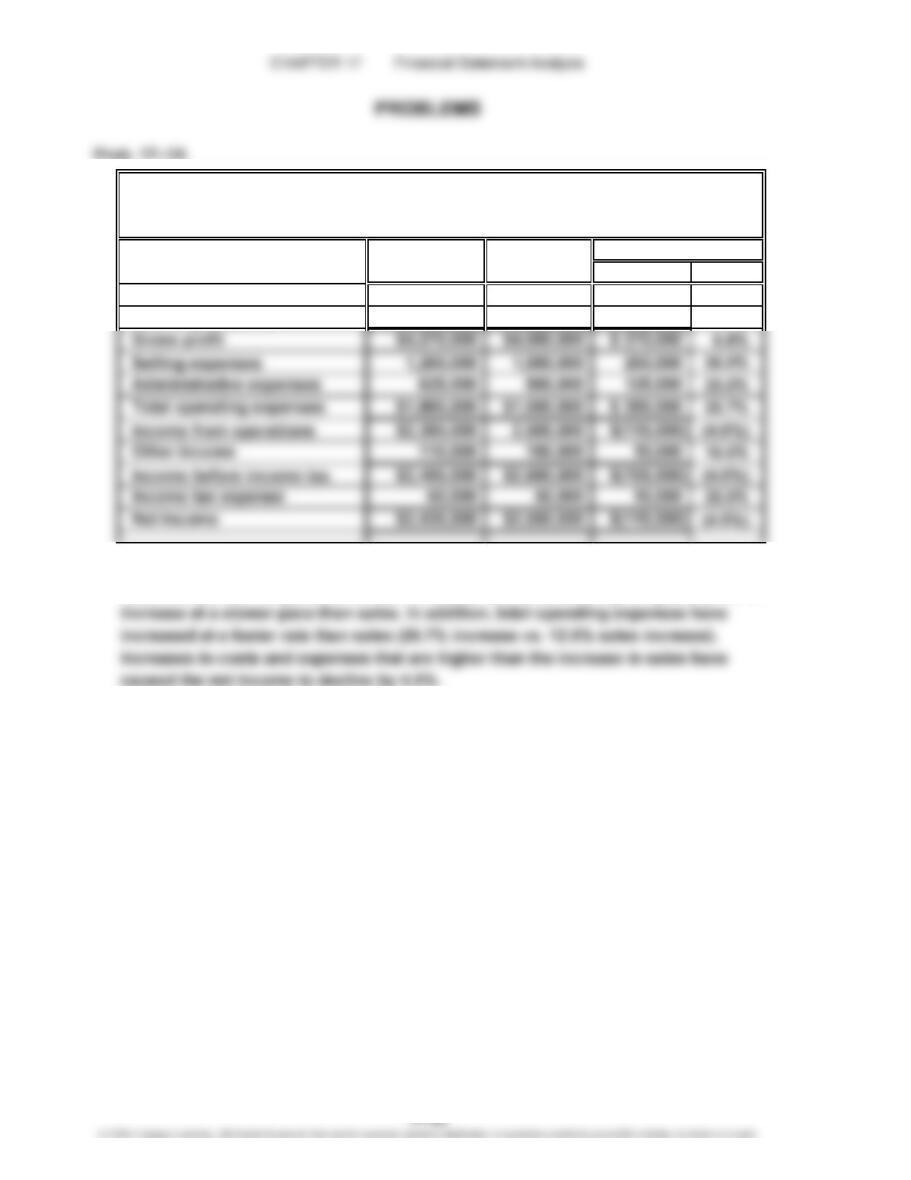
2. Net income has declined from 2015 to 2016. Sales have increased by 12.5%;
however, the cost of goods sold has increased by 24.0%, causing the gross profit to
Increase (Decrease)
CLAPTON COMPANY
Comparative Income Statement
For the Years Ended December 31, 2016 and 2015
CHAPTER 17 Financial Statement Analysis
Prob. 17–2A
1.
Amount Percent Amount Percent
Sales $820,000 100.0% $600,000 100.0%
Cost of goods sold 311,600 38.0% 240,000 40.0%
2. The vertical analysis indicates that the costs other than selling expenses (cost of
goods sold and administrative expenses) improved as a percentage of sales. As a
2016 2015
INDIGO COMPANY
Comparative Income Statement
For the Years Ended December 31, 2016 and 2015
CHAPTER 17 Financial Statement Analysis
Prob. 17–3A
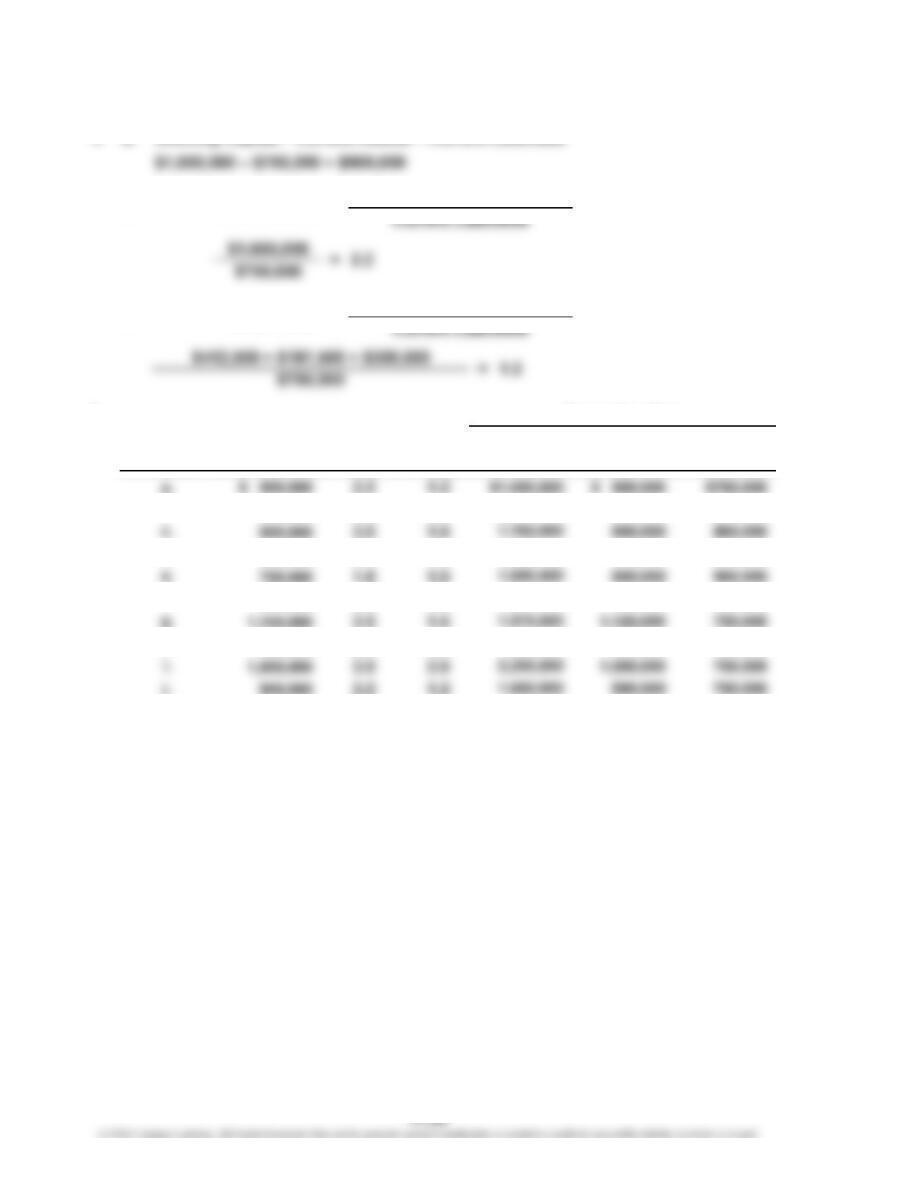
1. a. Working Capital = Current Assets – Current Liabilities
2.
Working Quick Current
Capital Assets Liabilities
900,000 775,000 625,000
900,000 800,000 650,000
900,000 900,000 750,000
900,000 900,000 750,000
b.
AssetsTransaction
Current
Ratio
c. =
Quick
Ratio
Current Ratio
Quick Ratio
=Current Assets
Quick Assets
Current
b. 2.4 1.2 1,525,000
d. 2.4 1.2 1,550,000
f. 2.2 1.2 1,650,000
h. 2.2 1.2 1,650,000
Supporting Data
CHAPTER 17 Financial Statement Analysis
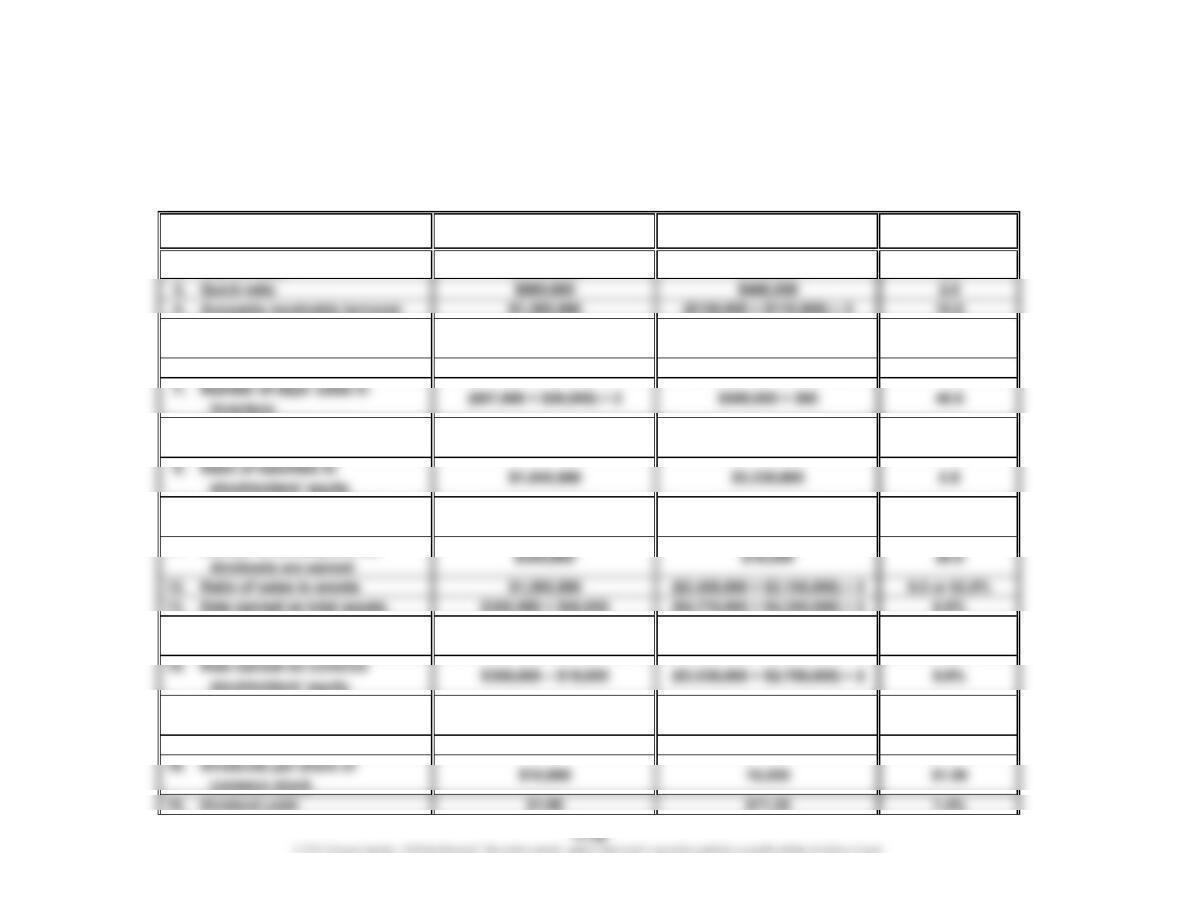
Prob. 17–4A
1. Working Capital: $1,100,000 – $440,000 = $660,000
Calculated
Numerator Denominator Value
2. Current ratio $1,100,000 $440,000 2.5
5. Number of days’ sales in
receivables
6. Inventory turnover $500,000 ($67,000 + $58,000) ÷ 2 8.0
8. Ratio of fixed assets to
long-term liabilities
10. Number of times interest
charges are earned
11. Number of times preferred
14. Rate earned on
stockholders’ equity
16. Earnings per share on
common stock
17. Price-earnings ratio 71.25 28.50 2.5
Ratio
$1,320,000 $1,100,000
36.5
1.2
($130,000 + $110,000) ÷ 2 $1,200,000 ÷ 365
6.8
$300,000
$380,000 + $66,000 $66,000
$28.50$300,000 – $15,000 10,000
9.7%
($3,230,000 + $2,955,000) ÷ 2
CHAPTER 17 Financial Statement Analysis
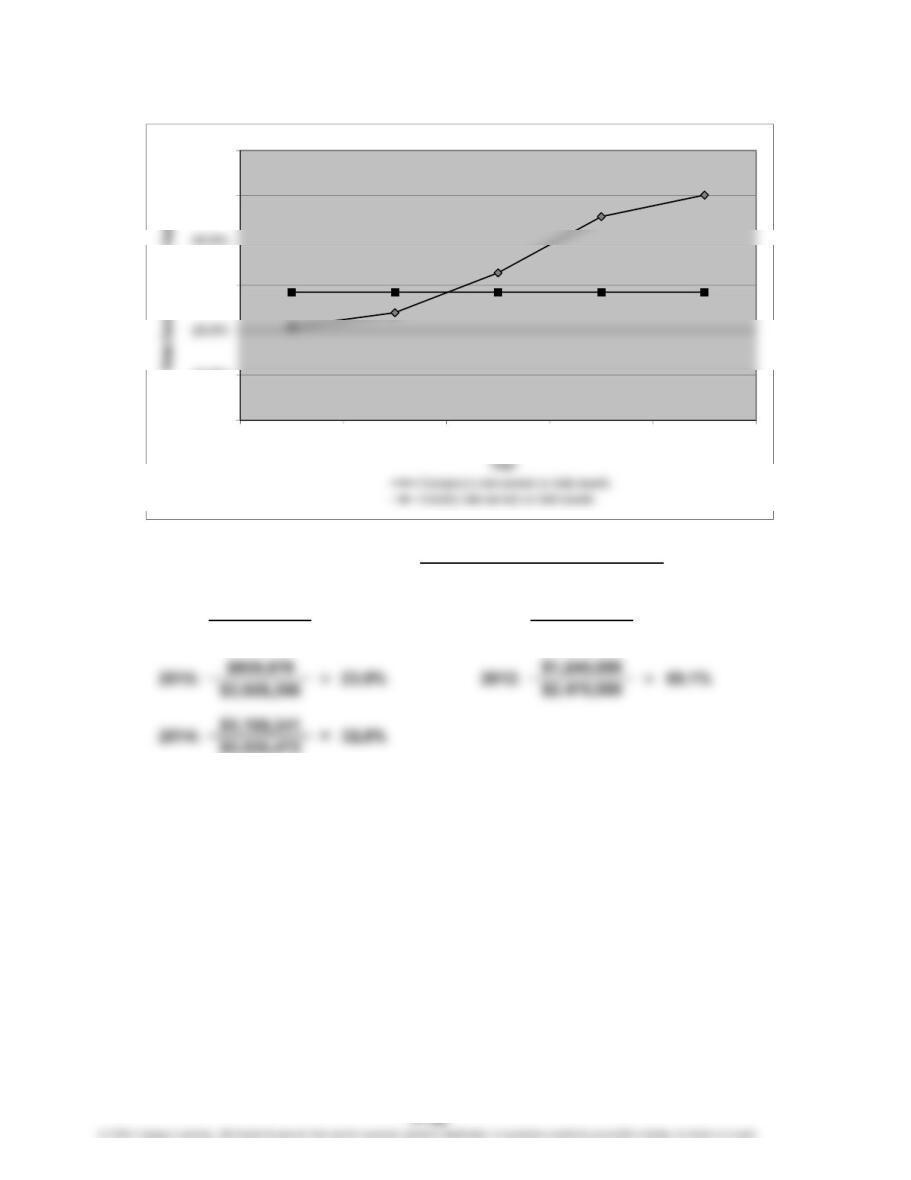
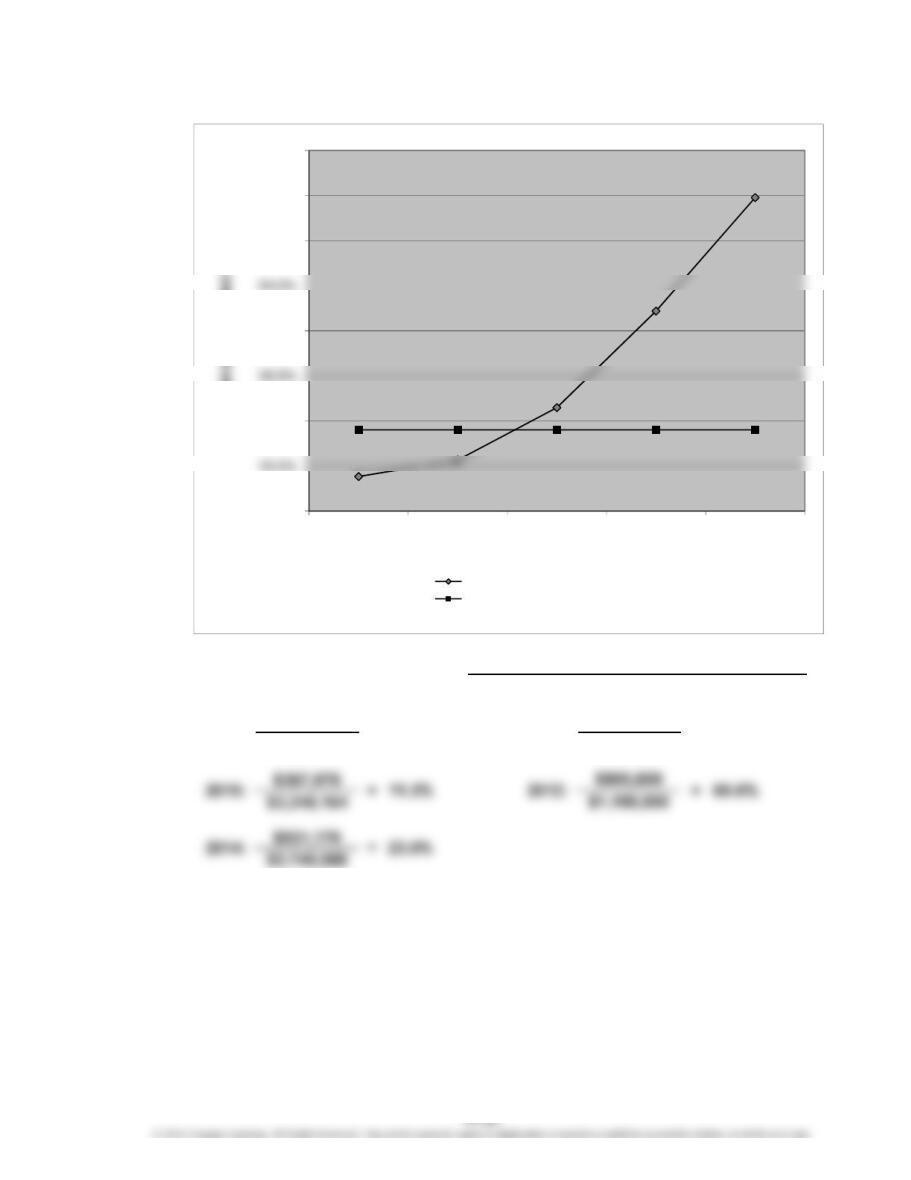
Prob. 17–5A
1. a.
$889,453
$4,270,764
2013: $1,379,000
45.3%
20.8%2016: =
Net Income + Interest Expense
=
Average Total Assets
Rate Earned on Total Assets =
$3,044,250
0.0%
10.0%
30.0%
50.0%
60.0%
2016 2015 2014 2013 2012
CHAPTER 17 Financial Statement Analysis
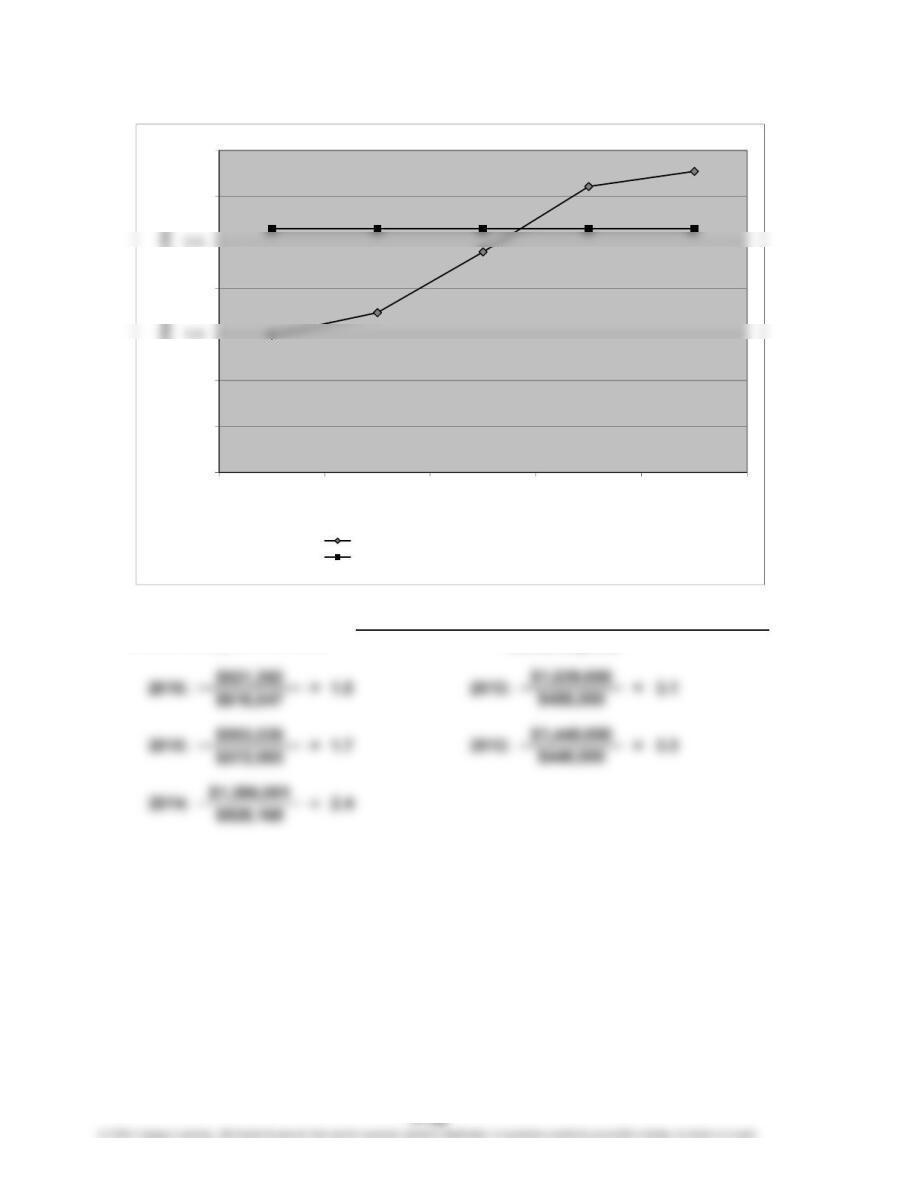
Prob. 17–5A (Continued)
1. b.
$273,406
$3,569,855
Rate Earned on
Stockholders’ Equity
7.7%
=
=
Average Total Stockholders’ Equity
Net Income
2013: $884,000
$1,992,000
2016:
=
44.4%
0.0%
20.0%
40.0%
60.0%
70.0%
80.0%
2016 2015 2014 2013 2012
Rate Earned on Stockholders’ Equity
Year
Company’s rate earned on stockholders’ equity
Industry rate earned on stockholders’ equity
CHAPTER 17 Financial Statement Analysis
Prob. 17–5A (Continued)
1. c.
Number of Times
Interest Charges Are Earned
Net Income + Income Tax Expense + Interest Expense
Interest Expense
=
0.0
0.5
1.0
2.0
3.0
3.5
2016 2015 2014 2013 2012
Number of Times Interest Charges Are Earned
Year
Company’s number of times interest charges are earned
Industry number of times interest charges are earned
CHAPTER 17 Financial Statement Analysis
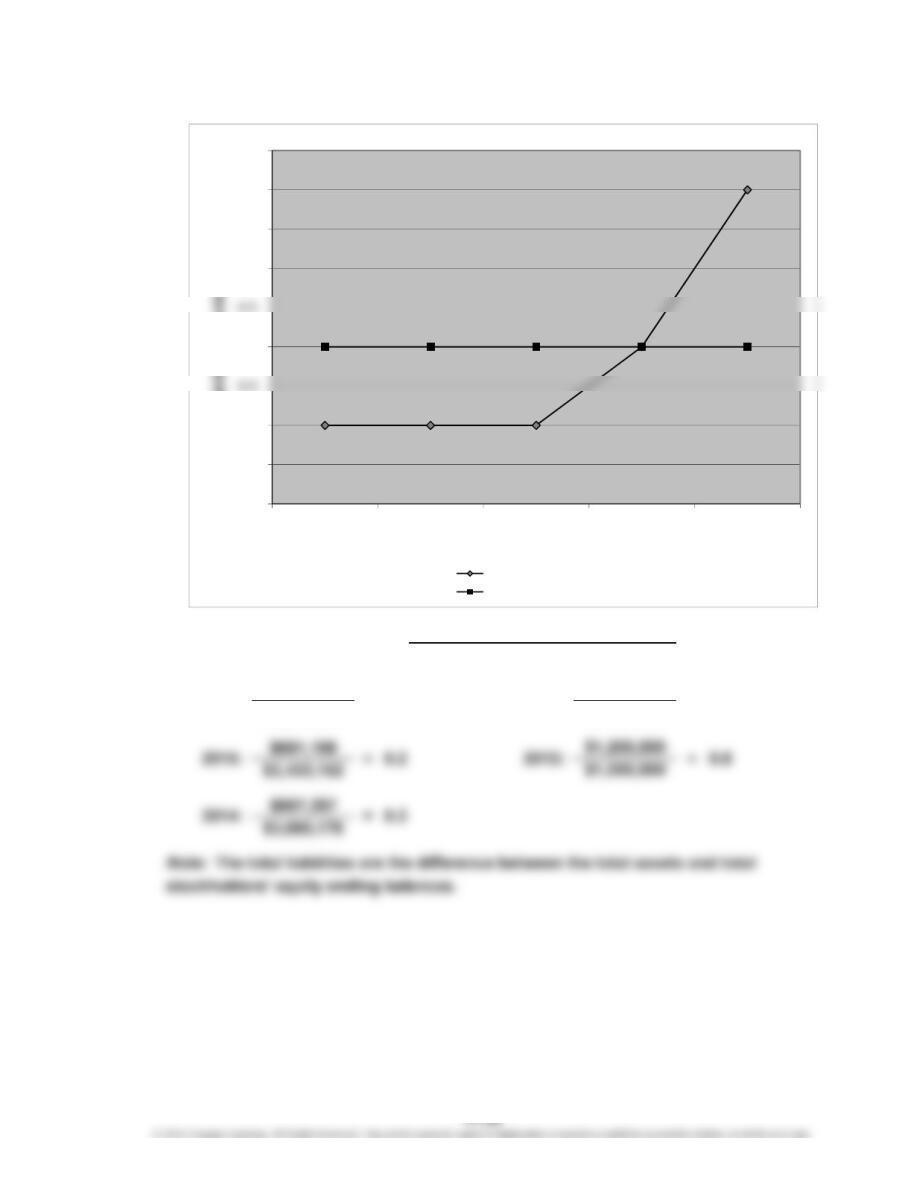
Prob. 17–5A (Continued)
1. d.
$710,621
$3,706,557
0.22016:
2013:
Ratio of Liabilities to
Stockholders’ Equity =
=
0.4
Total Liabilities
Total Stockholders’ Equity
$904,500
$2,434,000
=
0.0
0.1
0.2
0.4
0.6
0.7
0.8
0.9
2016 2015 2014 2013 2012
Ratio of Liabilities to Stockholders’ Equity
Year
Company’s liabilities to equity
Industry liabilities to equity
CHAPTER 17 Financial Statement Analysis
Prob. 17–5A (Concluded)
2. Both the rate earned on total assets and the rate earned on stockholders’ equity
have been moving in a negative direction in the last five years. Both measures have
moved below the industry average over the last two years. The cause of this decline