
Chapter 17
Additional Topics in Variance Analysis
Learning Objectives
1. Explain how to prorate variances to inventories and cost of goods sold.
2. Compute material variances when the amount used is not equal to the amount purchased.
3. Use market share variances to evaluate marketing performance.
4. Use sales mix and quantity variances to evaluate marketing performance.
5. Evaluate production performance using production mix and yield variances.
6. Apply the variance analysis model to nonmanufacturing costs.
7. Determine which variances to investigate.
Chapter Overview
I. PROFIT VARIANCE ANALYSIS WHEN UNITS PRODUCED DO NOT EQUAL
UNITS SOLD
• Reconciling Variable Costing Budgets and Full Absorption Income Statements
II. MATERIALS PURCHASES DO NOT EQUAL MATERIALS USED
III. MARKET SHARE VARIANCE AND INDUSTRY VOLUME VARIANCE
V. PRODUCTION MIX AND YIELD VARIANCES
• Mix and Yield Variances in Manufacturing
VI. VARIANCE ANALYSIS IN NONMANUFACTURING SETTINGS
VII. KEEPING AN EYE ON VARIANCES AND STANDARDS
• How Many Variances to Calculate
• When to Investigate Variances
• Updating Standards
Chapter Outline
LO 17-1 Explain how to prorate variances to inventories and cost of goods
sold.
PROFIT VARIANCE ANALYSIS WHEN UNITS PRODUCED DO NOT EQUAL UNITS
SOLD
• The analysis of variances becomes more complicated when the units sold do not equal the
units produced (i.e., when inventory is present).
o The actual variable production costs are really a hybrid.
Actual Variable
Production Costs
=
Flexible Budget Variable
Production Costs
+ (or -)
Variable Production
Cost Variances
See Demonstration Problem 1
o The entire variable production cost variance for units produced can be treated as a period
cost and expensed in the period incurred or it can be prorated between units sold and
units still in inventory:
▪ If the entire variable production cost variance for units produced is treated as a period
cost and expensed in the period incurred, the entry is:
▪ If the entire variable production cost variance for units produced are prorated between
units sold and units still in inventory, the entry is:
a Favorable variances should be debited in this entry; unfavorable variances should be
credited in this entry. The variances are credited here for illustration only.
o Using variable costing, the entire fixed production cost is expensed when incurred.
• Reconciling Variable Costing Budgets and Full Absorption Income Statements
o Exhibit 17.2 reconciles the reported income statement under full absorption with that
under variable costing.
See Demonstration Problem 2
LO 17-2 Compute material variances when the amount used is not equal to
the amount purchased.
MATERIALS PURCHASES DO NOT EQUAL MATERIALS USED
• So far, we have assumed that the amount of materials used equals the amount of materials
purchased. Now we show how to calculate variances when the quantities purchased and used
are not the same.
Purchase price variance =
(Actual price – Standard price) × Actual quantity purchased
o The materials efficiency variance remains the same because it is based on materials used.
o One advantage of using a standard costing system is that managers receive information
that is useful in making decisions to improve performance.
▪ The sooner the information is received (such as information about the purchase price
variance shortly after the acquisition of materials), the sooner it can be used for
decision making purposes.
▪ If materials are stored, recording the purchase at standard cost provides information
on price variances earlier than if the firm waits until the materials are used.
See Demonstration Problem 3
o The purchase of materials is recorded with the following entry:
o The use of materials is recorded with the following entry:
LO 17-3 Use market share variances to evaluate marketing performance.
MARKET SHARE VARIANCE AND INDUSTRY VOLUME VARIANCE
• Many companies base an initial sales forecast on an estimate of sales activity in the industry
as a whole and on an estimate of the company’s market share.
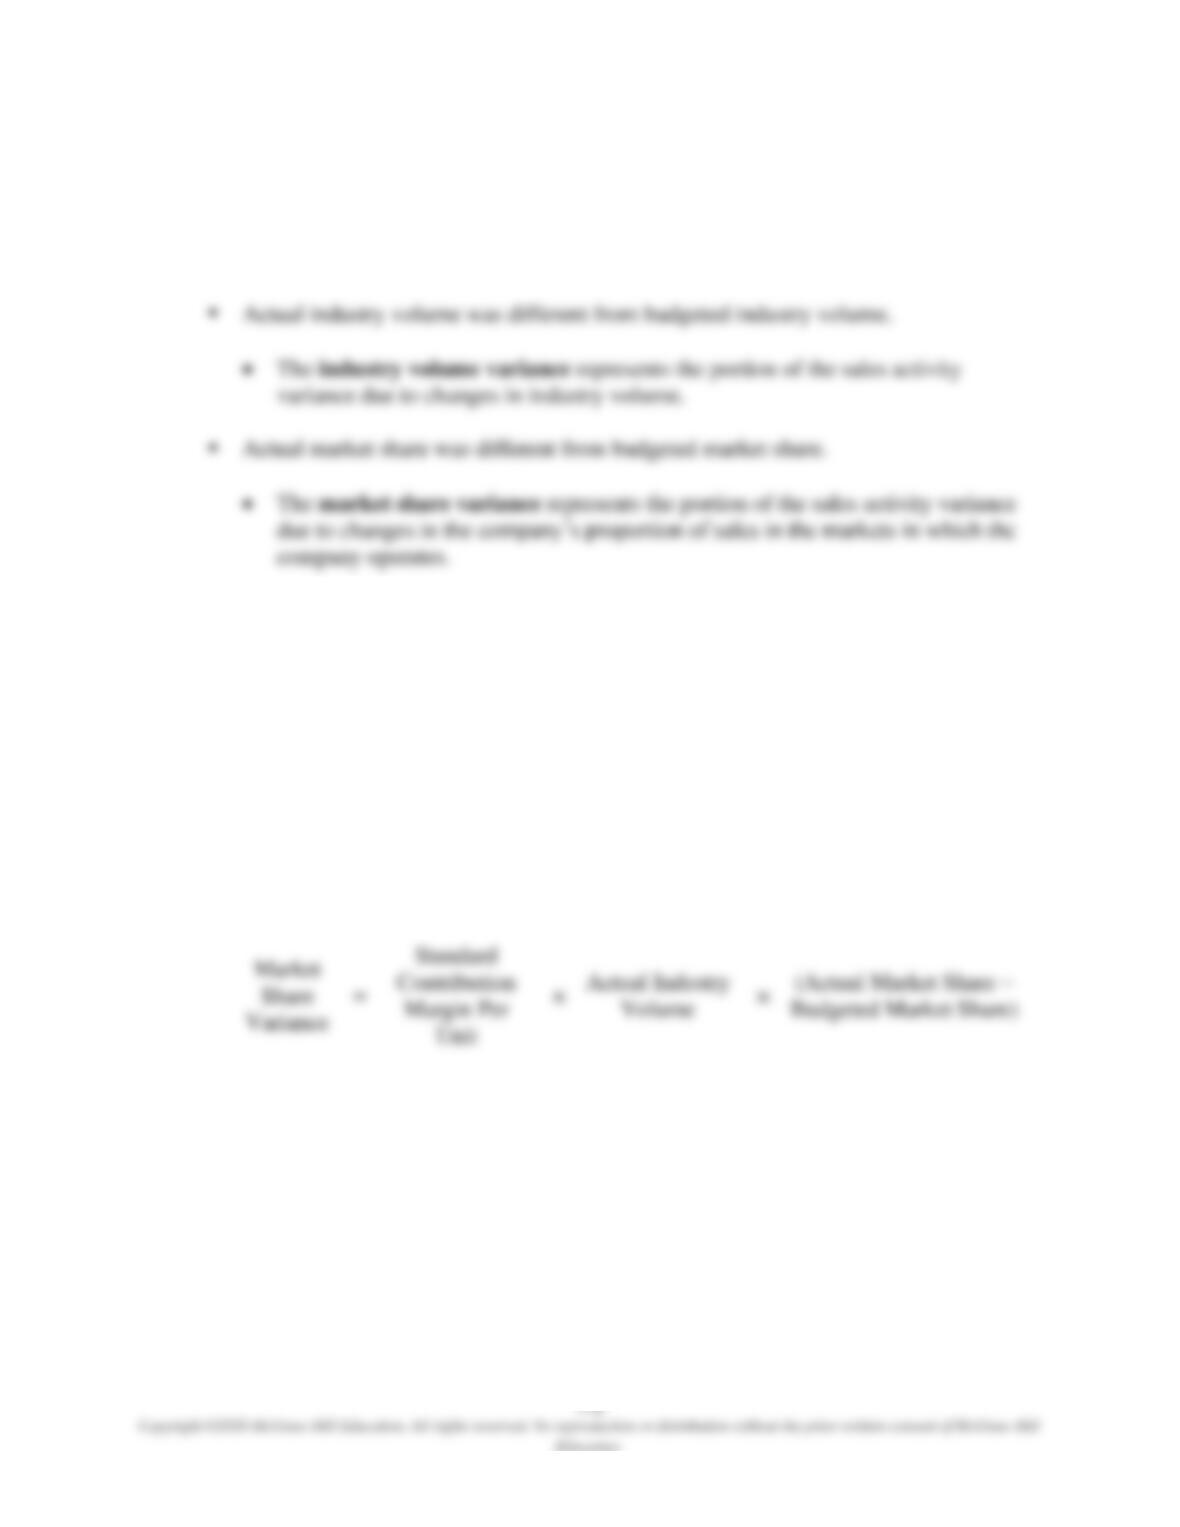
o There are two reasons why actual sales activity is different from budgeted sales activity:
o By decomposing sales activity variance into an industry volume and a market share
variance, management has additional information that can be used to make operational
improvements next period.
▪ Multiplying each figure (one from the industry effect, the other from the market share
effect) by the standard contribution margin gives the impact of these variances on
operating profit.
Industry
Volume
Variance
=
Standard
Contribution
Margin Per
Unit
×
(Actual Industry Volume –
Budgeted Industry Volume)
×
Budgeted
Market Share
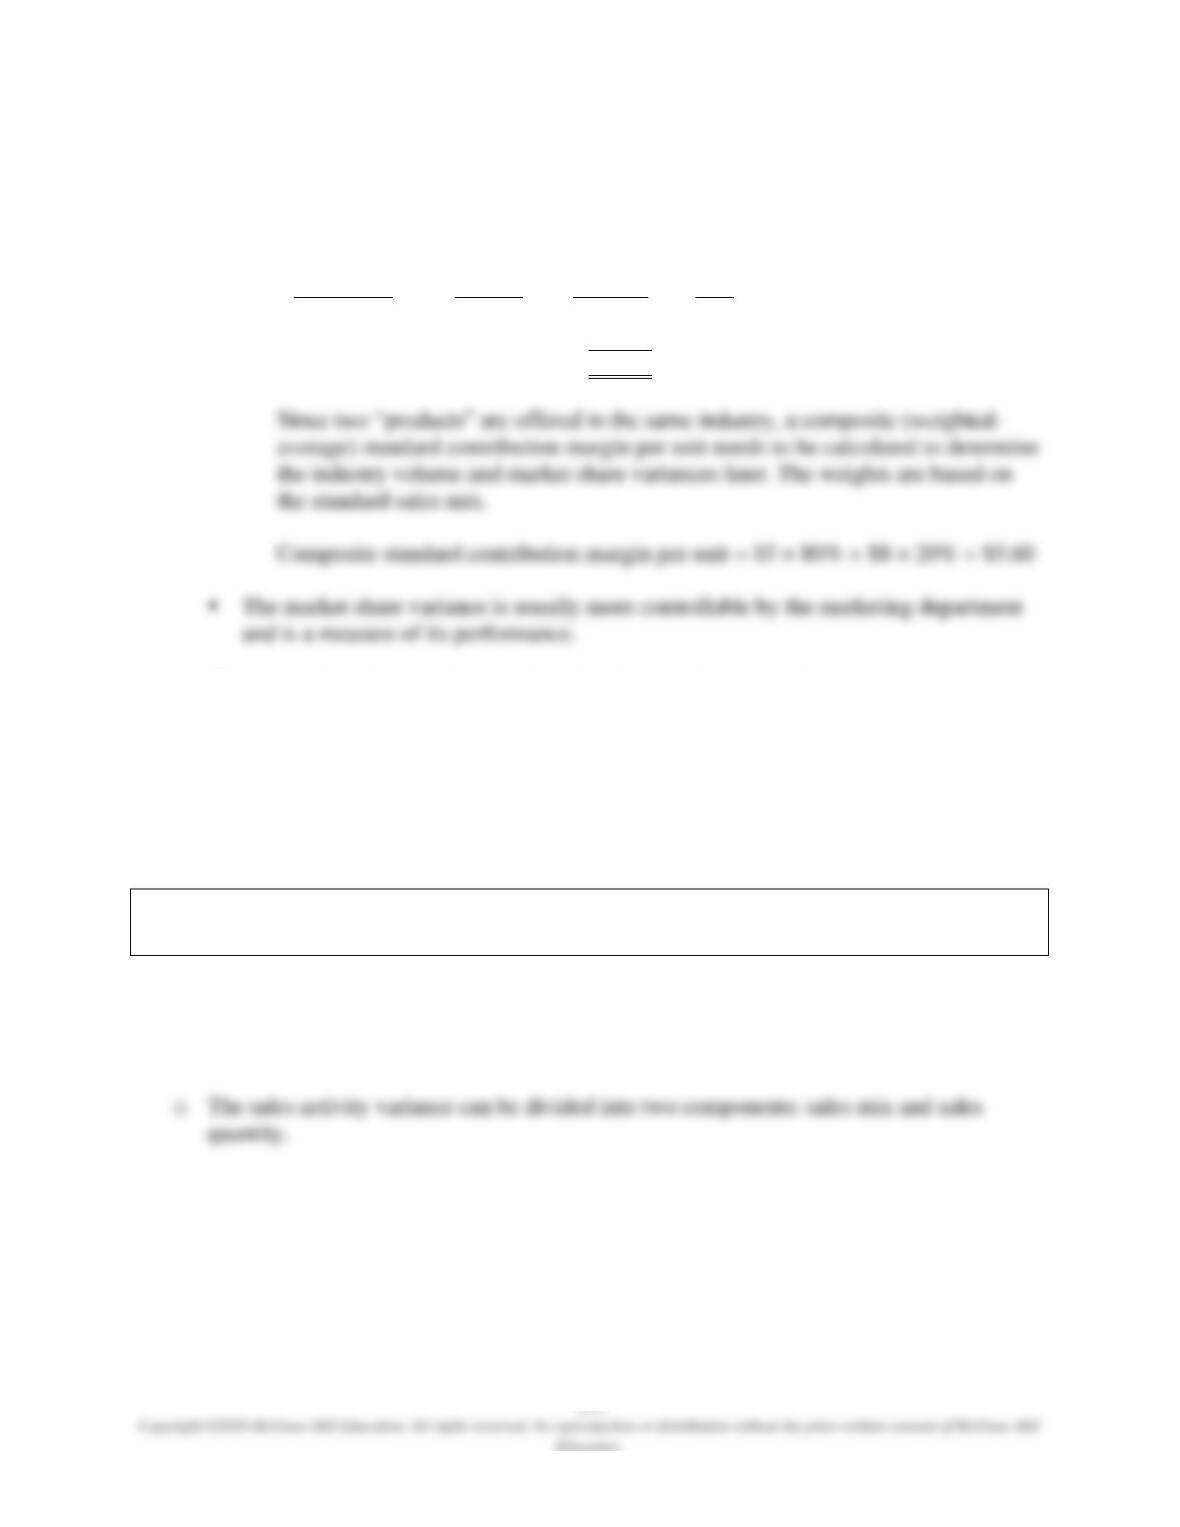
Variance
=
Standard
Contribution
Unit
×
Actual Industry
×
• Example: Pioneer Uniform, Inc. serves two groups of the customers in the market,
Retail and Commercial. The following budget information is available for June.
Customers
Unit
Contribution
Margin
Sales
Volume
Sales
Mix
Commercial
$5
40,000
80%
Retail
8
10,000
20%
50,000
o The use of the industry volume and market share variances enables management to
separate that portion of the activity variance that coincides with changes in the overall
industry from that which is specific to the company.
▪ Exhibit 17.4 illustrates the relation between these two market-related variances.
See Demonstration Problem 4
LO 17-4 Use sales mix and quantity variances to evaluate marketing
performance.
SALES ACTIVITY VARIANCES WITH MULTIPLE PRODUCTS
• Evaluating Product Mix
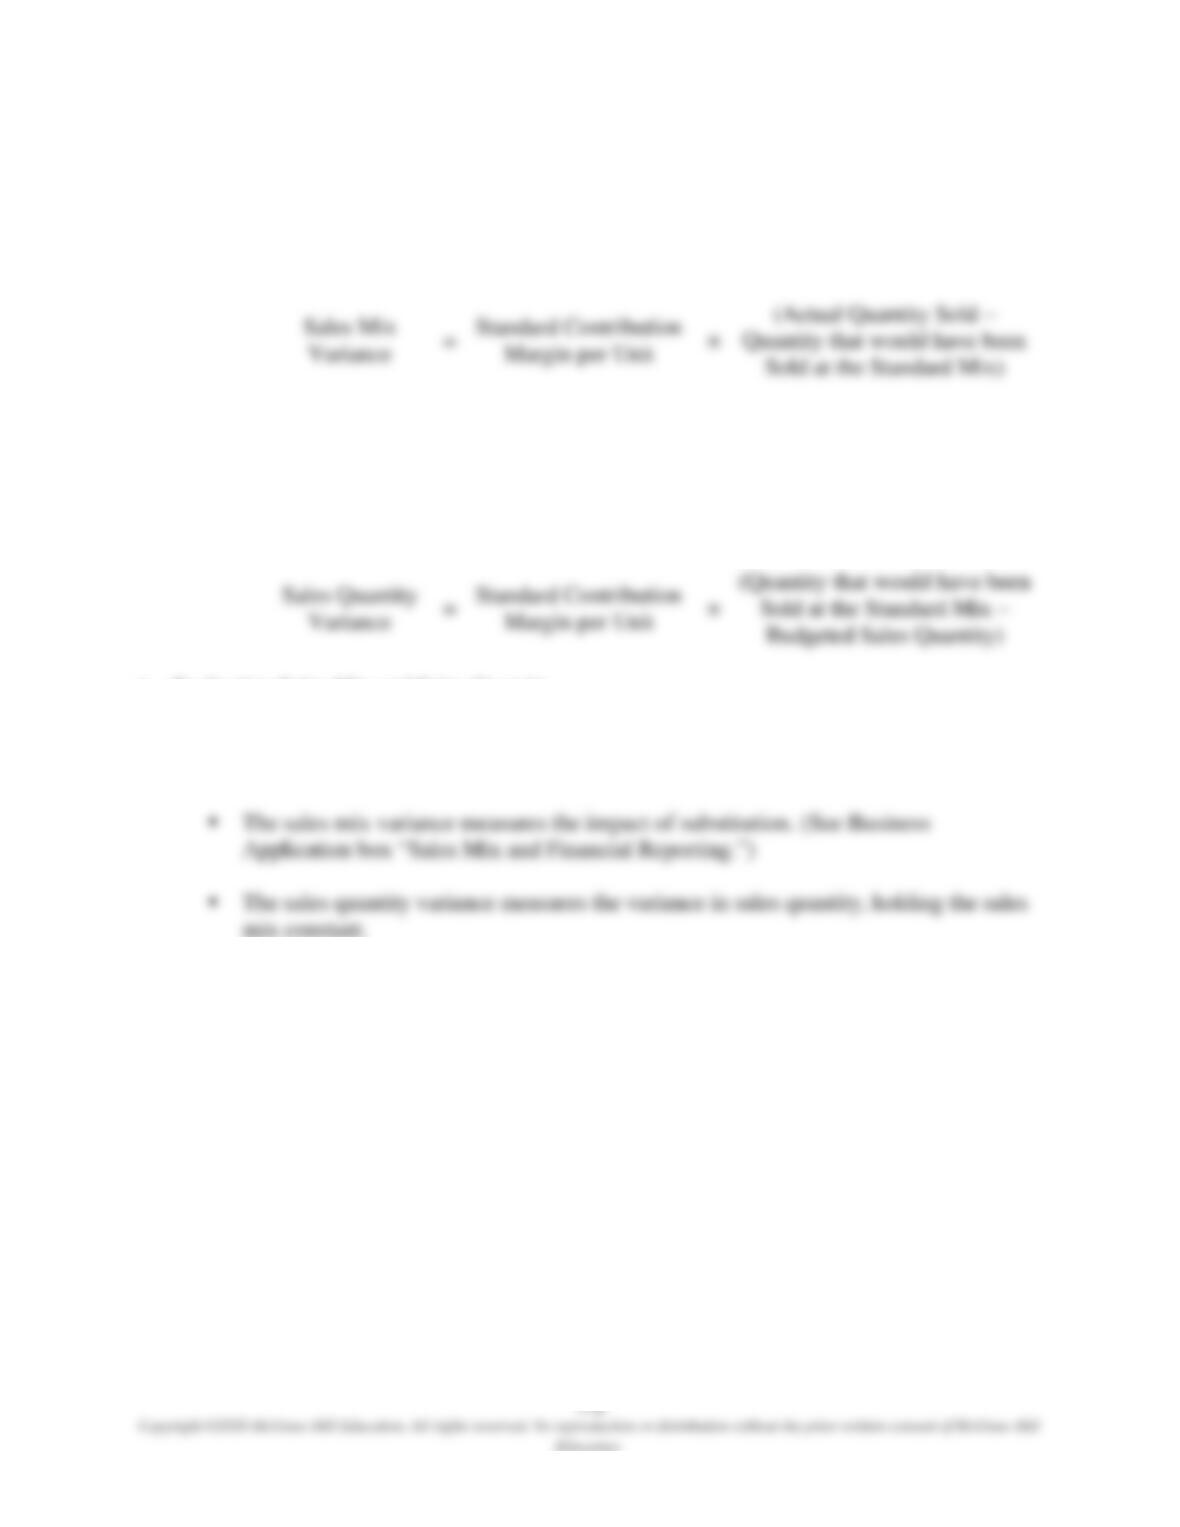
▪ The sales mix variance measures the impact of substitution (it appears that the
industrial model has been substituted for the standard model).
• A sales mix variance arises from the relative proportion of different products
sold.
▪ The sales quantity variance measures the variance in sales quantity, holding the sales
mix constant.
• A sales quantity variance is the variance occurring in multiproduct companies
from the change in volume of sales, independent of any change in mix.
• Evaluating Sales Mix and Sales Quantity
o A sales mix variance provides useful information for a company that sells multiple
products when these products are (imperfect) substitutes for each other.
o Source of the Sales Mix Variance
▪ Although the variances can be calculated for each product sold to show the exact
source, the total variance is most frequently used for analysis.
• See Exhibit 17.5 for an example.
See Demonstration Problem 5
LO 17-5 Evaluate production performance using production mix and yield
variances.
PRODUCTION MIX AND YIELD VARIANCES
• Mix and Yield Variances in Manufacturing
o The analysis of mix and quantity variances for sales can be applied to production as well.
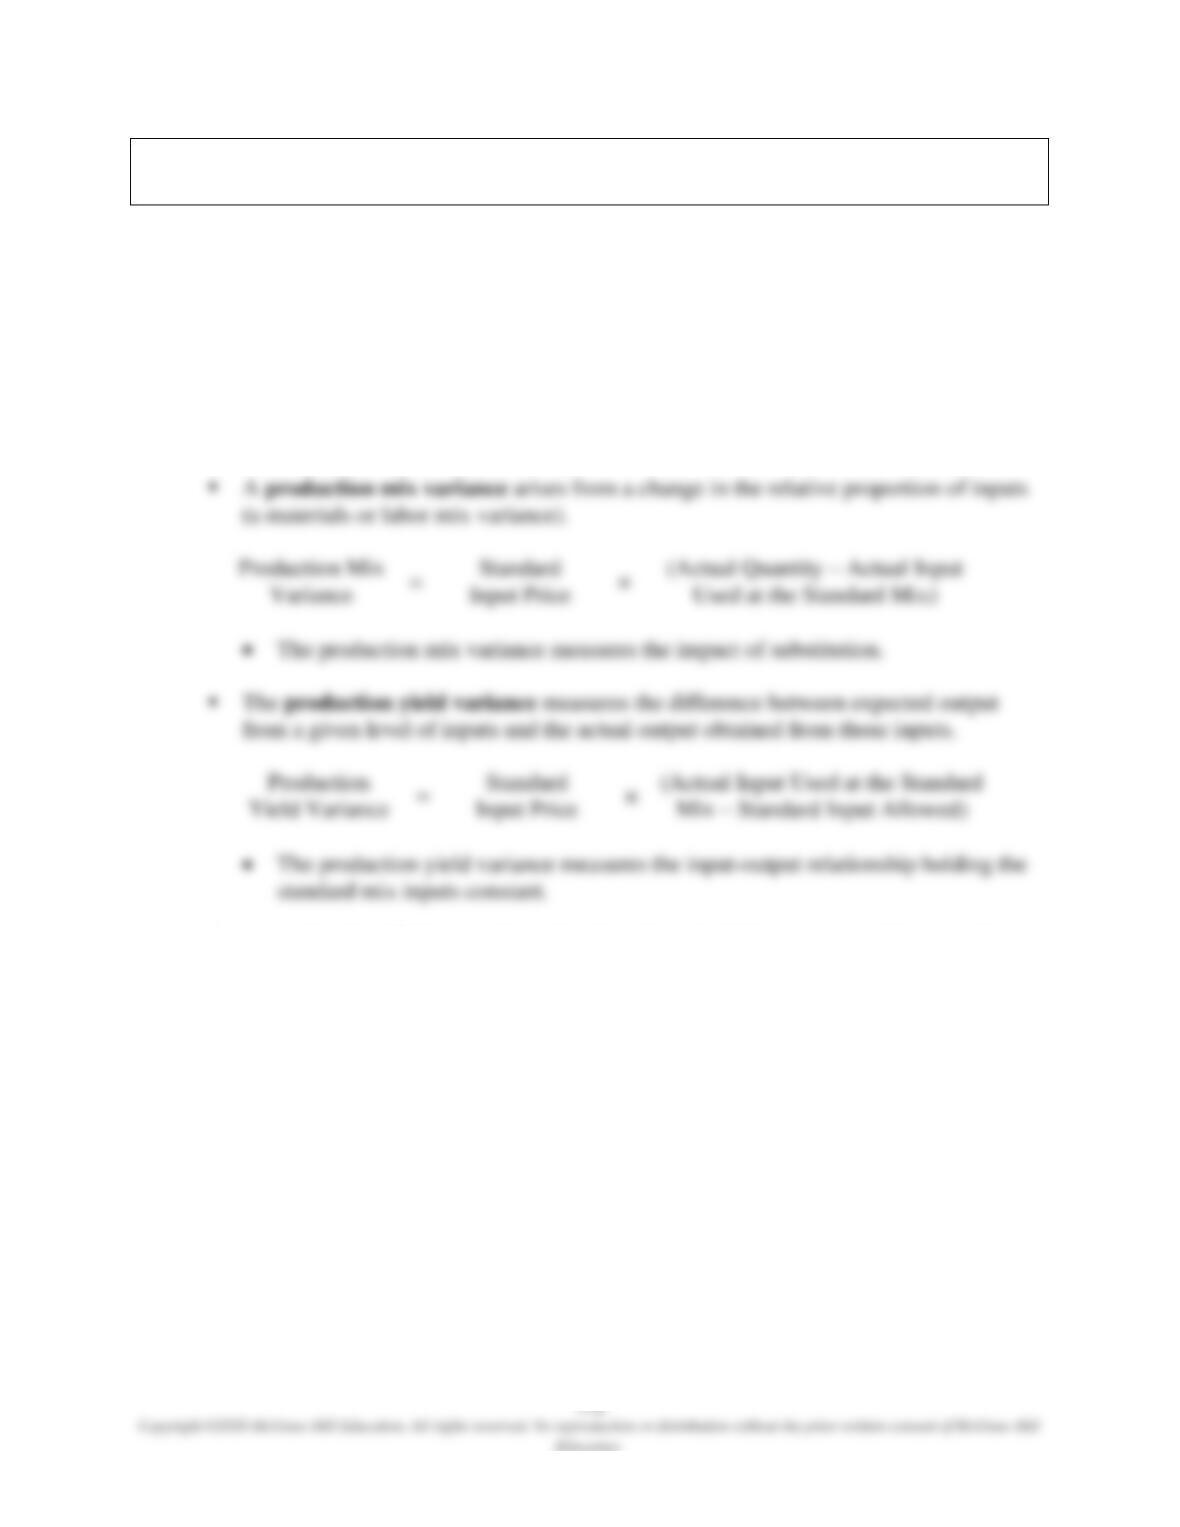
o The direct materials efficiency variance can be divided into two components: mix and
yield.
o By separating the efficiency variance into its mix and yield components, the pure mix
effect is isolated by holding constant the yield effect, and the pure yield effect is isolated
by holding constant the mix effect.
▪ See Exhibit 17.6 for an example.
See Demonstration Problem 6
LO 17-6 Apply the variance analysis model to nonmanufacturing costs.
VARIANCE ANALYSIS IN NONMANUFACTURING SETTINGS
• Using the Profit Variance Analysis in Service and Merchandise Organizations
o The comparison of the master budget, the flexible budget, and actual results can also be
used in service and merchandising organizations.
• Efficiency Measures
o The computation of efficiency variance requires a reliable measure of output activity that
is linked to input.
▪ In general, jobs with routine tasks lend themselves to efficiency measures, and jobs
with nonroutine tasks do not.
• Mix and Yield Variances in Service Organizations
o By substituting different types of labor, service organizations need to calculate labor mix
and yield variances.
See Demonstration Problem 7
LO 17-7 Determine which variances to investigate.
KEEPING AN EYE ON VARIANCES AND STANDARDS
• How Many Variances to Calculate
o Managers and accountants in each organization should perform their own cost-benefit
analysis to ascertain which calculations of variances are justified.
▪ The variances that will be important for a particular company depend on the strategic
imperatives for the company.
o In deciding how many variances to calculate, it is important to note the impact and
controllability of each variance.
• When to Investigate Variances
o After computing variances, managers and accountants must decide which ones to
investigate.
o Some problems are easily corrected as soon as they are discovered. The investigation cost
is low and the benefits are very likely to exceed the costs.
• Updating Standards
o Standards are estimates that require updating to reflect current conditions.
o Variances may occur because conditions change during the year but the standards do not.
▪ A planned variance is a variance that is expected to occur if certain conditions affect
operations.
Matching
A.
Controllability
F.
Planned variance
B.
Impact
G.
Production mix variance
C.
Industry volume variance
H.
Production yield variance
D.
Management by exception
Purchase price variance
Market share variance
Sales mix variance
K.
Sales quantity variance
_____ 1. The portion of the sales activity variance attributable to changes in industry volume.
_____ 2. An approach to management requiring that reports emphasize the deviation from an
accepted base point.
_____ 3. A variance that is expected to occur if certain conditions affect operations.
_____ 4. The likely monetary effect from an activity.
_____ 5. The extent to which an item can be managed.
Matching Answers
1. C
3. F
5. A
7. I
9. G
11. E
Multiple Choice
1. Which of the following statements is not correct?
2. What is the industry volume variance for the month of August?
a. $24,000 F
b. $12,000 F
c. $24,000 U
d. $28,000 U
3. What is the market share variance for the month of August?
a. $24,000 U
b. $12,000 U
c. $18,000 F
d. $12,000 F
4. Which of the following statements is not correct?
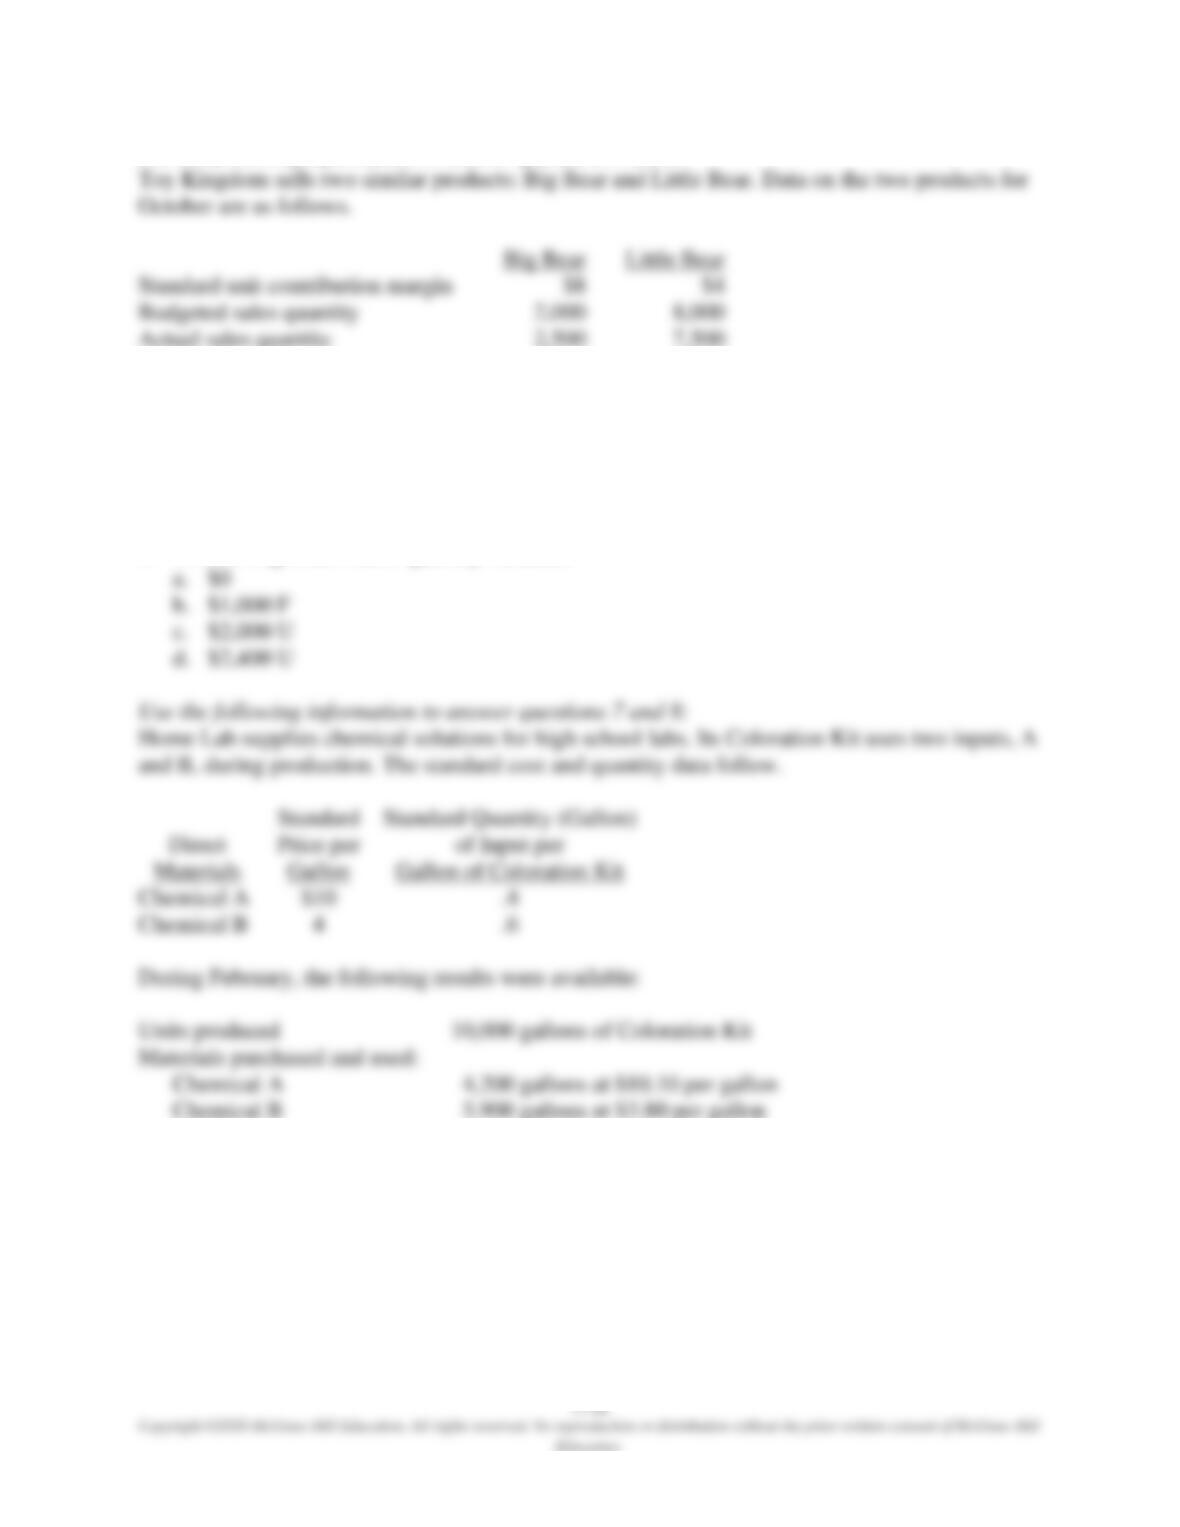
Use the following information to answer questions 5 and 6:
5. What is Little Bear’s sales mix variance?
a. $0
b. $1,000 F
c. $2,000 U
d. $2,400 U
6. What is Big Bear’s sales quantity variance?
7. What is the production mix variance for Chemical A?
a. $240 U
b. $1,600 U
c. $1,180 F
d. $420 U