
1. Horizontal analysis is the analysis of increases and decreases in financial statement items. The
change in the amount and the percentage increase (decrease) in the item is presented. The amount
and percent increase or decrease in the cash balances between the end of the current year and the
end of the previous year is an example. Vertical analysis is the percentage analysis showing the
relationship of the component parts to the total in a single statement. The percent of cash as a
p
ortion of total assets at the end of the current year is an example.
2. Comparative statements provide information as to changes between dates or periods. Trends
indicated by comparisons may be far more significant than the data for a single date or
p
eriod.
3. Before this question can be answered, the increase in net income should be compared with
changes in sales, expenses, and assets devoted to the business for the current year. The return
on assets for both periods should also be compared. If these comparisons indicate favorable
trends, the operating performance has improved; if not, the apparent favorable increase in net
income may be offset by unfavorable trends in other areas.
4. Generally, the two ratios would be very close because most service businesses sell services
and hold very little inventory.
5. a. A high inventory turnover minimizes the amount invested in inventories, thus freeing
funds for more advantageous use. Storage costs, administrative expenses, and losses
caused by obsolescence and adverse changes in prices are also kept to a minimum.
b. Yes. The inventory turnover relates to the “turnover” of inventory during the year, while
the number of days’ sales in inventory relates to the amount of inventory on hand at the
b
eginning and end of the year. Therefore, a business could have a high inventory turnover
during the year, yet have a high number of days’ sales in inventory based on the
b
eginning and end-of-year inventory amounts.
6. The ratio of fixed assets to long-term liabilities increased from 3.4 for the preceding year to
4.2 for the current year, indicating that the company is in a stronger position now than in the
p
receding year to borrow additional funds on a long-term basis.
7. a. The rate earned on total assets adds interest expense to the net income, which is divided
b
y average total assets. It measures the profitability of the total assets, without regard for how
the assets are financed. The rate earned on stockholders’ equity divides net income by the
average total stockholders’ equity. It measures the profitability of the stockholders’
investment.
b. The rate earned on stockholders’ equity is normally higher than the rate earned on total
assets. This is because of leverage, which compensates stockholders for the higher risk of
their investments.
CHAPTER 17
FINANCIAL STATEMENT ANALYSIS
DISCUSSION QUESTIONS
17-1

CHAPTER 17 Financial Statement Analysis
DISCUSSION QUESTIONS (Concluded)
8. The price-earnings ratio measures the market’s expectations of a company’s future earnings
p
rospects. Kroger’s low price-earnings ratio compared to the industry average suggests that
the market has low expectations about the company’s future earnings.
9. The dividend yield measures the rate of return common stockholders receive from a cash dividend.
The high dividend yield for Suburban Propane indicates that a significant portion of the return to
their shareholders comes in the form of a cash dividend. The lack of a dividend yield for Google
indicates that the return to shareholders comes solely from stock appreciation.
10. One report is the Report on Internal Control, which verifies management’s conclusions on
internal control. Another report is the Report on Fairness of the Financial Statements of
Independent Registered Public Accounting Firm, where the Certified Public Accounting
(CPA) firm that conducts the audit renders an opinion on the fairness of the statements.
17-2
CHAPTER 17 Financial Statement Analysis
PE 17–1A
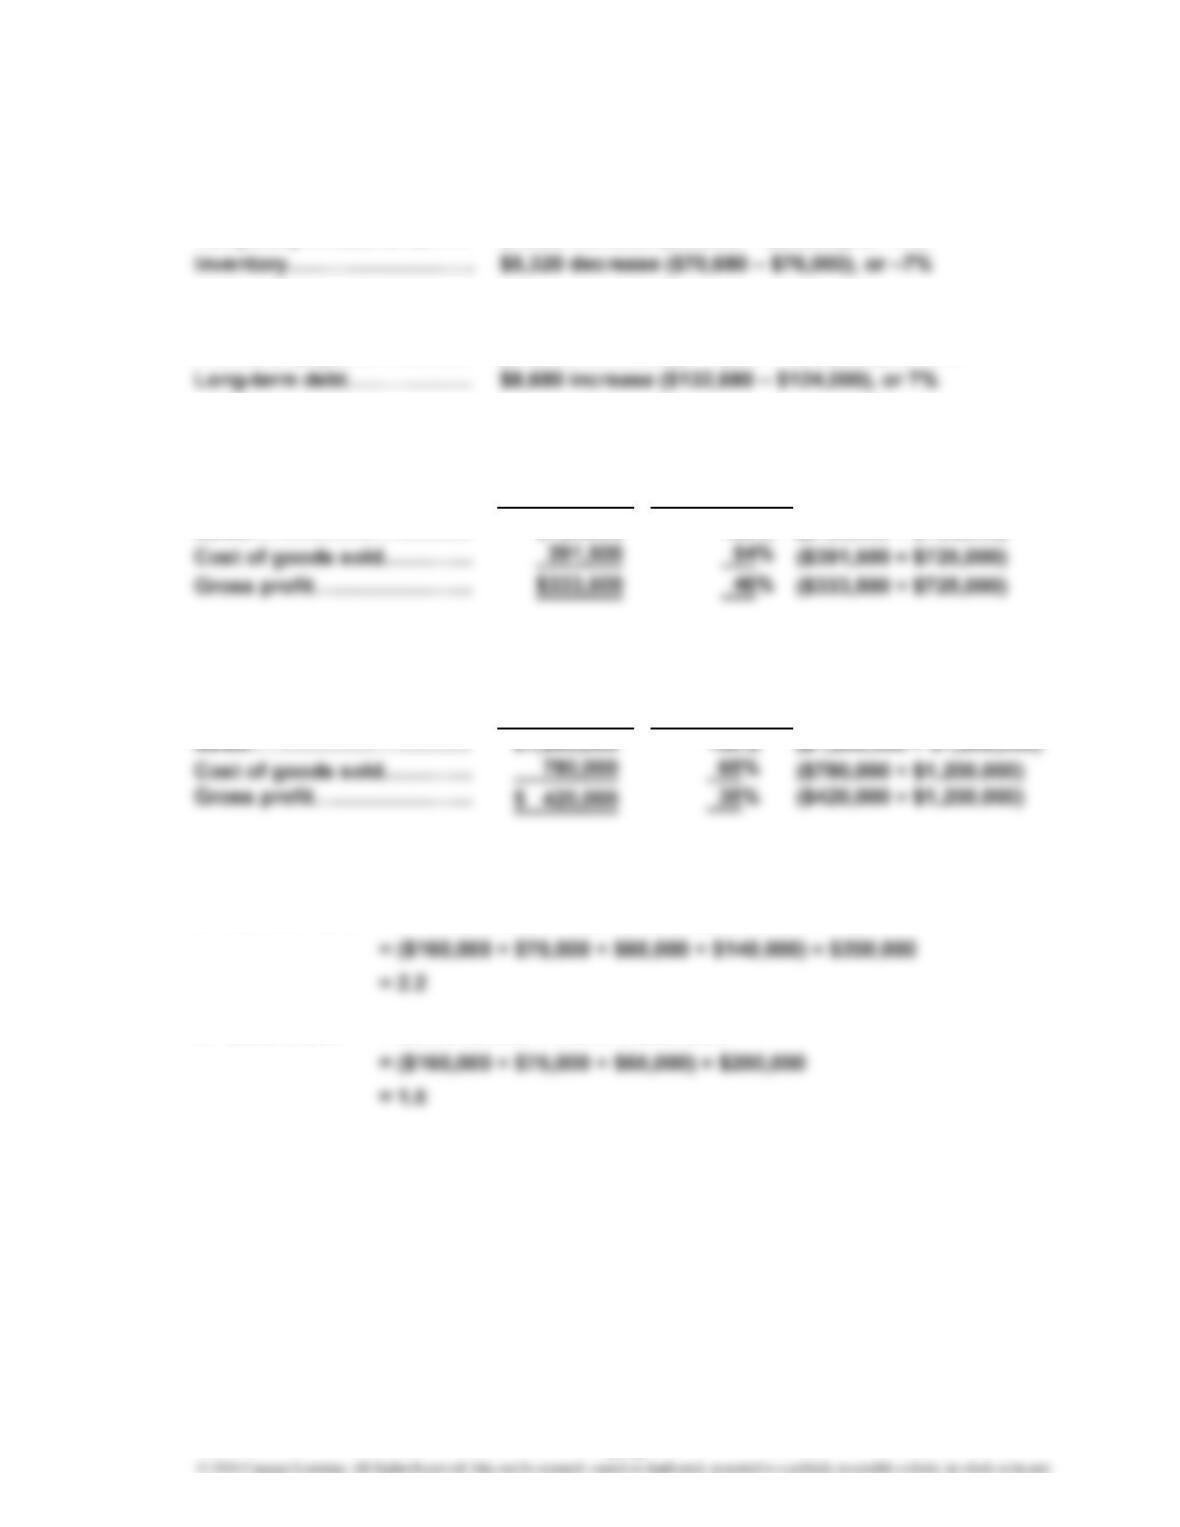
Temporary investments…… $7,280 increase ($59,280 – $52,000), or 14%
PE 17–1B
Accounts payable…………
…
$11,000 increase ($111,000 – $100,000), or 11%
PE 17–2A
Amount Percentage
Sales…………………………
…
$725,000 100% ($725,000 ÷ $725,000)
PE 17–2B
Amount Percentage
…
PE 17–3A
a. Current Ratio = Current Assets ÷ Current Liabilities
b. Quick Ratio = Quick Assets ÷ Current Liabilities
PRACTICE EXERCISES
17-3

CHAPTER 17 Financial Statement Analysis
PE 17–3B
a. Current Ratio = Current Assets ÷ Current Liabilities
b. Quick Ratio = Quick Assets ÷ Current Liabilities
PE 17–4A
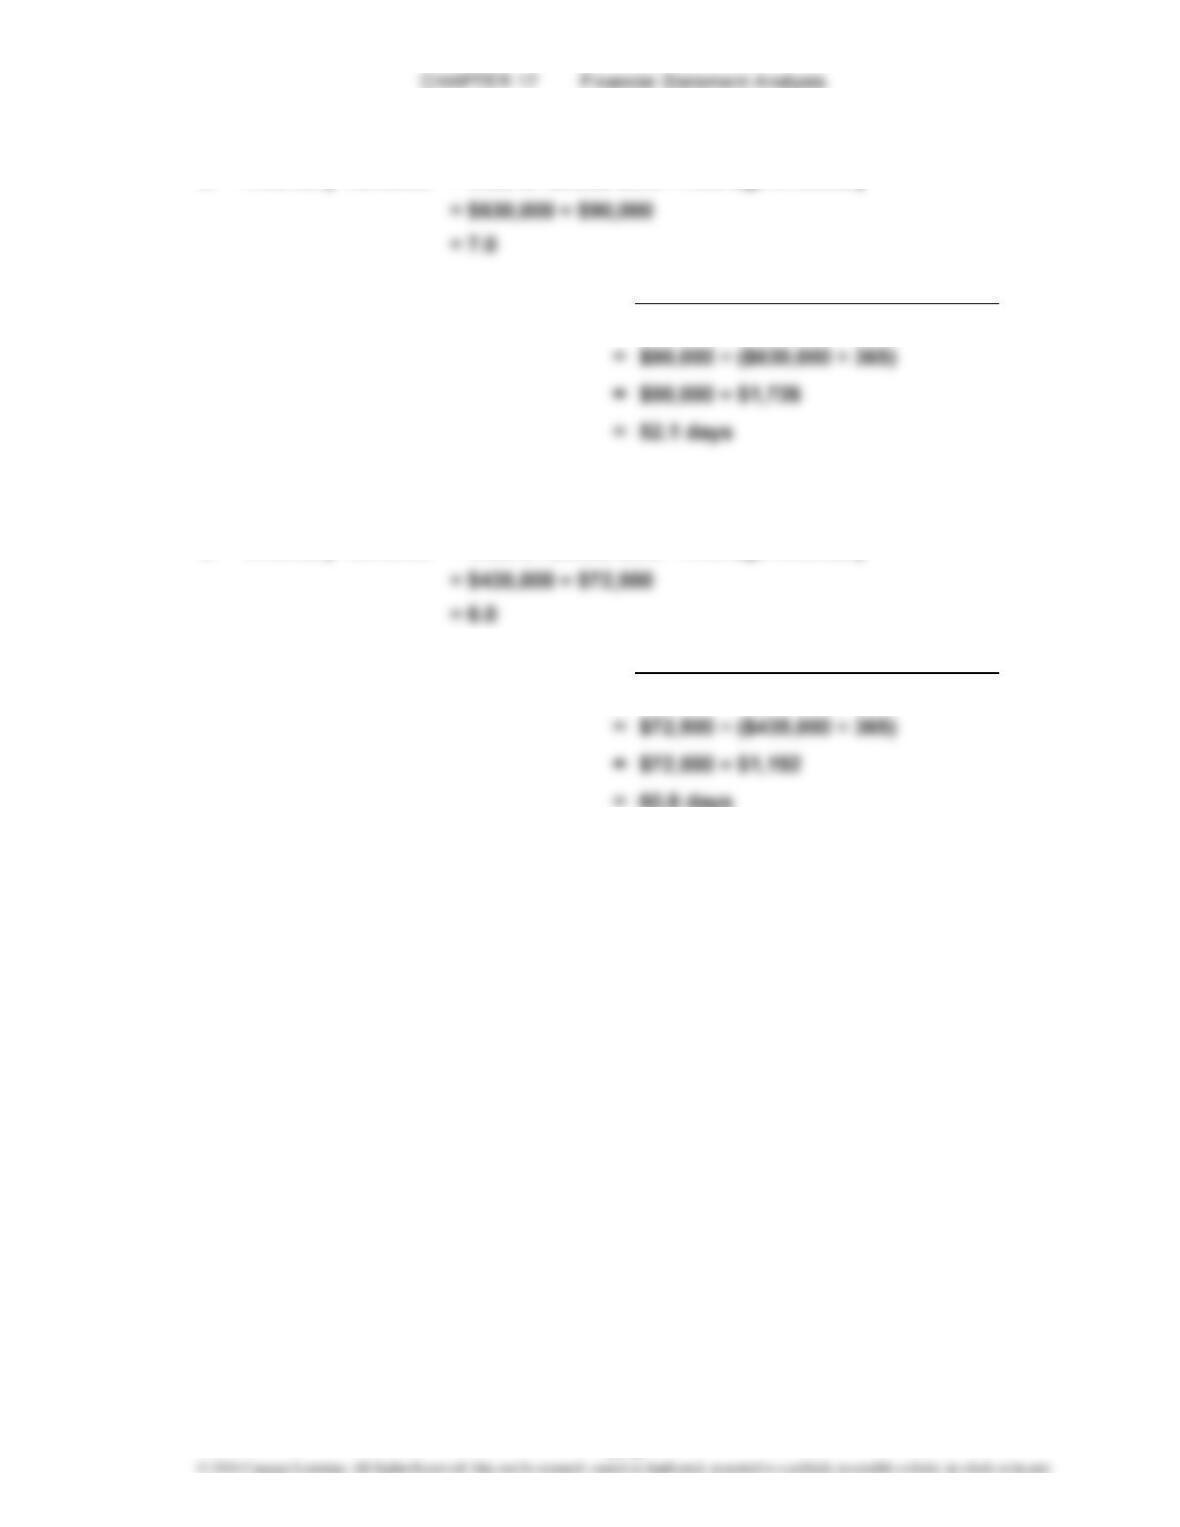
a. Accounts Receivable Turnover = Sales ÷ Average Accounts Receivable
Average Accounts Receivable
Average Daily Sales
PE 17–4B
a. Accounts Receivable Turnover = Sales ÷ Average Accounts Receivable
= 15.0
Average Accounts Receivable
Average Daily Sales
b. =
b. =Number of Days’ Sales in Receivables
Number of Days’ Sales in Receivables
17-4
PE 17–5A
a. Inventory Turnover = Cost of Goods Sold ÷ Average Inventory
Average Inventory
Average Daily Cost of Goods Sold
PE 17–5B
a. Inventory Turnover = Cost of Goods Sold ÷ Average Inventory
Average Inventory
Average Daily Cost of Goods Sold
=60.8 days
b. =
b. =
Number of Days’ Sales in Inventory
Number of Days’ Sales in Inventory
17-5
CHAPTER 17 Financial Statement Analysis
PE 17–6A
PE 17–6B
PE 17–7A
PE 17–7B
Fixed Assets
Long-Term Liabilities
Total Liabilities
Total Stockholders’ Equity
Total Stockholders’ Equity
Income Before Income Tax +
Interest Expense
Interest Expense
Ratio of Fixed Assets to Long-Term Liabilities
Ratio of Liabilities to Stockholders’ Equity
Ratio of Fixed Assets to Long-Term Liabilities
Number of Times
Interest Charges Are Earned =
Number of Times
Interest Charges Are Earned
Interest Expense
Interest Expense
=
Income Before Income Tax +
Total Liabilities
Fixed Assets
Long-Term Liabilities
a.
=
b. =
b. =
a. =
Ratio of Liabilities to Stockholders’ Equity
PE 17–8A
Ratio of Sales to Assets = Sales ÷ Average Total Assets
PE 17–8B
Ratio of Sales to Assets = Sales ÷ Average Total Assets
PE 17–9A
PE 17–9B
Rate Earned on Total Assets = Net Income + Interest Expense
Average Total Assets
Rate Earned on Total Assets =
Net Income + Interest Expense
Average Total Assets
17-7
CHAPTER 17 Financial Statement Analysis
PE 17–10A
PE 17–10B
b. Net Income – Preferred Dividends
Average Common Stockholders’ Equity
a. Rate Earned on Stockholders’ Equity = Net Income
Average Stockholders’ Equity
a. Rate Earned on Stockholders’ Equity = Net Income
Average Stockholders’ Equity
b. Rate Earned on Common
Stockholders’ Equity =Net Income – Preferred Dividends
Average Common Stockholders’ Equity
=
Rate Earned on Common
Stockholders’ Equity
PE 17–11A
=
PE 17–11B
b. Market Price per Share of Common Stock
Earnings per Share on Common Stock
Price-Earnings Ratio =
a. Net Income – Preferred Dividends
Shares of Common Stock Outstanding
Earnings per Share
on Common Stock =
$1.60
a. =
Earnings per Share
on Common Stock
Net Income – Preferred Dividends
Shares of Common Stock Outstanding
=Price-Earnings Ratiob. Market Price per Share of Common Stock
Earnings per Share on Common Stock
17-9
CHAPTER 17 Financial Statement Analysis
Ex. 17–1
a.
Amount Percent Amount Percent
Sales $2,500,000 100% $2,350,000 100%
Cost of goods sold 1,500,000 60% 1,292,500 55%
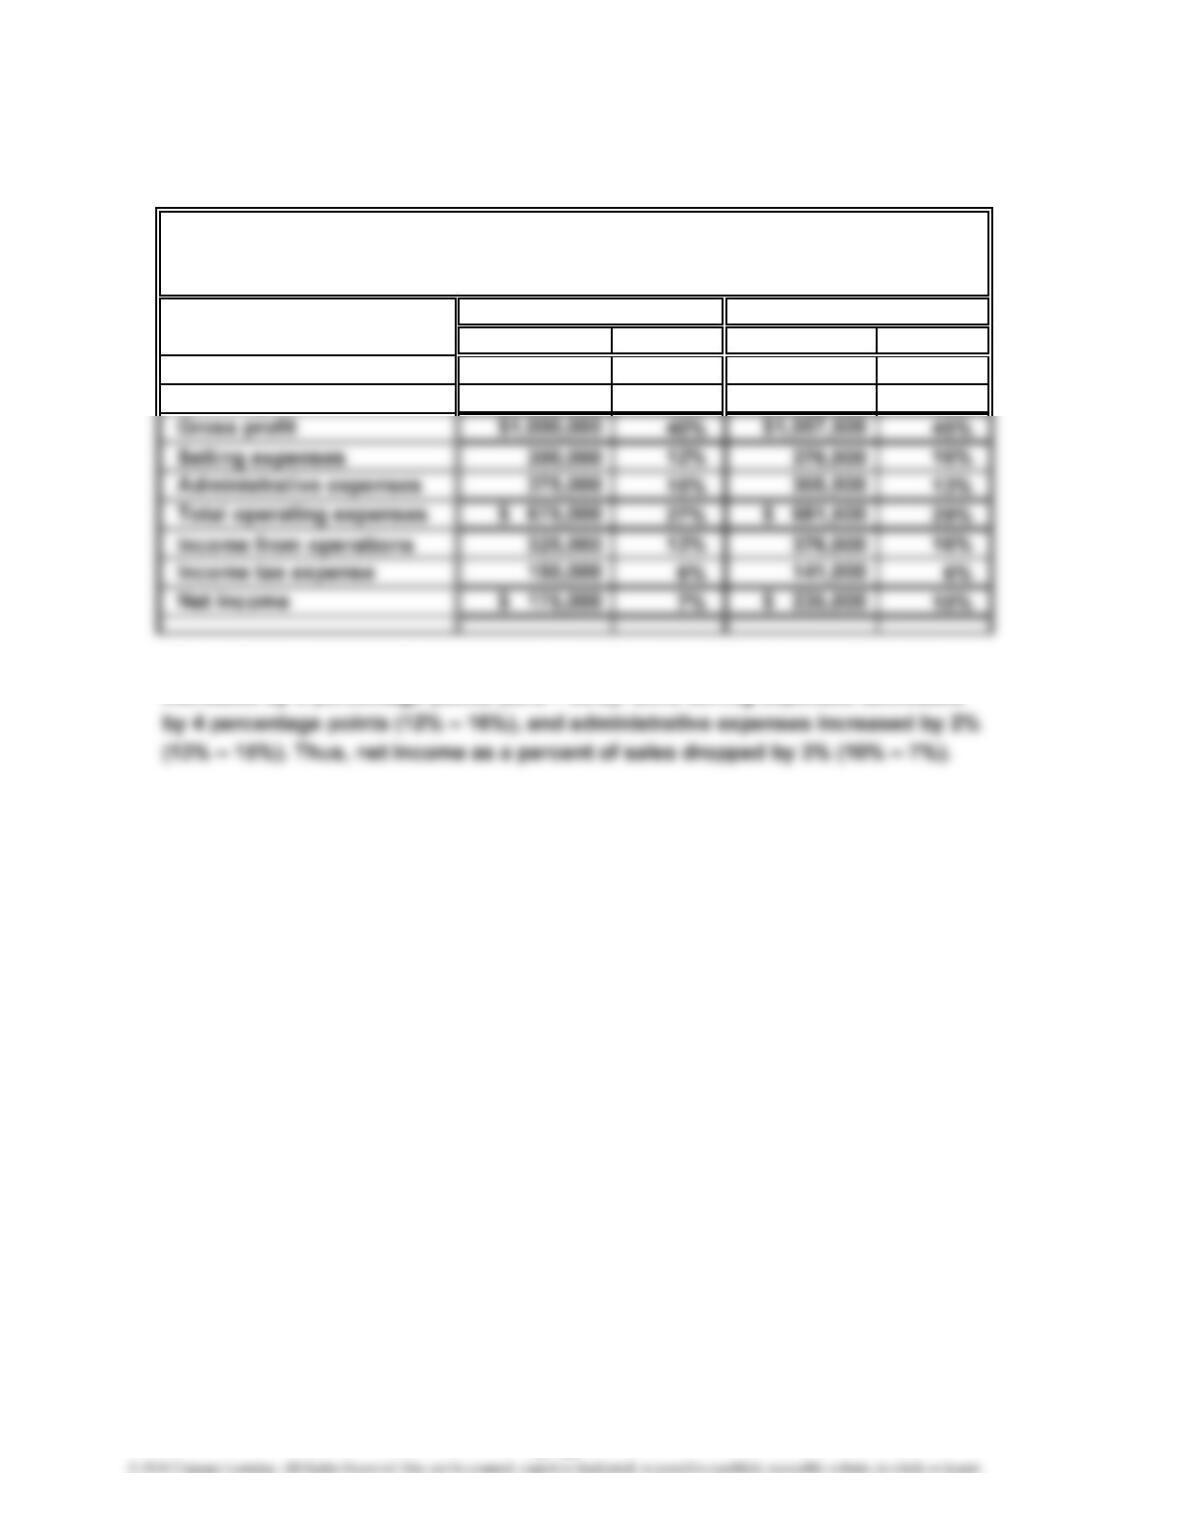
b. The vertical analysis indicates that the cost of goods sold as a percent of sales
increased by 5 percentage points (60% – 55%), while selling expenses decreased
Current year Previous year
EXERCISES
GRESHAM, Inc.
Comparative Income Statement
For the Years Ended December 31, 20—
17-10
CHAPTER 17 Financial Statement Analysis
Ex. 17–2
a.
Amount Percent Amount Percent
Revenues:
Admissions $116,034 23.7% $130,239 25.7%
Expenses and other:
Direct expense of events $101,402 20.7% $106,204 21.0%
NASCAR purse and
sanction fees 122,950 25.1% 120,146 23.7%
Other direct expenses 18,908 3.9% 20,352 4.0%
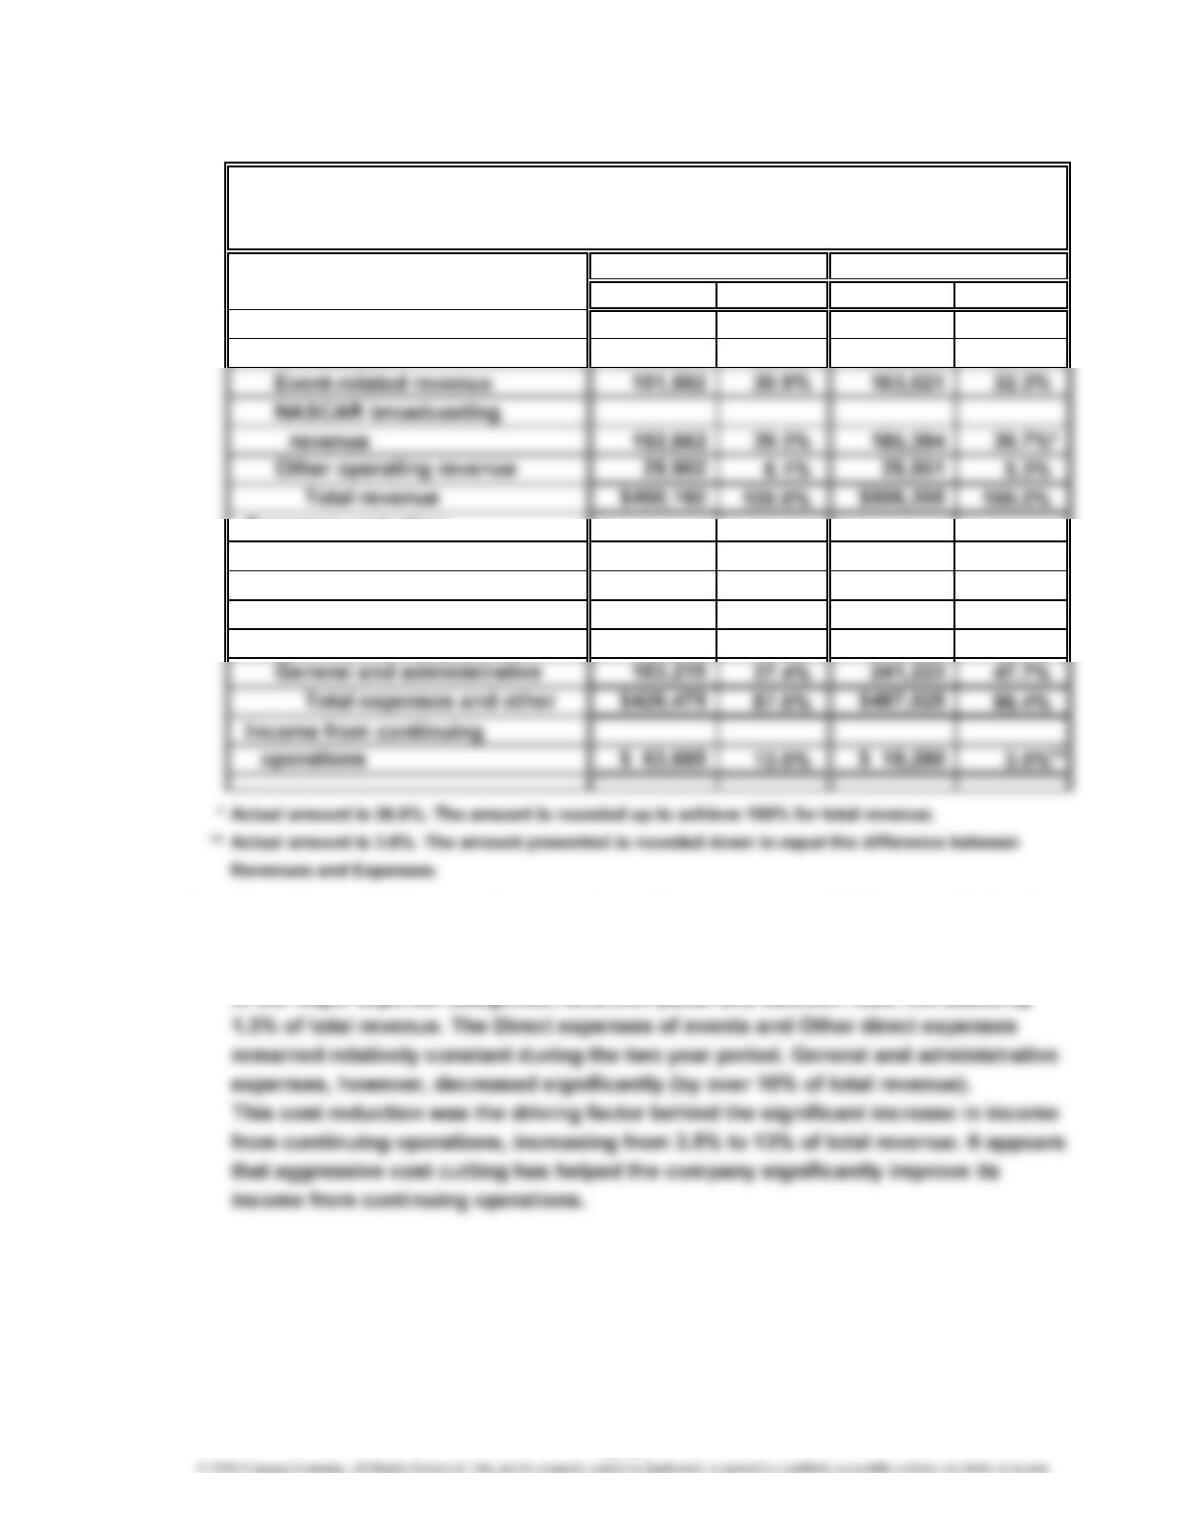
b. Overall revenue decreased some between the two years, as did the overall mix of
revenue sources. The NASCAR broadcasting revenue increased by almost 3% of
total revenue, while admissions revenue decreased by 2% of total revenue. One
of the major expense categories, NASCAR purse and sanction fees, increased by
Current Year Prior Year
SPEEDWAY MOTORSPORTS, INC.
Comparative Income Statement (in thousands of dollars)
For the Years Ended December 31, 20—
17-11
CHAPTER 17 Financial Statement Analysis
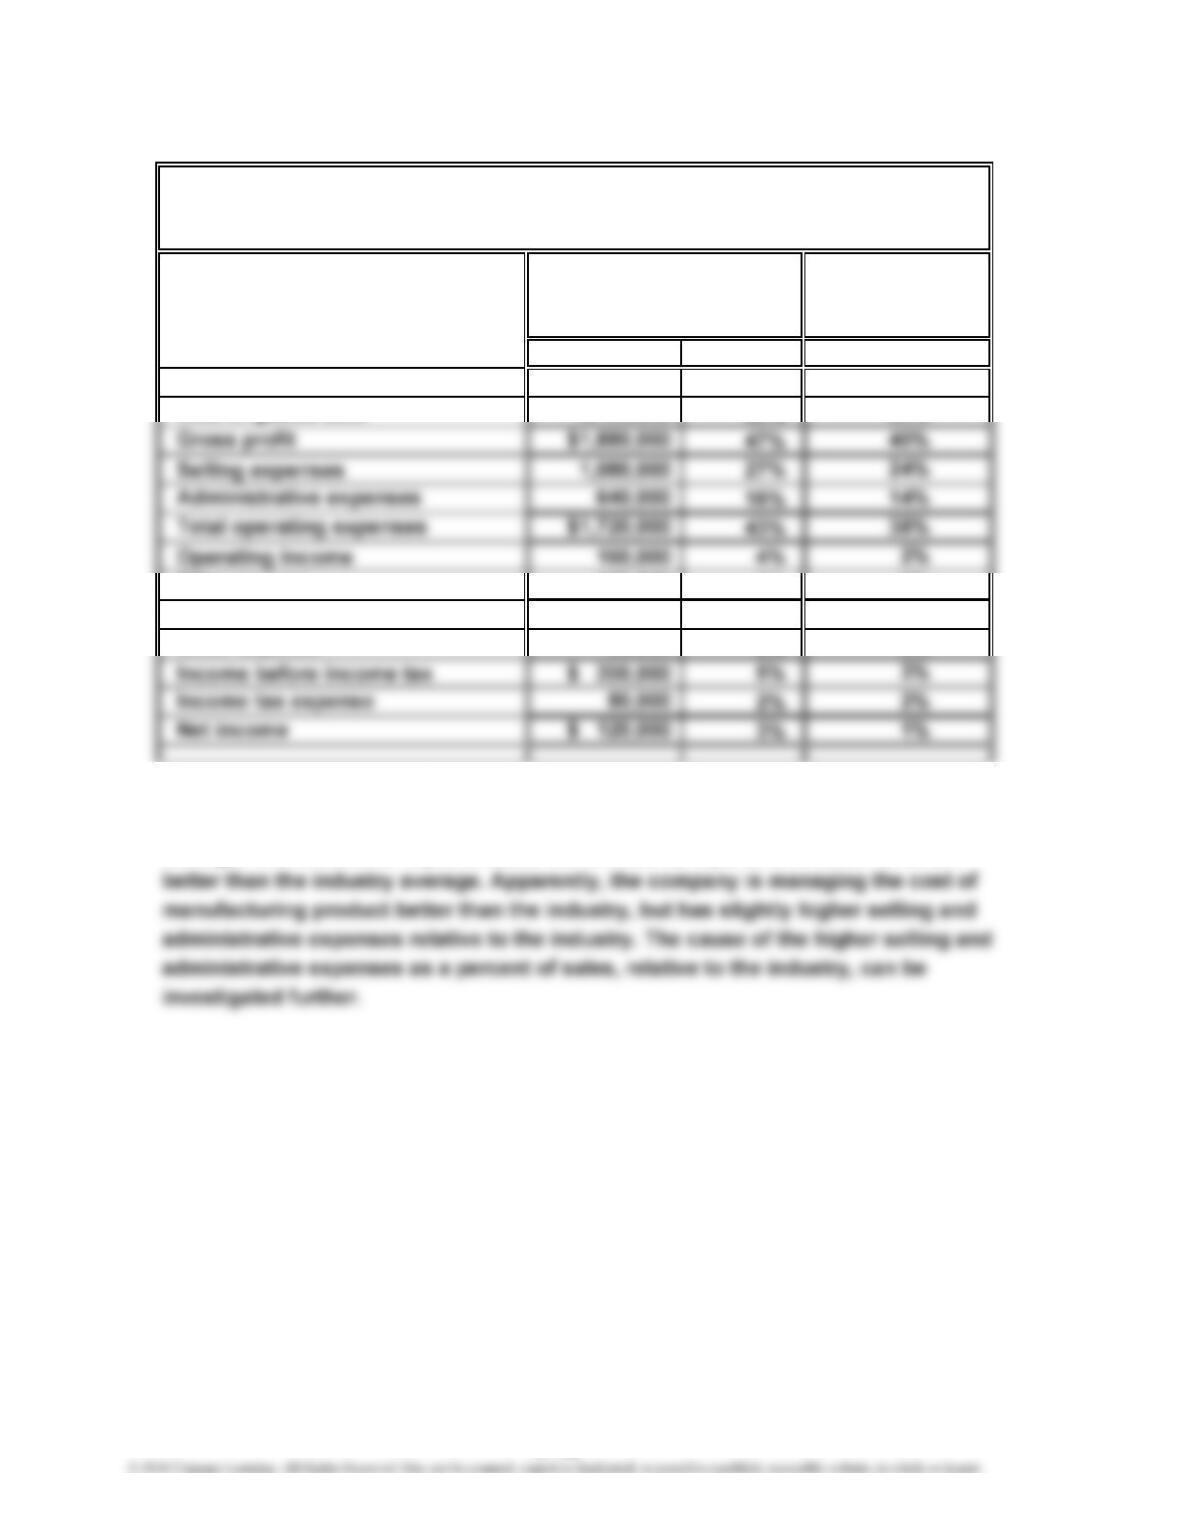
Ex. 17–3
a.
Amount Percent
Sales $4,000,000 100%
Cost of goods sold 2,120,000 53%
Other income 120,000 3%
$ 280,000 7%
Other expense 80,000 2%
b. The cost of goods sold is 7% lower than the industry average, but the selling
expenses and administrative expenses are 3% and 2% higher than the industry
average. The combined impact causes net income as a percent of sales to be 2%
100%
2%
5%
3%
60%
Electronics
TANNENHILL COMPANY
Common-Sized Income Statement
For the Year Ended December 31, 20—
Tannenhill
Company
Industry
Average
17-12
CHAPTER 17 Financial Statement Analysis
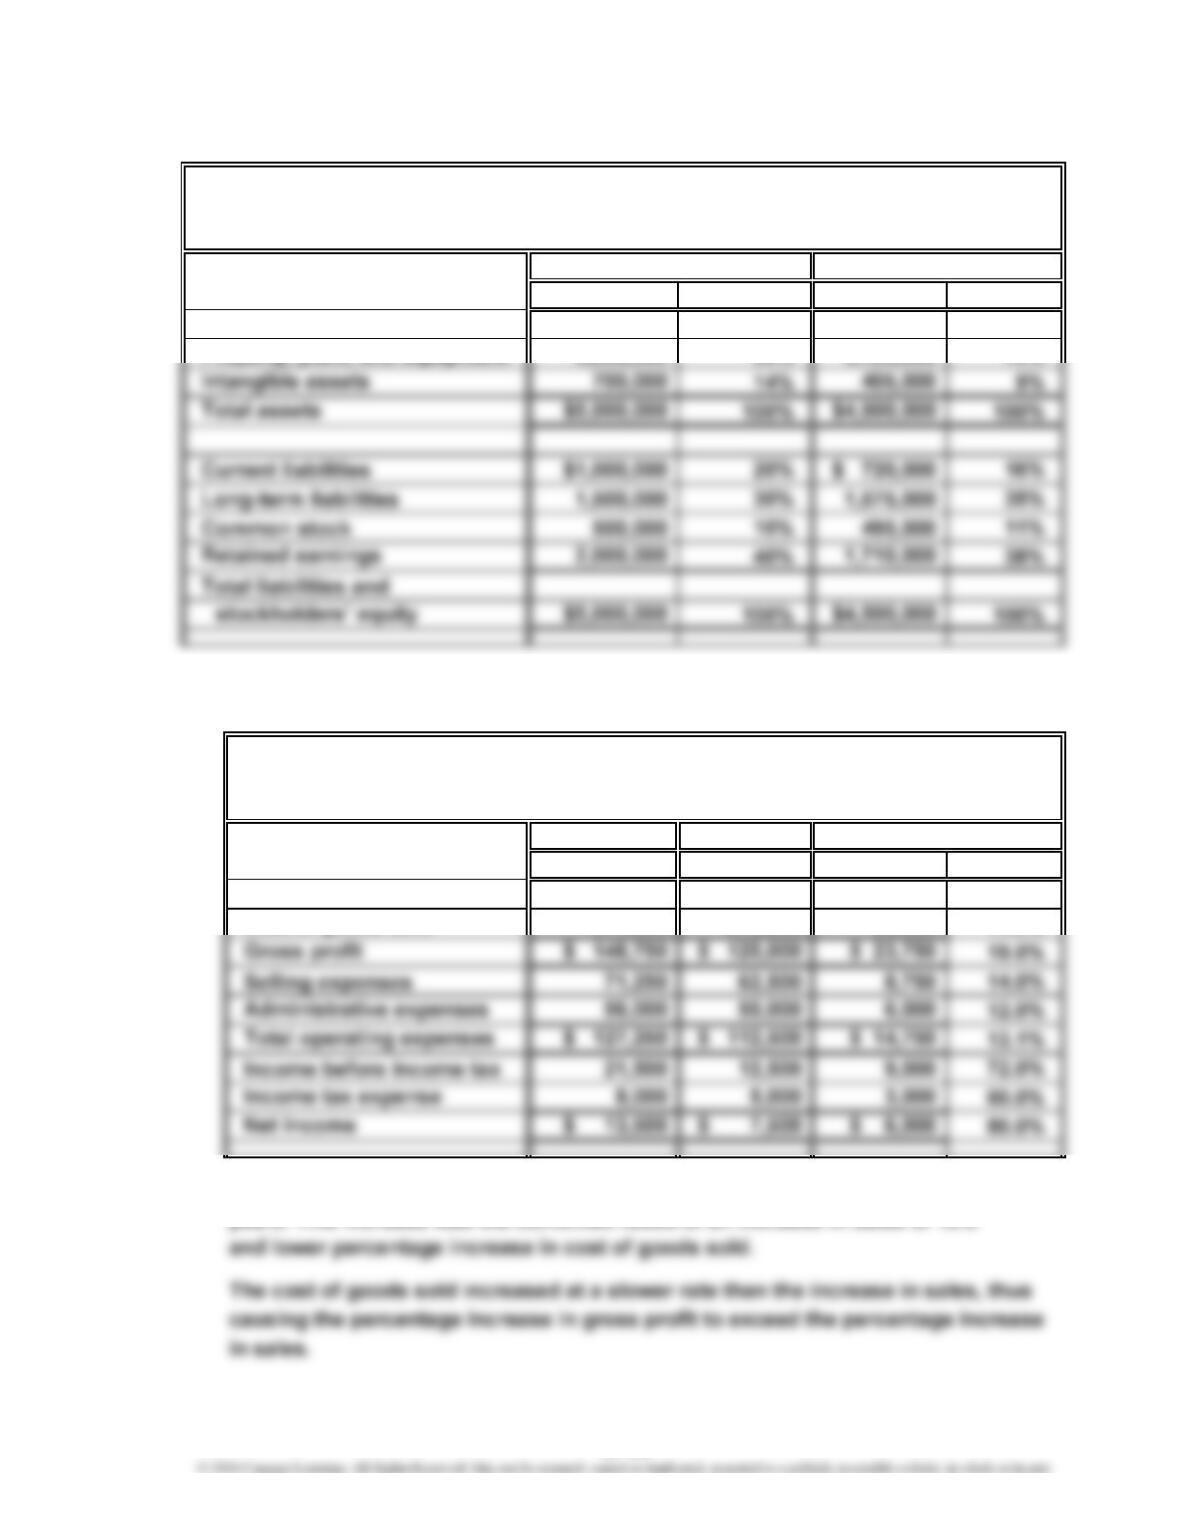
Ex. 17–4
Amount Percent Amount Percent
Current assets $1,300,000 26% $ 945,000 21%
Property, plant, and equipment 3,000,000 60% 3,150,000 70%
Ex. 17–5
a.
Current year Previous year
Amount Amount Amount Percent
Sales $1,120,000 $1,000,000 $120,000 12.0%
Cost of goods sold 971,250 875,000 96,250 11.0%
b. The net income for Moreno Company increased by approximately 80% between
years. This increase was the combined result of an increase in sales of 12%
NOVAK COMPANY
Comparative Balance Sheet
For the Years Ended December 31, 20—
Increase (Decrease)
MORENO COMPANY
Comparative Income Statement
For the Years Ended December 31, 20—
Current year Previous year
17-13

CHAPTER 17 Financial Statement Analysis
Ex. 17–6
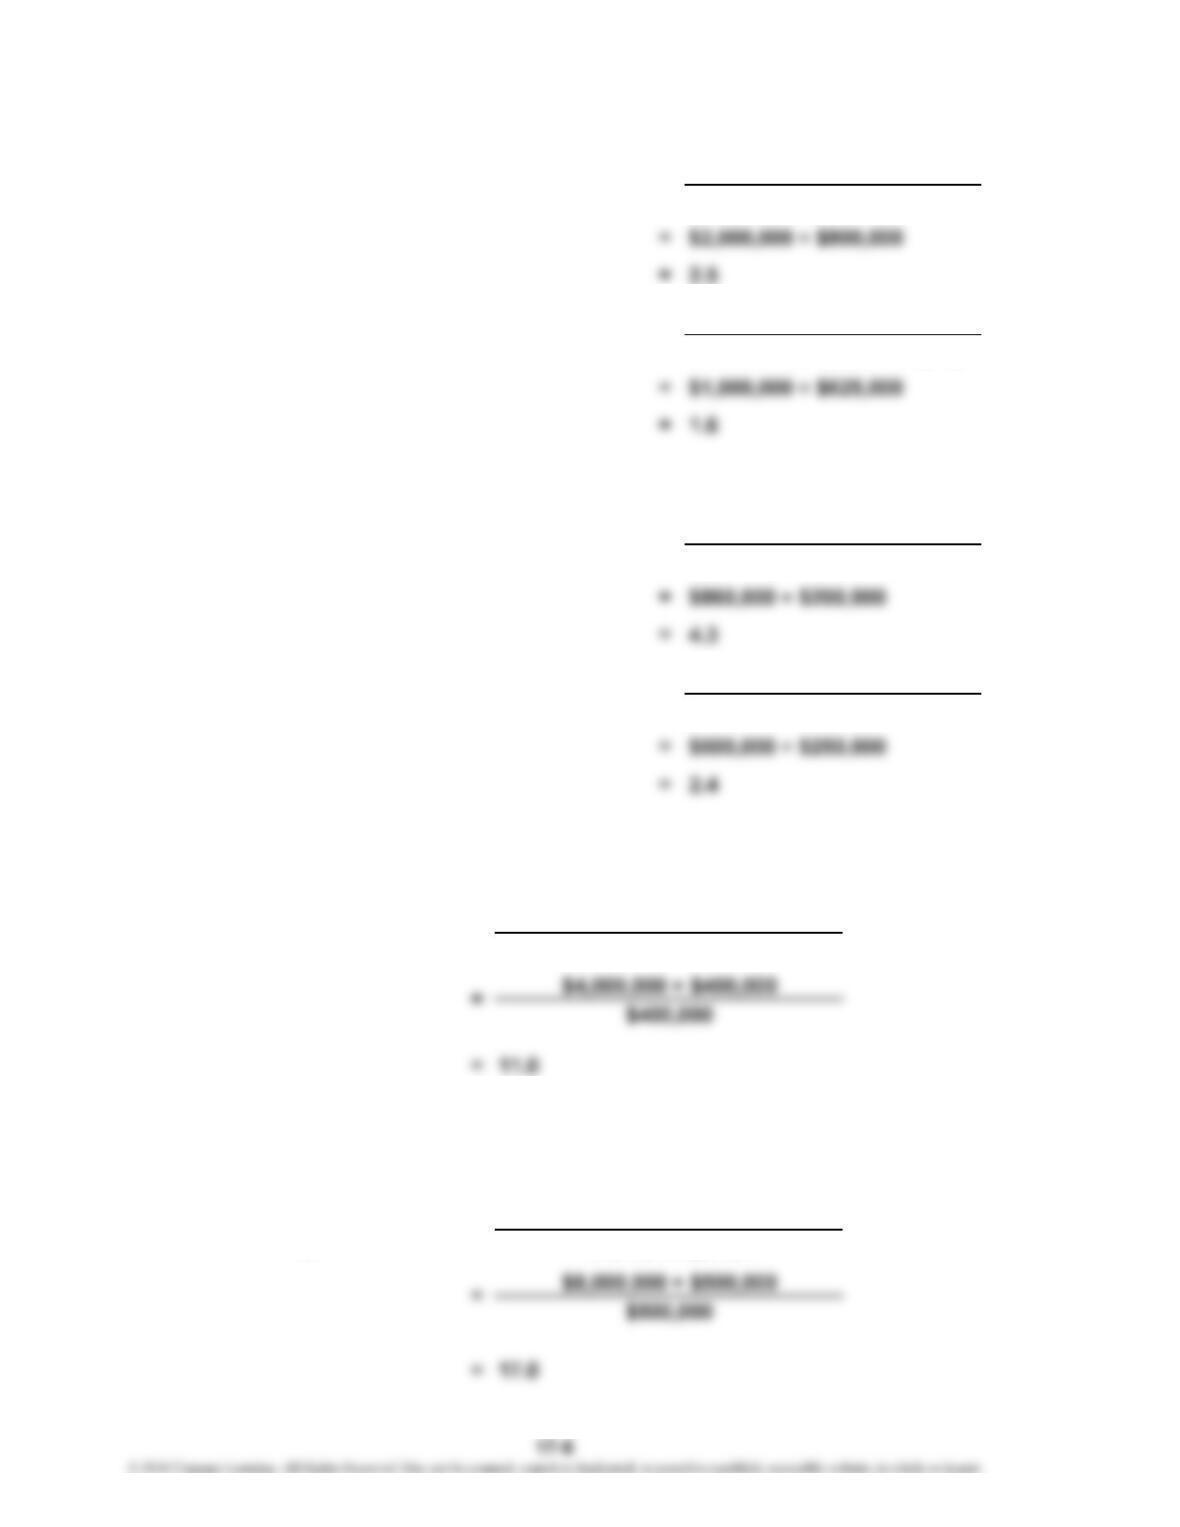
a. (1) Working Capital = Current Assets – Current Liabilities
b. The liquidity of Gostkowski has improved from the preceding year to the current
Ex. 17–7
b. The solvency of PepsiCo has increased slightly over this time period. The
current ratio has increased from 1.0 to 1.1, and the quick ratio has increased by
Current Assets
Current Liabilities
Quick Assets
Current Liabilities
Current Assets
Current Liabilities
Quick Assets
a.
=(2) Current Ratio
(1) Current Ratio =
(3) Quick Ratio =
(2)
Quick Ratio = Current Liabilities
17-14
CHAPTER 17 Financial Statement Analysis
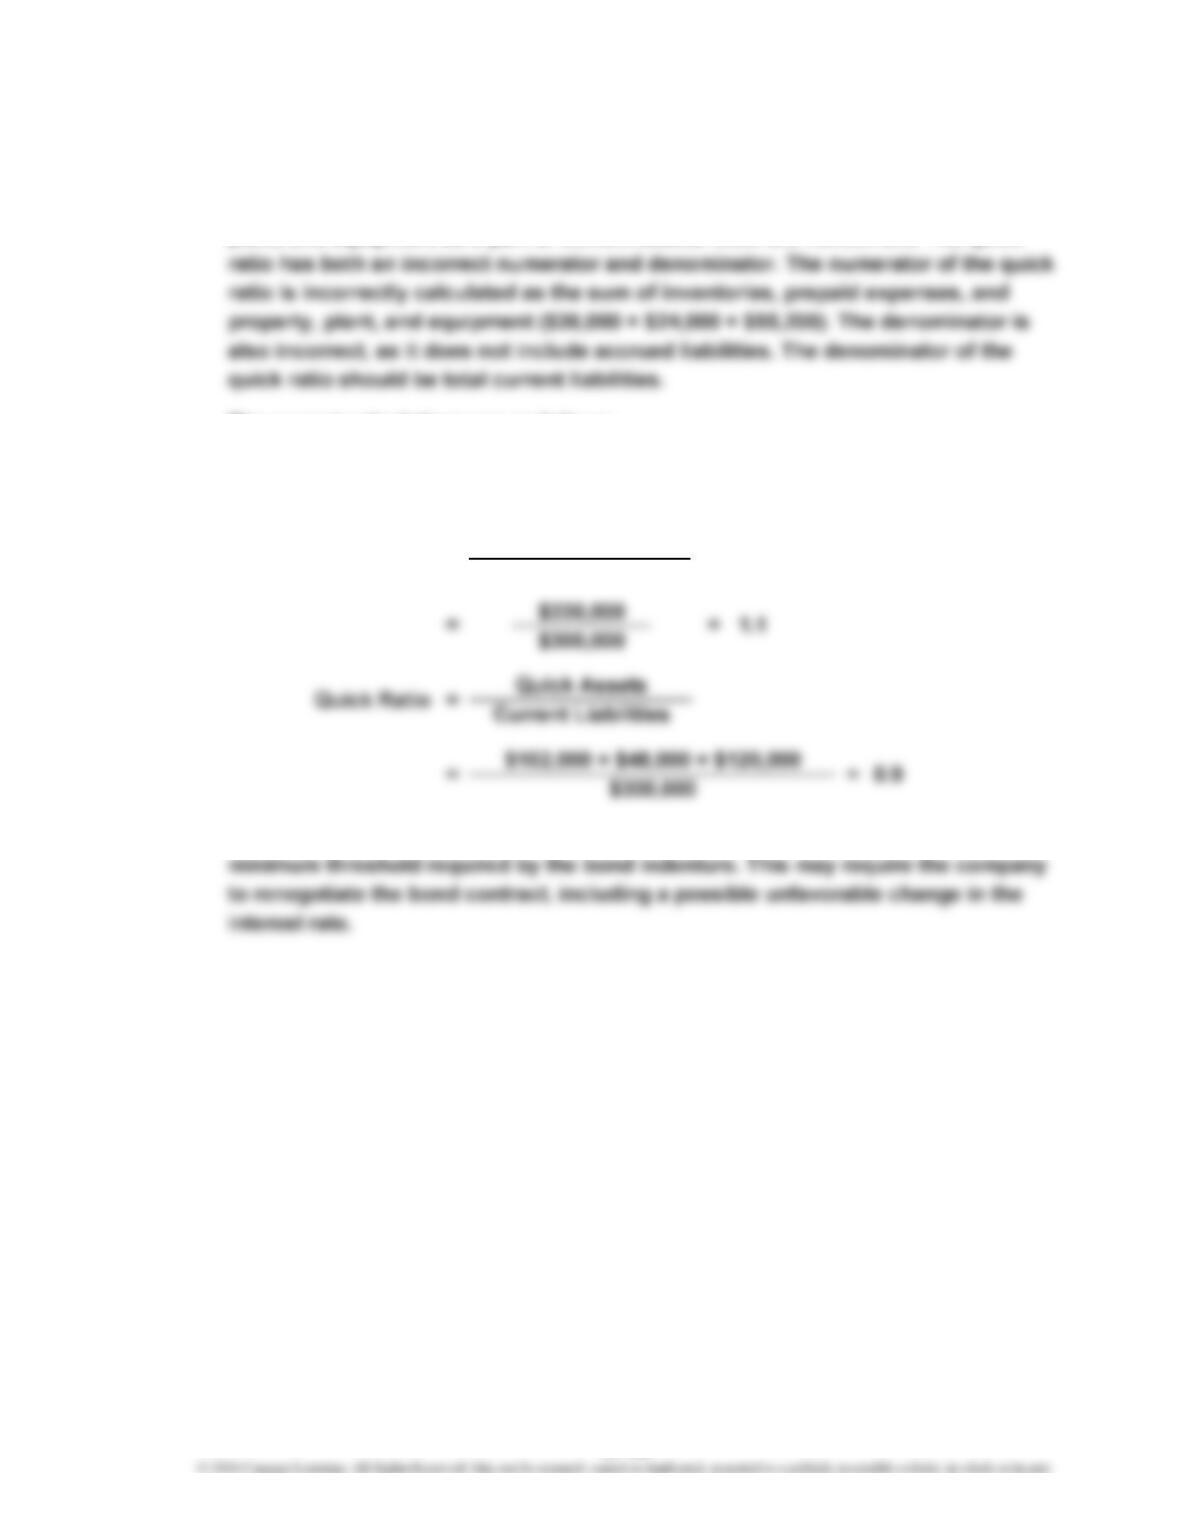
Ex. 17–8
a. The working capital, current ratio, and quick ratio are calculated incorrectly. The
working capital and current ratio incorrectly include intangible assets and property,
plant, and equipment as a part of current assets. Both are noncurrent. The quick
The correct calculations are as follows:
= Current Assets – Current Liabilities
= $330,000 – $300,000
b. Unfortunately, the working capital, current ratio, and quick ratio are below the
Working Capital
$30,000
Current Assets
Current Liabilities
=
Current Ratio
17-15
CHAPTER 17 Financial Statement Analysis
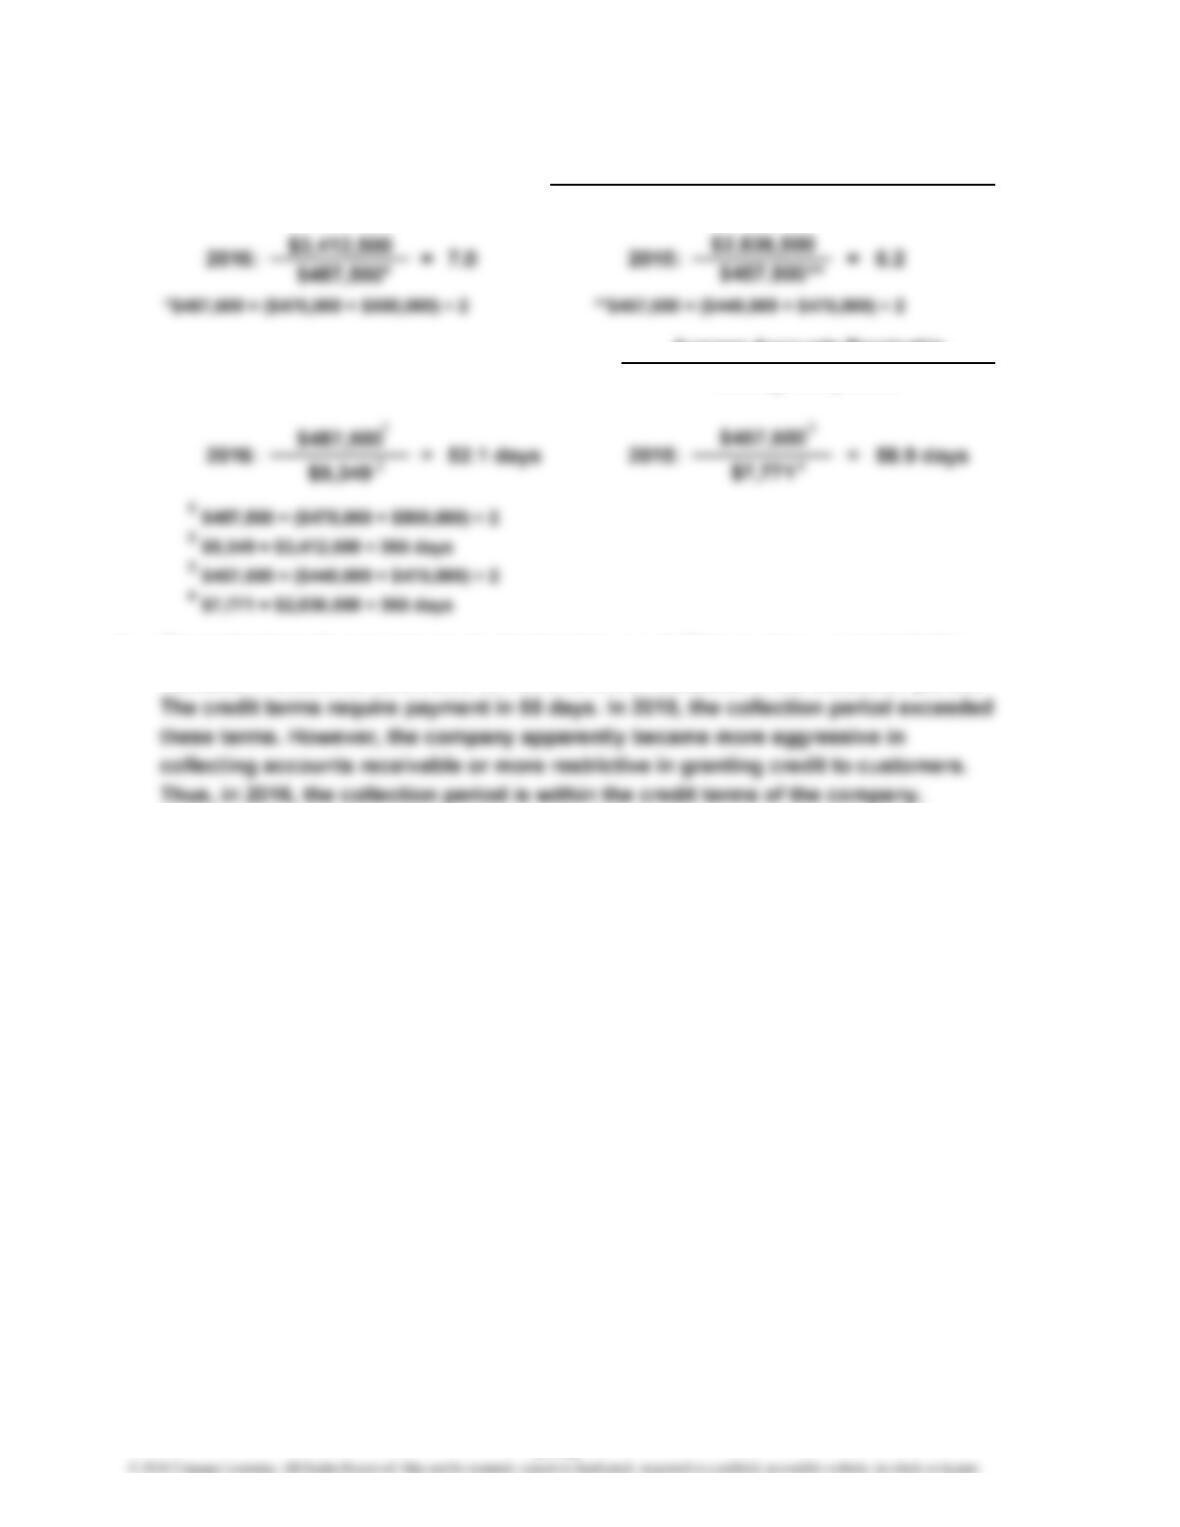
Ex. 17–9
b. The collection of accounts receivable has improved. This can be seen in both the
increase in accounts receivable turnover and the reduction in the collection period.
Average Accounts Receivable
Average Accounts Receivable
Average Daily Sales
Sales
(2)
=Number of Days’ Sales in Receivables
a. (1)
=
Accounts Receivable Turnover
17-16
CHAPTER 17 Financial Statement Analysis
Ex. 17–10
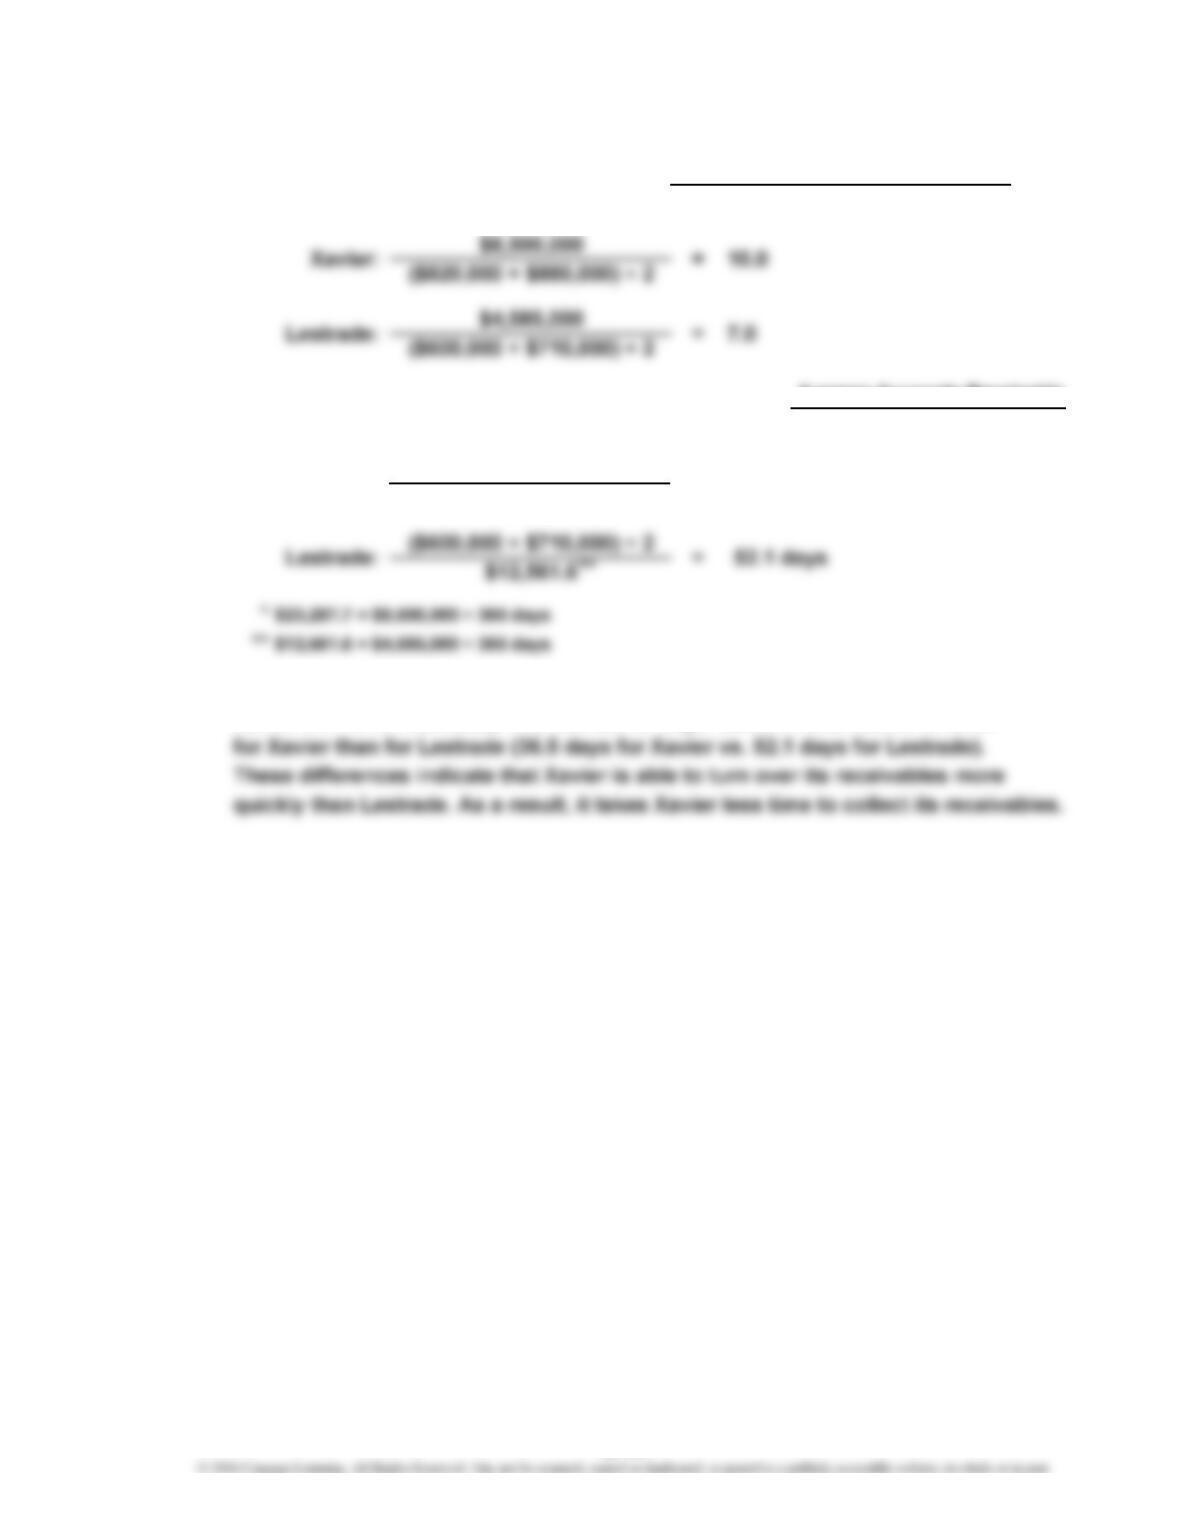
b. Xavier’s accounts receivable turnover is much higher than Lestrade’s (10.0 for
Xavier vs. 7.0 for Lestrade). The number of days’ sales in receivables is lower
Accounts Receivable Turnover Average Accounts Receivable
Sales
a. (1)
=
(2)
Average Accounts Receivable
Average Daily Sales
Number of Days’ Sales in Receivables
36.5 days
=
Xavier: =
($820,000 + $880,000) ÷ 2
$23,287.7
*
17-17
CHAPTER 17 Financial Statement Analysis
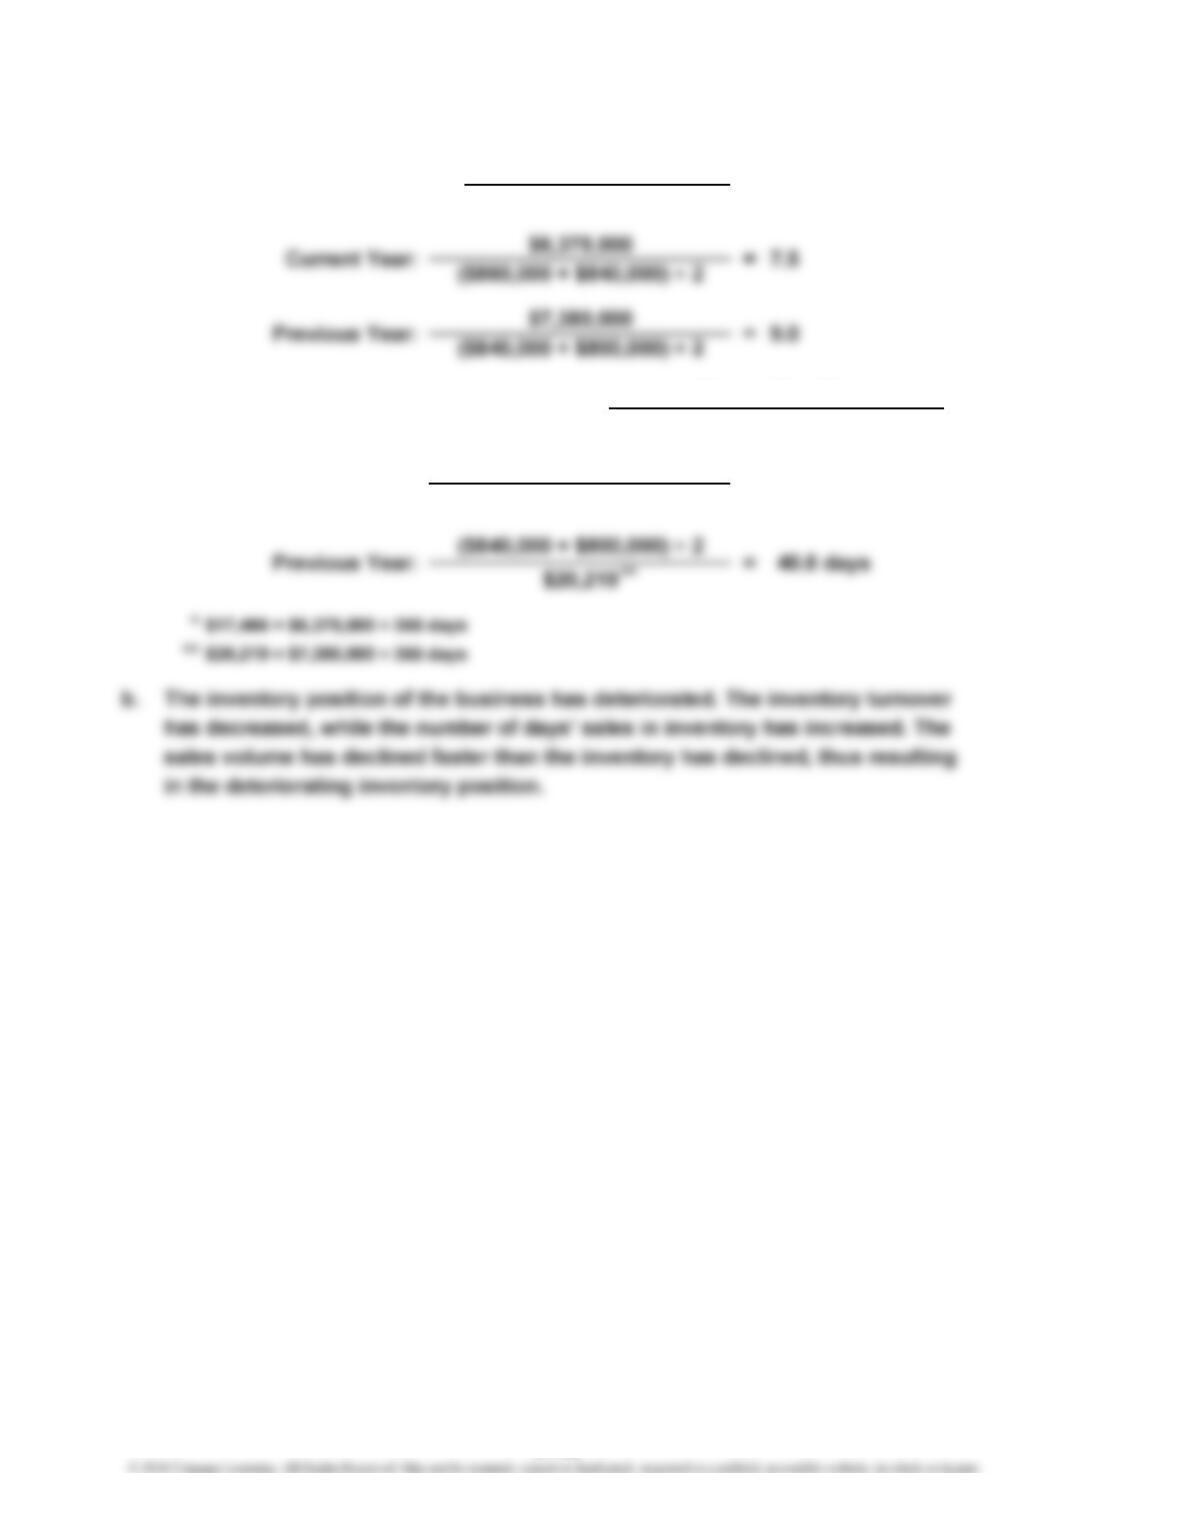
Ex. 17–11
($860,000 + $840,000) ÷ 2
Current Year:
$17,466
Number of Days’ Sales in Inventory
Inventory Turnover
a. (1)
=
Cost of Goods Sold
Average Inventory
(2)
48.7 days
=
=Average Inventory
Average Daily Cost of Goods Sold
*
17-18
CHAPTER 17 Financial Statement Analysis
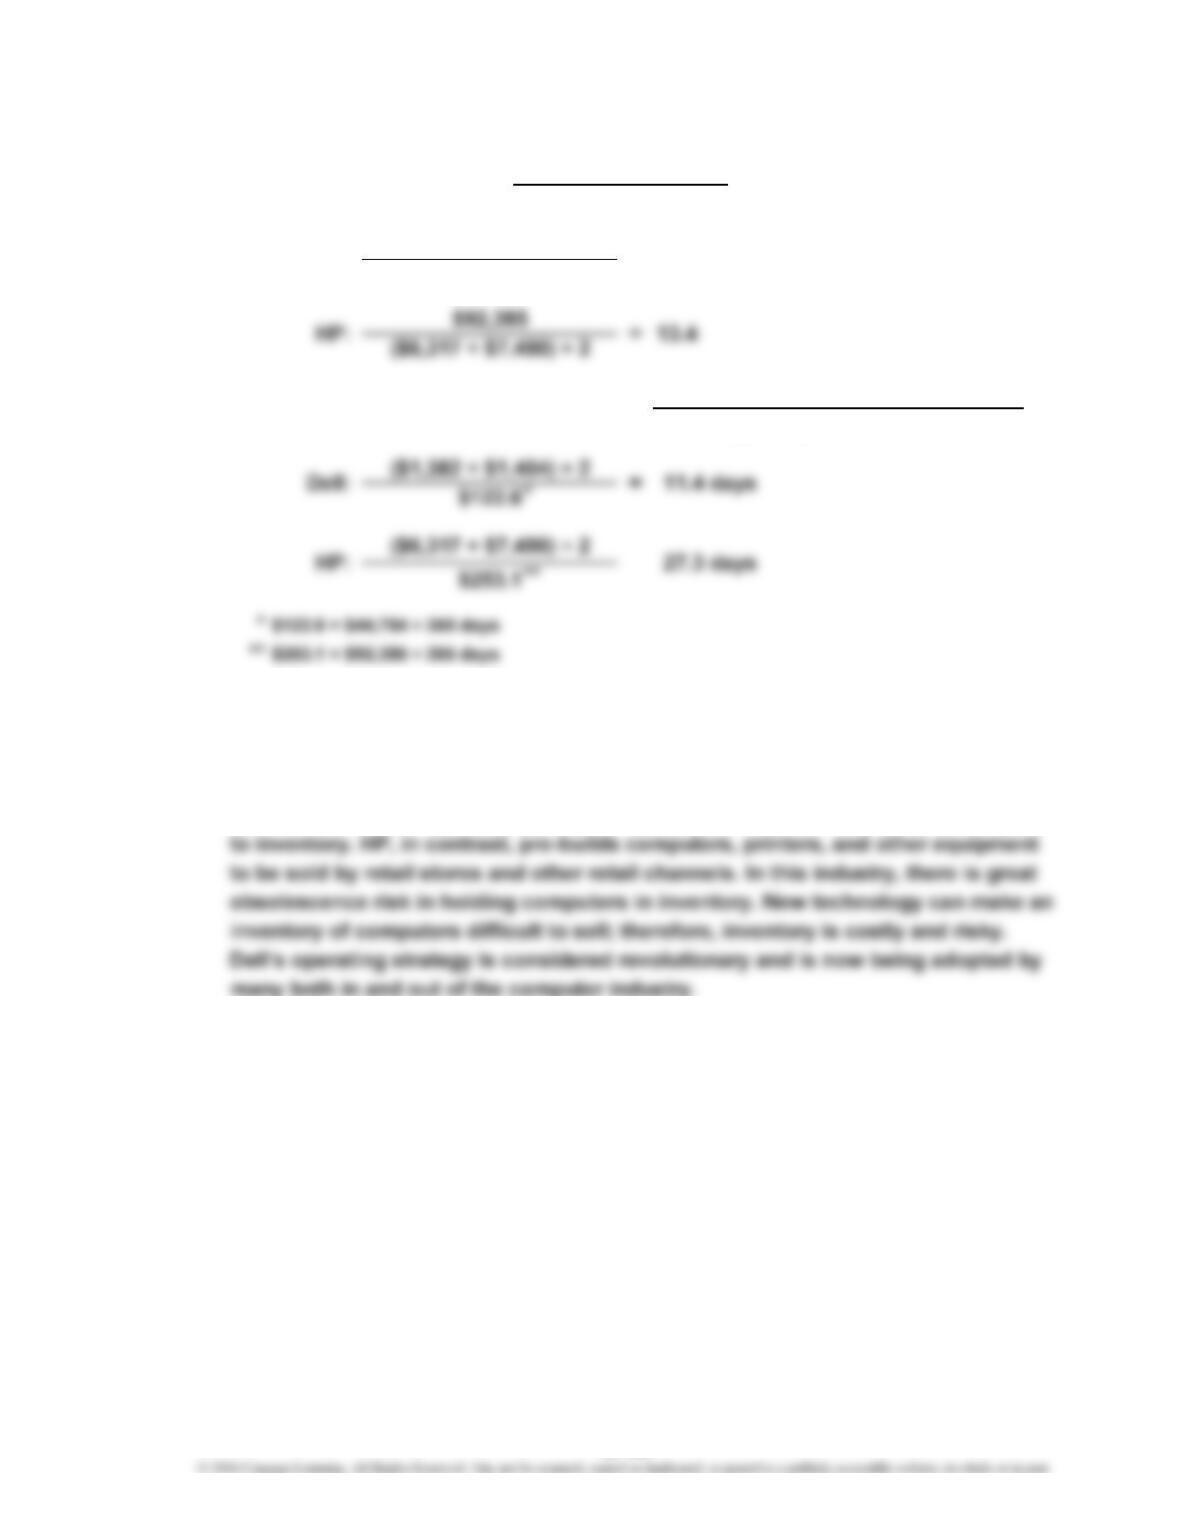
Ex. 17–12
b. Dell has a much higher inventory turnover ratio than does HP (32.1 vs. 13.4).
Likewise, Dell has a much smaller number of days’ sales in inventory (11.4 days
vs. 27.3 days). These significant differences are a result of Dell’s make-to-order
strategy. Dell has successfully developed a manufacturing process that is able to
fill a customer order quickly. As a result, Dell does not pre-build as many computers
$44,754
=
Average Inventory
32.1
a. (1)
Inventory Turnover =
(2)
Dell:
($1,382 + $1,404) ÷ 2
=
Cost of Goods Sold
Number of Days’ Sales in Inventory Average Inventory
Average Daily Cost of Goods Sold
17-19
CHAPTER 17 Financial Statement Analysis
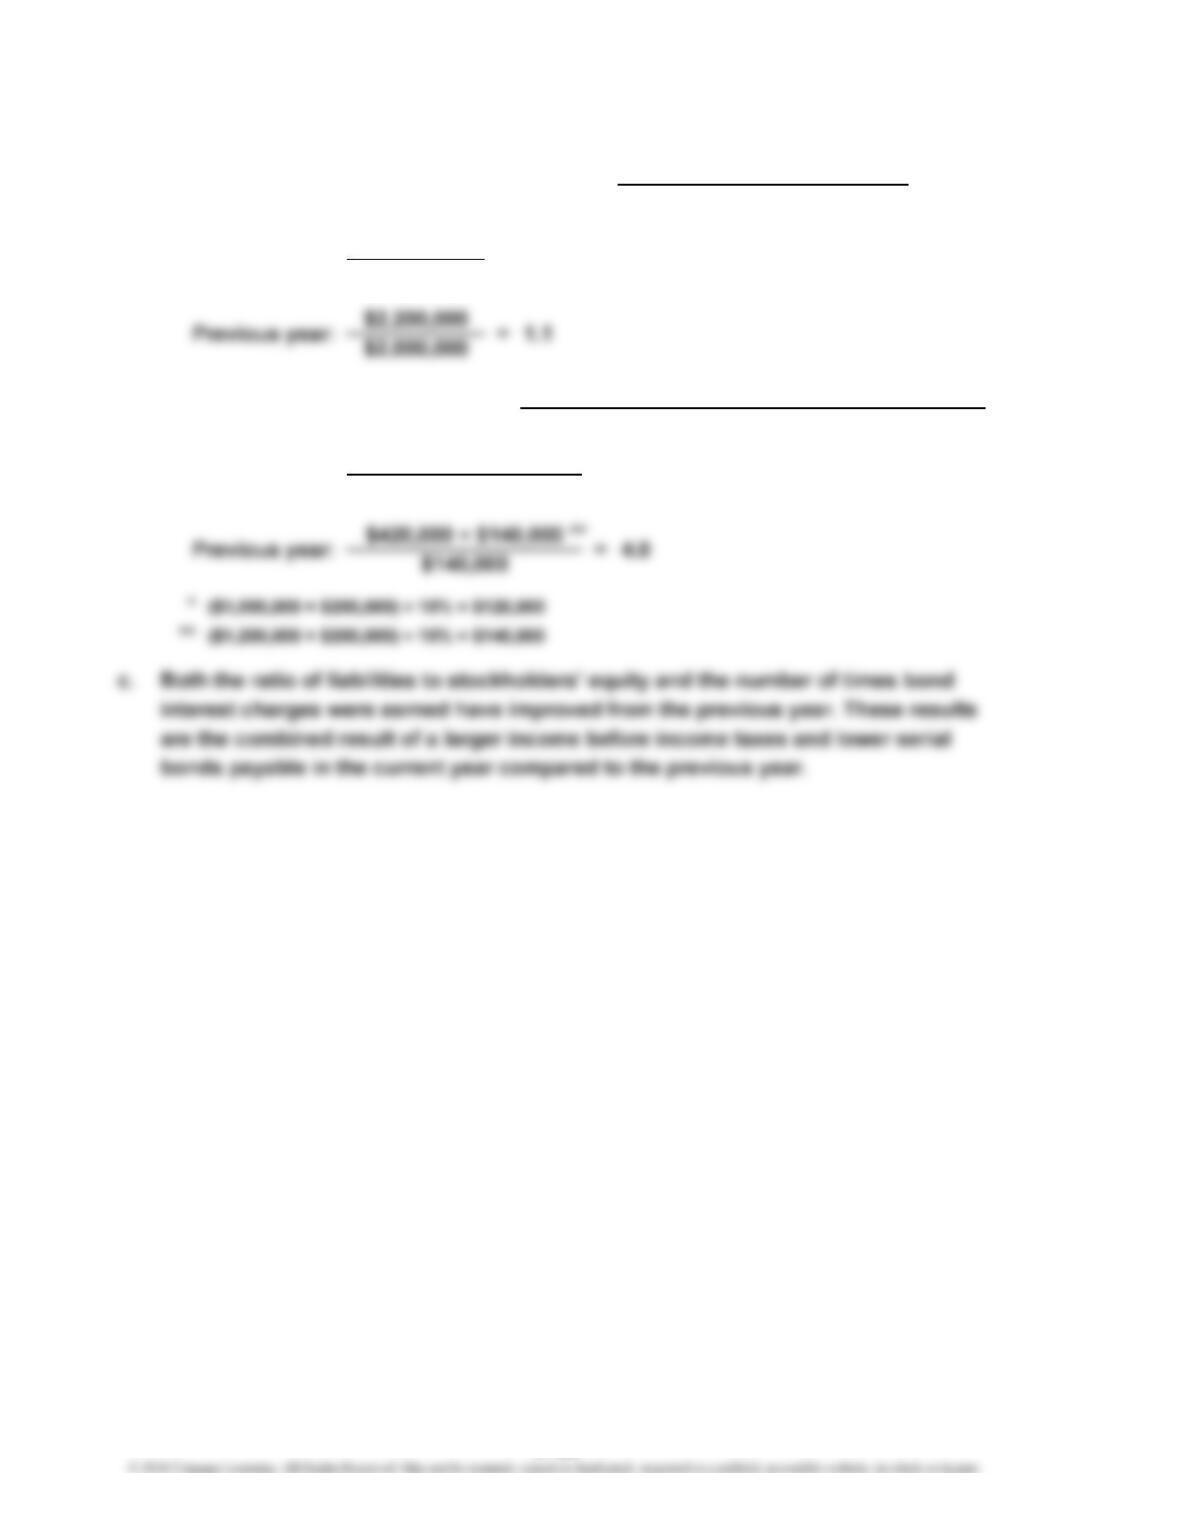
Ex. 17–13
a.
b.
Current year:
Number of Times Bond
Interest Charges Are Earned
$2,124,000
$2,360,000
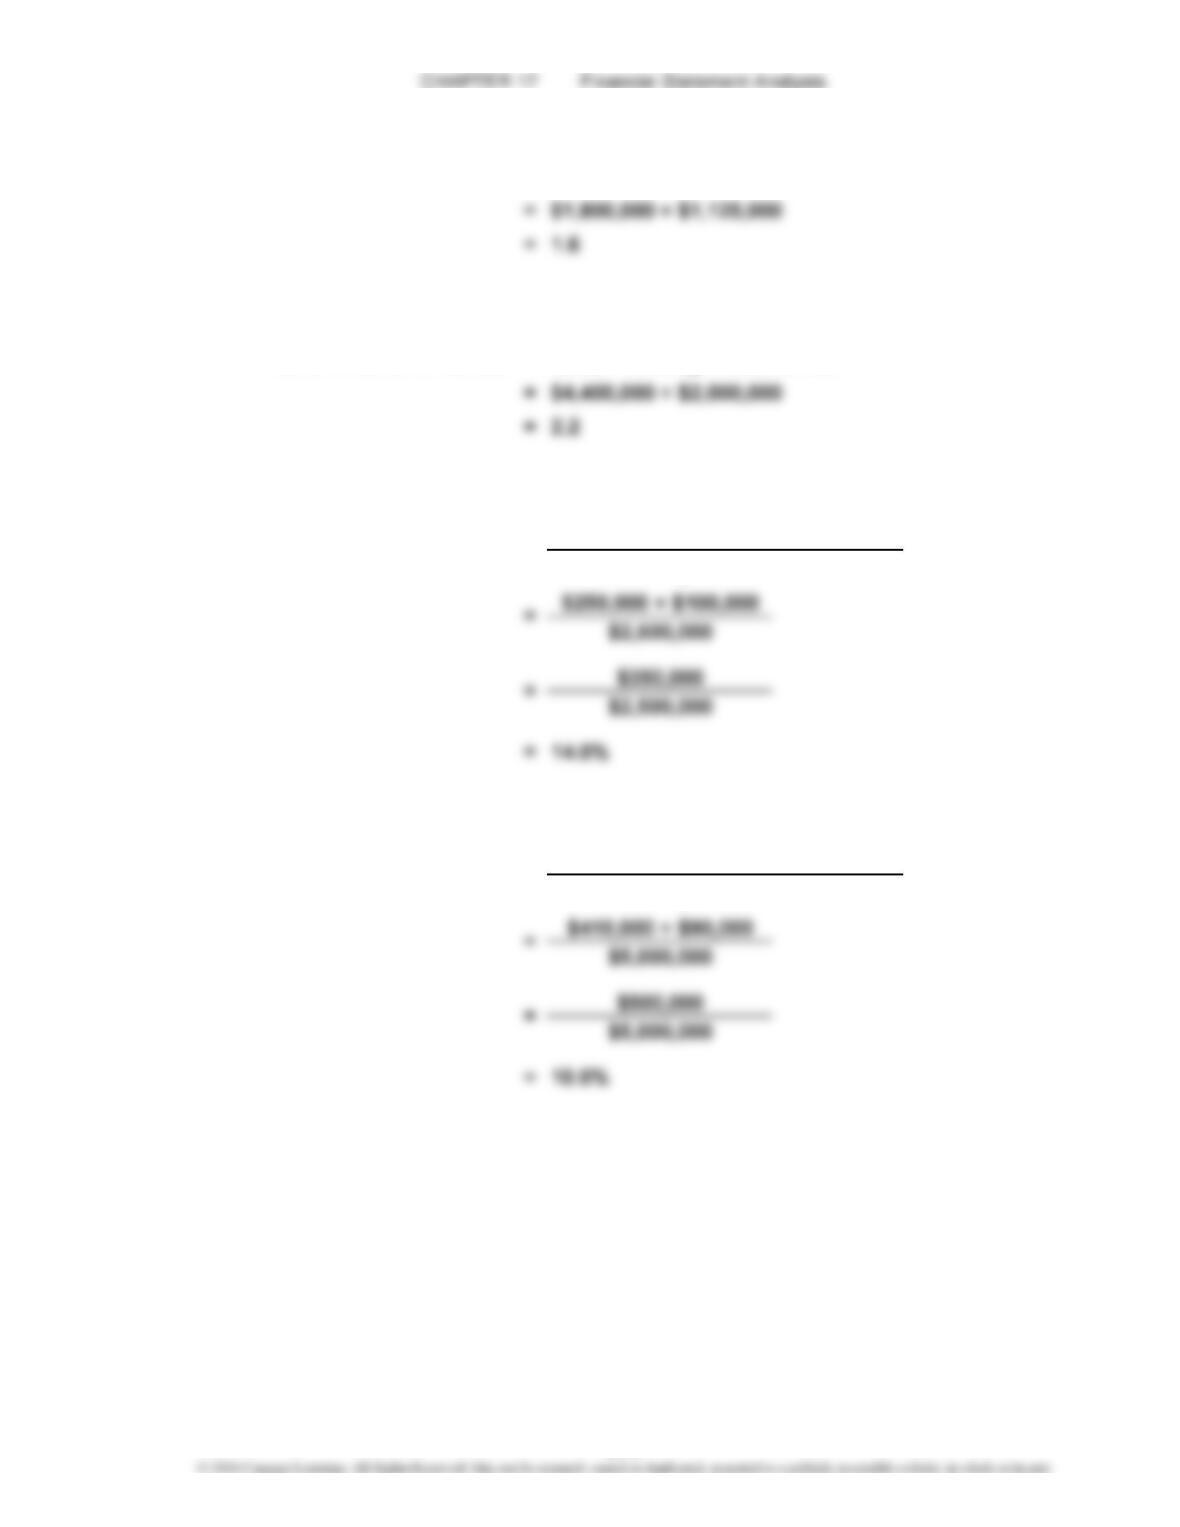
=Ratio of Liabilities to Stockholders’ Equity Total Stockholders’ Equity
Total Liabilities
0.9=
$480,000 + $120,000
$120,000
5.0Current year:
=
Income Before Income Tax + Interest Expense
Interest Expense
=
*
17-20