1. Liquidity is the ability of a company to convert assets into cash. Short-term creditors such as banks
and financial institutions are most concerned with liquidity. Solvency is the ability of a company to
p
ay its debts. Long-term creditors such as bondholders are concerned primarily with a company’s
solvency. Profitability is the ability of a company to generate earnings. Investors such as
stockholders are concerned primarily with profitability because it determines whether the
company’s stock price will increase.
4. Generally, the two ratios would be very close because most service businesses sell services
and hold very little inventory.
5. a. A high inventory turnover minimizes the amount invested in inventories, thus freeing
funds for more advantageous use. Storage costs, administrative expenses, and losses
caused by obsolescence and adverse changes in prices are also kept to a minimum.
b. Yes. The inventory turnover relates to the “turnover” of inventory during the year, while
the number of days’ sales in inventory relates to the amount of inventory on hand at the
b
eginning and end of the year. Therefore, a business could have a high inventory turnover
during the year yet have a high number of days’ sales in inventory based on the
b
eginning and end-of-year inventory amounts.
6. The ratio of fixed assets to long-term liabilities increased from 3.4 ($1,360,000 ÷ $400,000) for
the preceding year to 4.2 ($1,260,000 ÷ $300,000) for the current year, indicating that the
company is in a stronger position now than in the preceding year to borrow additional funds
on a long-term basis.
CHAPTER 17
FINANCIAL STATEMENT ANALYSIS
DISCUSSION QUESTIONS
p
CHAPTER 17 Financial Statement Analysis
DISCUSSION QUESTIONS (Continued)
9. The dividend yield measures the rate of return common stockholders receive from a cash dividend.
The high dividend yield for Suburban Propane indicates that a significant portion of the return to
its shareholders comes in the form of a cash dividend. The lack of a dividend yield for Alphabet
indicates that the return to shareholders comes solely from stock appreciation.
CHAPTER 17 Financial Statement Analysis
PE 17-1A
or (4)% ($3,000 ÷ $75,000)
PE 17-1B
Accounts payable…………
…
$24,000 decrease ($176,000 – $200,000),
or (12)% ($24,000 ÷ $200,000)
Long-term debt……………… $13,950 increase ($168,950 – $155,000),
or 9% ($13,950 ÷ $155,000)
PE 17-2A
Amount Percentage
…
…
…
PE 17-2B
Amount Percentage
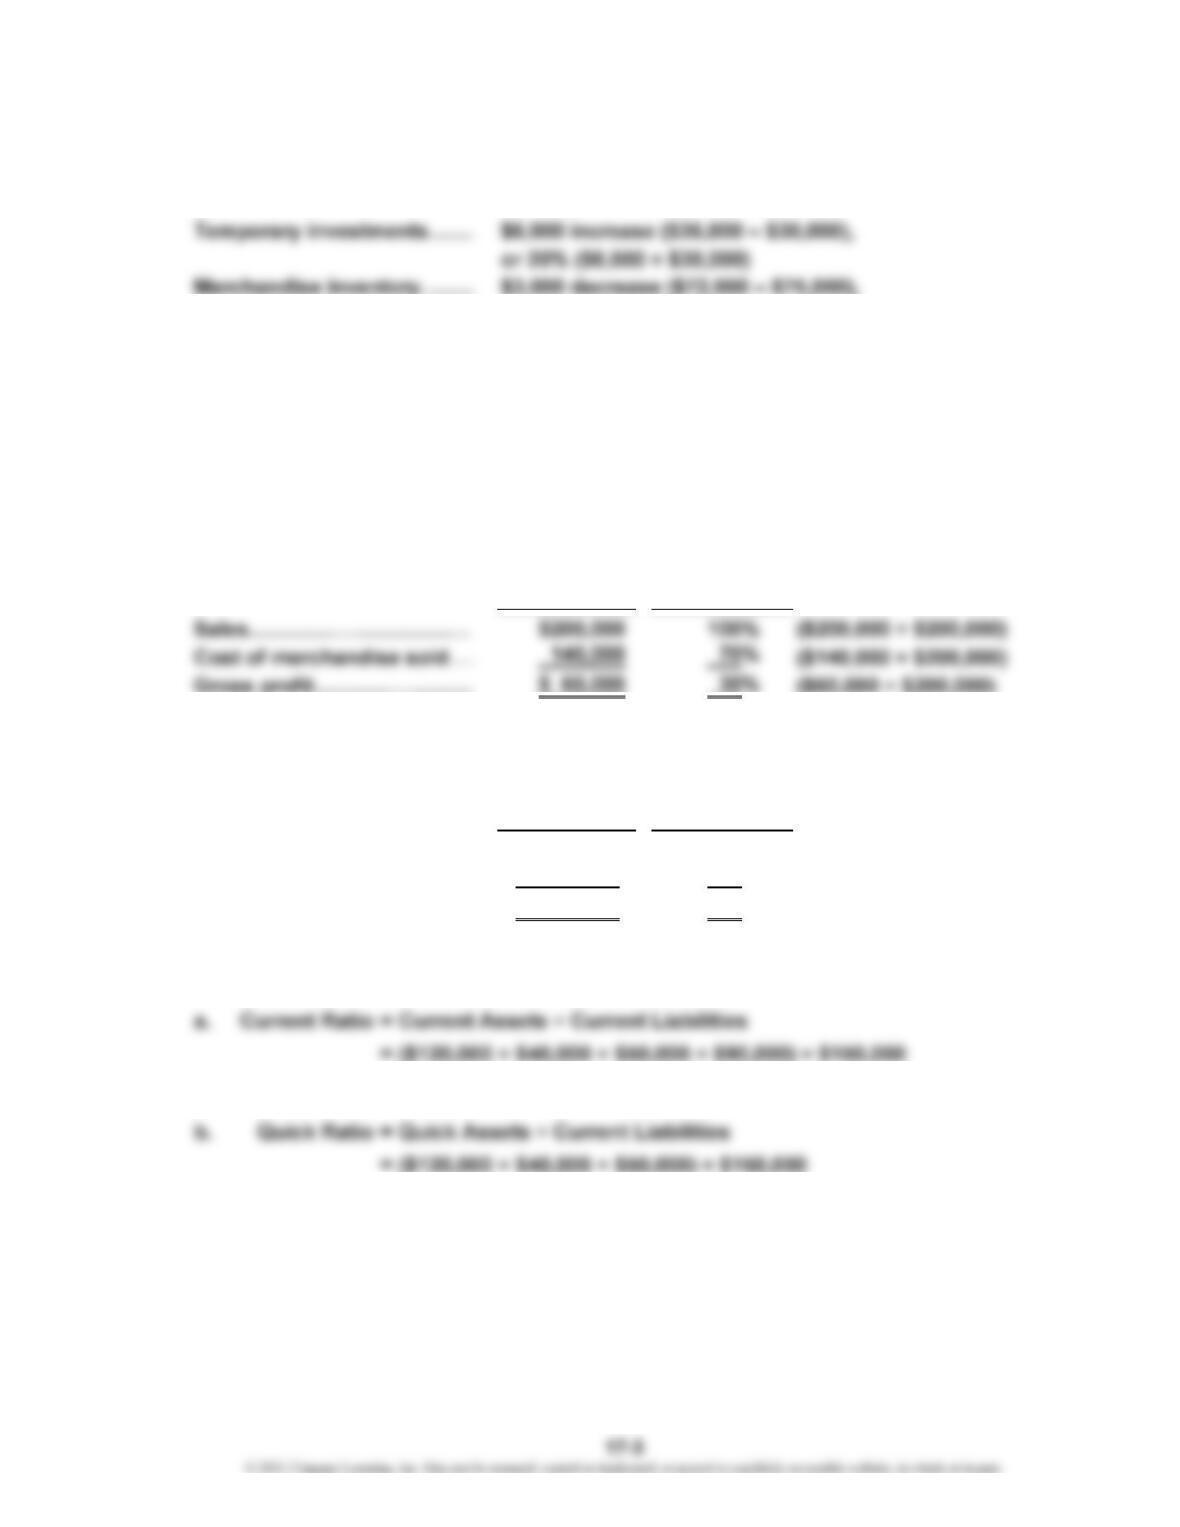
Sales…………………………
…
$1,400,000 100% ($1,400,000 ÷ $1,400,000)
Cost of merchandise sold…
…
812,000 58% ($812,000 ÷ $1,400,000)
Gross profit…………………
…
$ 588,000 42% ($588,000 ÷ $1,400,000)
PE 17-3A
= 2.0
= 1.4
PRACTICE EXERCISES
CHAPTER 17 Financial Statement Analysis
PE 17-3B
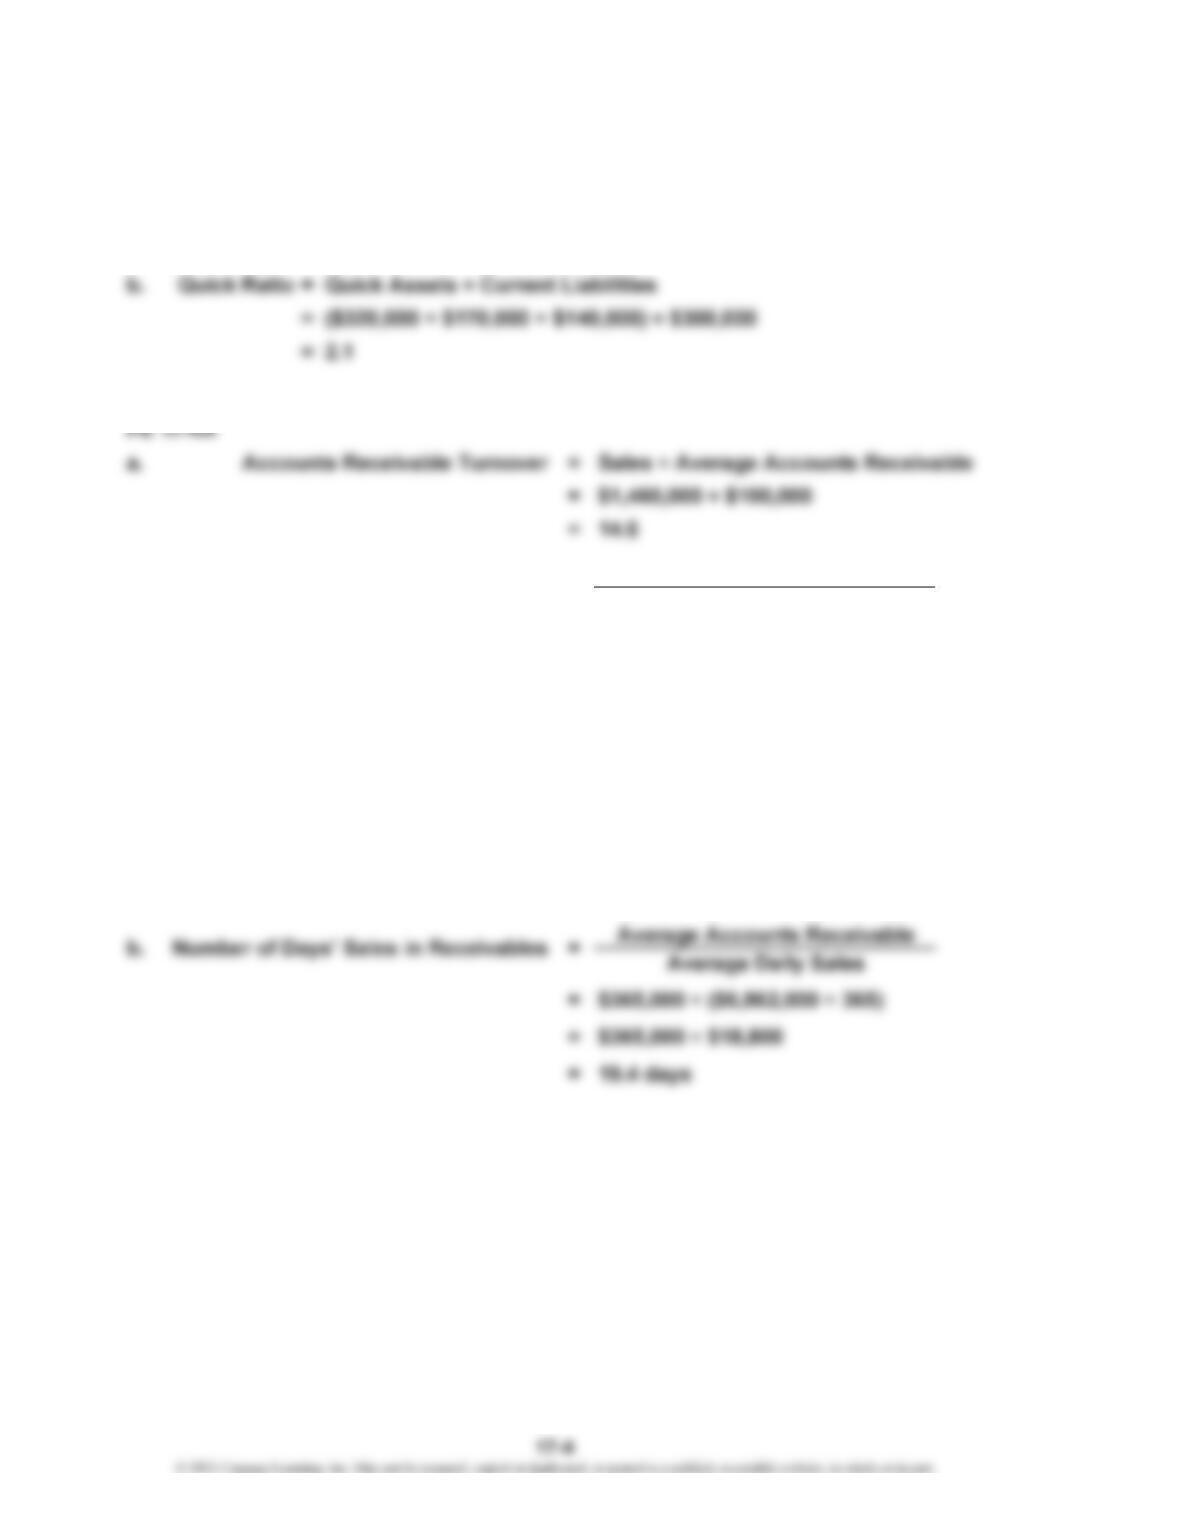
a. Current Ratio = Current Assets ÷ Current Liabilities
= ($320,000 + $170,000 + $140,000 + $450,000) ÷ $300,000
= 3.6
Average Accounts Receivable
Average Daily Sales
= $100,000 ÷ ($1,460,000 ÷ 365)
= $100,000 ÷ $4,000
= 25.0 days
PE 17-4B
a. =Sales ÷ Average Accounts Receivable
=$6,862,000 ÷ $365,000
=18.8
b. =Number of Days’ Sales in Receivables
Accounts Receivable Turnover
CHAPTER 17 Financial Statement Analysis
PE 17-5A
a. Inventory Turnover = Cost of Merchandise Sold ÷ Average Merchandise Inventory
= $558,000 ÷ $45,000
= 12.4
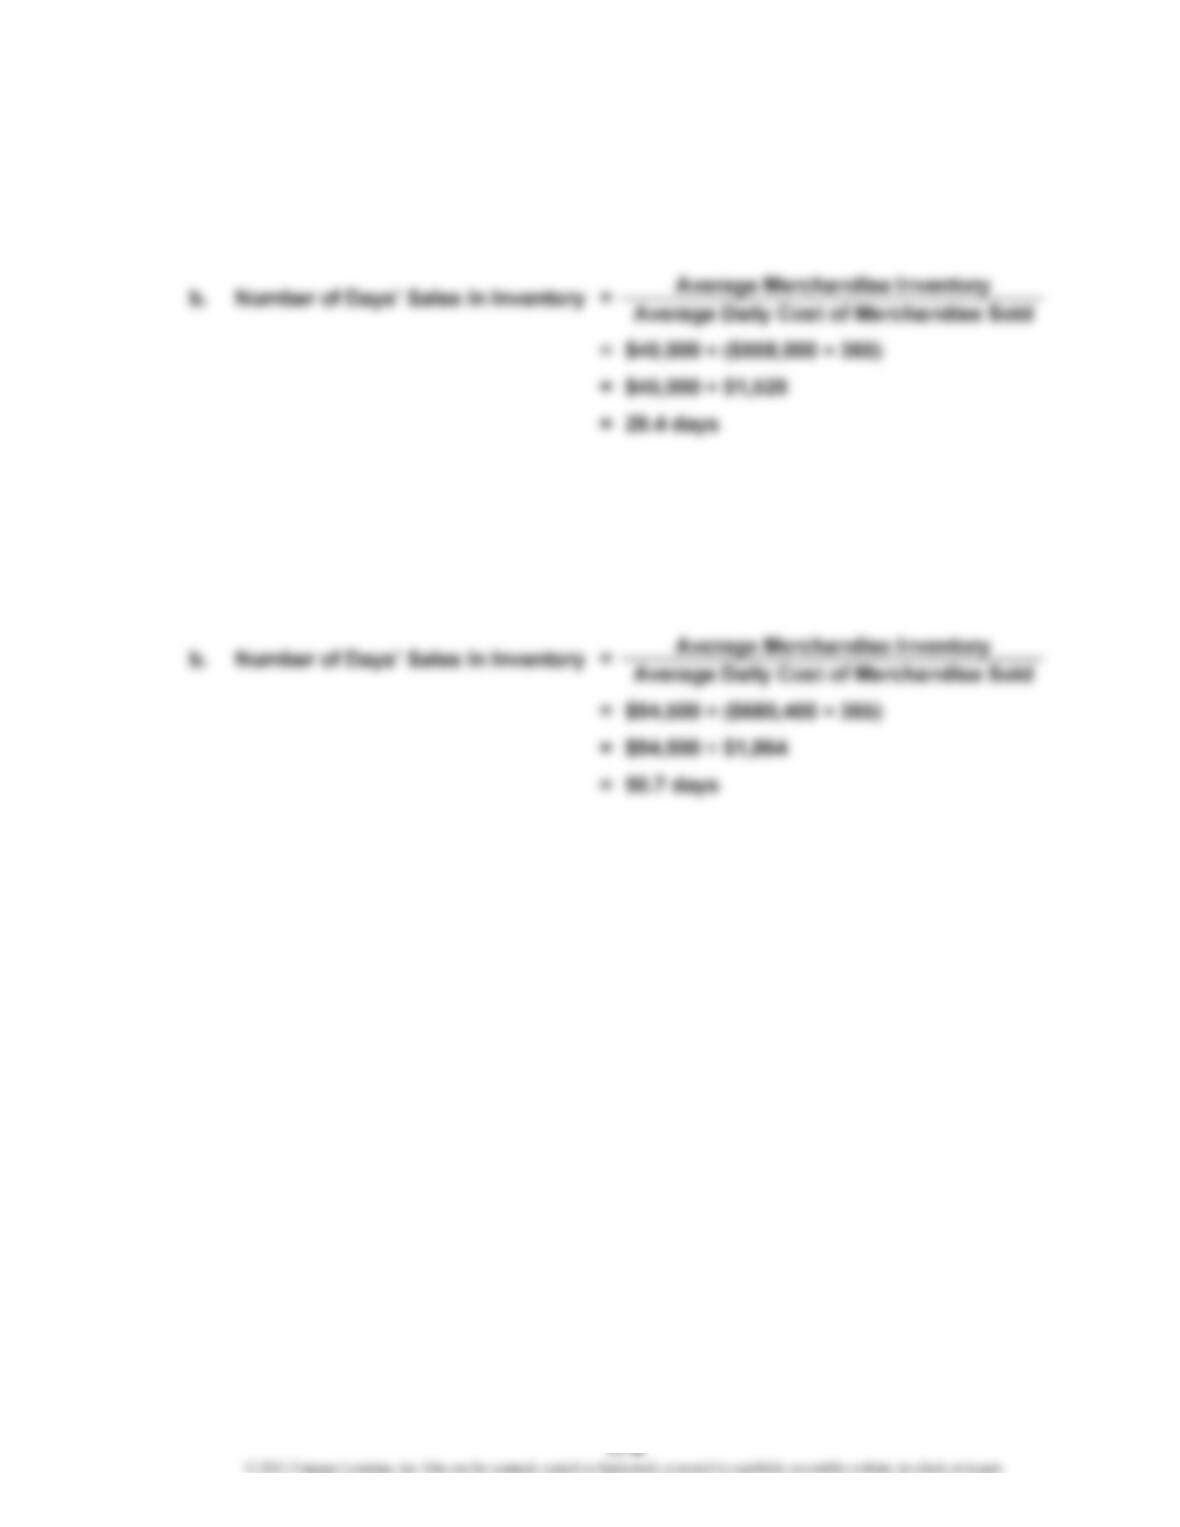
PE 17-5B
a. Inventory Turnover = Cost of Merchandise Sold ÷ Average Merchandise Inventory
= $680,400 ÷ $94,500
= 7.2
CHAPTER 17 Financial Statement Analysis
PE 17-6A
=
=
PE 17-6B
=
=
PE 17-7A
a.
=
a. =
Ratio of Fixed Assets to Long-Term Liabilities
=
$300,000
Fixed Assets
Long-Term Liabilities
$630,000 ÷ $140,000
Ratio of Fixed Assets to Long-Term Liabilities
=
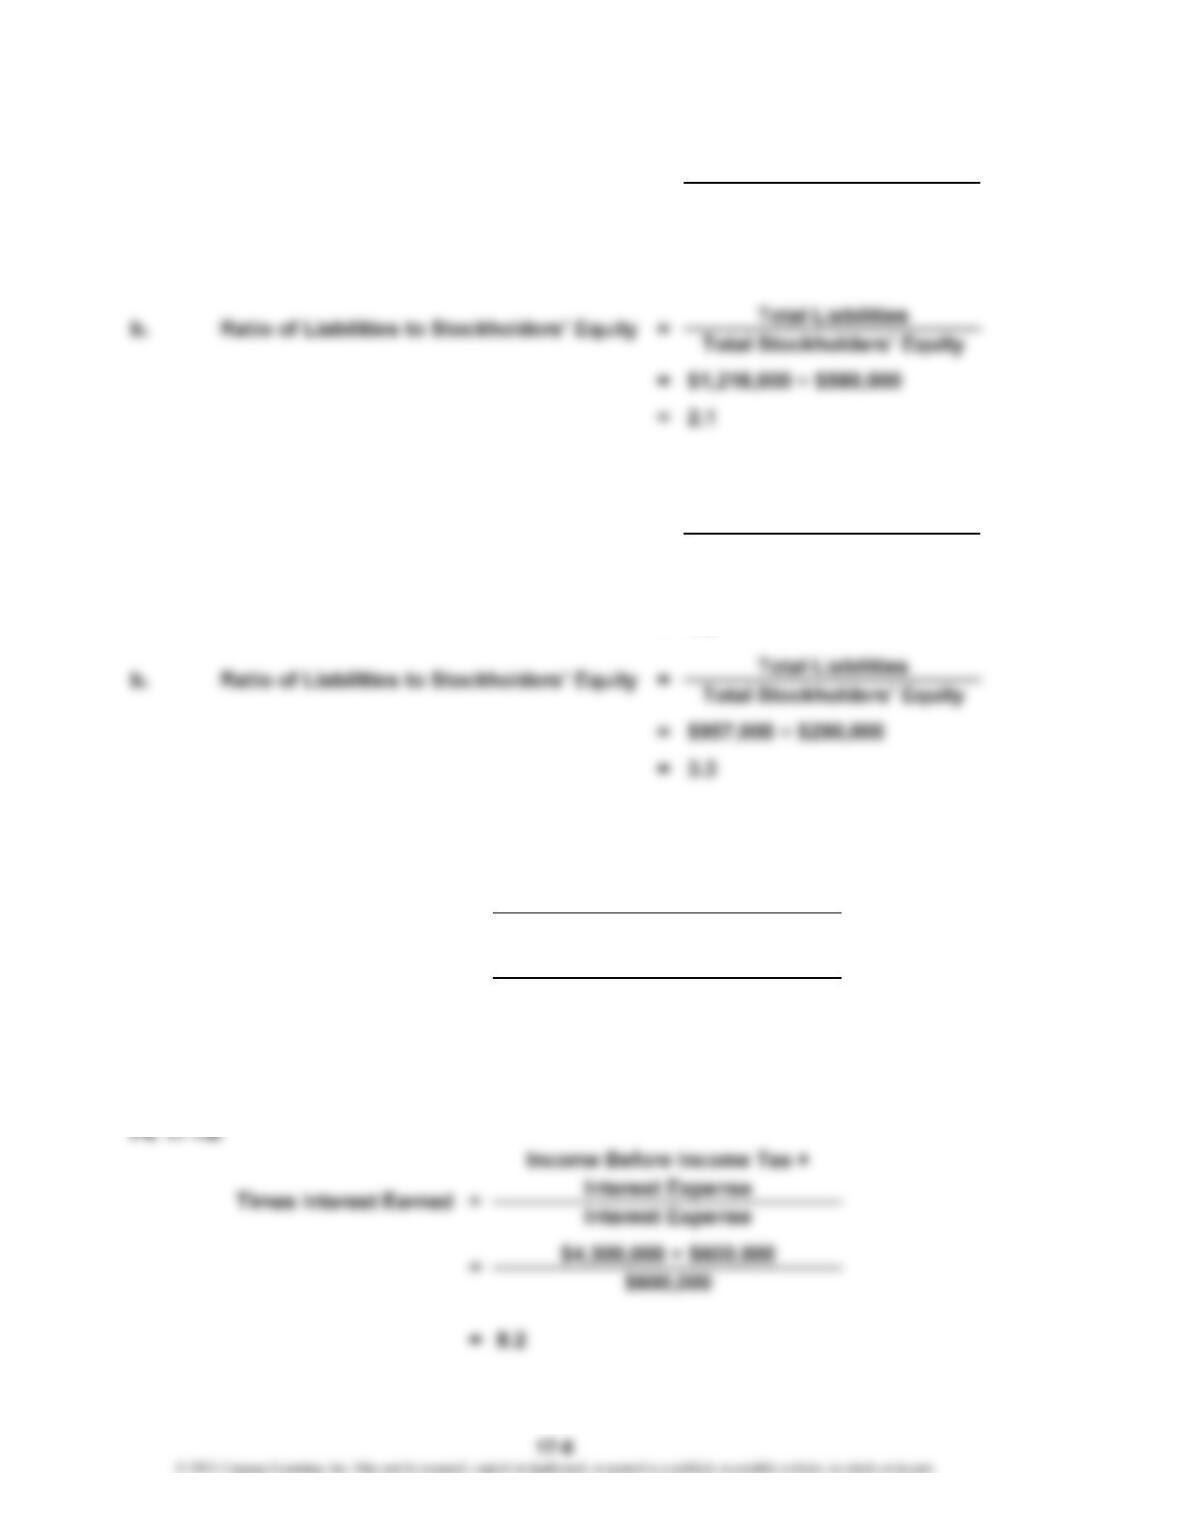
Times Interest Earned
=
Income Before Income Tax +
Interest Expense
Interest Expense
$6,000,000 + $300,000
21.0
Fixed Assets
Long-Term Liabilities
$774,000 ÷ $430,000
1.8
4.5
CHAPTER 17 Financial Statement Analysis
PE 17-8A
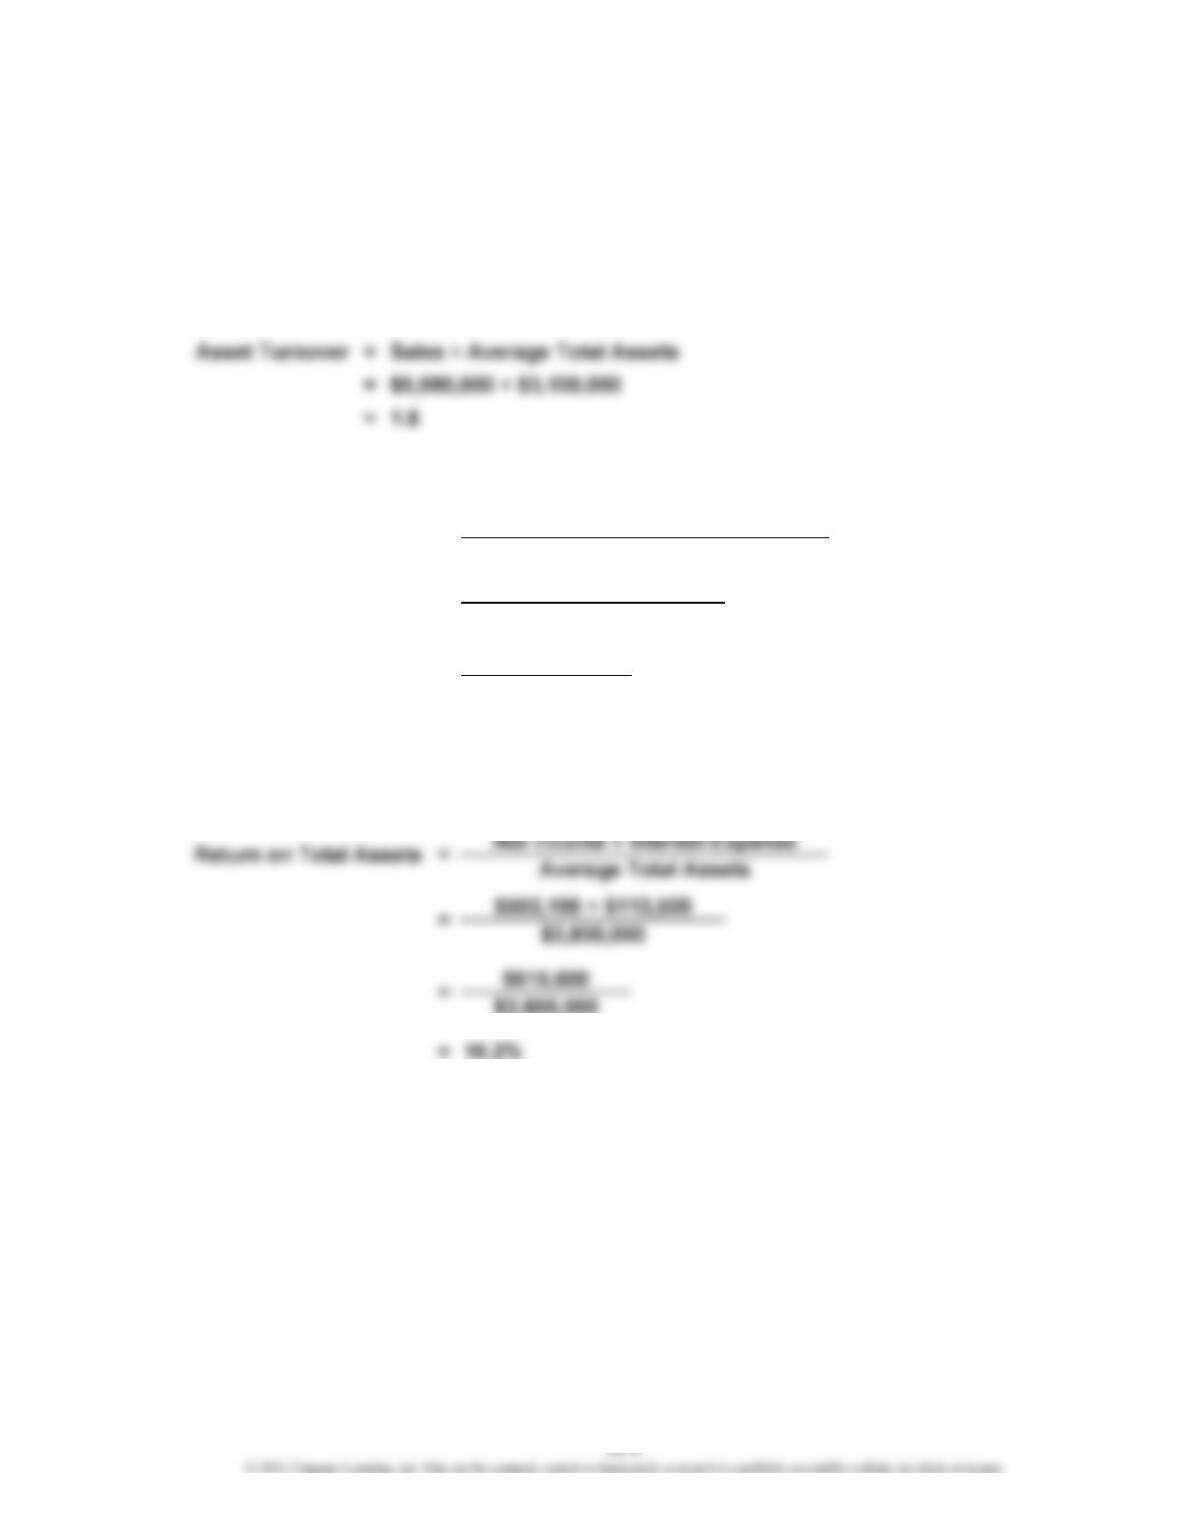
Asset Turnover = Sales ÷ Average Total Assets
= $6,480,000 ÷ $2,400,000
= 2.7
PE 17-8B
PE 17-9A
$187,000
$1,700,000
= 11.0%
PE 17-9B
=
=
=
Return on Total Assets Net Income + Interest Expense
Average Total Assets
$110,000 + $77,000
$1,700,000
CHAPTER 17 Financial Statement Analysis
PE 17-10A
= $750,000 ÷ $5,000,000
= 15.0%
PE 17-10B
= $500,000 ÷ $3,125,000
= 16.0%
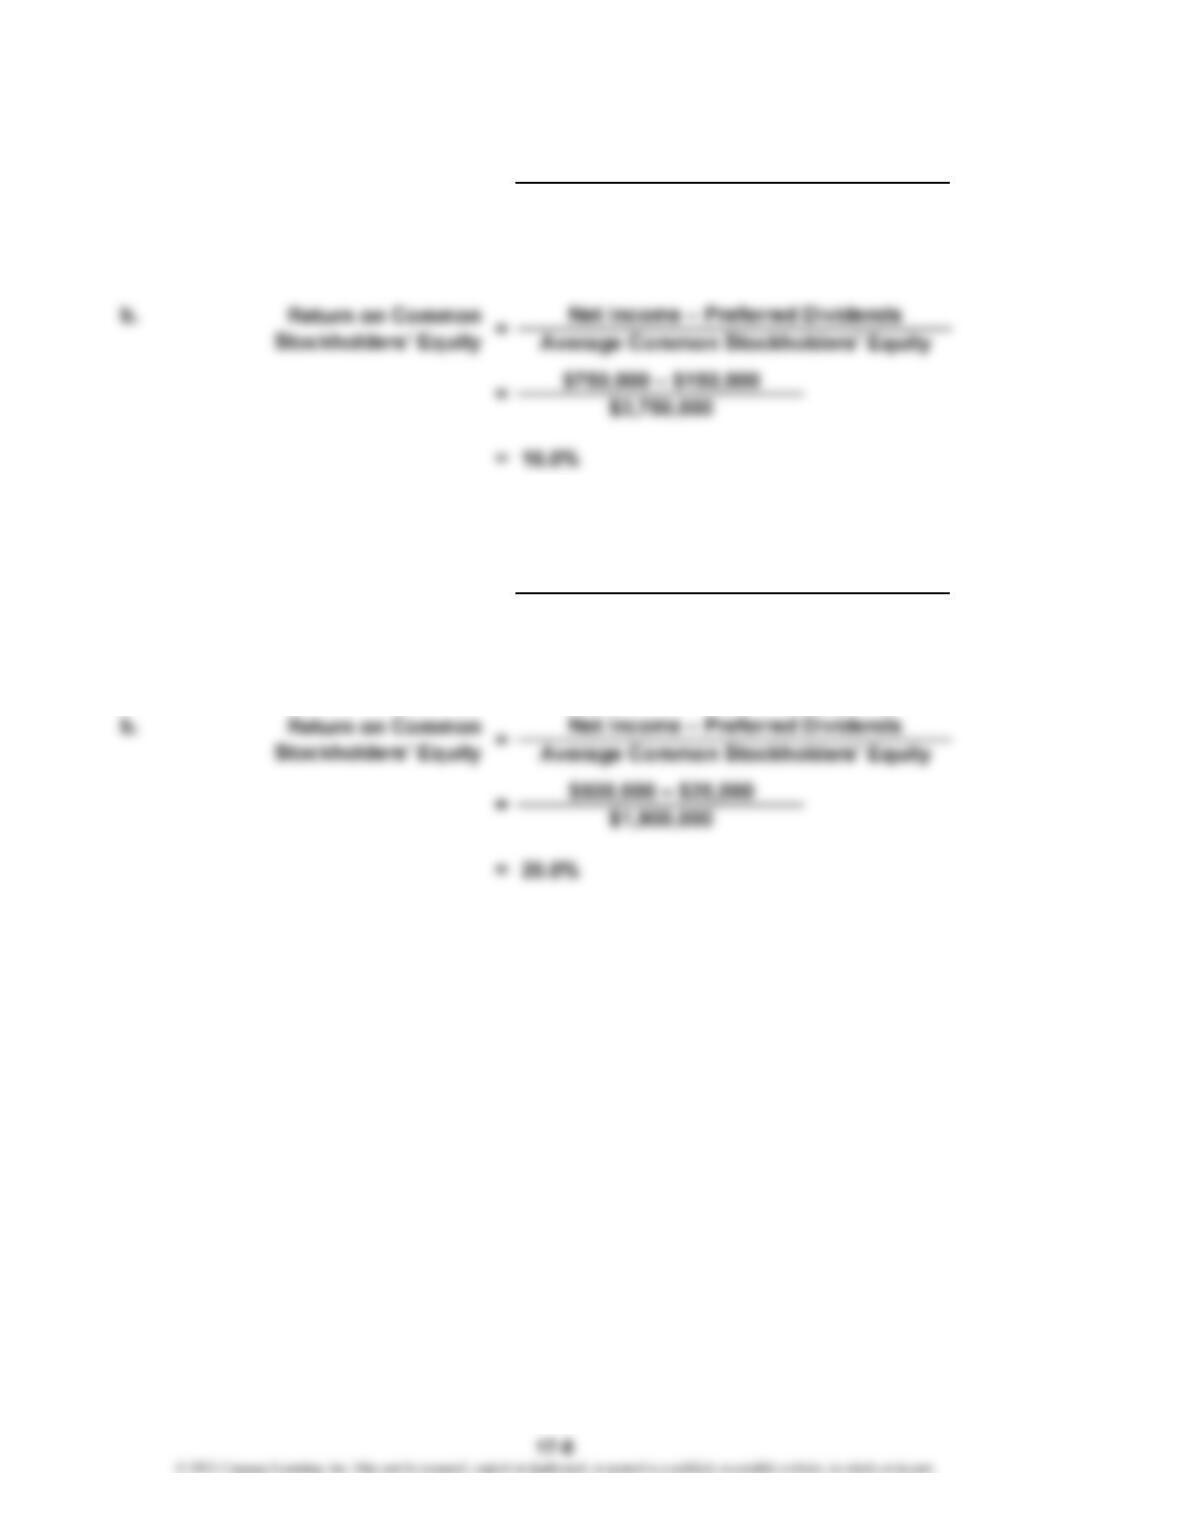
Net Income
Average Stockholders’ Equity
Return on Stockholders’ Equity Net Income
Average Stockholders’ Equity
a. =Return on Stockholders’ Equity
a. =
CHAPTER 17 Financial Statement Analysis
PE 17-11A
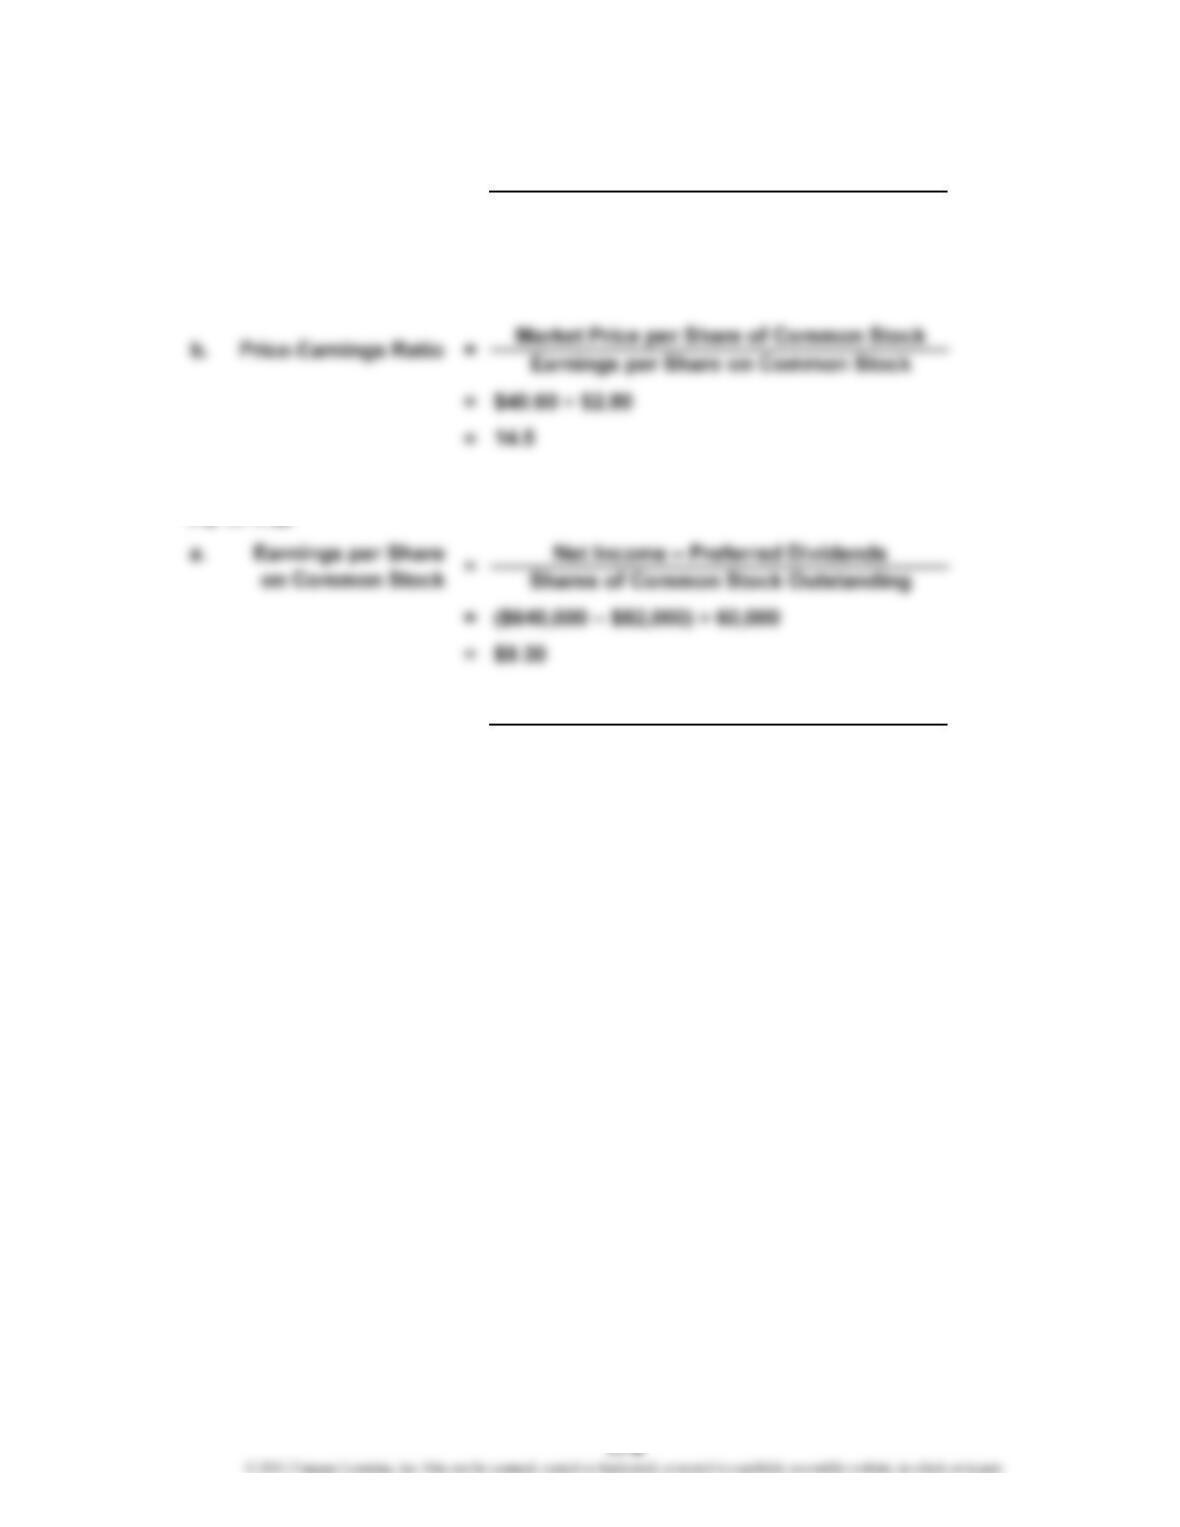
= ($460,000 – $40,000) ÷ 150,000
=
=
=
a. =
Earnings per Share
on Common Stock
Net Income – Preferred Dividends
Shares of Common Stock Outstanding
13.0
$2.80
b. Market Price per Share of Common Stock
Earnings per Share on Common Stock
$120.90 ÷ $9.30
Price-Earnings Ratio =
CHAPTER 17 Financial Statement Analysis
Ex. 17-1
a.
Amount Percent Amount Percent
Sales $4,000,000 100% $3,600,000 100%
Income tax expense 240,000 6% 216,000 6%
Net income $ 360,000 9% $ 504,000 14%
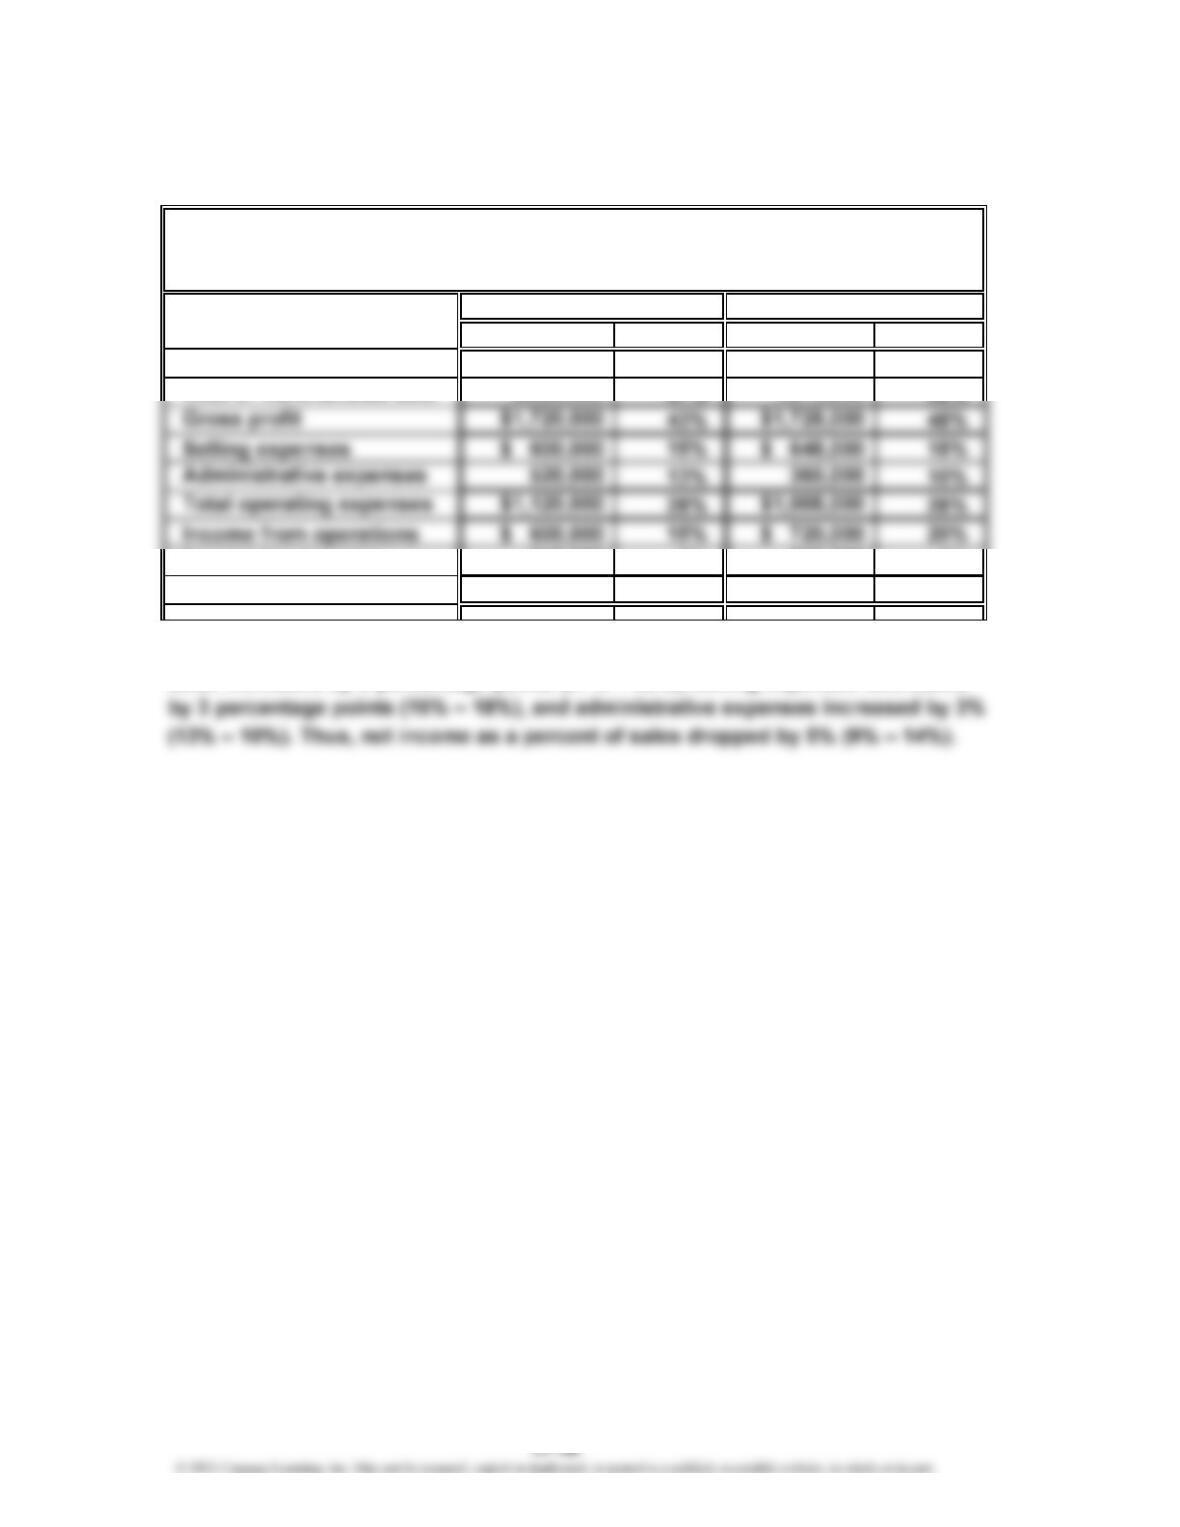
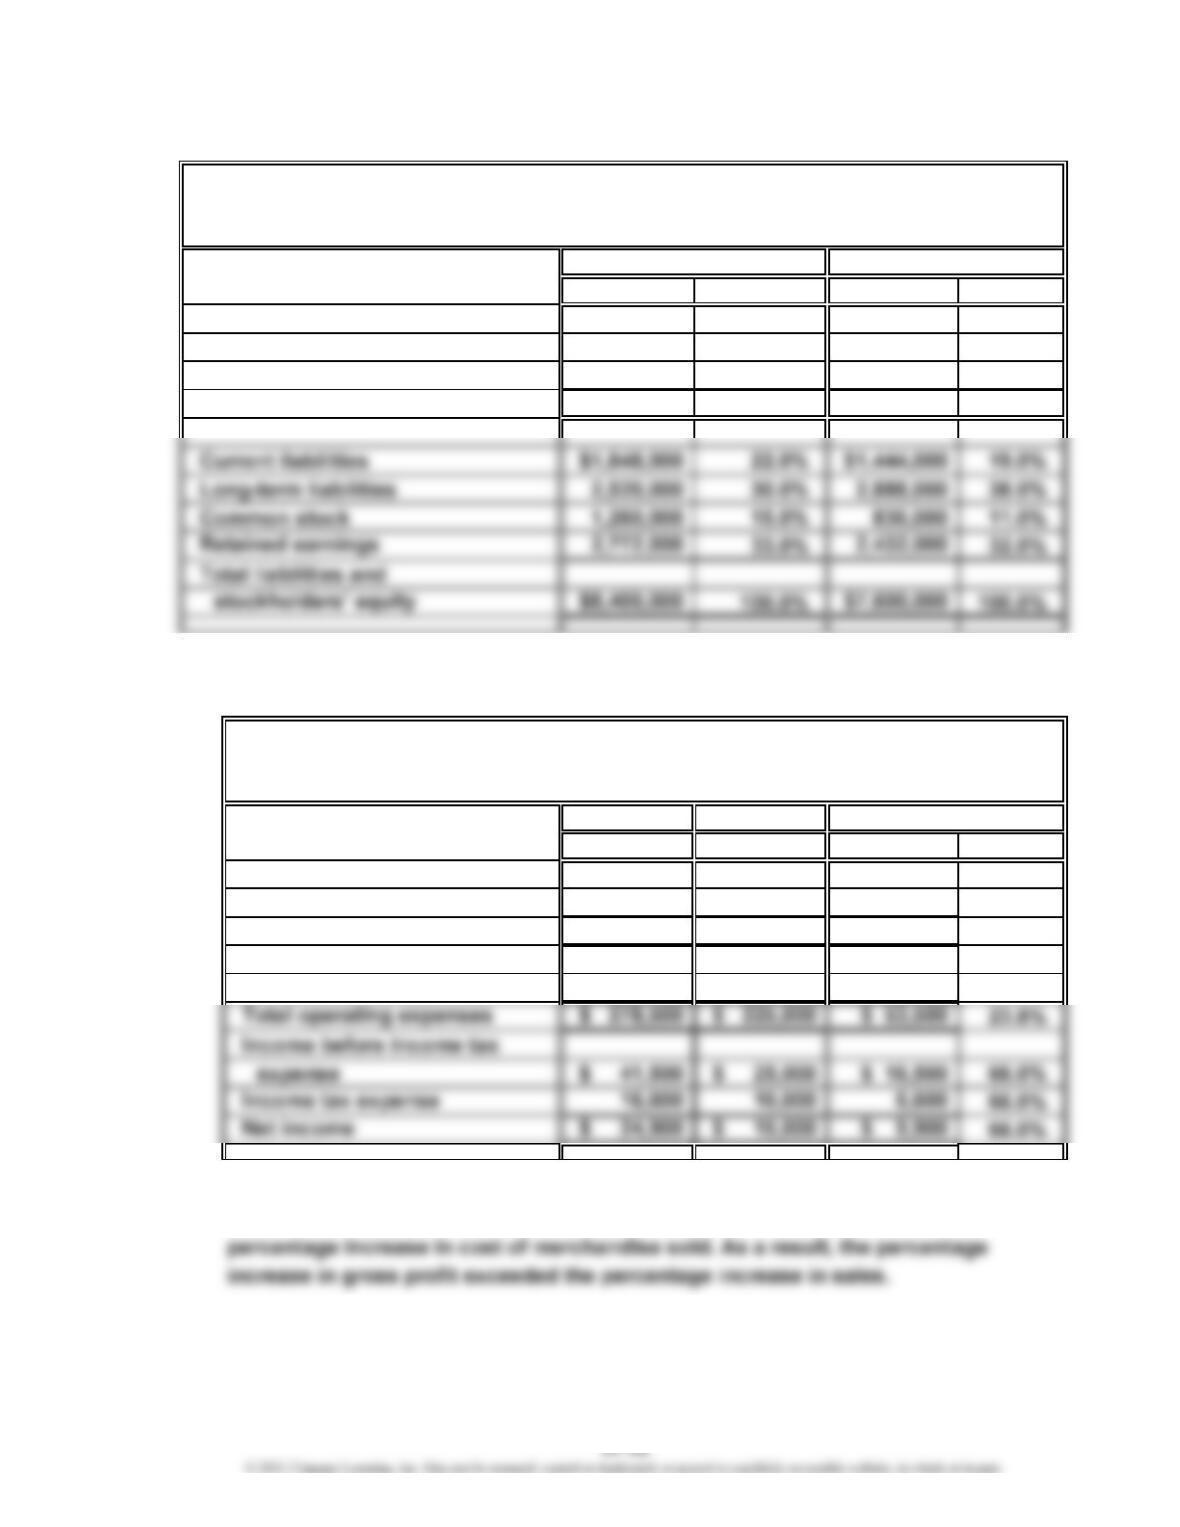
b. The vertical analysis indicates that the cost of merchandise sold as a percent of
Current Year Prior Year
EXERCISES
Innovation Quarter Inc.
Comparative Income Statement
For the Years Ended December 31
CHAPTER 17 Financial Statement Analysis
Ex. 17-2
a.
Amount Percent Amount Percent
Revenues:
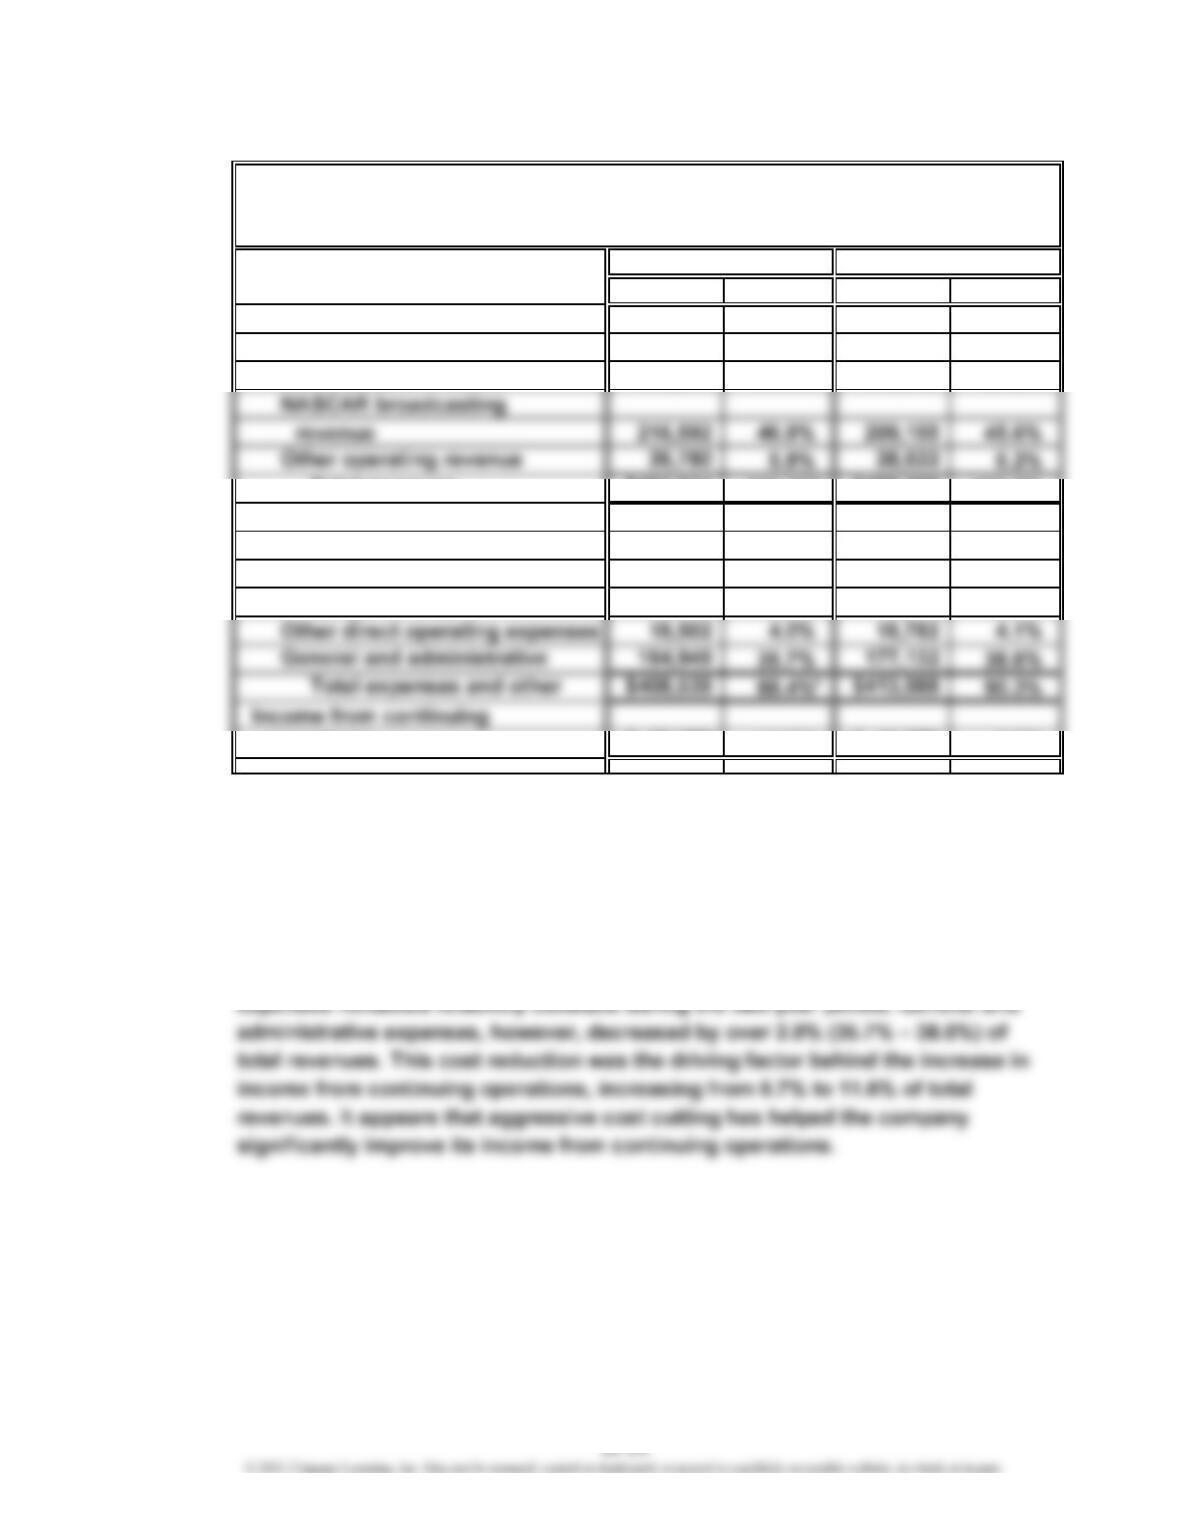
Admissions $ 78,332 17.0% $ 86,949 19.0%
Event-related revenue 140,210 30.4% 133,632 29.2%
Total revenues $461,914 100.0% $458,358 100.0%
Expenses and other:
Direct expense of events $101,876 22.1% $ 98,973 21.6%
NASCAR event
management fees 123,212 26.7% 119,101 26.0%
operations $ 53,375 11.6% $ 44,370 9.7%
*
Totals may differ because of rounding.
b. Overall revenue increased some between the two years, accompanied by a slight
change in the overall mix of revenue sources. The NASCAR broadcasting revenue
increased by 1.3% (46.9% – 45.6%) of total revenues, and event-related revenue
increased by 1.2% (30.4% – 29.2%) of total revenues. One of the major expense
categories, NASCAR event management fees, increased by 0.7% (26.7% – 26.0%)
of total revenues. The direct expense of events and other direct operating
Current Year Prior Year
Speedway Motorsports, Inc.
Comparative Income Statement (in thousands of dollars)
For the Years Ended December 31
*
CHAPTER 17 Financial Statement Analysis
Ex. 17-3
a.
Amount Percent
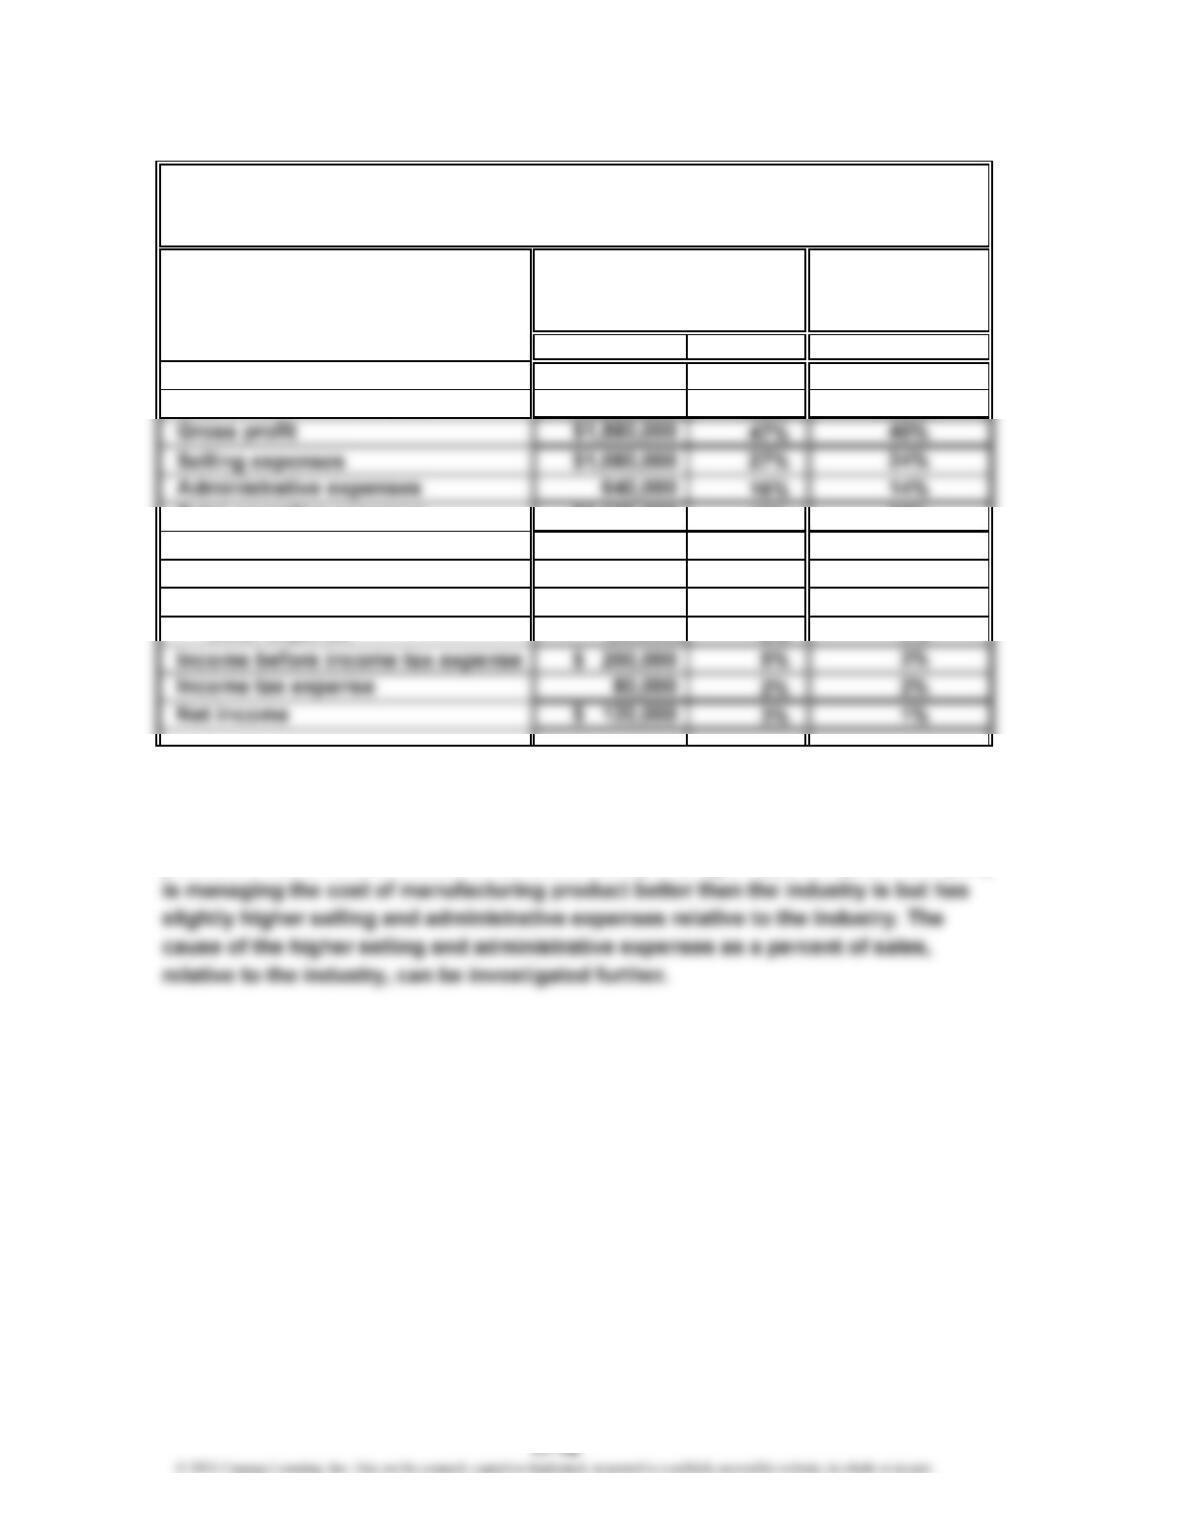
Sales $4,000,000 100%
Cost of merchandise sold 2,120,000 53%
Total operating expenses $1,720,000 43%
Income from operations $ 160,000 4%
Other revenue and expense:
Other revenue 120,000 3%
b. The cost of merchandise sold is 7% (60% – 53%) lower than the industry average,
but the selling expenses and administrative expenses are 3% and 2% higher than
the industry average, respectively. The combined impact causes net income as a
percent of sales to be 2% better than the industry average. Apparently, the company
60%
Tannenhill Company
Common-Sized Income Statement
For the Year Ended December 31
38%
2%
3%
Tannenhill
Company
Industry
Average
Electronics
100%
CHAPTER 17 Financial Statement Analysis
Ex. 17-4
Amount Percent Amount Percent
Current assets $2,352,000 28.0% $1,900,000 25.0%
Property, plant, and equipment 4,536,000 54.0% 4,712,000 62.0%
Intangible assets 1,512,000 18.0% 988,000 13.0%
Total assets $8,400,000 100.0% $7,600,000 100.0%
Ex. 17-5
a.
Current Year Prior Year
Amount Amount Amount Percent
Sales $2,280,000 $2,000,000 $280,000 14.0%
Cost of merchandise sold 1,960,000 1,750,000 210,000 12.0%
Gross profit $ 320,000 $ 250,000 $ 70,000 28.0%
Selling expenses $ 156,500 $ 125,000 $ 31,500 25.2%
Administrative expenses 122,000 100,000 22,000 22.0%
b. The net income for Winthrop Company increased by 66% between years. This
increase was the combined result of an increase in sales of 14% and a lower
Kwan Company
Comparative Balance Sheet
For the Years Ended December 31
Increase (Decrease)
Winthrop Company
Comparative Income Statement
For the Years Ended December 31
Current Year Prior Year
CHAPTER 17 Financial Statement Analysis
Ex. 17-6
a. (1) Working Capital = Current Assets – Current Liabilities
Current year: $1,120,000 = $1,820,000 – $700,000
Prior year: $720,000 = $1,320,000 – $600,000
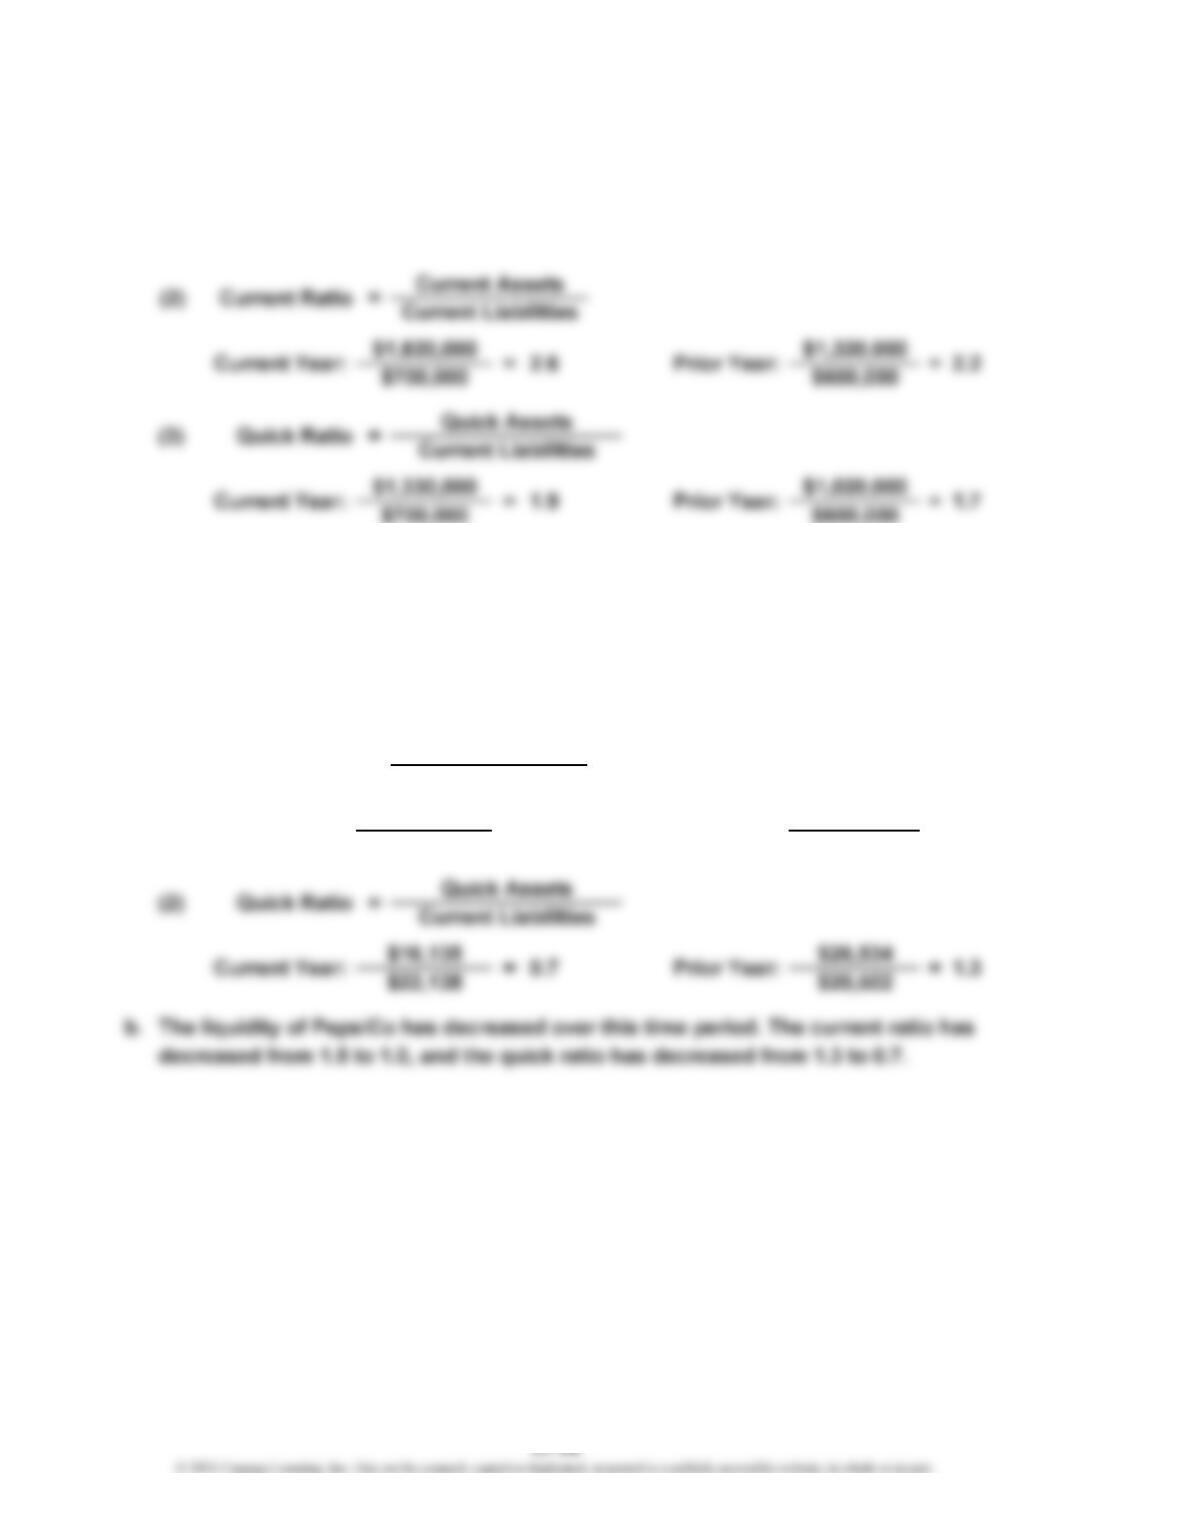
b. The liquidity of Albertini has improved from the preceding year to the current year.
The working capital, current ratio, and quick ratio have all increased. Most of
these changes are the result of an increase in current assets relative to current
liabilities.
Ex. 17-7
Current Year: $21,893 Prior Year:
Current Assets
Current Liabilities
$31,027
= 1.5
$22,138 $20,502
= 1.0
a.
=Current Ratio(1)
CHAPTER 17 Financial Statement Analysis
Ex. 17-8
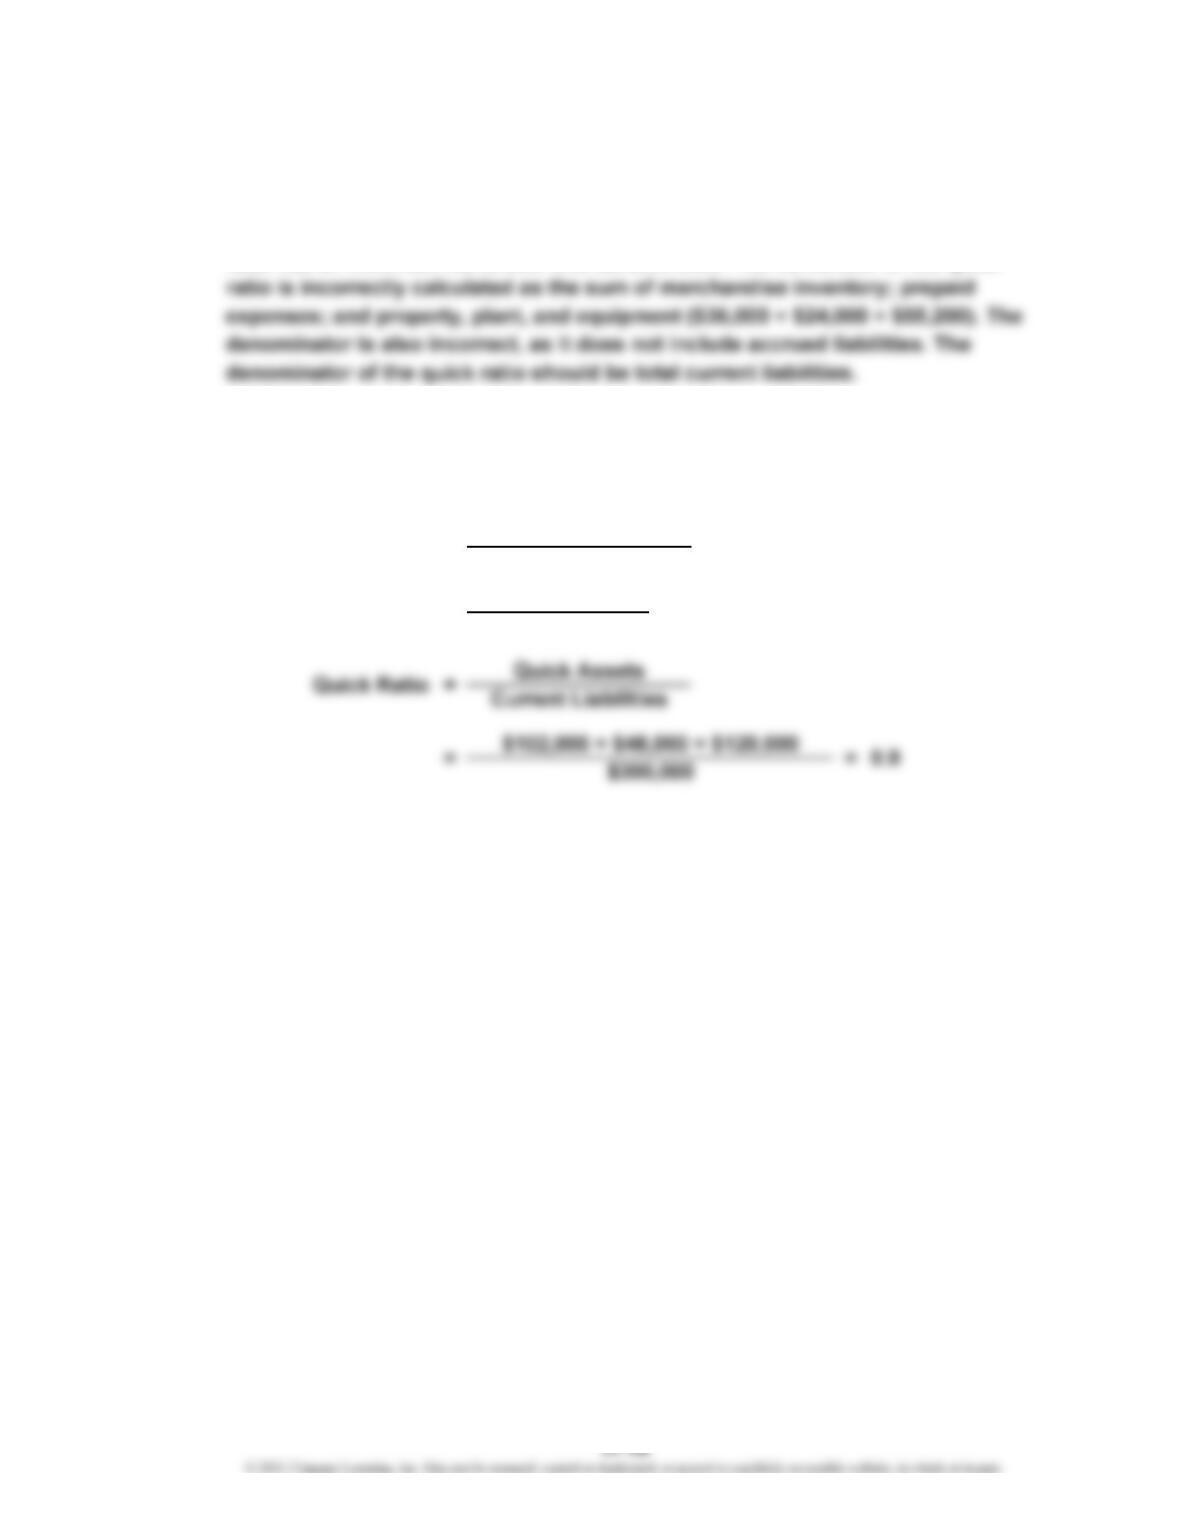
a. The working capital, current ratio, and quick ratio are calculated incorrectly. The
working capital and current ratio incorrectly include intangible assets and property,
plant, and equipment as a part of current assets. Both are noncurrent. The quick
ratio has an incorrect numerator and denominator. The numerator of the quick
The correct calculations are as follows:
= Current Assets – Current Liabilities
= $330,000 – $300,000
b. Unfortunately, the working capital, current ratio, and quick ratio are below the
minimum threshold required by the bond indenture. This may require the company
to renegotiate the bond contract, including a possible unfavorable change in the
interest rate.
1.1
$330,000
Working Capital
$30,000
Current Assets
Current Liabilities
=
=
$300,000
=
Current Ratio
CHAPTER 17 Financial Statement Analysis
Ex. 17-9
$448,400
$11,302
1
2
Average daily sales = $11,302 = $4,125,280 ÷ 365 days
3
4
Average daily sales = $9,171 = $3,347,400 ÷ 365 days
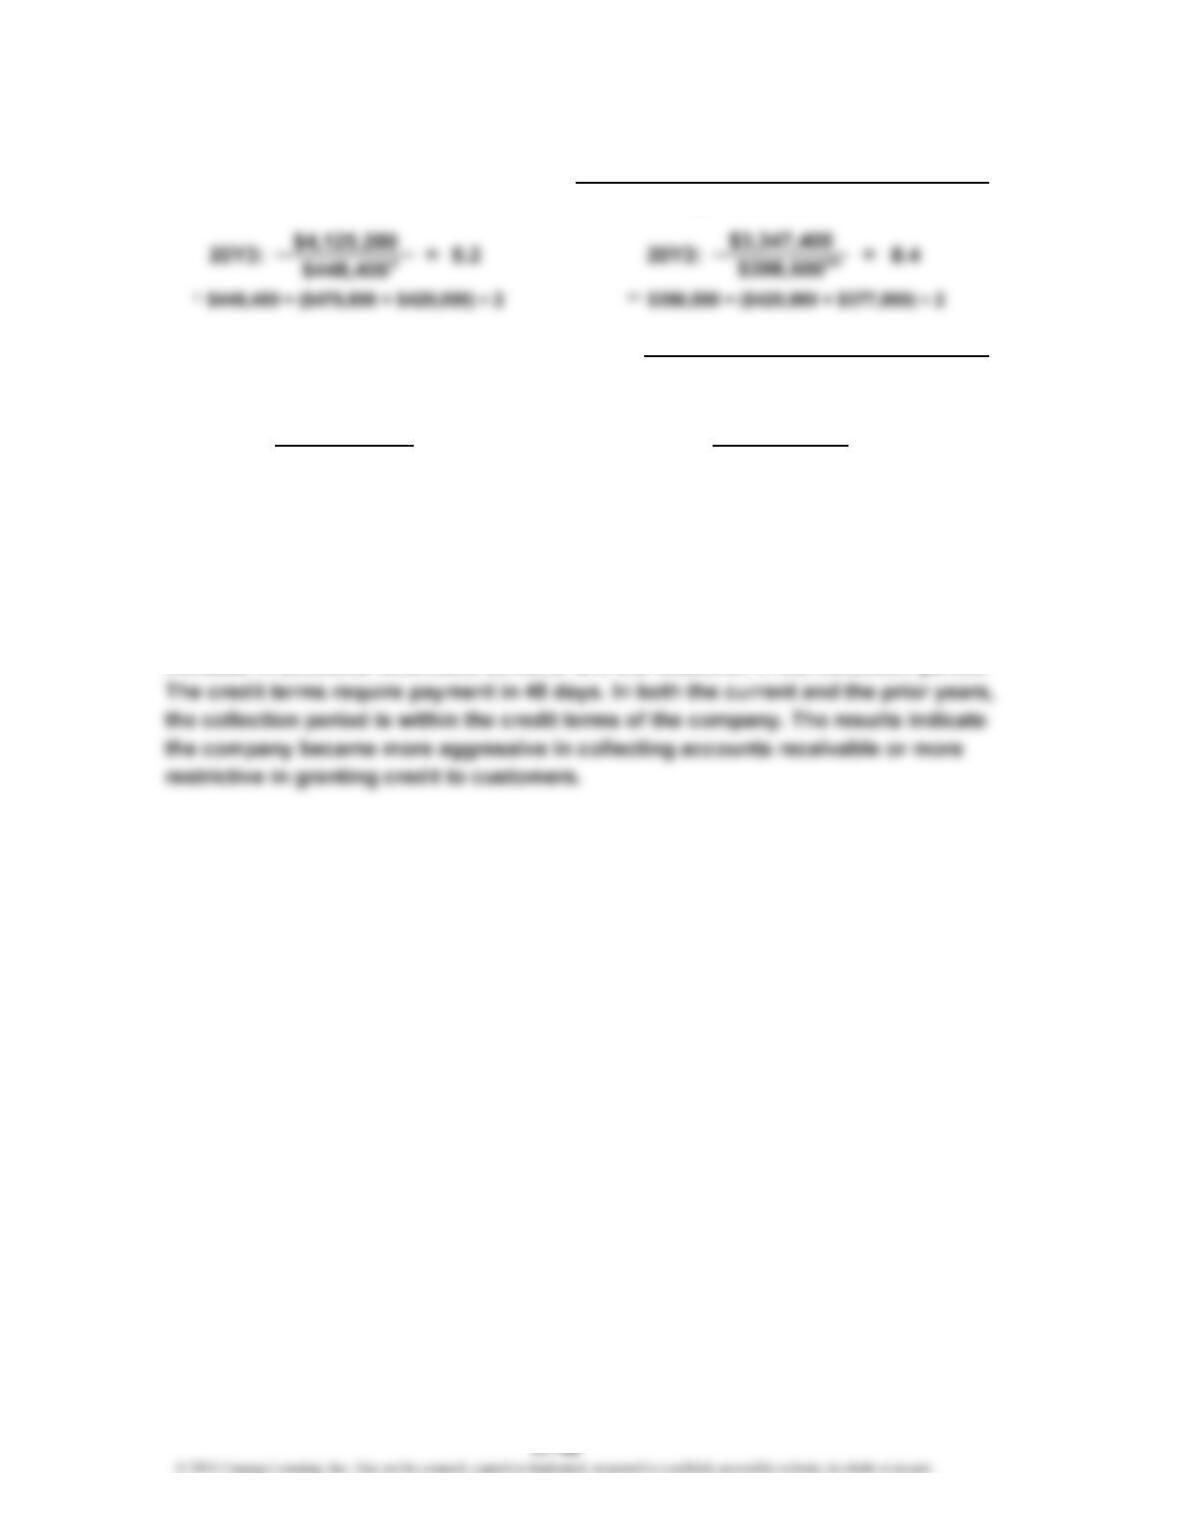
b. The collection of accounts receivable has improved. This can be seen in both the
Average accounts receivable = $448,400 = ($476,800 + $420,000) ÷ 2
Average accounts receivable = $398,500 = ($420,000 + $377,000) ÷ 2
a. (1) =
Accounts Receivable Turnover
Average Accounts Receivable
Sales
43.5 days
$398,500 =
(2)
$9,171
20Y3: = 39.7 days 20Y2:
=Number of Days’ Sales in Receivables Average Accounts Receivable
Average Daily Sales
1
2
3
4
CHAPTER 17 Financial Statement Analysis
*
Average daily sales = $23,287.7 = $8,500,000 ÷ 365 days
**
Average daily sales = $12,561.6 = $4,585,000 ÷ 365 days
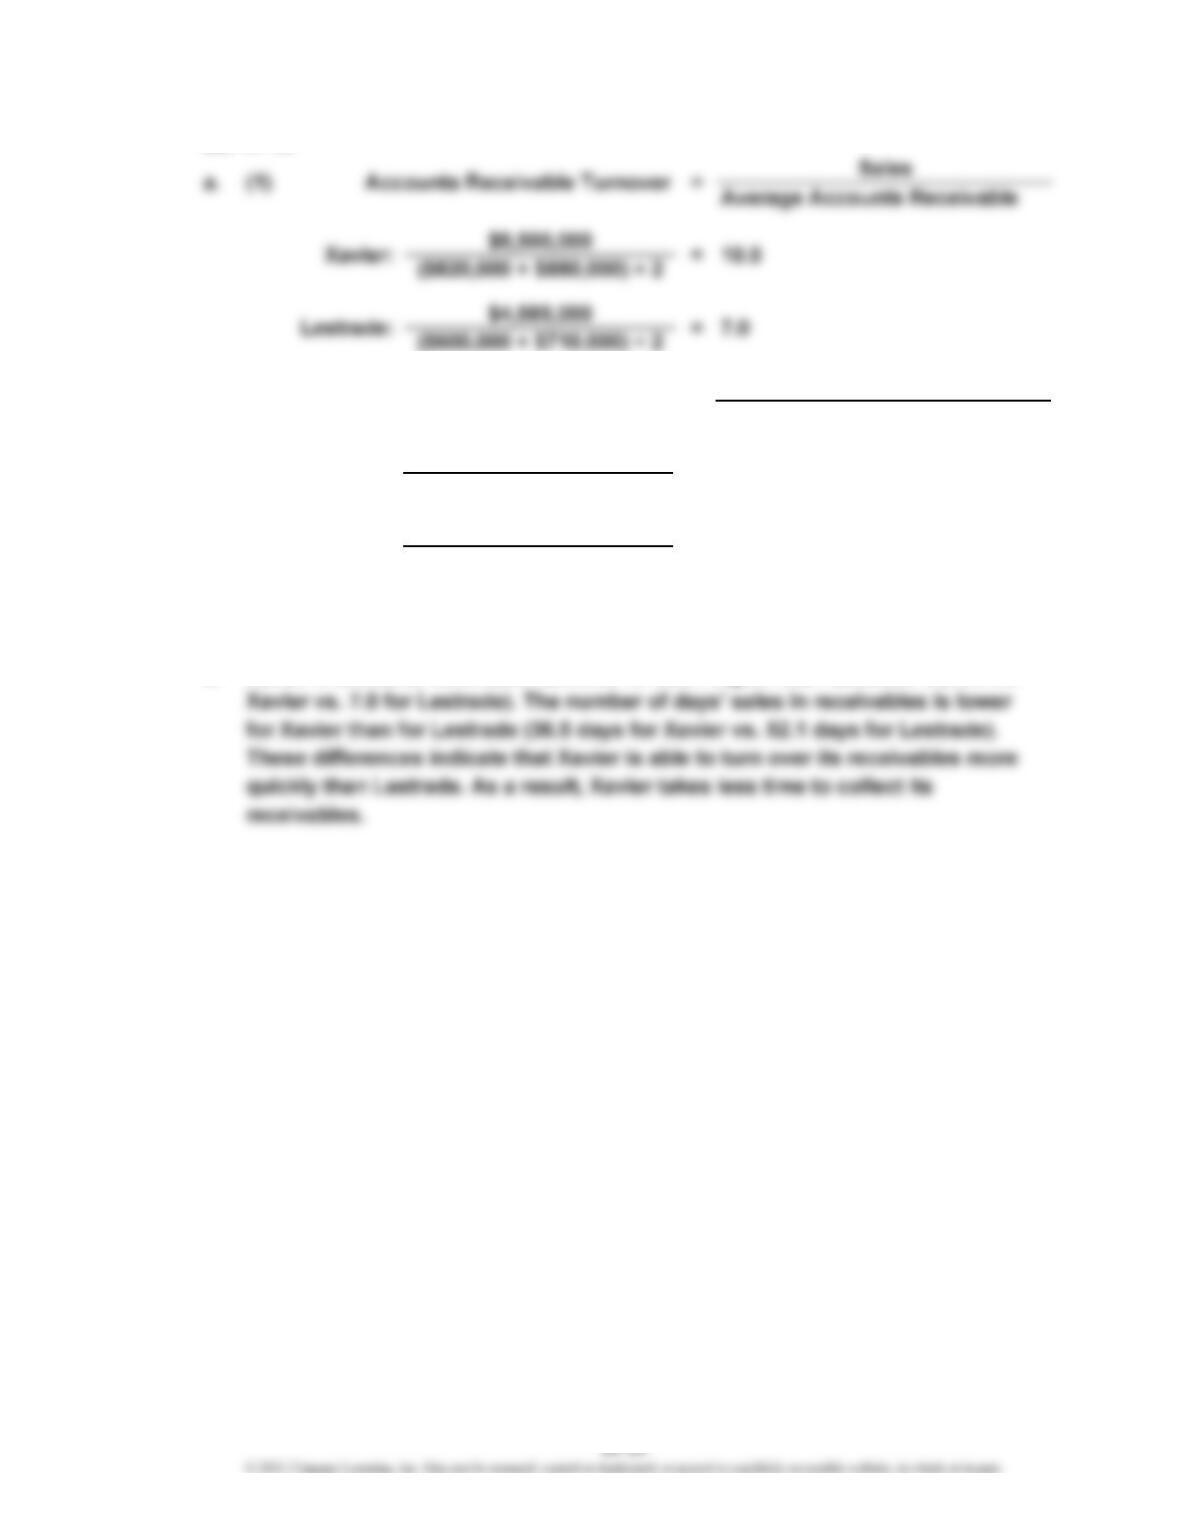
b. Xavier’s accounts receivable turnover is much higher than Lestrade’s (10.0 for
Xavier: =
($820,000 + $880,000) ÷ 2
$23,287.7
(2)
Number of Days’ Sales in Receivables
Average Accounts Receivable
Average Daily Sales
52.1 daysLestrade: ($600,000 + $710,000) ÷ 2
$12,561.6 =
36.5 days
=
*
**
CHAPTER 17 Financial Statement Analysis
(2)
*
Average daily cost of merchandise sold = $24,559 = $8,964,000 ÷ 365 days
**
Average daily cost of merchandise sold = $26,800 = $9,782,000 ÷ 365 days
Number of Days’
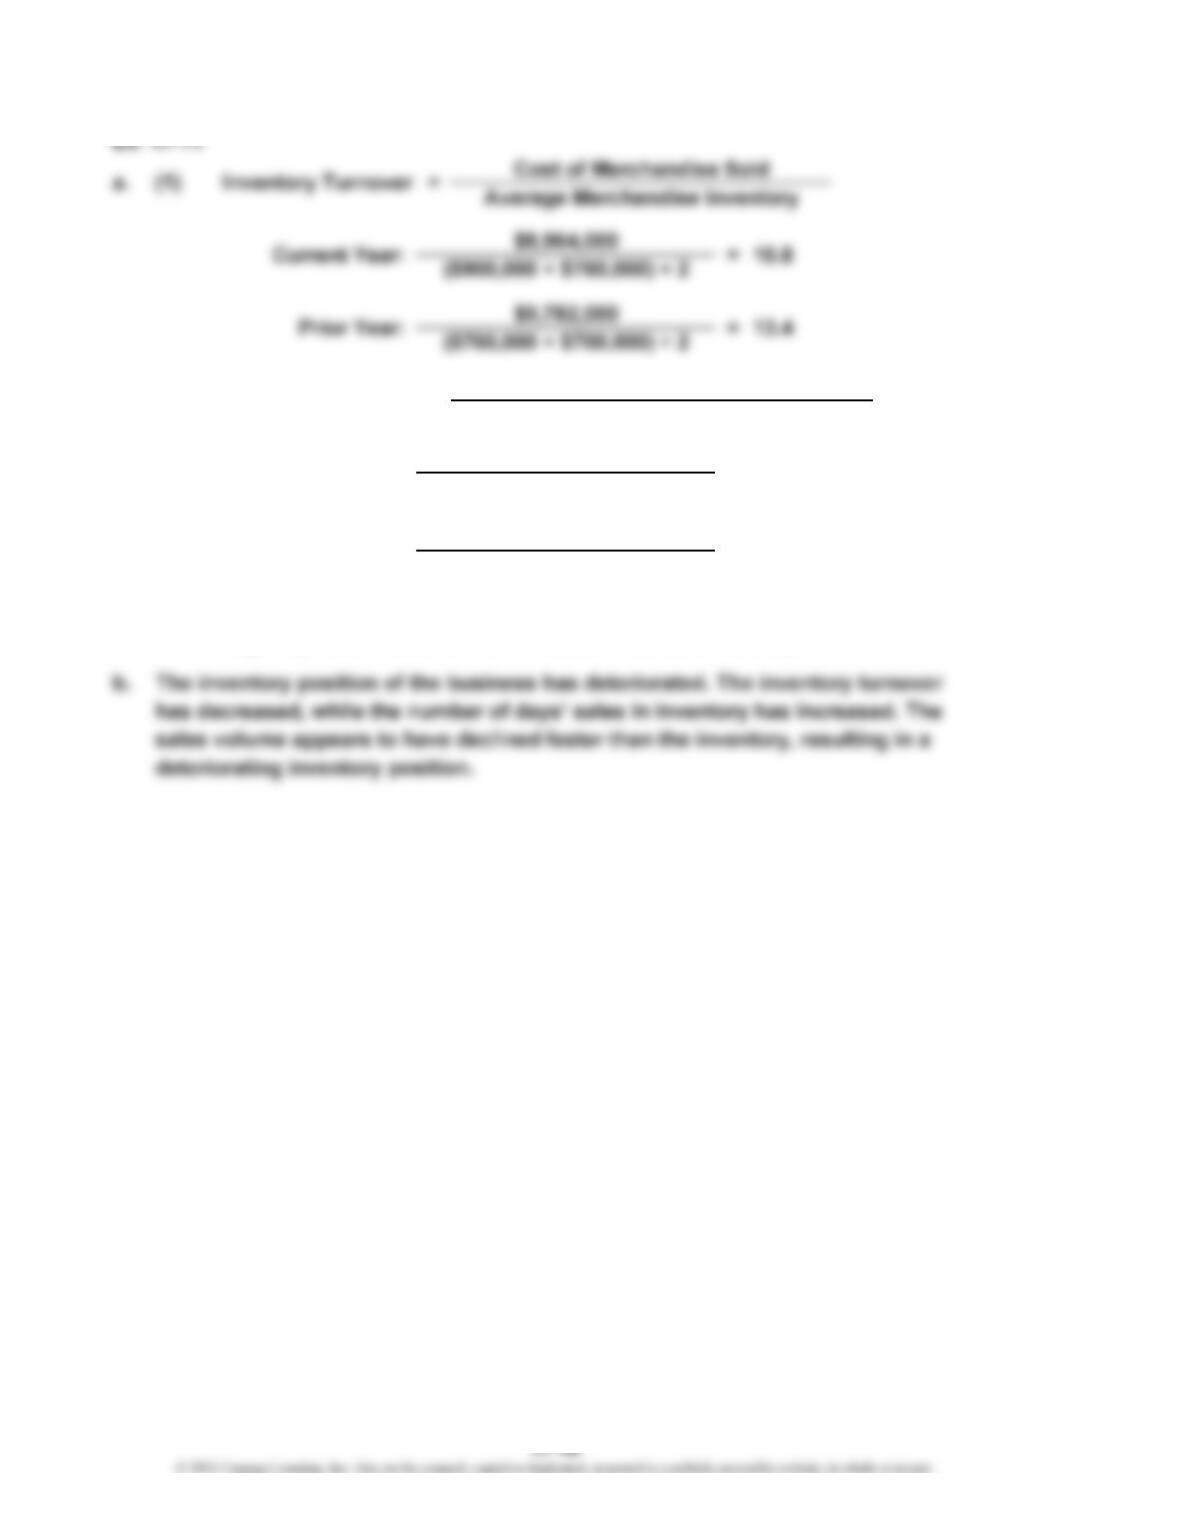
Sales in Inventory Average Daily Cost of Merchandise Sold
Average Merchandise Inventory
=
33.8 days
27.2 days=
=
($900,000 + $760,000) ÷ 2
Current Year:
Prior Year:
$24,559
($760,000 + $700,000) ÷ 2
$26,800
**
*
CHAPTER 17 Financial Statement Analysis
Ex. 17-12
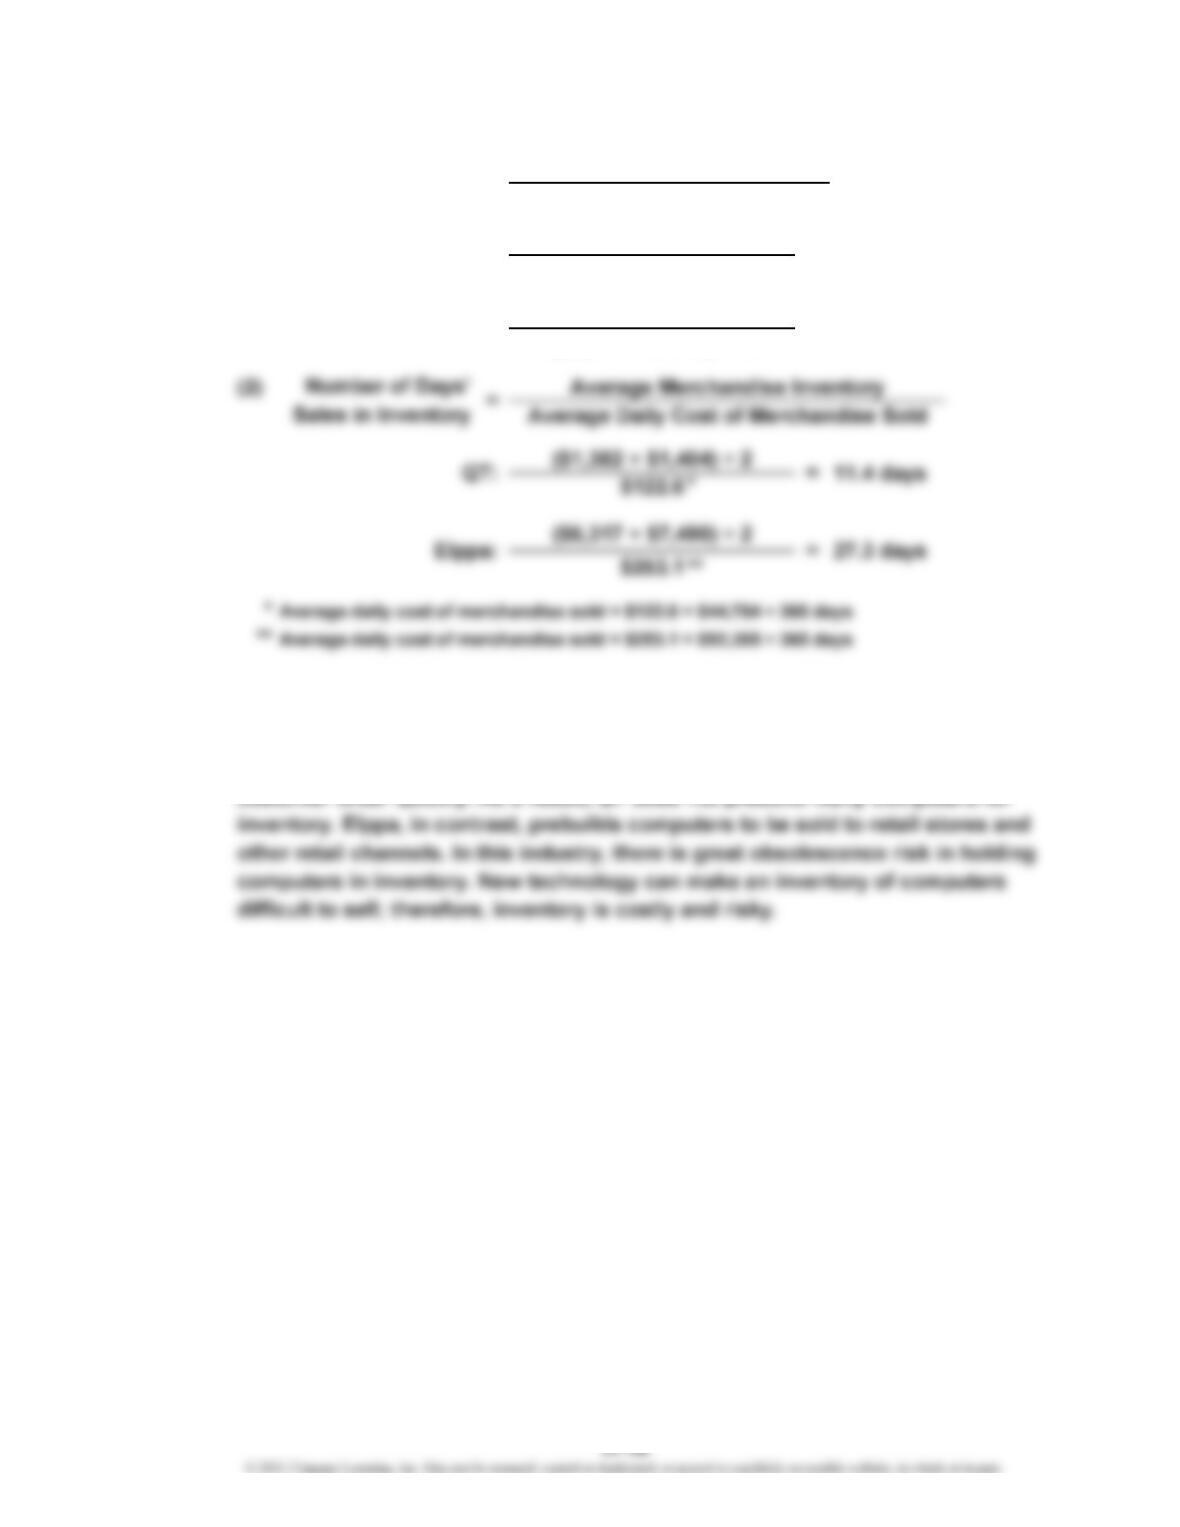
b. QT has a much higher inventory turnover ratio than does Elppa (32.1 vs. 13.4).
Likewise, QT has a much smaller number of days’ sales in inventory (11.4 days vs.
27.3 days). These significant differences are a result of QT’s make-to-order strateg
y
whereby QT has successfully developed a manufacturing process that fills a
=
Cost of Merchandise Sold
Average Merchandise Inventory
$44,754
($1,382 + $1,404) ÷ 2
32.1
13.4
$92,385
($6,317 + $7,490) ÷ 2
Elppa:
QT:
a. (1) Inventory Turnover =
=
CHAPTER 17 Financial Statement Analysis
Ex. 17-13
*
Interest expense = ($1,000,000 + $200,000) × 10% = $120,000
**
Interest expense = ($1,200,000 + $200,000) × 10% = $140,000
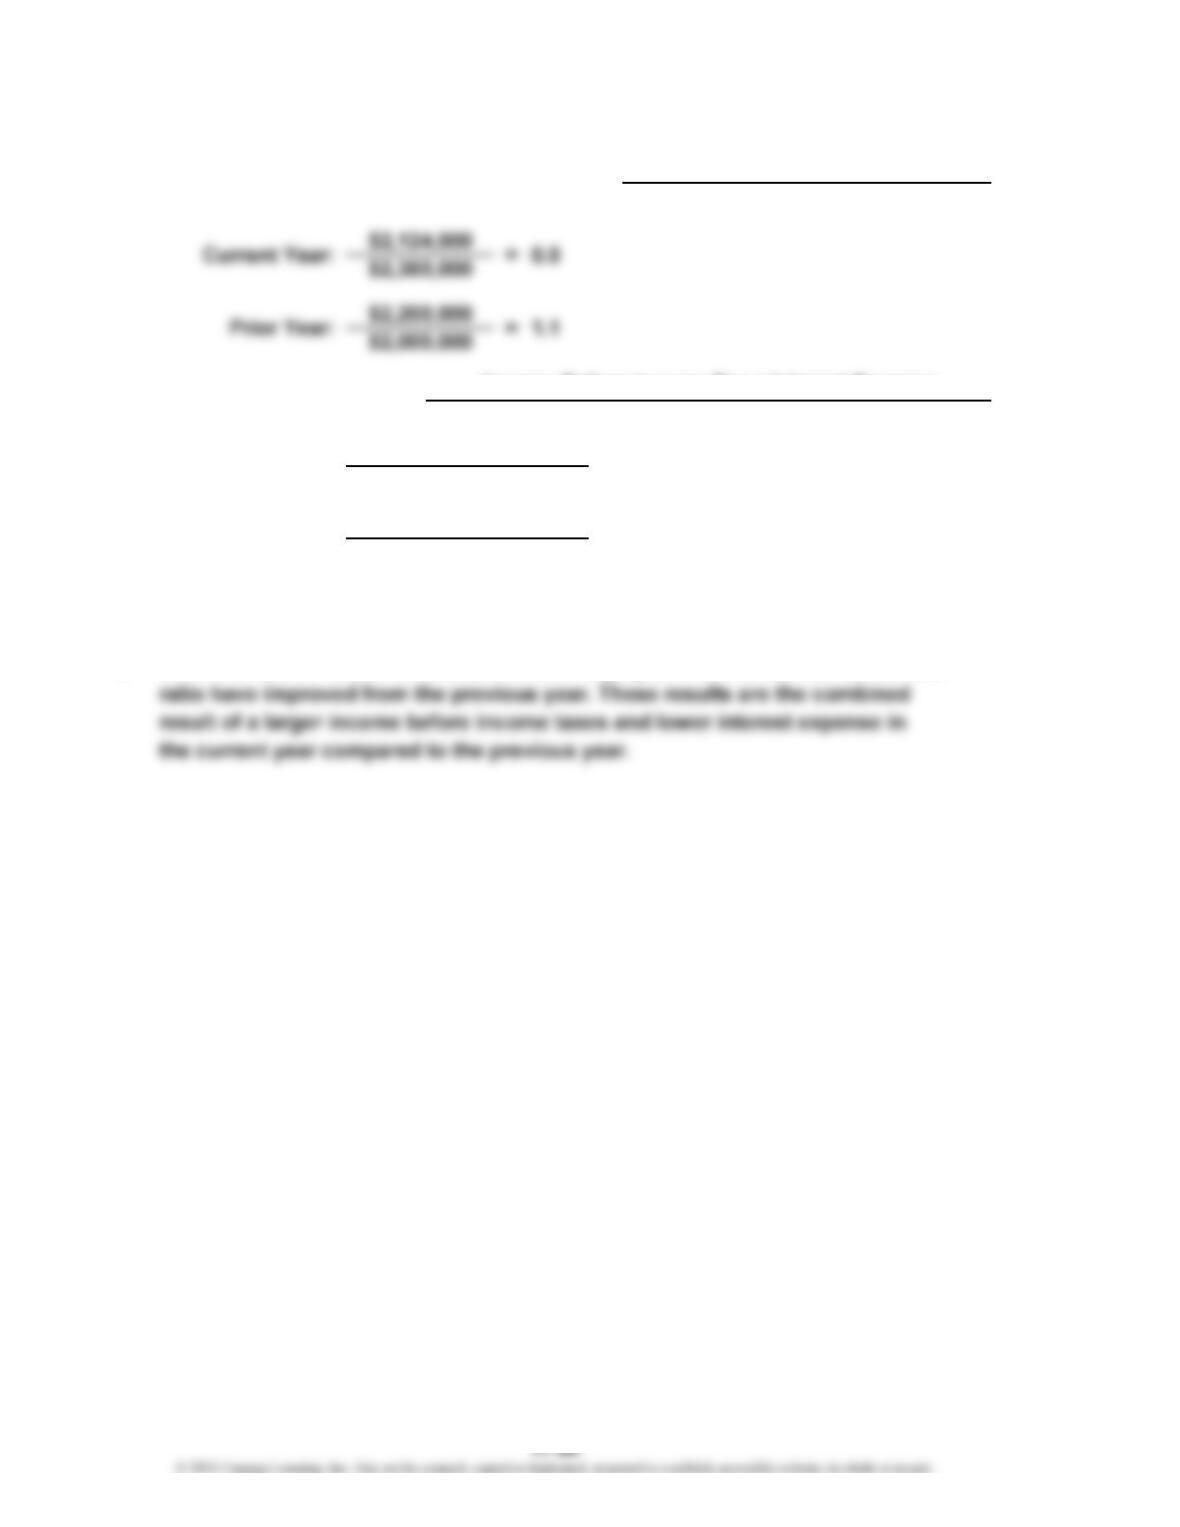
c. Both the ratio of liabilities to stockholders’ equity and the times interest earned
Prior Year:
$480,000 + $120,000
$120,000
$420,000 + $140,000
5.0Current Year:
$140,000
=
=
Total Liabilities
Total Stockholders’ Equity
=
4.0
=
a.
b.
Times Interest Earned Income Before Income Tax + Interest Expense
Interest Expense
Ratio of Liabilities to Stockholders’ Equity
*
**