Problem 17-2A (Concluded)
Part 3
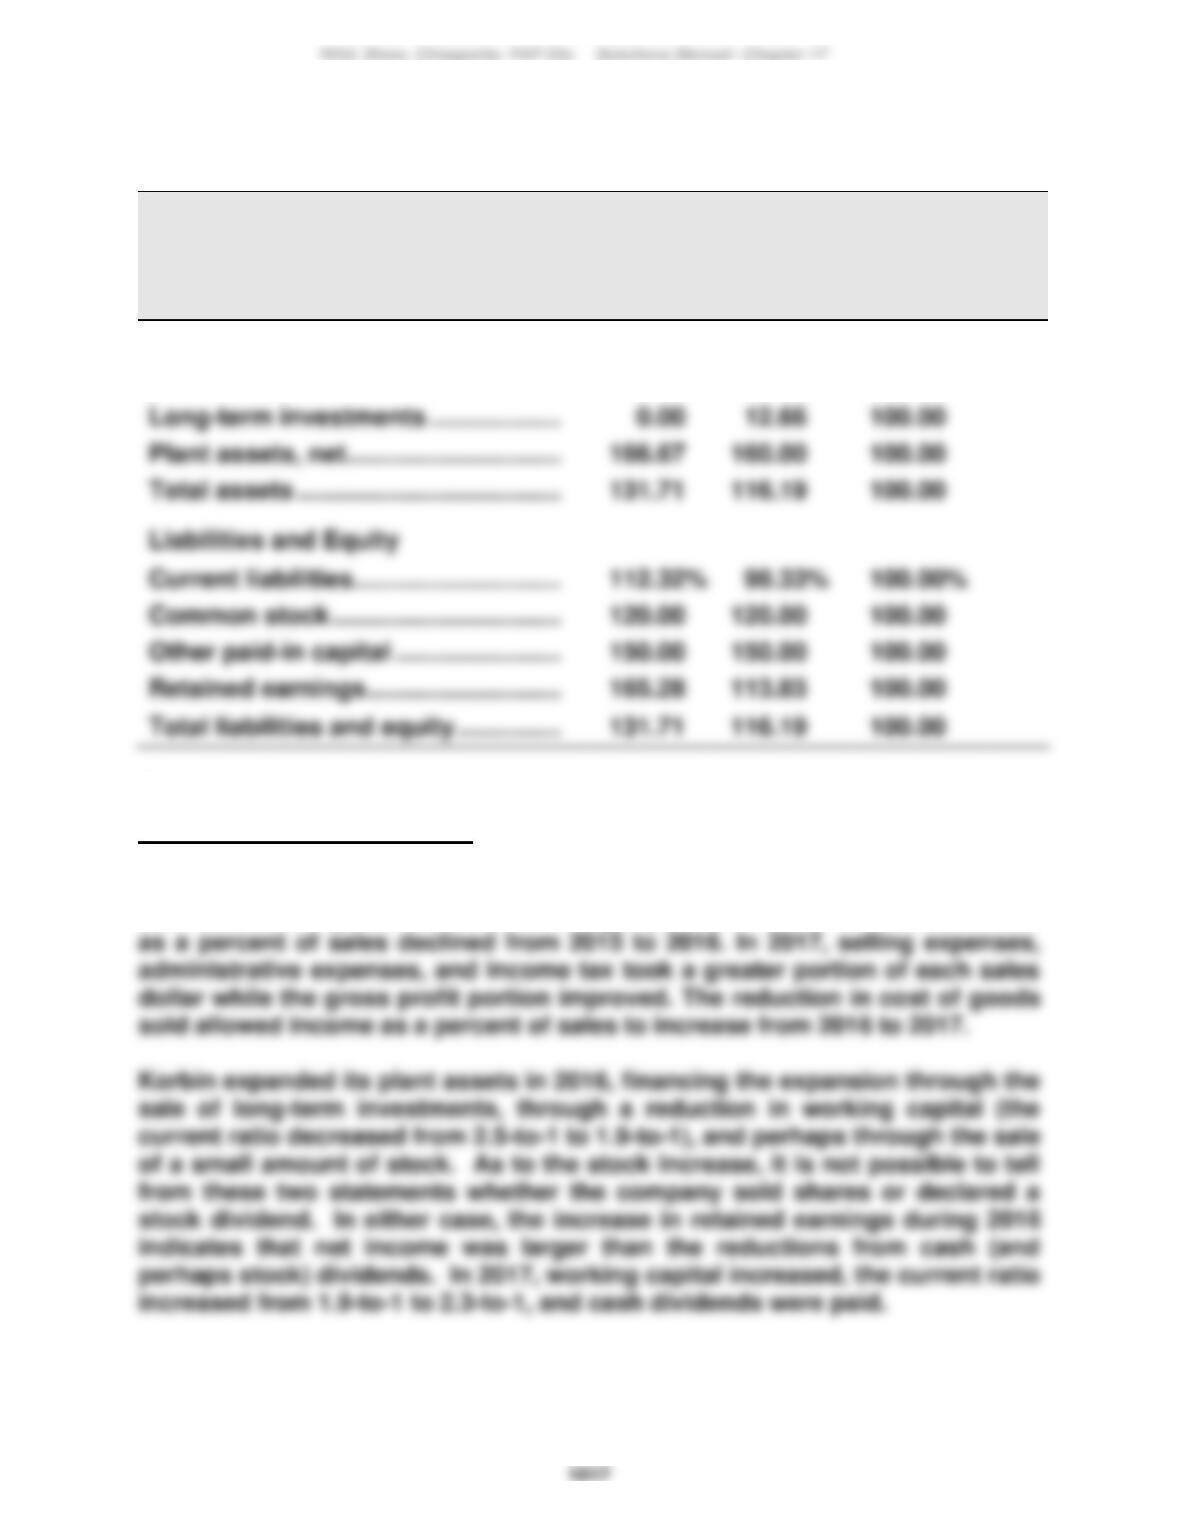
KORBIN COMPANY
Balance Sheet Data in Trend Percents
December 31, 2017, 2016, and 2015
2017
2016
2015
Assets
Current assets …………………………….
101.24%
73.29%
100.00%
Part 4
Significant relations revealed
Korbin’s selling expenses and income taxes consumed smaller portions of
each sales dollar in 2016 than 2015. However, cost of goods sold and
administrative expenses consumed a larger portion in 2016. Therefore, income
May 27
+100,000
____
____
_______
Bal.
833,000
446,000
408,000
2.04
1.09
425,000
May 28
+ 80,000
____
____
_______
Bal.
913,000
526,000
408,000
2.24
1.29
505,000
Bal.
$408,000
$325,000
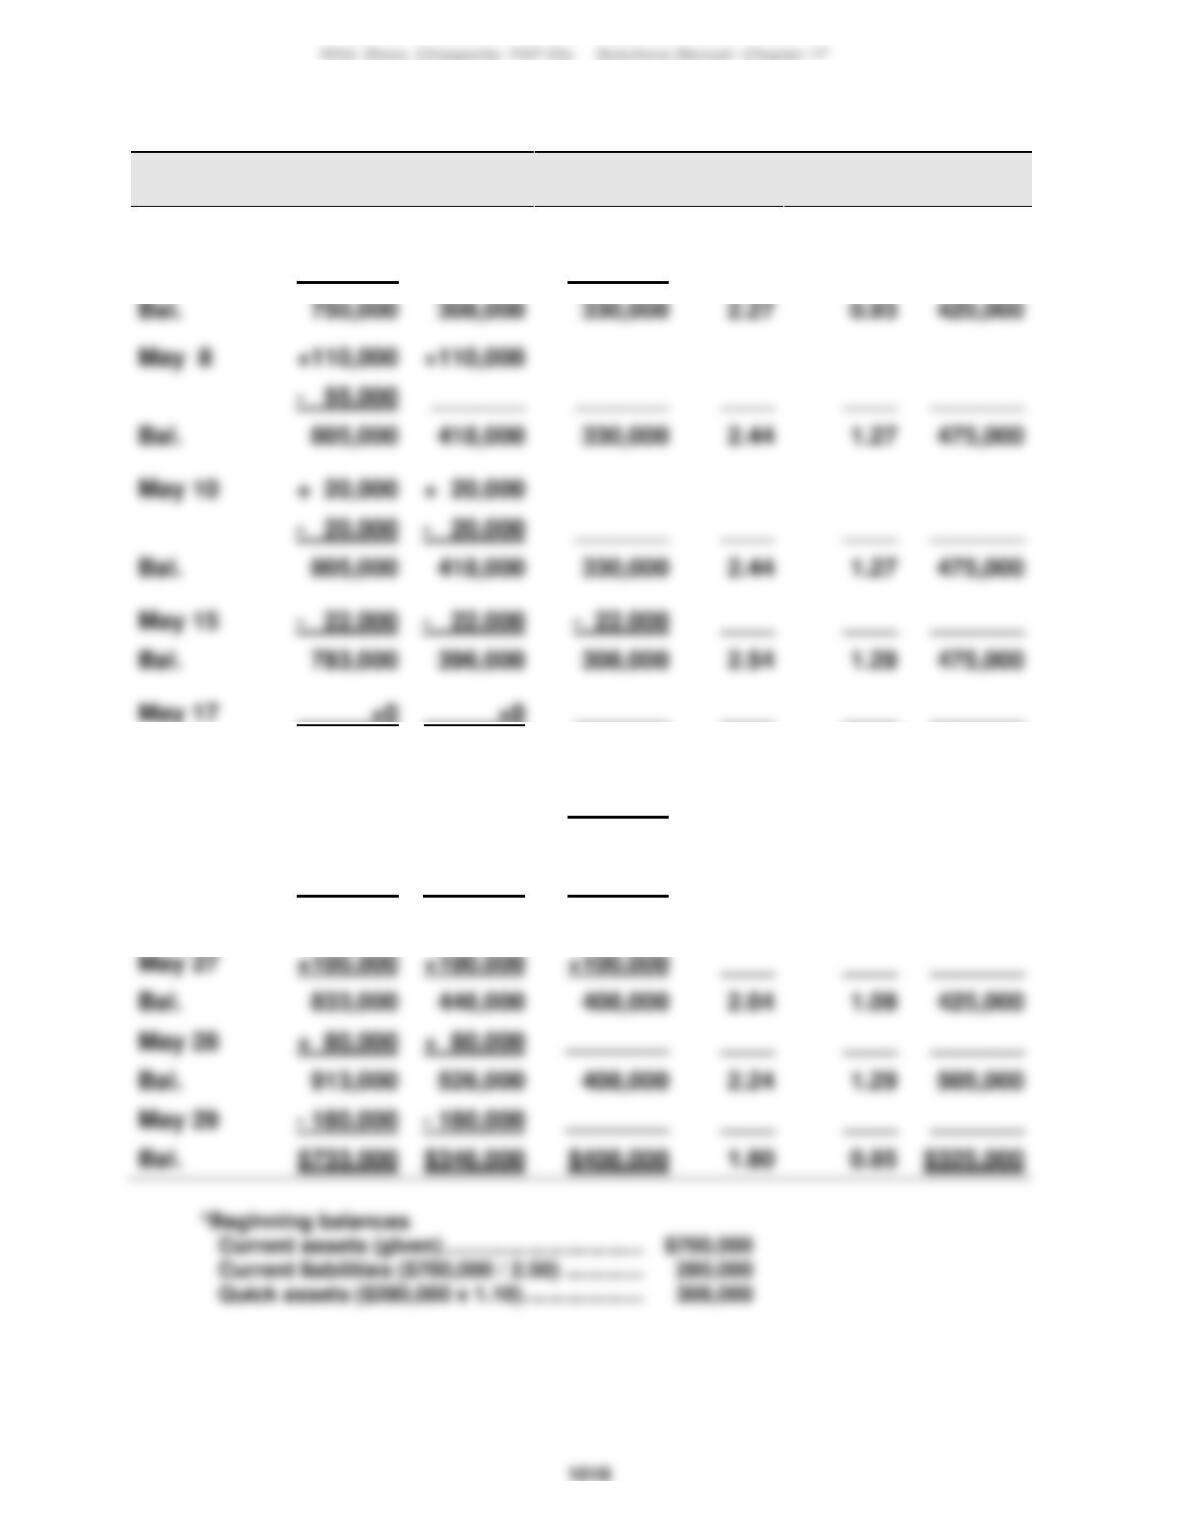
Problem 17-3A (60 minutes)
Trans-
action
Current
Assets
Quick
Assets
Current
Liabilities
Current
Ratio
Acid-Test
Ratio
Working
Capital
Beginning*
$700,000
$308,000
$280,000
2.50
1.10
$420,000
May 2
+ 50,000
_______
+ 50,000
____
____
_______
May 8
+110,000
– 55,000
_______
____
____
_______
Bal.
805,000
418,000
330,000
2.44
1.27
475,000
May 10
+ 20,000
– 20,000
– 20,000
____
____
_______
Bal.
805,000
418,000
330,000
2.44
1.27
475,000
May 15
– 22,000
– 22,000
____
____
_______
May 17
____
____
_______
Bal.
783,000
396,000
308,000
2.54
1.29
475,000
May 22
_______
_______
+ 50,000
____
____
_______
Bal.
783,000
396,000
358,000
2.19
1.11
425,000
May 26
– 50,000
– 50,000
– 50,000
____
____
_______
Bal.
733,000
346,000
308,000
2.38
1.12
425,000
1019
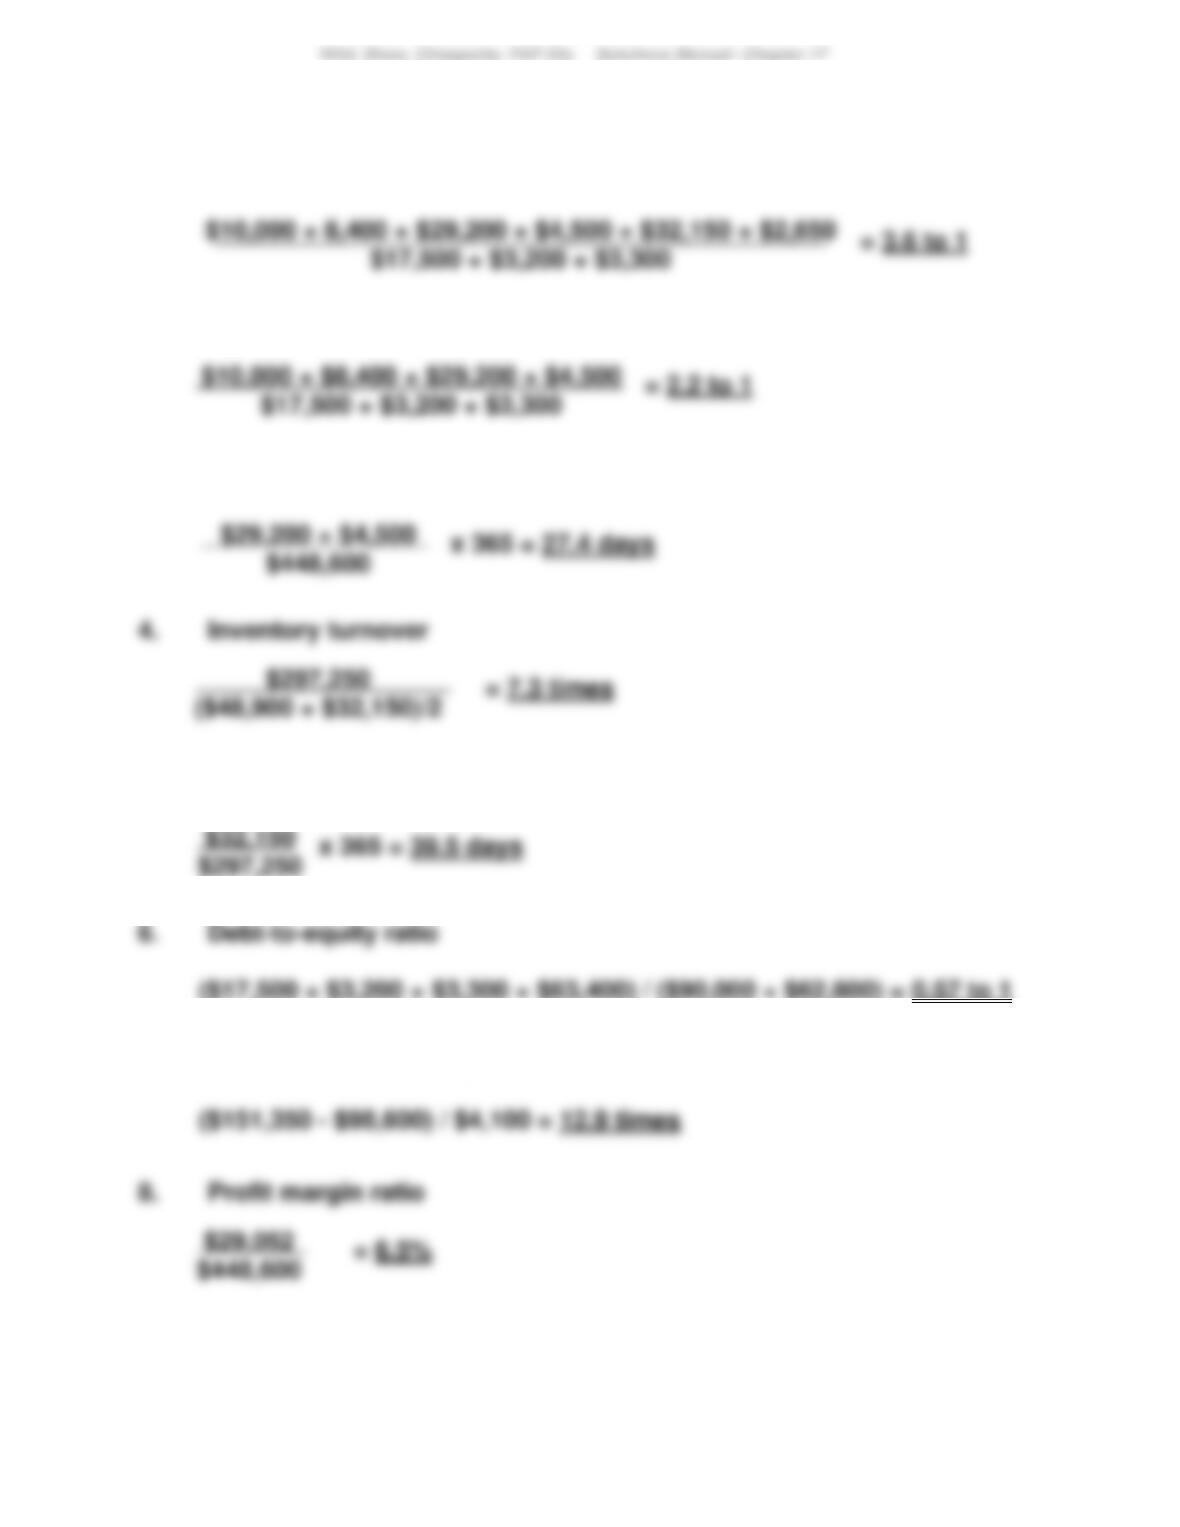
Problem 17-4A (50 minutes)
1. Current ratio
2. Acid-test ratio
3. Days’ sales uncollected
5. Days’ sales in inventory
7. Times interest earned
1020
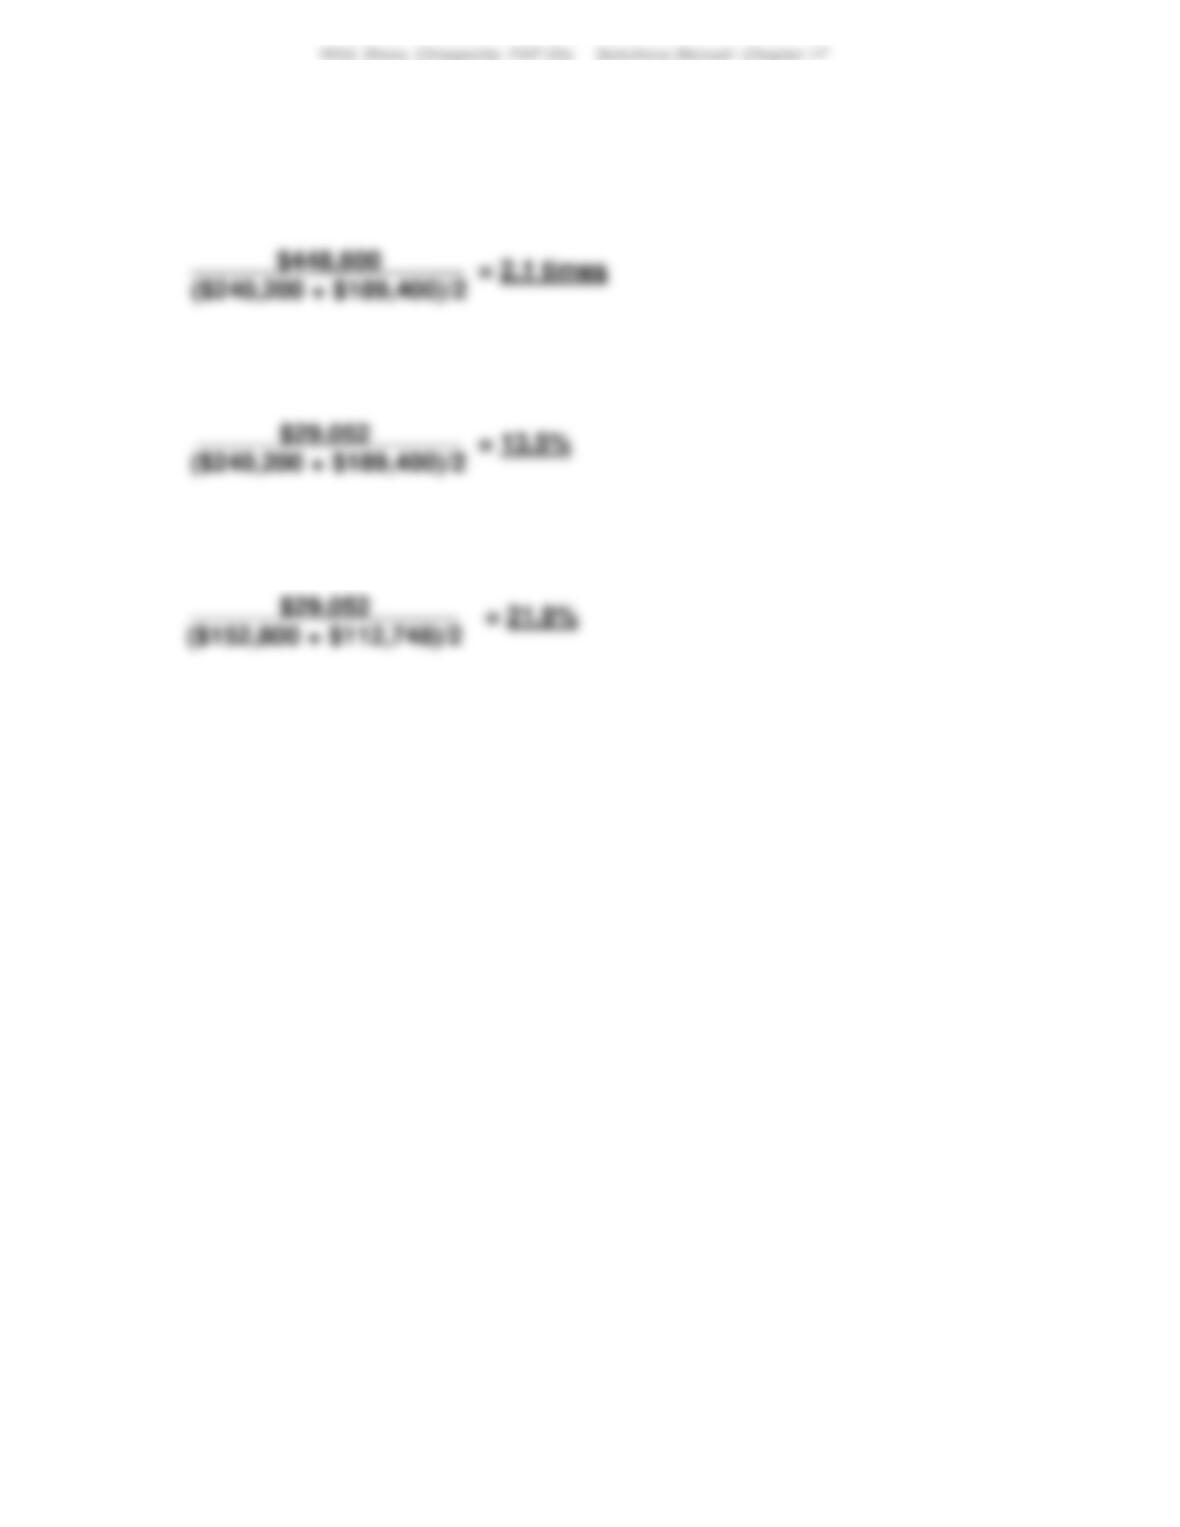
Problem 17-4A (Concluded)
9. Total asset turnover
10. Return on total assets
11. Return on common stockholders’ equity
1021
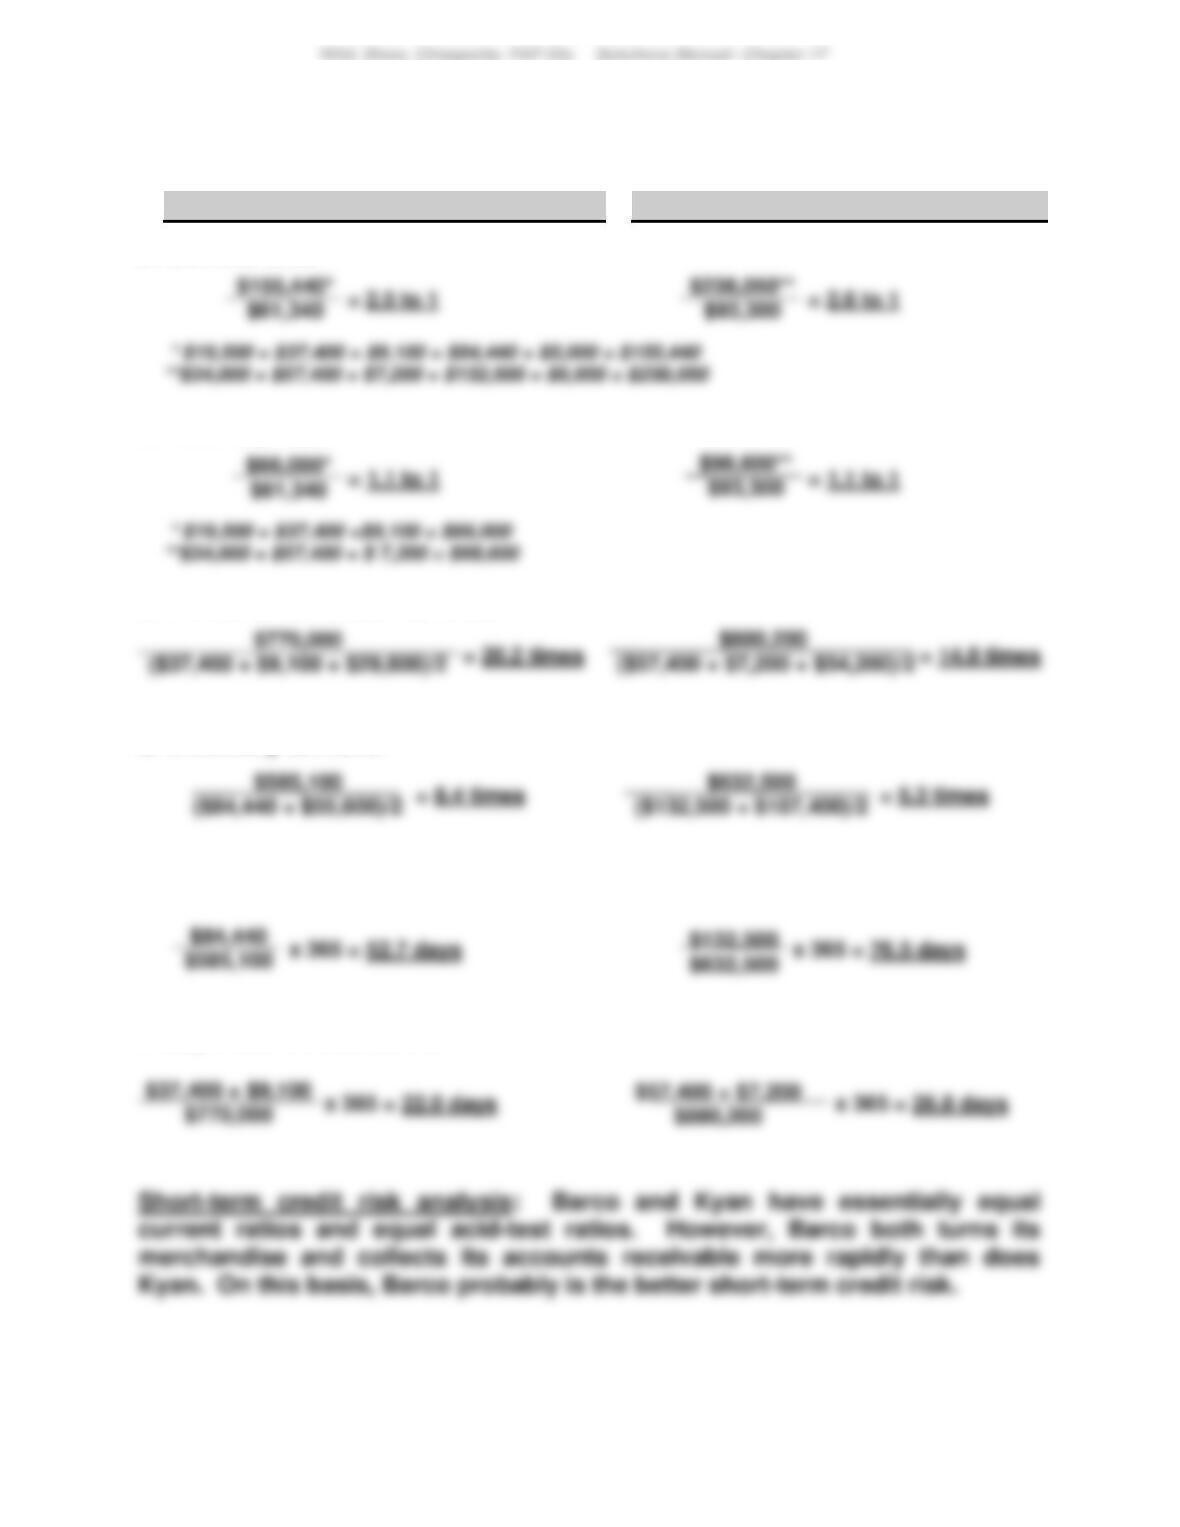
Problem 17-5A (60 minutes)
Part 1
Barco Company
Kyan Company
a. Current ratio
b. Acid-test ratio
c. Accounts receivable turnover
d. Inventory turnover
e. Days’ sales in inventory
f. Days’ sales uncollected
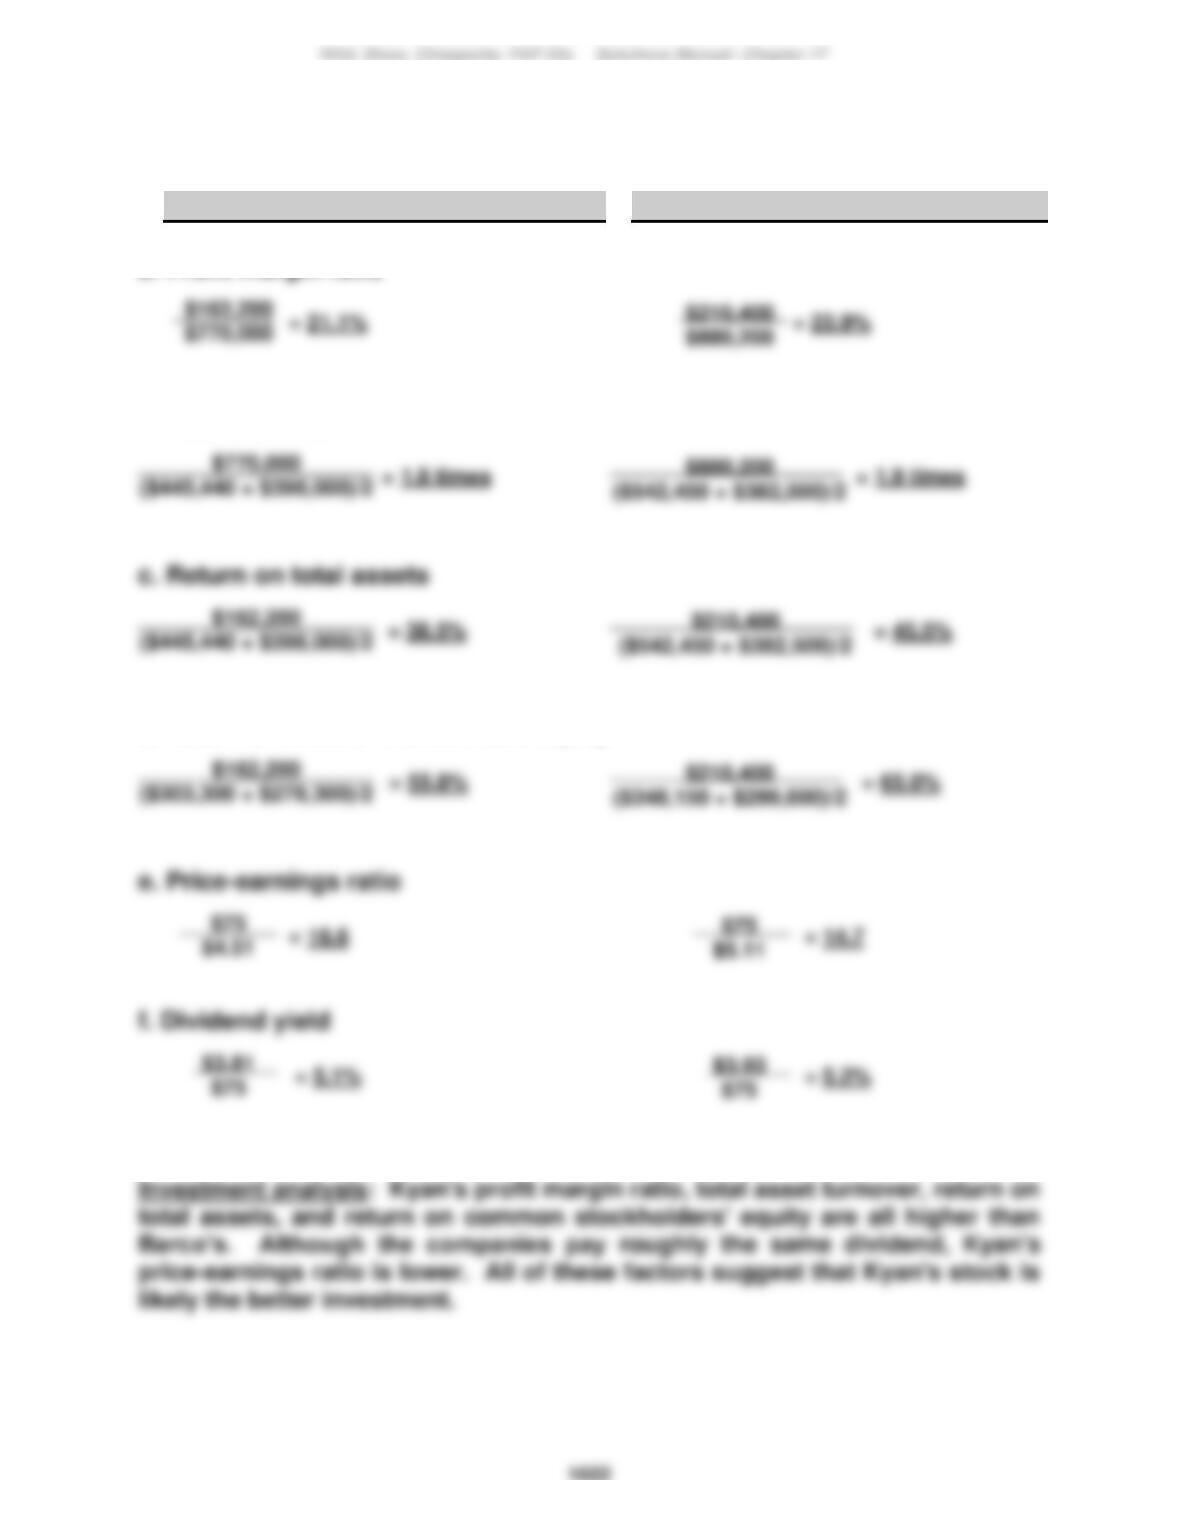
Problem 17–5A (Concluded)
Part 2
Barco Company
Kyan Company
a. Profit margin ratio
b. Total asset turnover
d. Return on common stockholders’ equity
1023
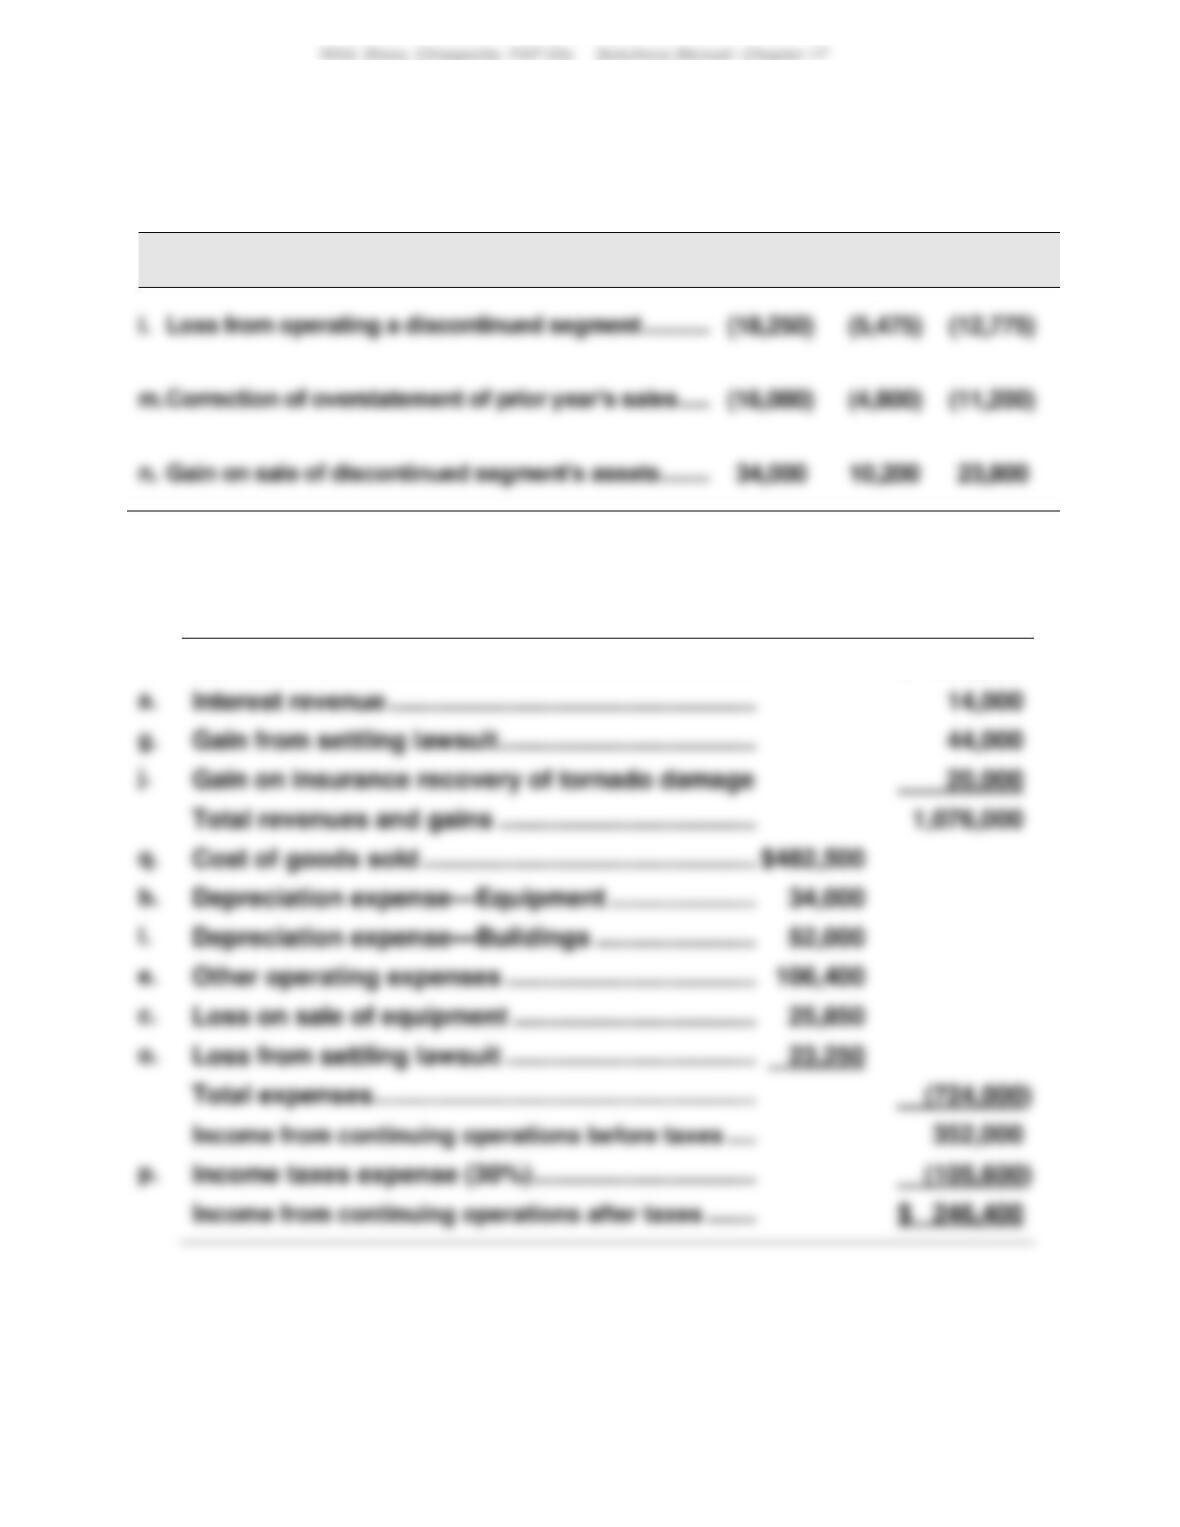
Problem 17–6AA (60 minutes)
Part 1
Effect of income taxes (debits or losses in parentheses)
Pretax
30% Tax
Effect
After–Tax
Part 2 Income from continuing operations (and its components)
k.
Net sales …………………………………………………………
$ 998,000
Depreciation expense—Equipment ………………….
c.
Total expenses ………………………………………………..
1024
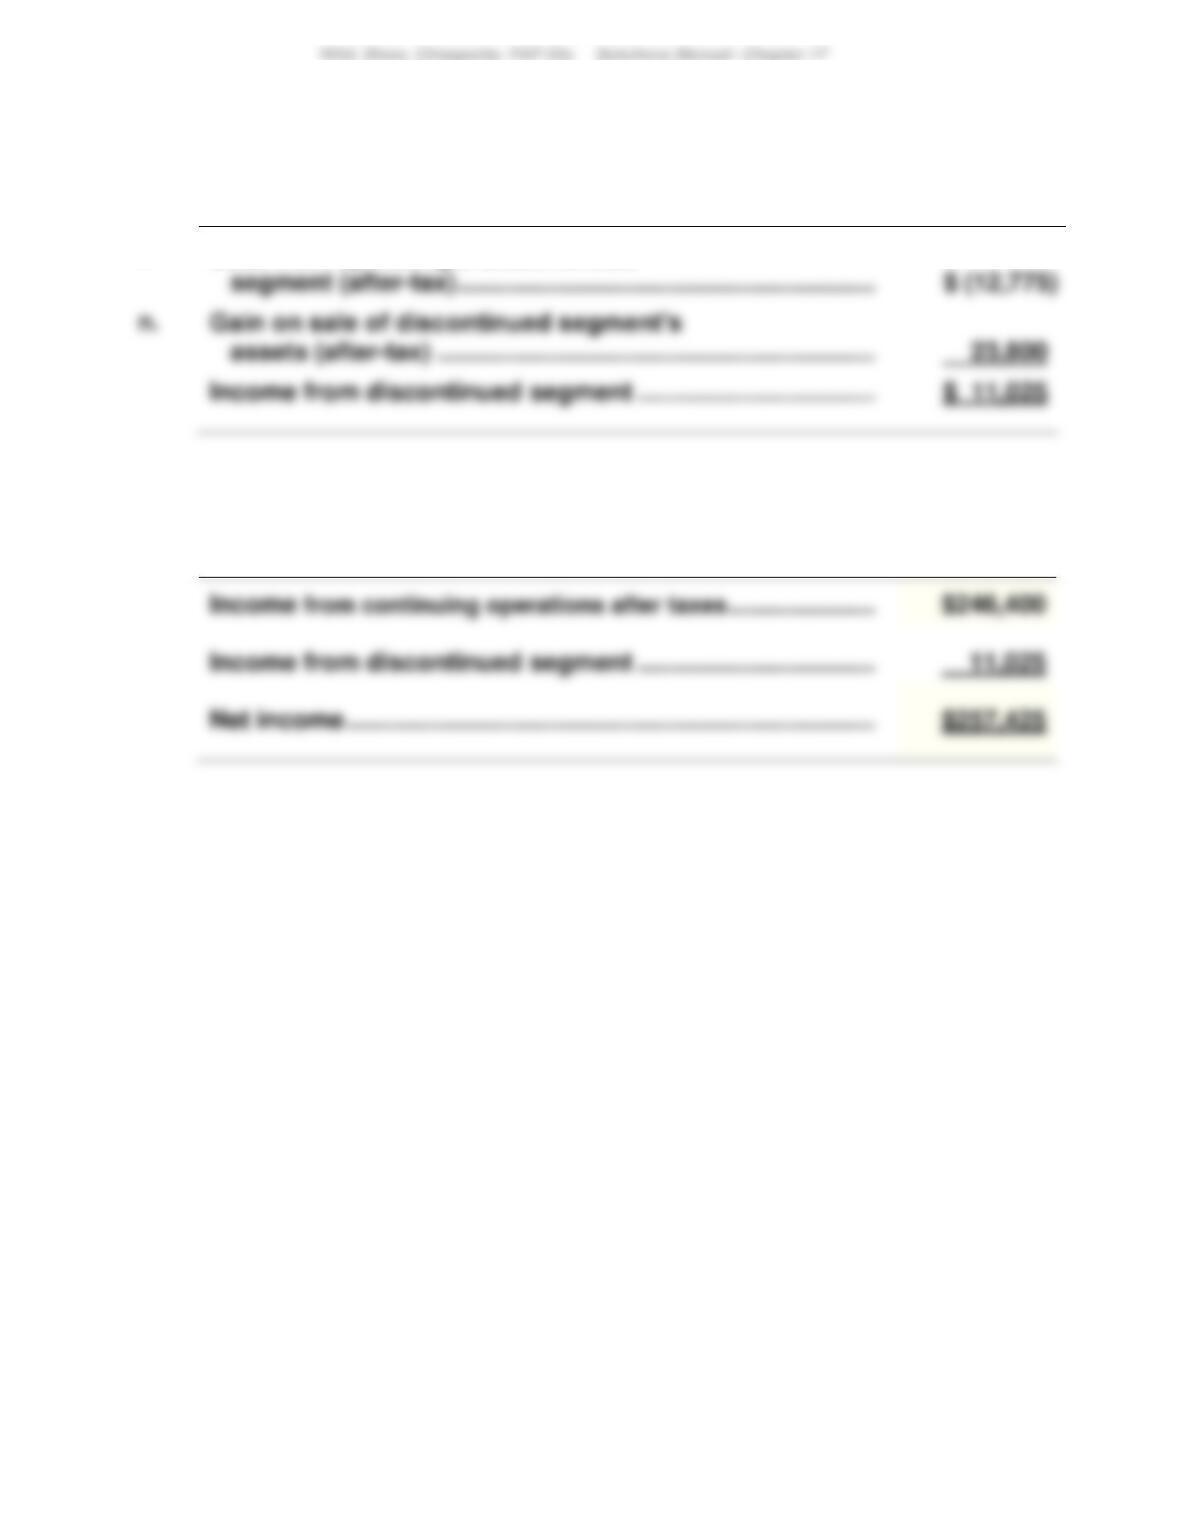
Problem 17–6AA (Concluded)
Part 3 Income from discontinued segment
i.
Loss from operating a discontinued
Part 4 Net income
Wild, Shaw, Chiappetta, FAP 23e Solutions Manual: Chapter 17
1025
PROBLEM SET B
Problem 17-1B (120 minutes)
Part 1
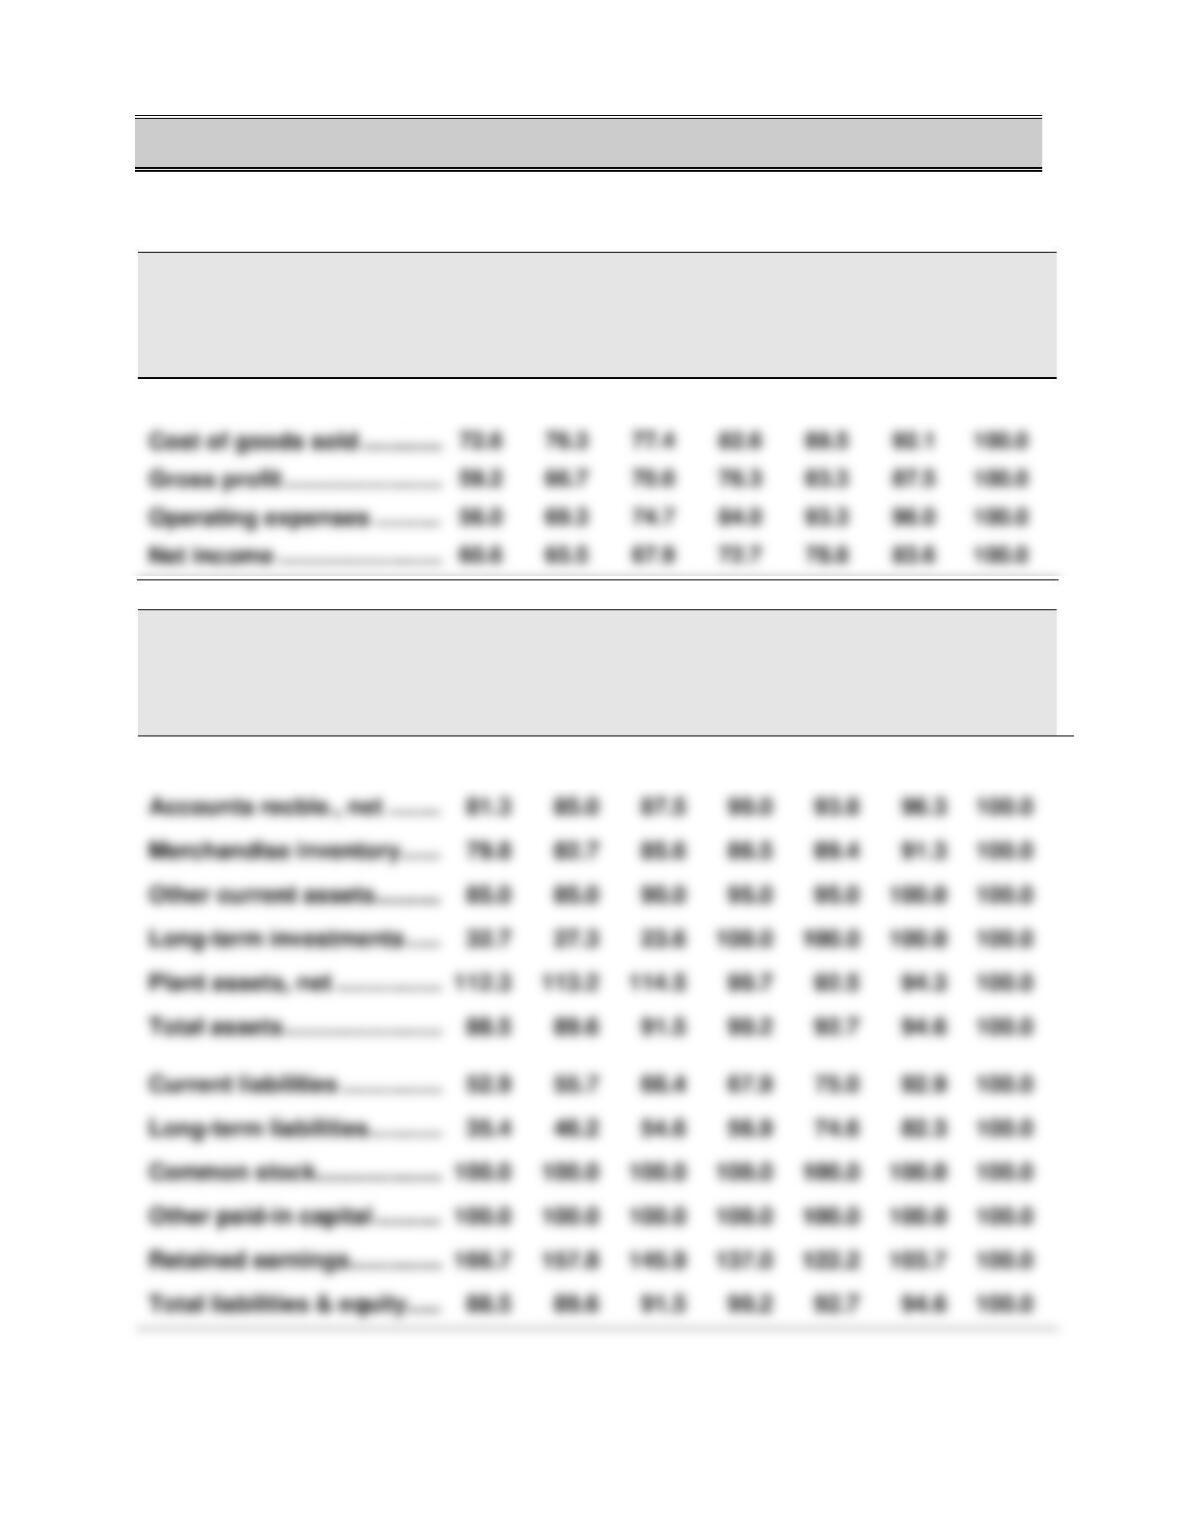
TRIPOLY COMPANY
Income Statement Trends
For Years Ended December 31, 2017-2011
2017
2016
2015
2014
2013
2012
2011
Sales ……………………………….
65.1%
70.9%
73.3%
79.1%
86.0%
89.5%
100.0%
TRIPOLY COMPANY
Balance Sheet Trends
December 31, 2017-2011
2017
2016
2015
2014
2013
2012
2011
Cash ………………………………
64.7%
67.6%
76.5%
79.4%
88.2%
91.2%
100.0%
Accounts recble., net ……….
Merchandise inventory ……..
Other current assets …………
Plant assets, net ………………
Total assets ……………………..
Current liabilities ……………..
Common stock …………………
Other paid-in capital …………
Retained earnings…………….
Cost of goods sold …………..
72.6
76.3
77.4
82.6
89.5
92.1
100.0
Gross profit ……………………..
59.2
66.7
70.0
76.3
83.3
87.5
100.0
Operating expenses …………
56.0
69.3
74.7
84.0
93.3
96.0
100.0
Problem 17-1B (Concluded)
Part 2
Analysis and Interpretation
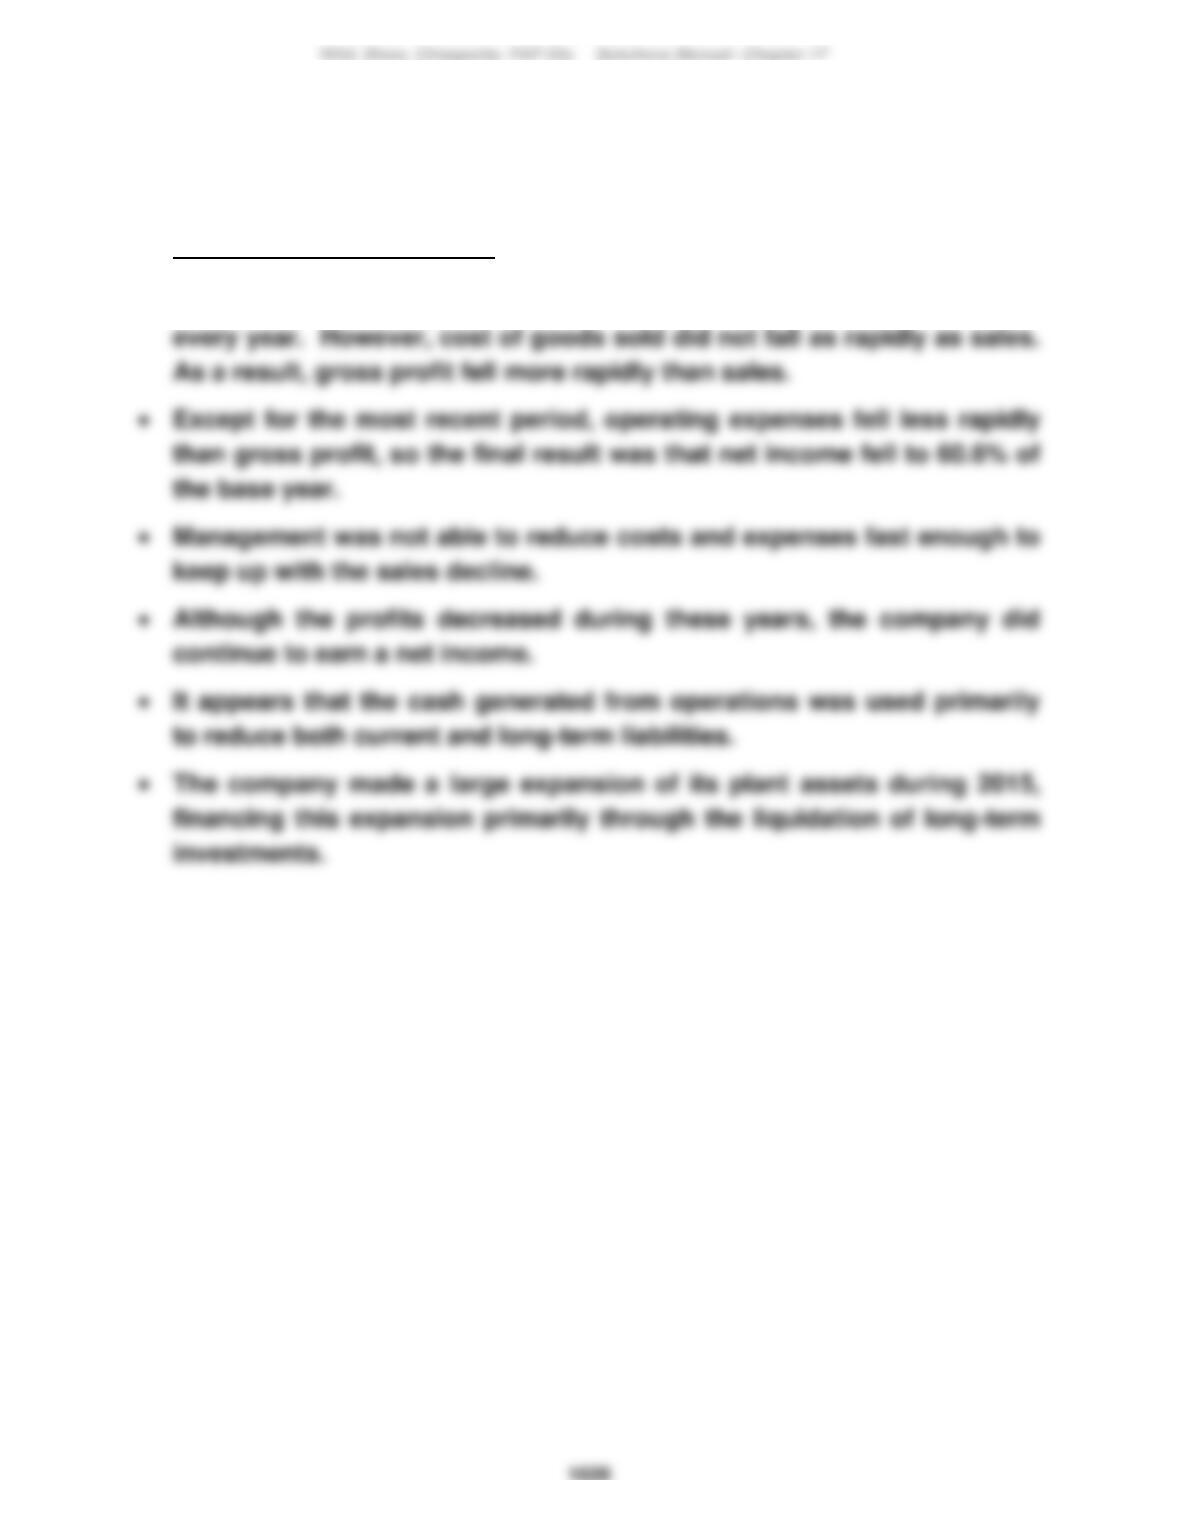
• The statements and the trend percent data show that sales declined
1027
Problem 17-2B (60 minutes)
Part 1
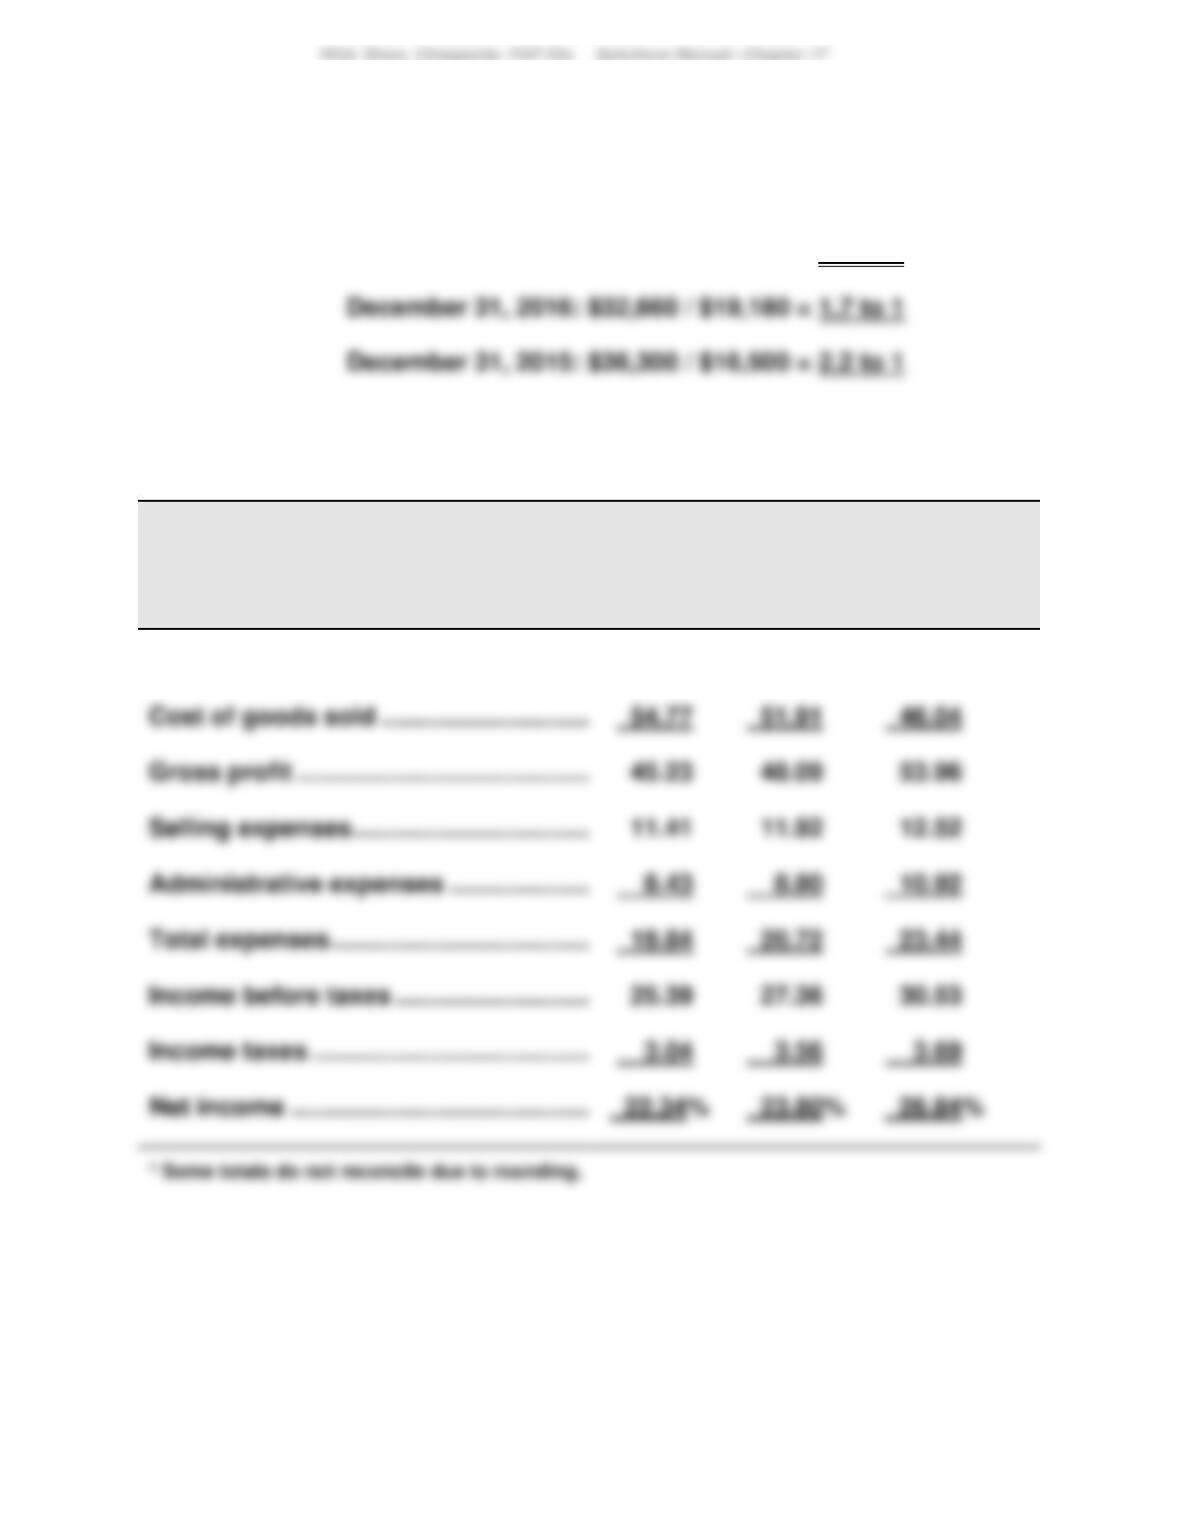
Current ratio: December 31, 2017: $54,860 / $22,370 = 2.5 to 1
Part 2
BLUEGRASS CORPORATION
Common-Size Comparative Income Statements
For Years Ended December 31, 2017, 2016, and 2015
2017
2016
2015
Sales ……………………………………………………
100.00%
100.00%
100.00%
1028
Problem 17-2B (Concluded)
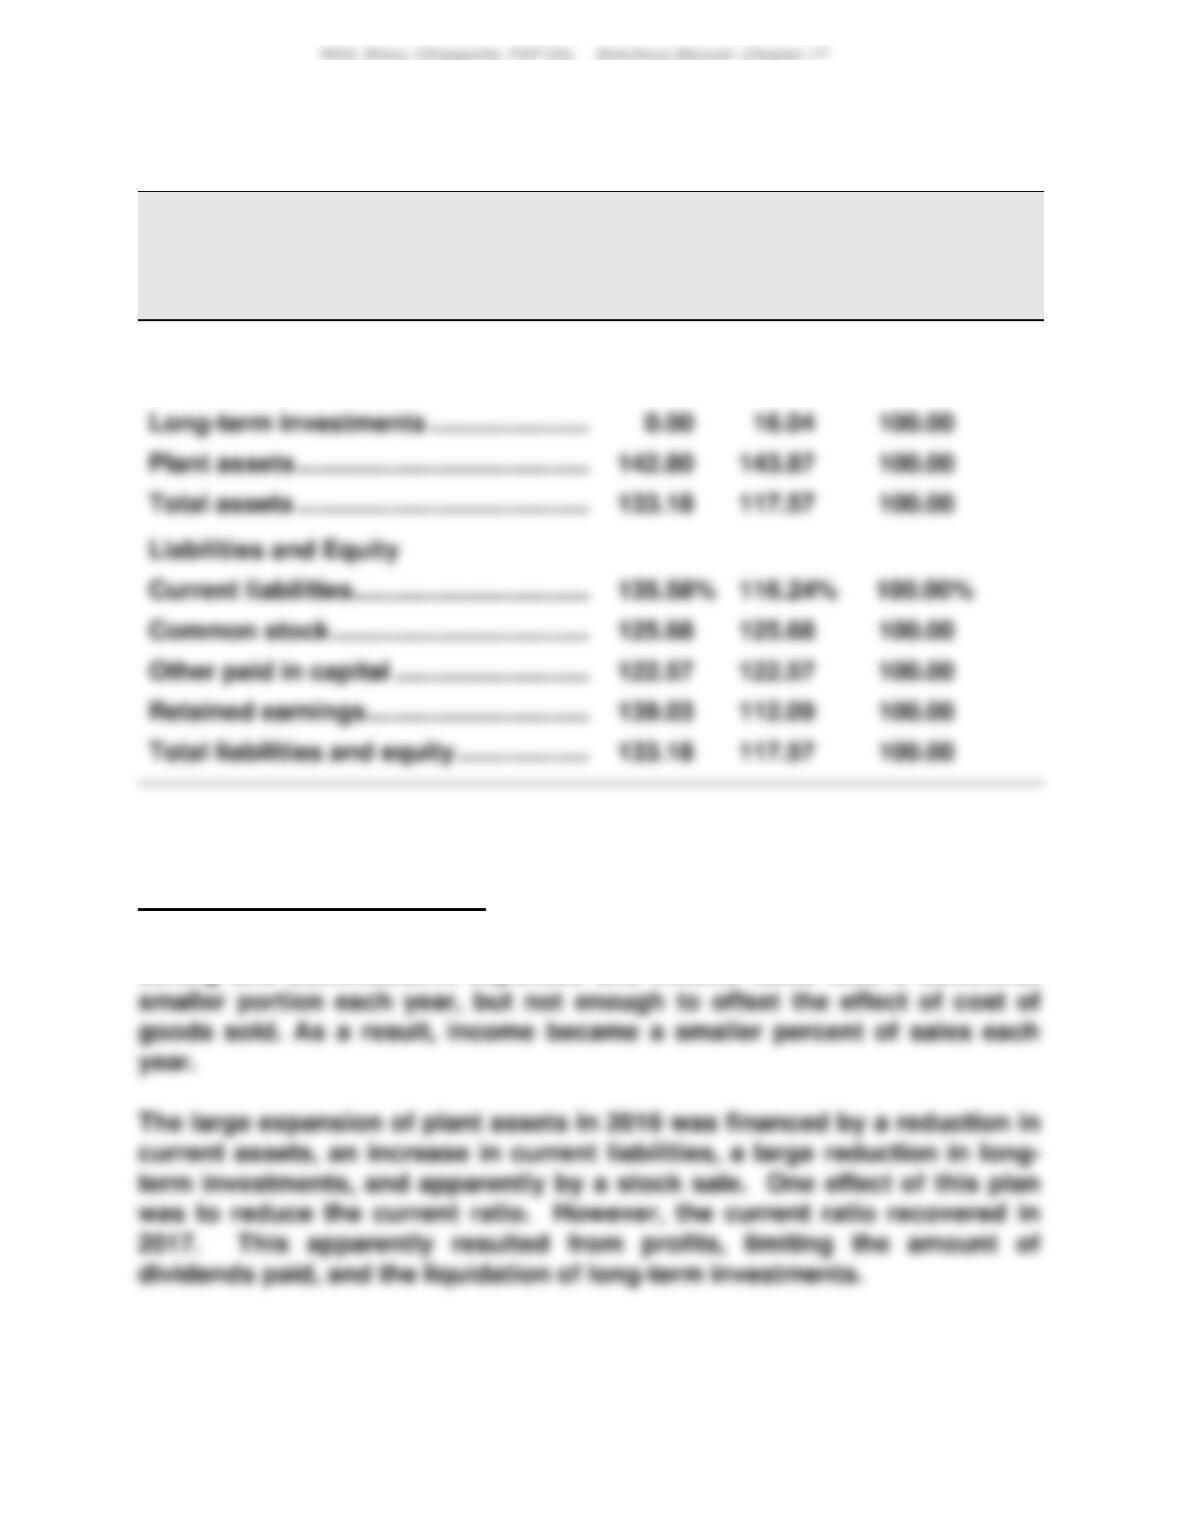
Part 3
BLUEGRASS CORPORATION
Balance Sheet Data in Trend Percents
December 31, 2017, 2016, and 2015
2017
2016
2015
Assets
Current assets ……………………………………..
151.13%
89.97%
100.00%
Part 4
Significant relations revealed
Bluegrass’s cost of goods sold took a larger percent of sales each year.
Selling and administrative expenses and income taxes took a somewhat
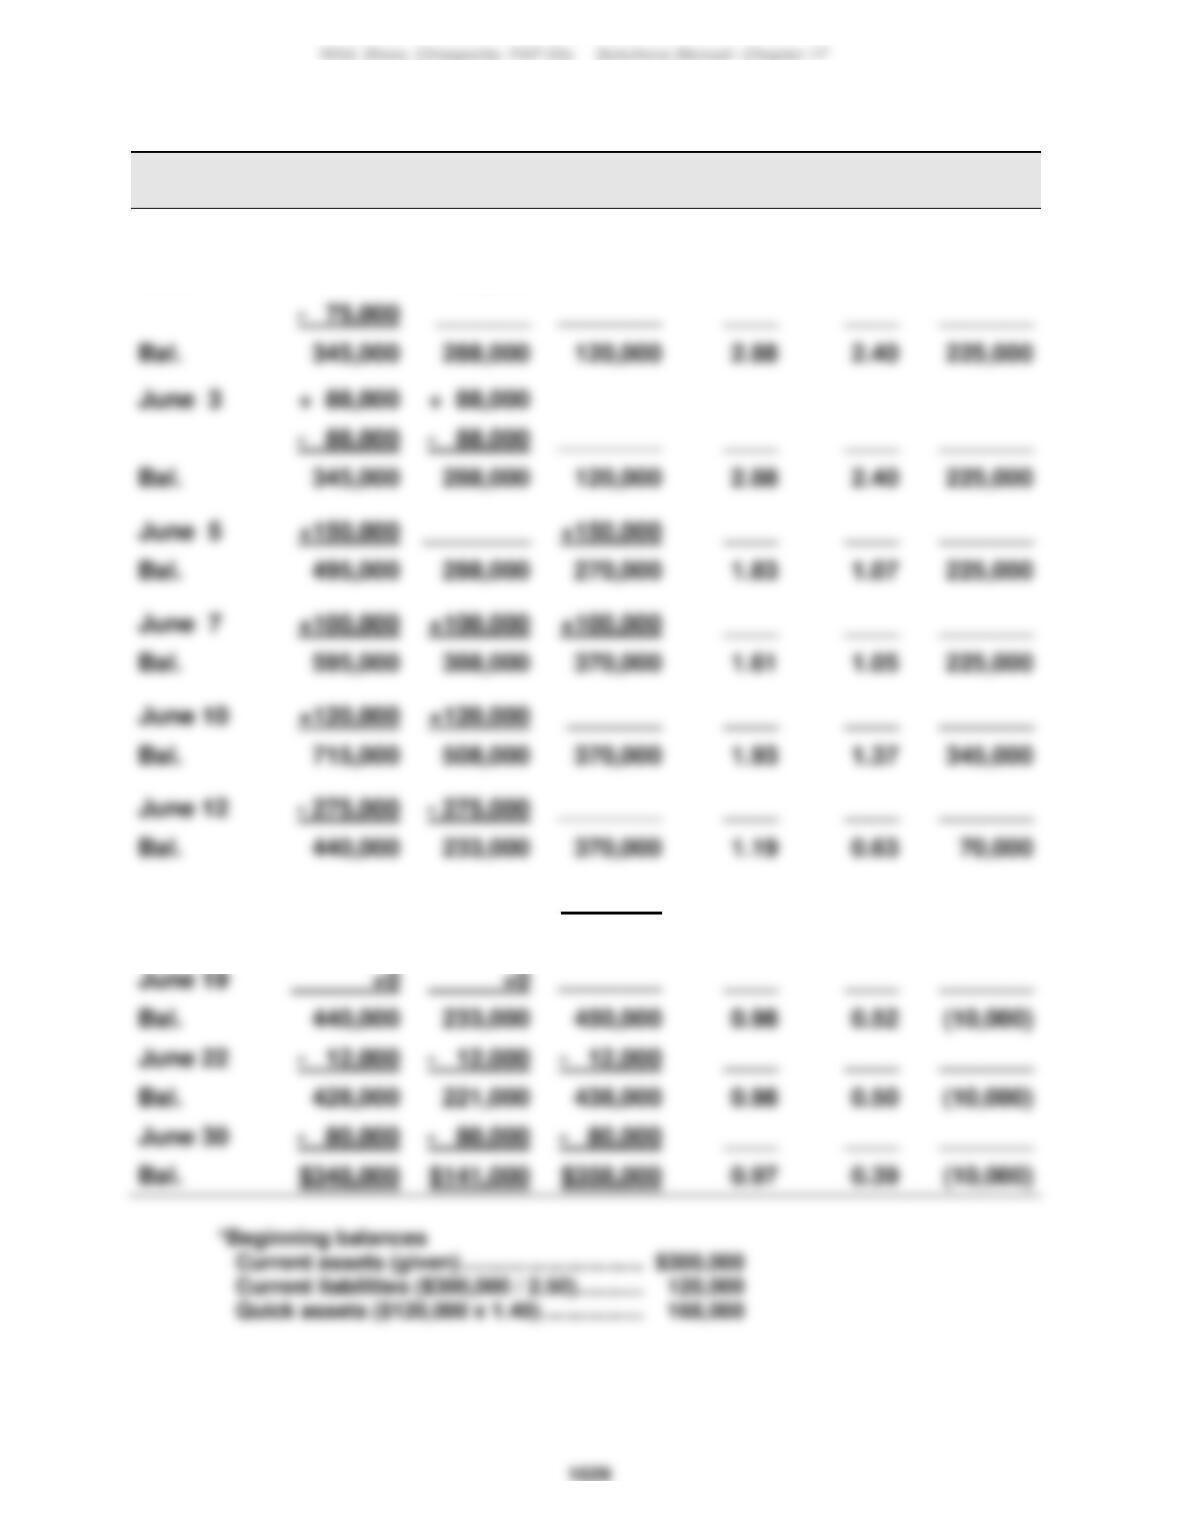
June 19
____
____
_______
Bal.
June 22
____
____
_______
Bal.
428,000
221,000
438,000
0.98
0.50
(10,000)
June 30
____
____
_______
Bal.
$348,000
$141,000
$358,000
0.97
0.39
(10,000)
Problem 17-3B (60 minutes)
Trans-
action
Current
Assets
Quick
Assets
Current
Liabilities
Current
Ratio
Acid-Test
Ratio
Working
Capital
Beginning*
$300,000
$168,000
$120,000
2.50
1.40
$180,000
June 1
+120,000
+120,000
____
____
_______
June 3
____
____
_______
June 5
+150,000
________
+150,000
____
____
_______
June 7
+100,000
+100,000
+100,000
____
____
_______
June 10
+120,000
+120,000
____
____
_______
June 12
– 275,000
– 275,000
____
____
_______
June 15
________
________
+ 80,000
____
____
_______
Bal.
440,000
233,000
450,000
0.98
0.52
(10,000)
1030
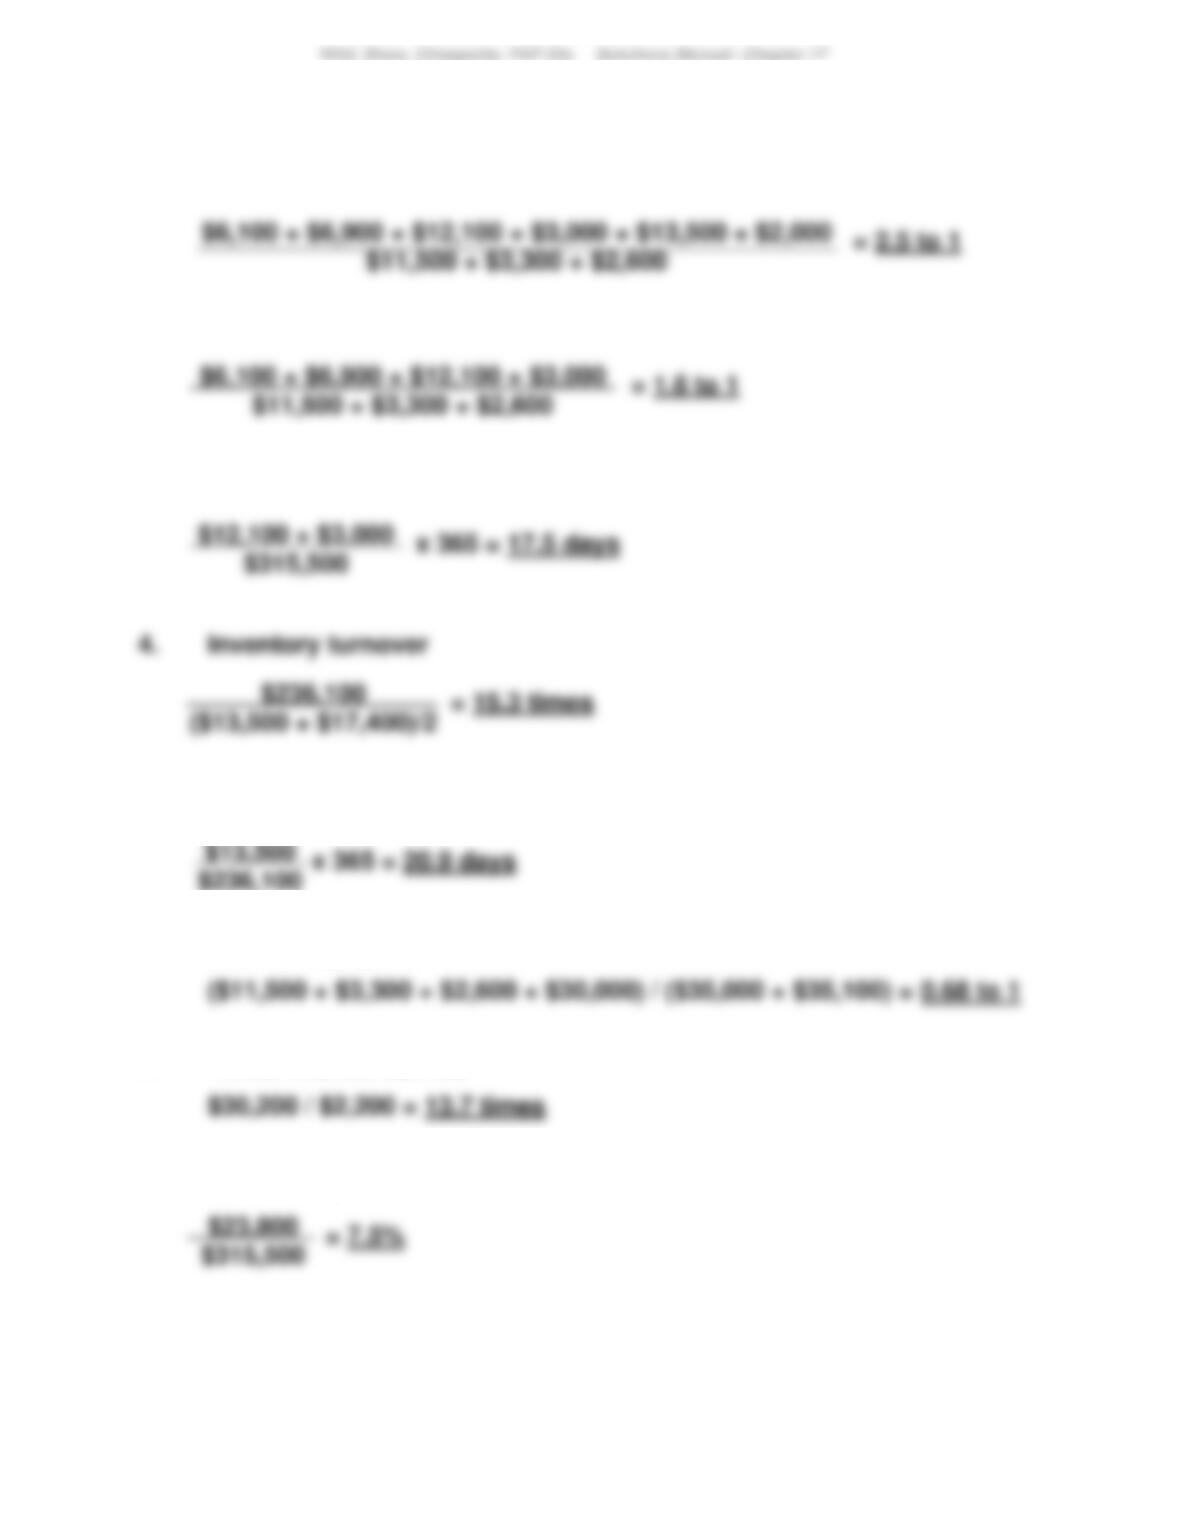
Problem 17-4B (50 minutes)
1. Current ratio
2. Acid-test ratio
3. Days’ sales uncollected
5. Days’ sales in inventory
6. Debt–to-equity ratio
7. Times interest earned
8. Profit margin ratio