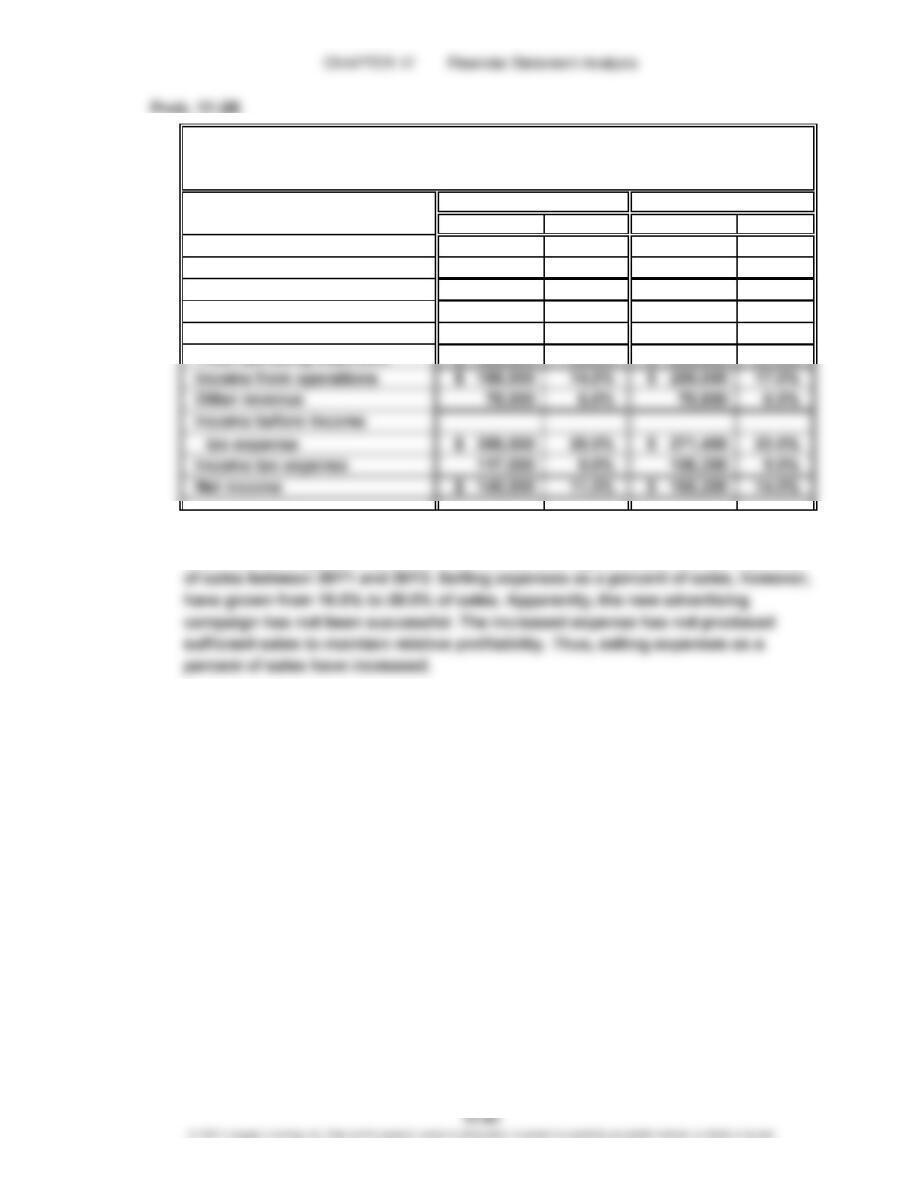
1.
Amount Percent Amount Percent
Sales $1,300,000 100.0% $1,180,000 100.0%
Cost of merchandise sold 682,500 52.5% 613,600 52.0%
Gross profit $ 617,500 47.5% $ 566,400 48.0%
Selling expenses $ 260,000 20.0% $ 188,800 16.0%
Administrative expenses 169,000 13.0% 177,000 15.0%
2. The net income as a percent of sales has declined. All the costs and expenses,
other than selling expenses, have maintained their approximate cost as a percent
20Y2 20Y1
Fielder Industries Inc.
Comparative Income Statement
For the Years Ended December 31, 20Y2 and 20Y1
CHAPTER 17 Financial Statement Analysis
Prob. 17-3B
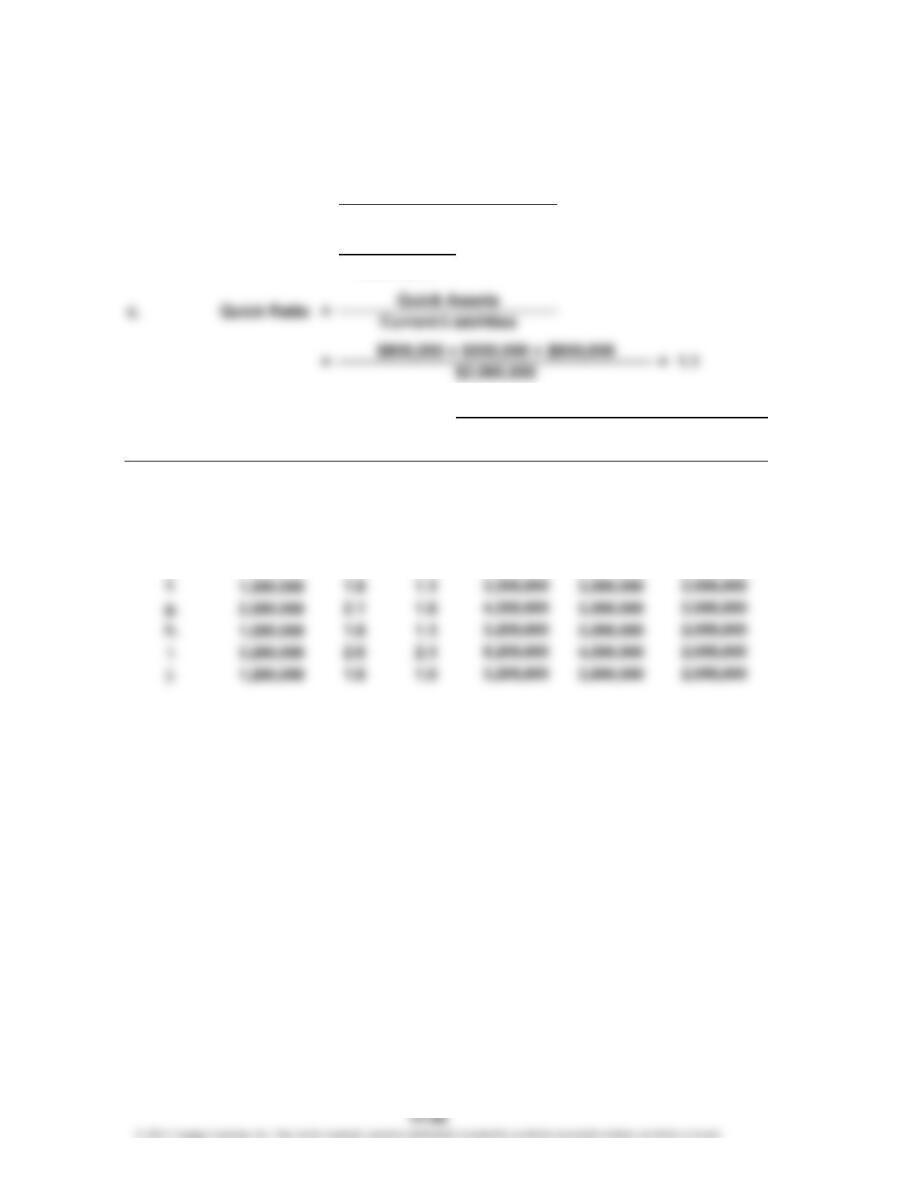
1. a. = Current Assets – Current Liabilities
= $3,200,000 – $2,000,000
2.
Working Quick
Capital Assets
$1,200,000 $2,200,000
1,200,000 1,912,500
1,200,000 2,200,000
1,200,000 2,075,000
875,000 2,200,000
Supporting Data
e.
d.
1.4 0.9 3,200,000
1.5 0.9 3,600,000
1.6 1.1 3,075,000
$3,200,000
1.7 1.1 2,912,500
c.
Current
Ratio
Quick
Ratio
Current
b.
= 1.6
Current Ratio = Current Assets
Current Liabilities
=
$3,200,000
$2,000,000
Working Capital
$1,200,000
Transaction
a.
b.
Current
Liabilities
$2,000,000
1,712,500
2,400,000
1,875,000
2,325,000
Assets
1.6 1.1
CHAPTER 17 Financial Statement Analysis
Prob. 17-4B
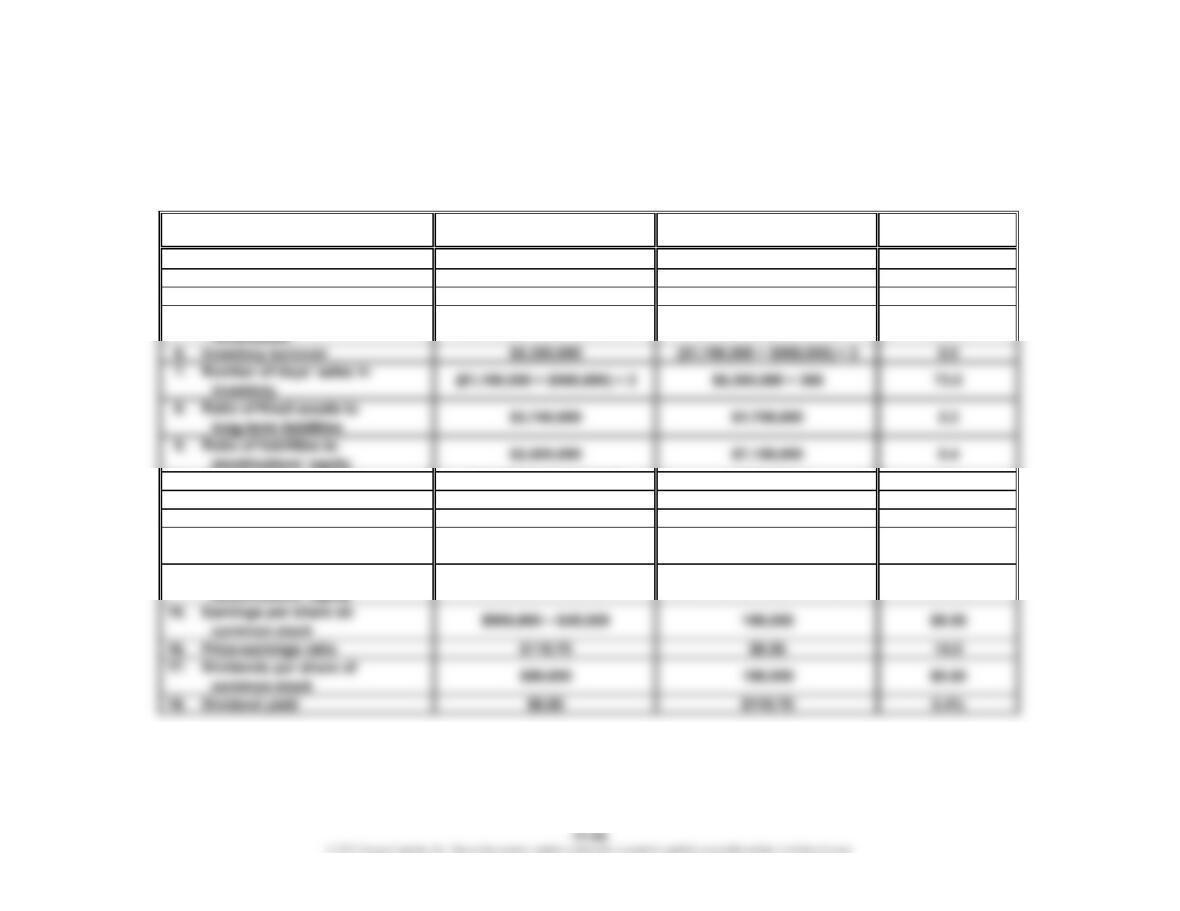
1. Working Capital: $3,690,000 – $900,000 = $2,790,000
Calculated
Numerator Denominator Value
2. Current ratio $3,690,000 $900,000 4.1
3. Quick ratio $2,250,000 $900,000 2.5
4. Accounts receivable turnover $10,000,000 ($740,000 + $510,000) ÷ 2 16.0
5. Number of days’ sales in
stockholders’ equity
10. Times interest earned $1,130,000 + $170,000 $170,000 7.6
11. Asset turnover $10,000,000 ($9,780,000 + $8,755,000) ÷ 2 1.1
12. Return on total assets $900,000 + $170,000 ($9,780,000 + $8,755,000) ÷ 2 11.5%
13. Return on stockholders’
equity
14. Return on common
13.6%
13.3%
($6,680,000 + $5,875,000) ÷ 2
($7,180,000 + $6,375,000) ÷ 2
$900,000 – $45,000
$900,000
22.8
($740,000 + $510,000) ÷ 2 $10,000,000 ÷ 365
Ratio
CHAPTER 17 Financial Statement Analysis
Prob. 17-5B
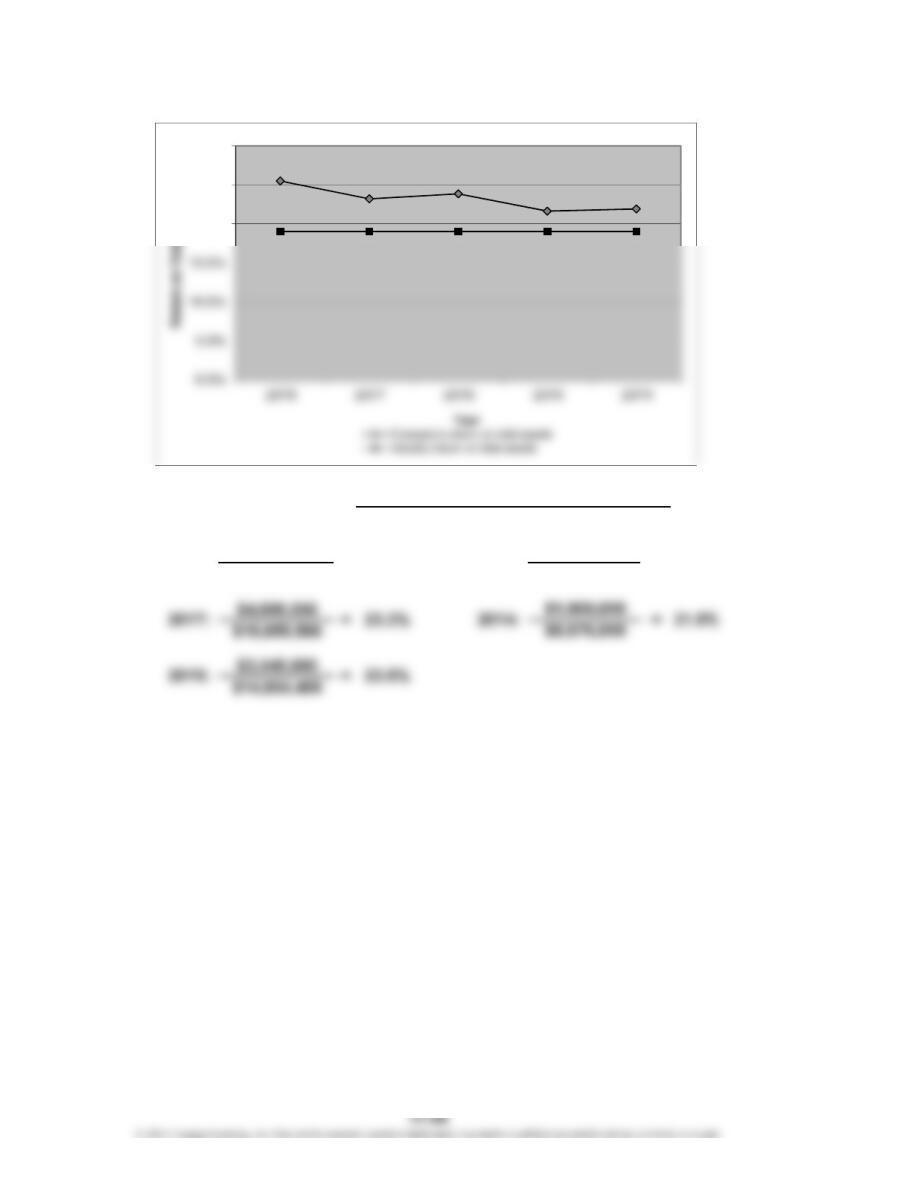
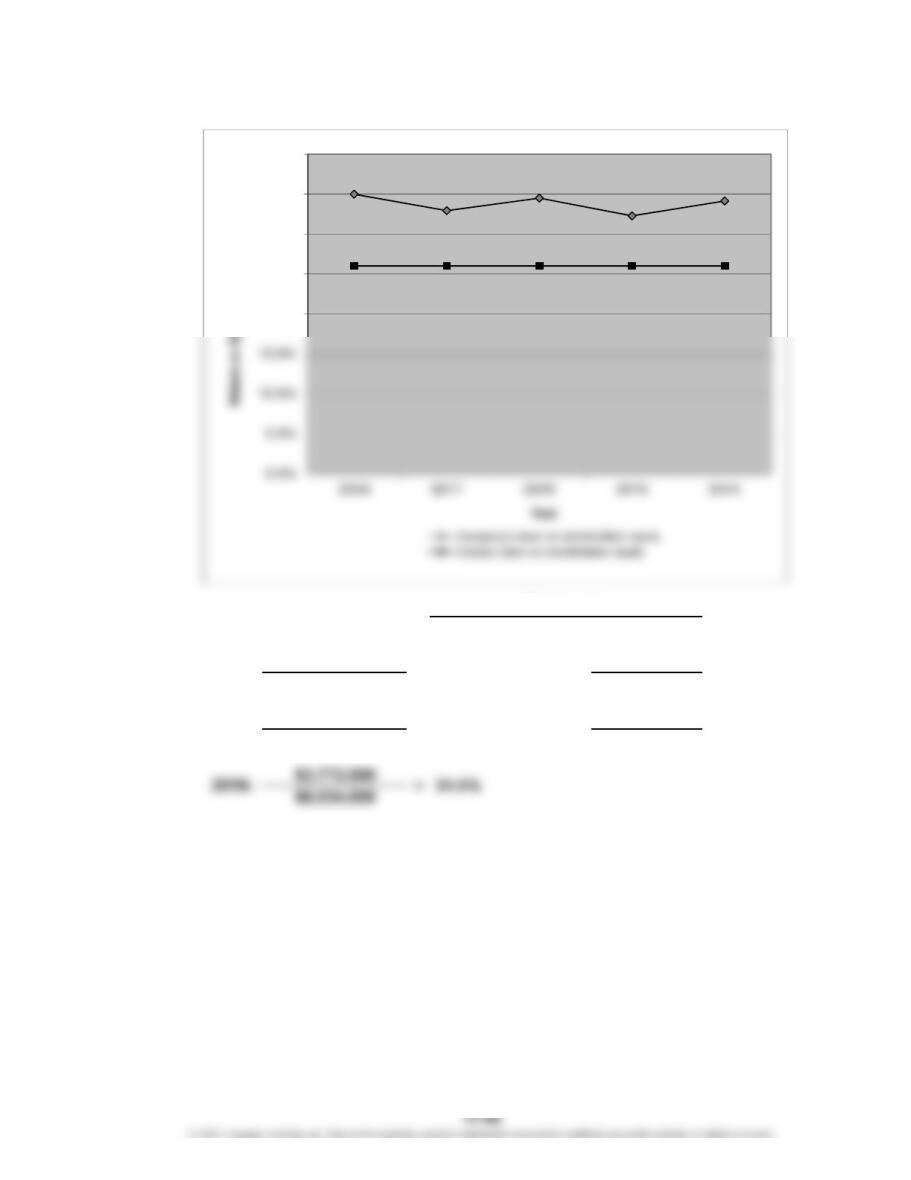
1. a.
$6,623,780
$25,988,665
Return on Total Assets
25.5%
=
=
$11,370,240
Net Income + Interest Expense
Average Total Assets
20Y8: =
20Y5: $2,458,000
21.6%
20.0%
25.0%
30.0%
CHAPTER 17 Financial Statement Analysis
Prob. 17-5B (Continued)
1. b.
$5,571,720
$15,920,340
$3,714,480
$11,277,240
34.1%
20Y8:
$1,400,000 =
=
20Y7: = 20Y4:
32.3%=
$4,100,000
=
35.0%
32.9%
Average Total Stockholders’ Equity
Net Income
Return on Stockholders’ Equity
20Y5: $1,848,000
$5,724,000
20.0%
25.0%
30.0%
35.0%
40.0%
CHAPTER 17 Financial Statement Analysis
Prob. 17-5B (Continued)
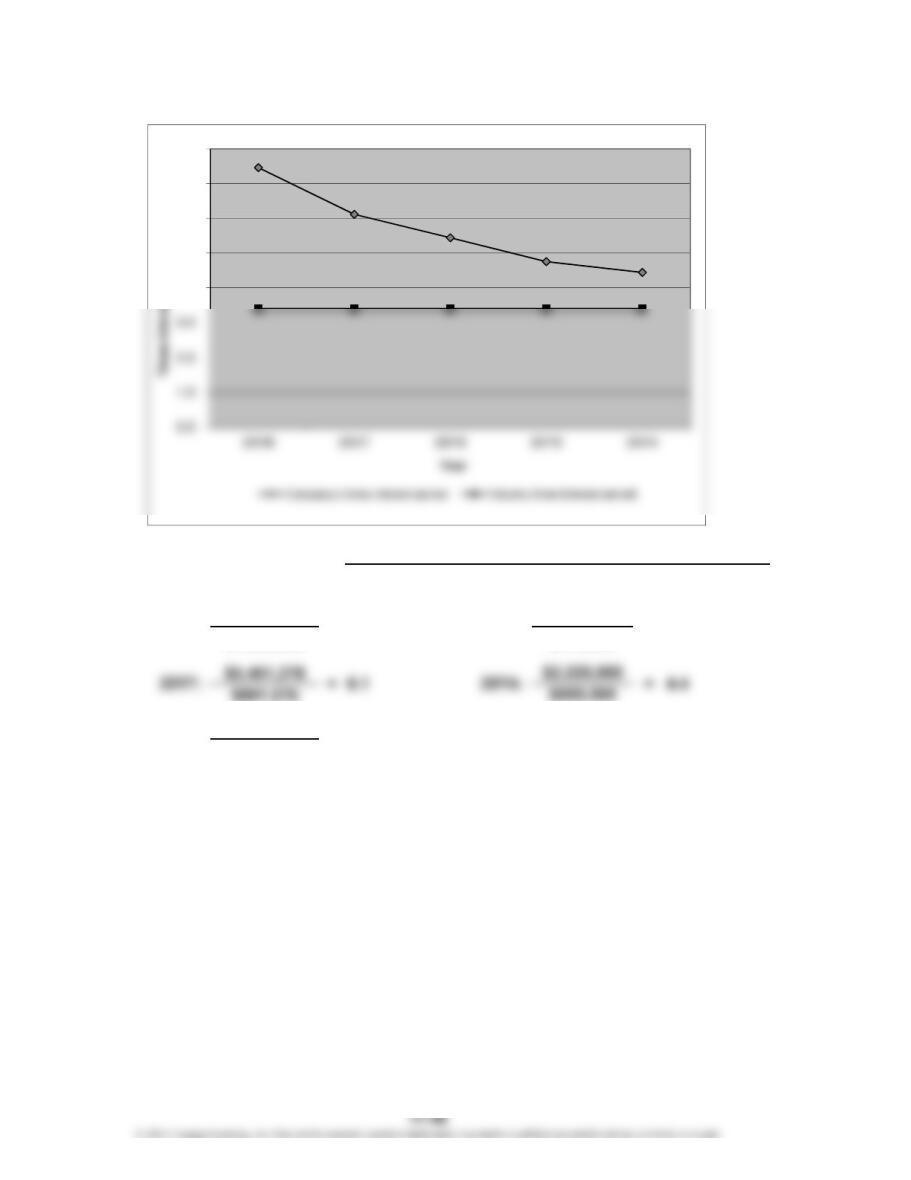
1. c.
$7,849,352
$1,052,060
$891,576
$4,180,920
$768,600
$2,899,600
$610,000
20Y6: = 5.4
Times Interest Earned Net Income + Income Tax Expense + Interest Expense
Interest Expense
7.5
=
4.8=20Y5:20Y8: =
4.0
5.0
6.0
7.0
8.0
CHAPTER 17 Financial Statement Analysis
Prob. 17-5B (Continued)
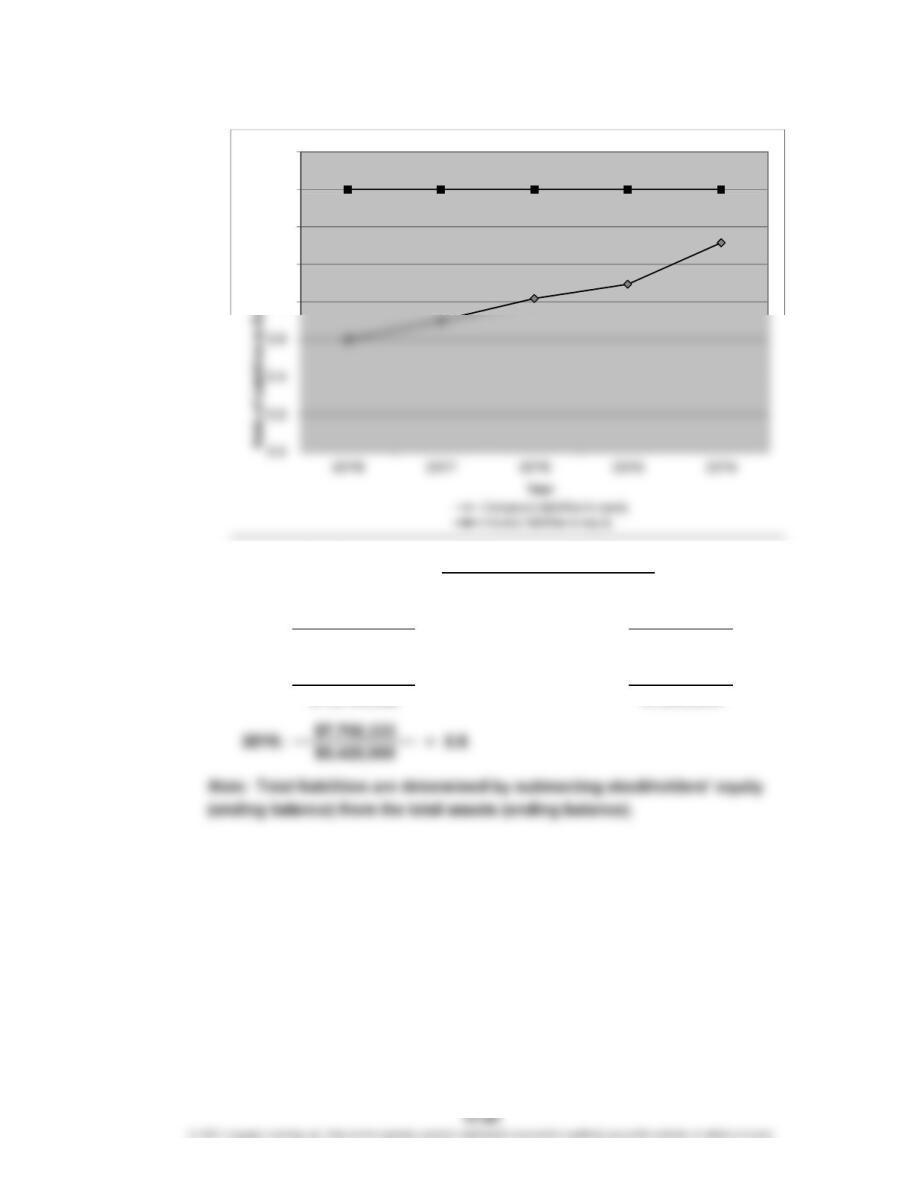
1. d.
$10,672,291
$18,706,200
$9,464,359
1.1
0.9
$5,940,480
$6,648,000
$5,352,000 =
=
=
=
20Y7: = 0.7
Stockholders’ Equity
Ratio of Liabilities to Total Liabilities
Total Stockholders’ Equity
20Y4:
20Y5:
0.620Y8:
0.8
1.0
1.2
1.4
1.6
CHAPTER 17 Financial Statement Analysis
Prob. 17-5B (Concluded)
2. Both the return on total assets and the return on stockholders’ equity are above
the industry average for all five years. The return on total assets is improving
gradually. The return on stockholders’ equity exceeds the return on total assets,
providing evidence of the positive use of leverage. The company is clearly growing
earnings as fast as the asset and equity base. In addition, the ratio of liabilities to
CHAPTER 17 Financial Statement Analysis
May 31, May 31,
2018 2017
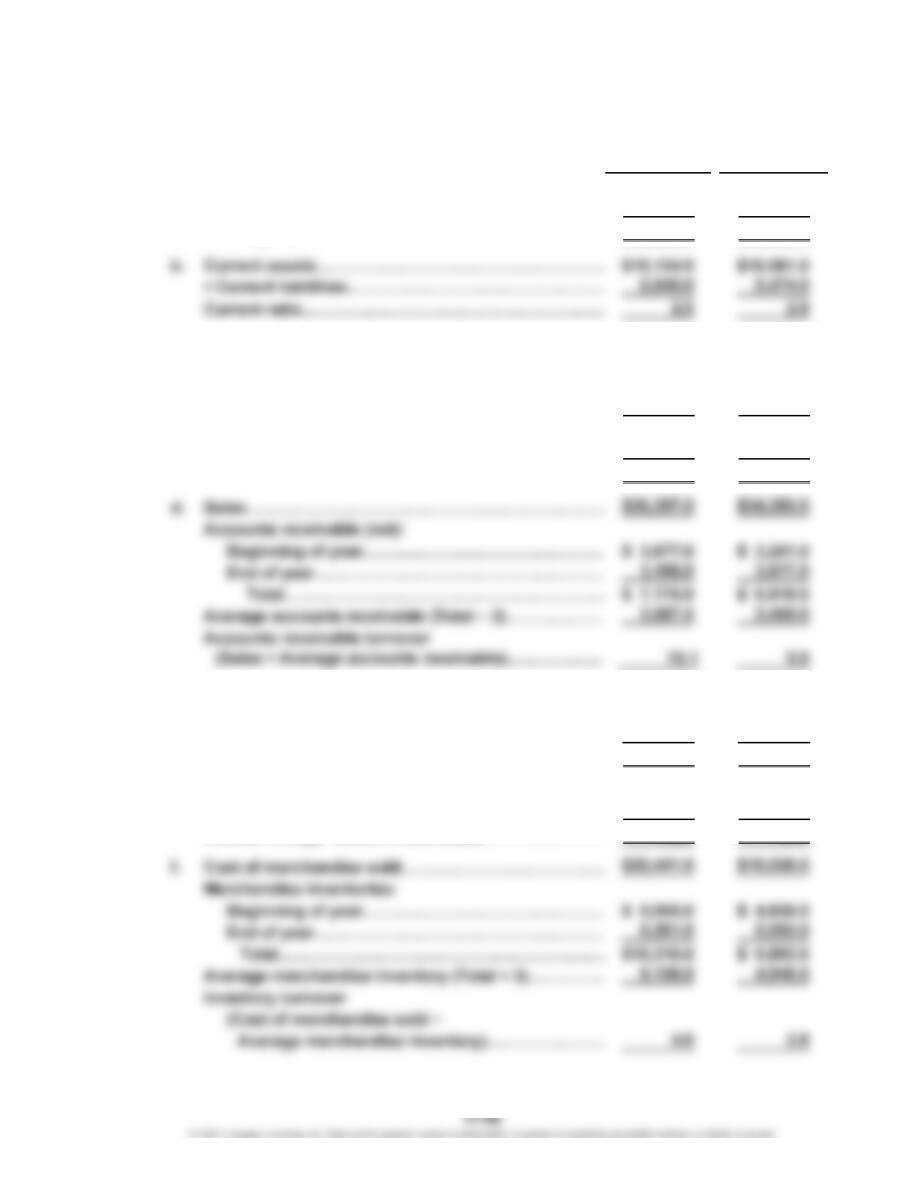
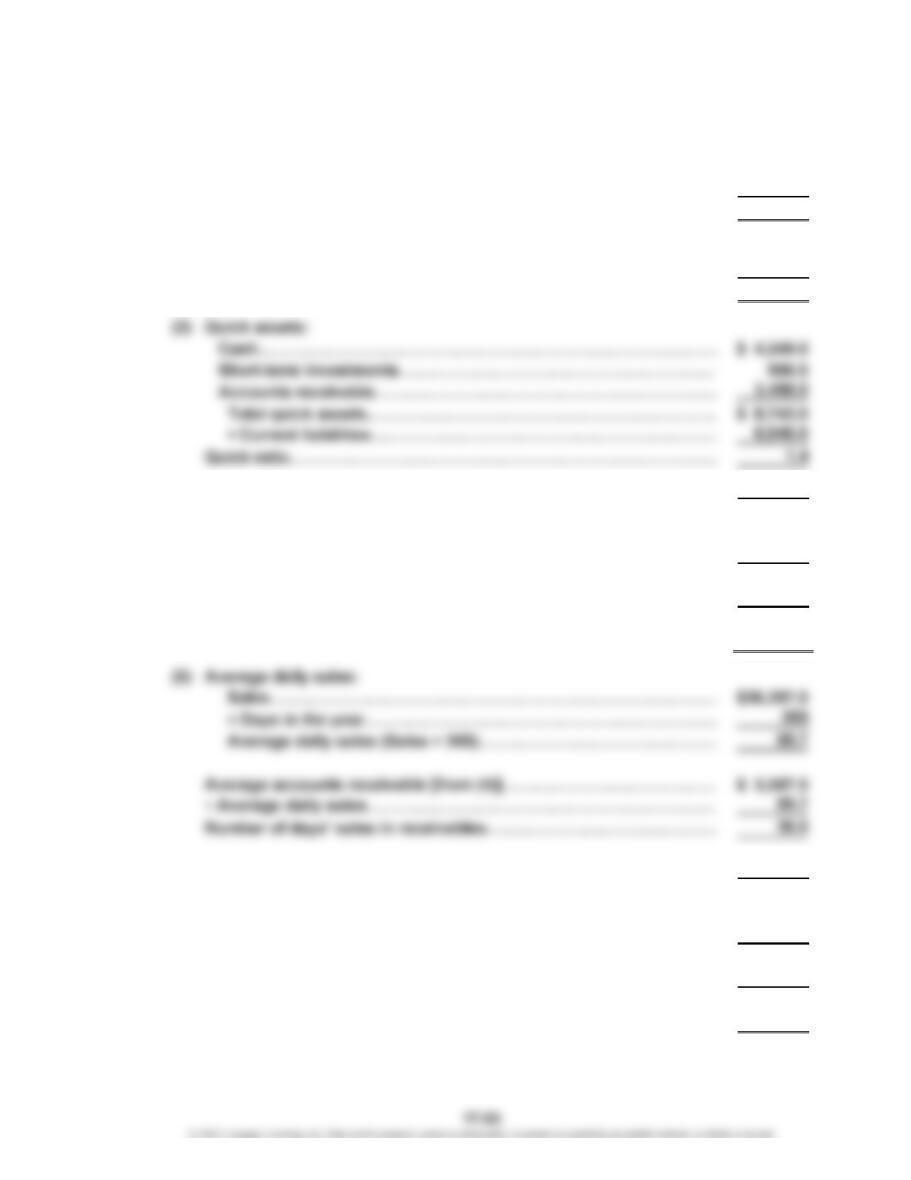
1. a. Current assets……………………………………………
…
$15,134.0 $16,061.0
Current liabilities…………………………………………
…
6,040.0 5,474.0
Working capital……………………………………………
…
$ 9,094.0 $10,587.0
c. Quick assets:
Cash………………………………………………………
…
$ 4,249.0 $ 3,808.0
Short-term investments………………………………
…
996.0 2,371.0
Accounts receivable……………………………………
…
3,498.0 3,677.0
Total quick assets……………………………………
…
$ 8,743.0 $ 9,856.0
÷ Current liabilities………………………………………… 6,040.0 5,474.0
Quick ratio…………………………………………………
…
1.4 1.8
…
e. Average daily sales:
Sales……………………………………………………
…
$36,397.0 $34,350.0
÷ Days in the year……………………………………… 365 365
Average daily sales (Sales ÷ 365)…………………
…
$ 99.7 $ 94.1
Average accounts receivable [from (d)]………………
…
$ 3,587.5 $ 3,459.0
÷ Average daily sales……………………………………
…
99.7 94.1
…
…
…
…
36.0 36.8
NIKE, INC., PROBLEM
…
…
CHAPTER 17 Financial Statement Analysis
May 31, May 31,
2018 2017
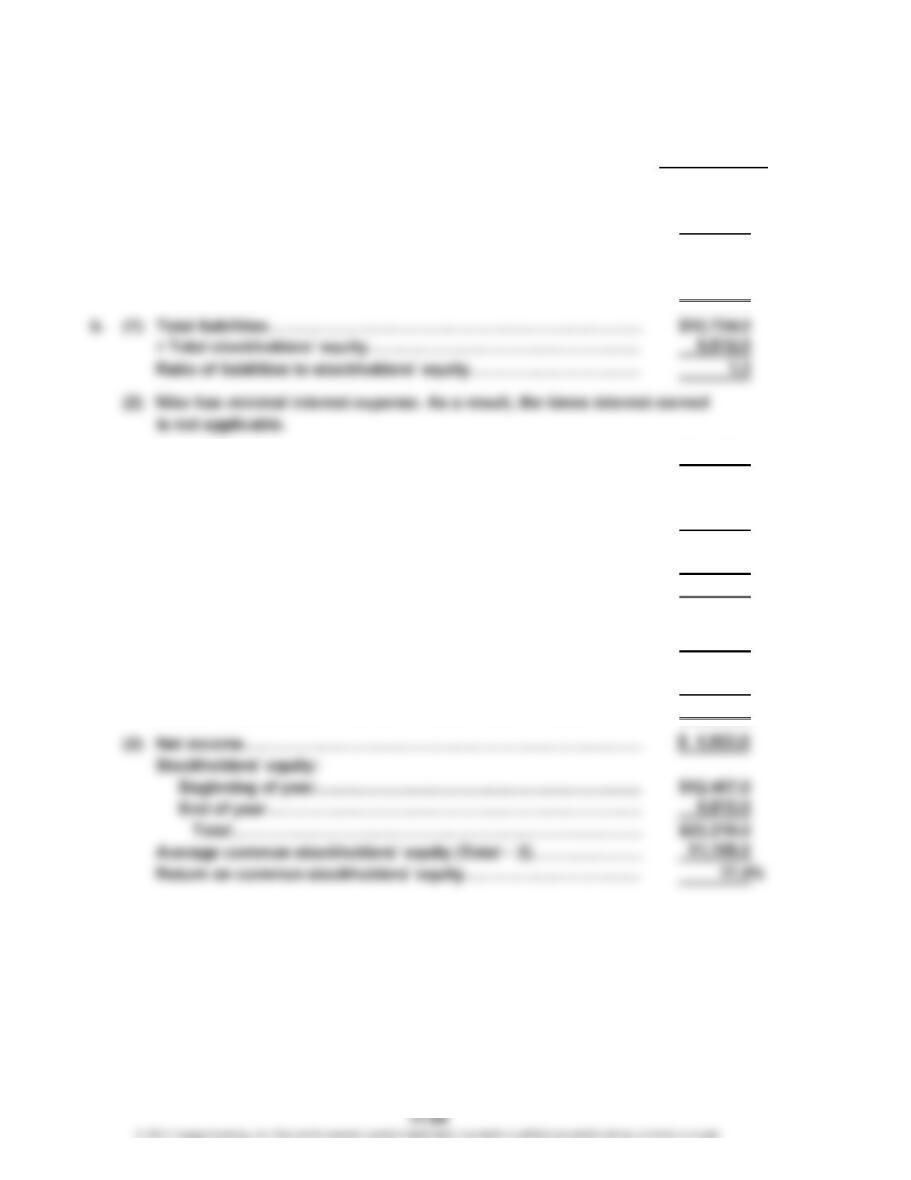
g. Average merchandise inventory [from (f)]…………
…
$ 5,158.0 $ 4,946.5
Cost of merchandise sold……………………………… 20,441.0 19,038.0
Average daily cost of merchandise sold (÷ 365)…… 56.0 52.2
Number of days’ sales in inventory (Average
inventory ÷ Average daily cost
of merchandise sold)…………………………………
…
92.1 94.8
j. Net income………………………………………………
…
$ 1,933.0 $ 4,240.0
Interest expense…………………………………………
…
54.0 59.0
Total……………………………………………………
…
$ 1,987.0 $ 4,299.0
÷ Average total assets [from (i)]………………………
…
22,897.5 22,319.0
Return on total assets…………………………………
…
8.7% 19.3%
k. Net income………………………………………………
…
$ 1,933.0 $ 4,240.0
Stockholders’ equity:
Beginning of year……………………………………
…
$12,407.0 $12,258.0
End of year……………………………………………
…
9,812.0 12,407.0
Total…………………………………………………
…
$22,219.0 $24,665.0
Average common stockholders’ equity (Total ÷ 2)
…
11,109.5 12,332.5
Return on common stockholders’ equity…………… 17.4% 34.4%
…
…
NIKE, INC., PROBLEM (Continued)
…
…
…
…
…
CHAPTER 17 Financial Statement Analysis
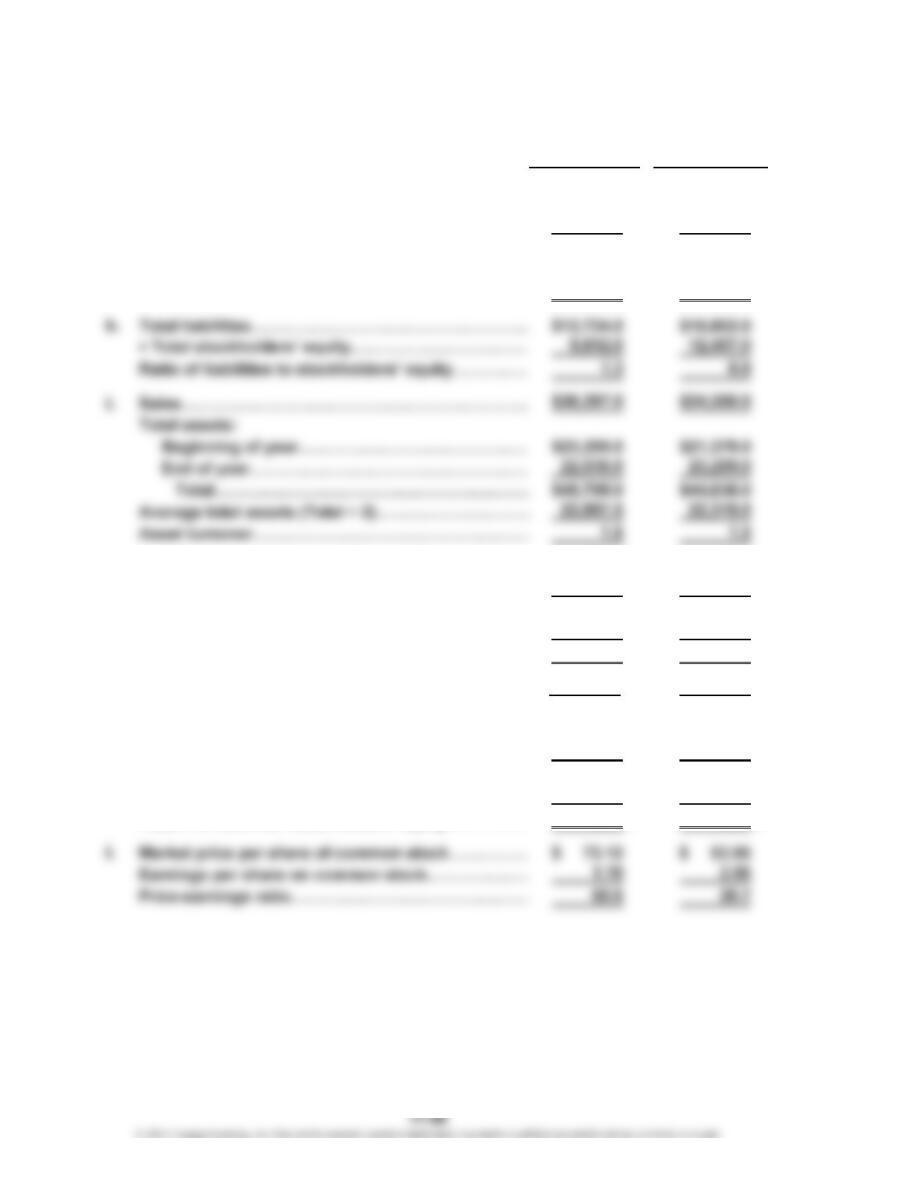
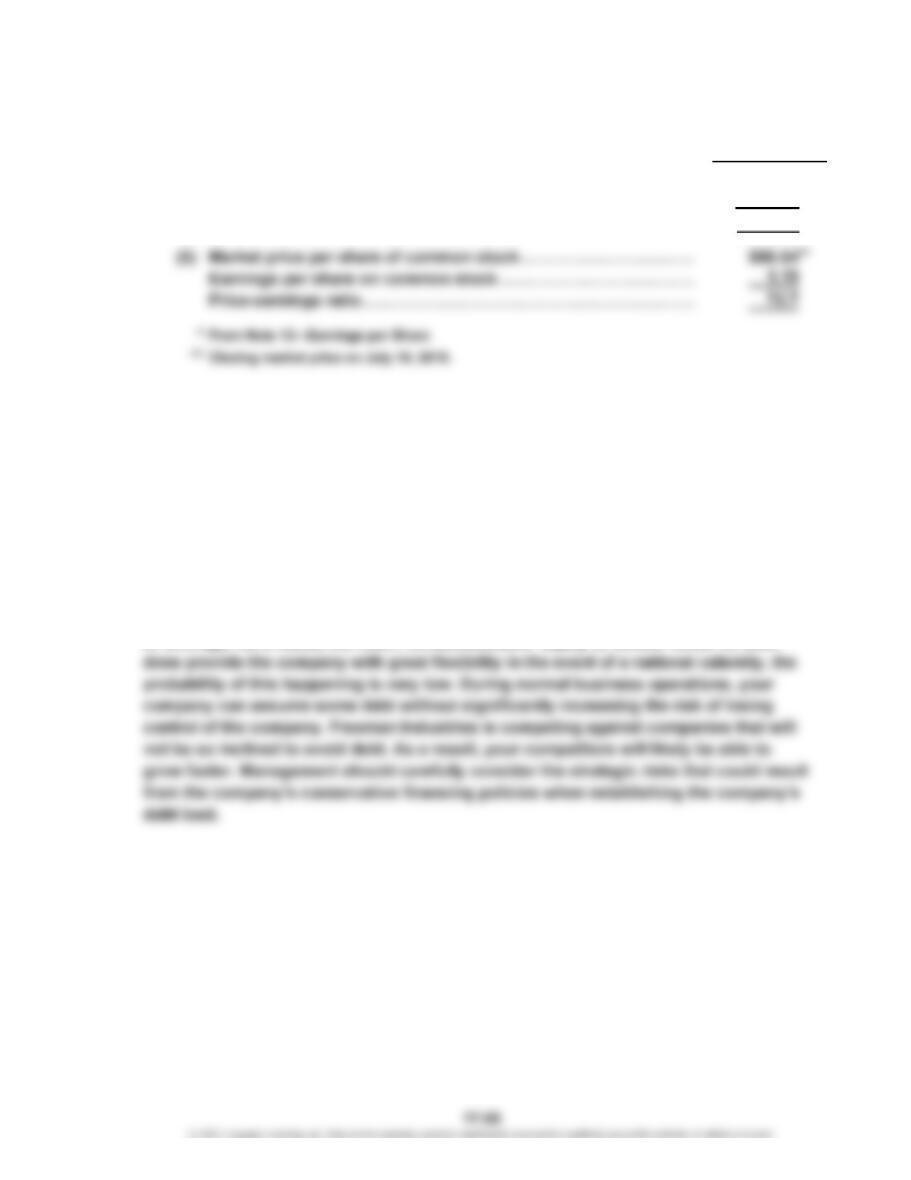
2. Before reaching definitive conclusions, each measure should be compared with
past years, industry averages, and similar firms in the industry.
a. The working capital decreased between years.
b. and c. The current and quick ratios both decreased during 2018.
f. and g. The results of these two analyses show a very slight increase in
inventory turnover and a decrease in the number of days’ sales in
inventory. Both changes are small. Inventory management is critical to
Nike, so this indicates a favorable change.
h. The margin of protection to creditors declined.
i. These analyses indicate that the effectiveness in the use of assets to generate
l. The price-earnings ratio increased from 2017 to 2018. This increase
was driven by a decrease in Nike’s earnings per share (from $2.56 in
2017 to $1.19 in 2018) combined with a sizable increase in stock price
during the same period.
NIKE, INC., PROBLEM (Concluded)
CHAPTER 17 Financial Statement Analysis
CP 17-1
No. Josh did not behave ethically. The Sarbanes-Oxley Act of 2002 requires a report on
internal control by management. This report acknowledges management’s responsibility
CASES & PROJECTS
CHAPTER 17 Financial Statement Analysis
CP 17-2
Sample solution based on Nike’s 2018 financial statements.
a. (1) Current assets………………………………………………………………
…
$15,134.0
– Current liabilities…………………………………………………………… 6,040.0
Working capital………………………………………………………………
…
$ 9,094.0
(2) Current assets………………………………………………………………
…
$15,134.0
÷ Current liabilities…………………………………………………………… 6,040.0
Current ratio…………………………………………………………………
…
2.5
(4) Sales……………………………………………………………………………
…
$36,397.0
Accounts receivable (net):
Beginning of year………………………………………………………… $ 3,677.0
End of year………………………………………………………………… 3,498.0
Total……………………………………………………………………
…
$ 7,175.0
Average accounts receivable (Total ÷ 2)………………………………… 3,587.5
Accounts receivable turnover
(Sales ÷ Average accounts receivable)………………………………… 10.1
…
…
…
(6) Cost of merchandise sold…………………………………………………
…
$20,441.0
Merchandise inventories:
Beginning of year………………………………………………………… $ 5,055.0
End of year………………………………………………………………… 5,261.0
Total………………………………………………………………………
…
$10,316.0
Average merchandise inventory (Total ÷ 2)……………………………
…
5,158.0
Inventory turnover
(Cost of merchandise sold ÷ Average merchandise inventory)…
…
4.0
…
…
…
…
CHAPTER 17 Financial Statement Analysis
May 31,
2018
(7) Average merchandise inventory [from (6)]…………………………
…
$ 5,158.0
Cost of merchandise sold……………………………………………… 20,441.0
Average daily cost of merchandise sold ……………………………
…
56.0
Number of days’ sales in inventory (Average
merchandise inventory ÷ Average
daily cost of merchandise sold)……………………………………
…
92.1
c. (1) Sales………………………………………………………………………
…
$36,397.0
Total assets:
Beginning of year……………………………………………………
…
$23,259.0
End of year……………………………………………………………
…
22,536.0
Total…………………………………………………………………
…
$45,795.0
Average total assets (Total ÷ 2)………………………………………
…
22,897.5
Asset turnover …………………………………………………………
…
1.6
(2) Net income………………………………………………………………
…
$ 1,933.0
Interest expense…………………………………………………………
…
54.0
Total……………………………………………………………………
…
$ 1,987.0
÷ Average total assets [from (c1)]………………………………… 22,897.5
Return on total assets …………………………………………………
…
8.7%
…
…
…
…
CP 17-2 (Continued)
CHAPTER 17 Financial Statement Analysis
May 31,
2018
(4) Net income………………………………………………………………
…
$1,933.0
÷ Number of shares of common stock………………………………
…
1,624
Earnings per share………………………………………………………
…
$ 1.19
CP 17-3
To: Boss Freeman
From: A+ Student
Re: Debt vs. Equity Financing
I have reviewed your company history and appreciate the challenges your company
has faced in the past during economic downturns. While your conservative approach
to debt financing is commendable, your unwillingness to issue debt could limit your
potential for future success. Financing future growth exclusively through retained
earnings and additional stock sales does not allow the shareholders to take advantage
CP 17-2 (Concluded)
*
CP 17-4
1.
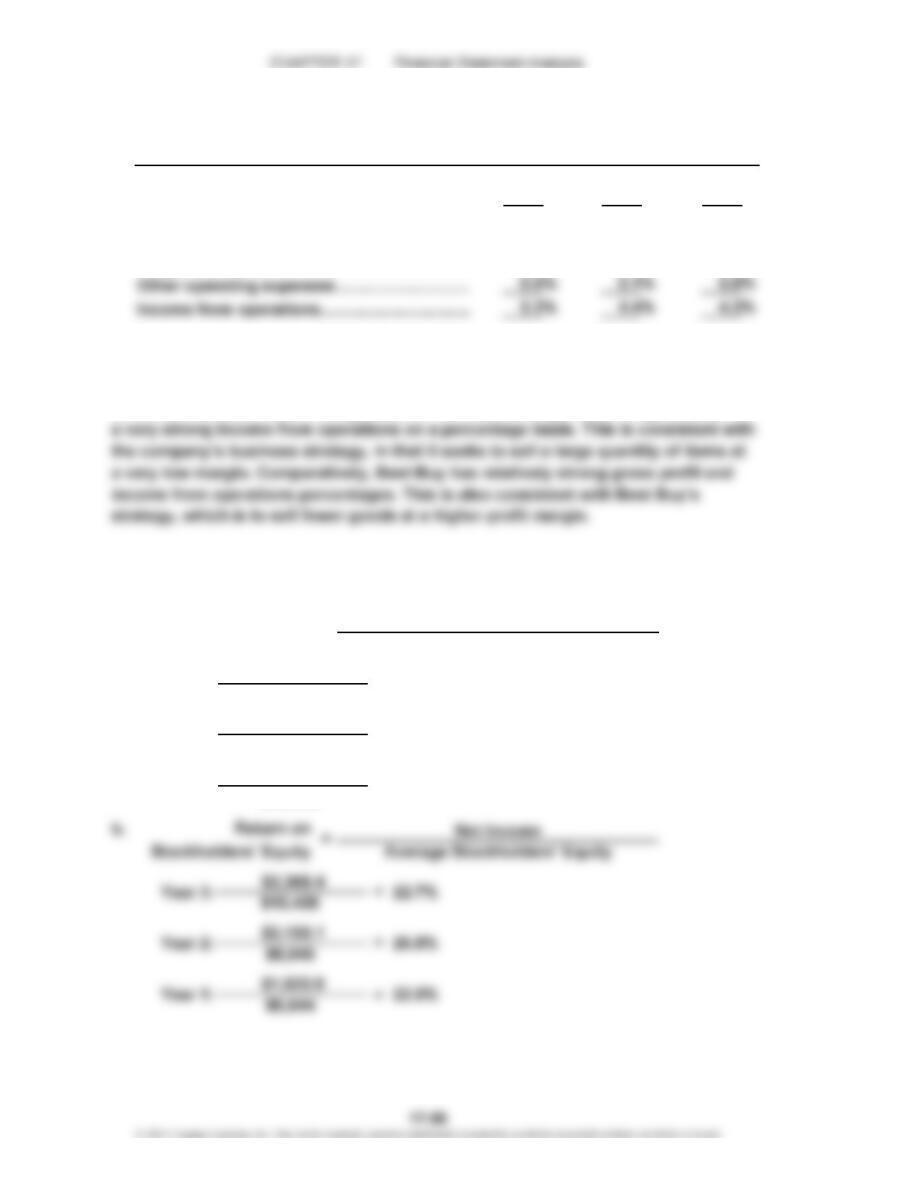
Amazon Best Buy Walmart
Sales……………………………………………………….. 100.0% 100.0% 100.0%
Cost of sales……………………………………………. 59.8% 76.8% 74.9%
Gross profit……………………………………………… 40.2% 23.2% 25.1%
Selling, general, and administrative
expenses……………………………………………….
.
34.9% 18.7% 20.8%
2. Amazon has the highest gross profit on a percentage basis but has the lowest
income from operations on a percentage basis. This is because of the relatively
large percentage of sales that is used for selling, general, and administrative
activities. Walmart has a lower gross profit on a percentage basis but generates
CP 17-5
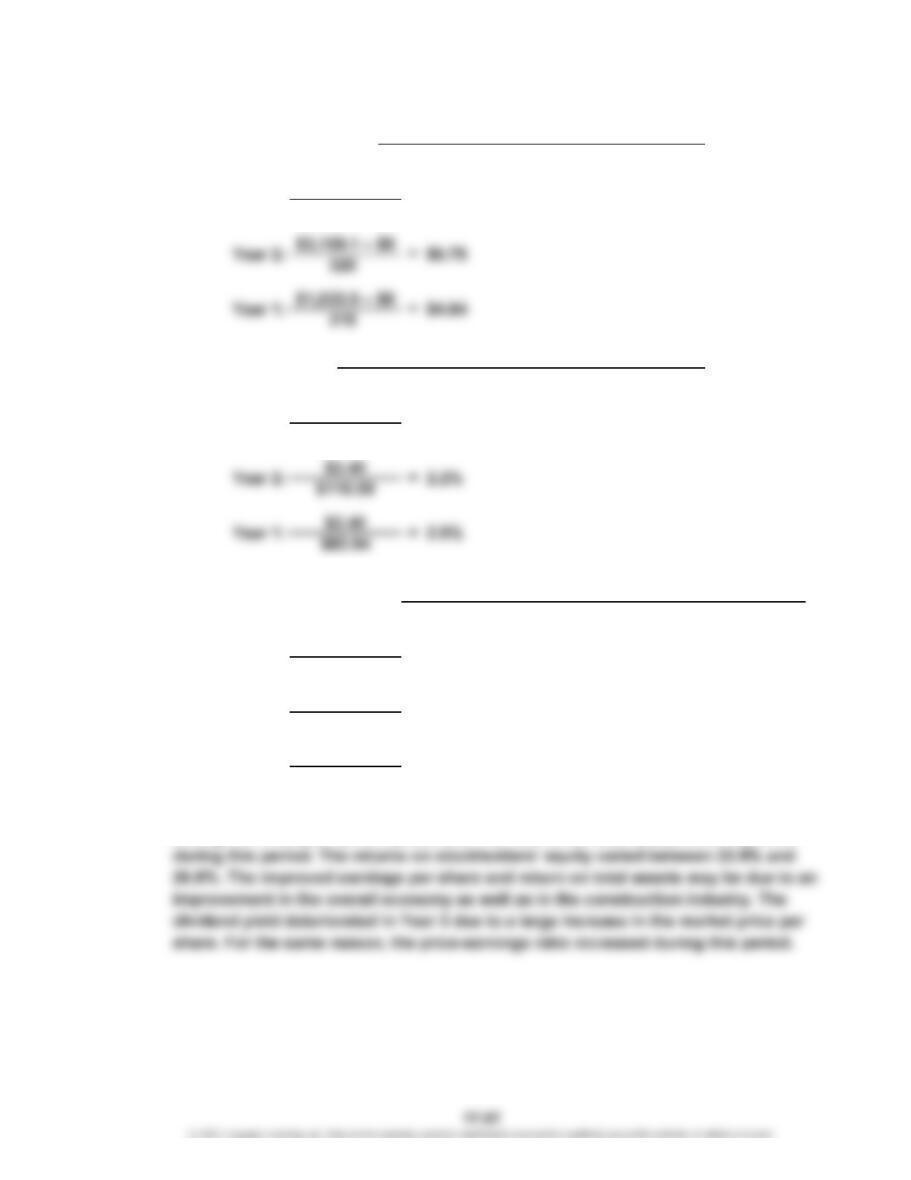
1.
Year 2: $2,159.1 + $899.5 = 4.9%
$61,852
Year 1: $1,523.9 + $763.7 = 3.9%
$57,933
a. Return on Total Assets = Net Income + Interest Expense
Average Total Assets
Year 3: $2,368.4 + $1,203.6 = 5.3%
$67,947
CHAPTER 17 Financial Statement Analysis
CP 17-5 (Concluded)
2. Deere’s profitability, as measured by earnings per share, has improved significantly
during the three-year period presented. The returns on total assets also improved
Year 2: $110.59 = 16.4
$6.75
Year 1: $83.94 = 17.3
$4.84
e. Price-Earnings Ratio = Market Price per Share of Common Stock
Earnings per Share
Year 3: $134.16 = 18.3
$7.33
d. Dividend Yield = Dividend per Share of Common Stock
Market Price per Share of Common Stock
Year 3: $2.58 = 1.9%
$134.16
c. Earnings per Share = Net Income – Preferred Dividends
Shares of Common Stock Outstanding
Year 3: $2,368.4 – $0 = $7.33
323
CHAPTER 17 Financial Statement Analysis
CP 17-6
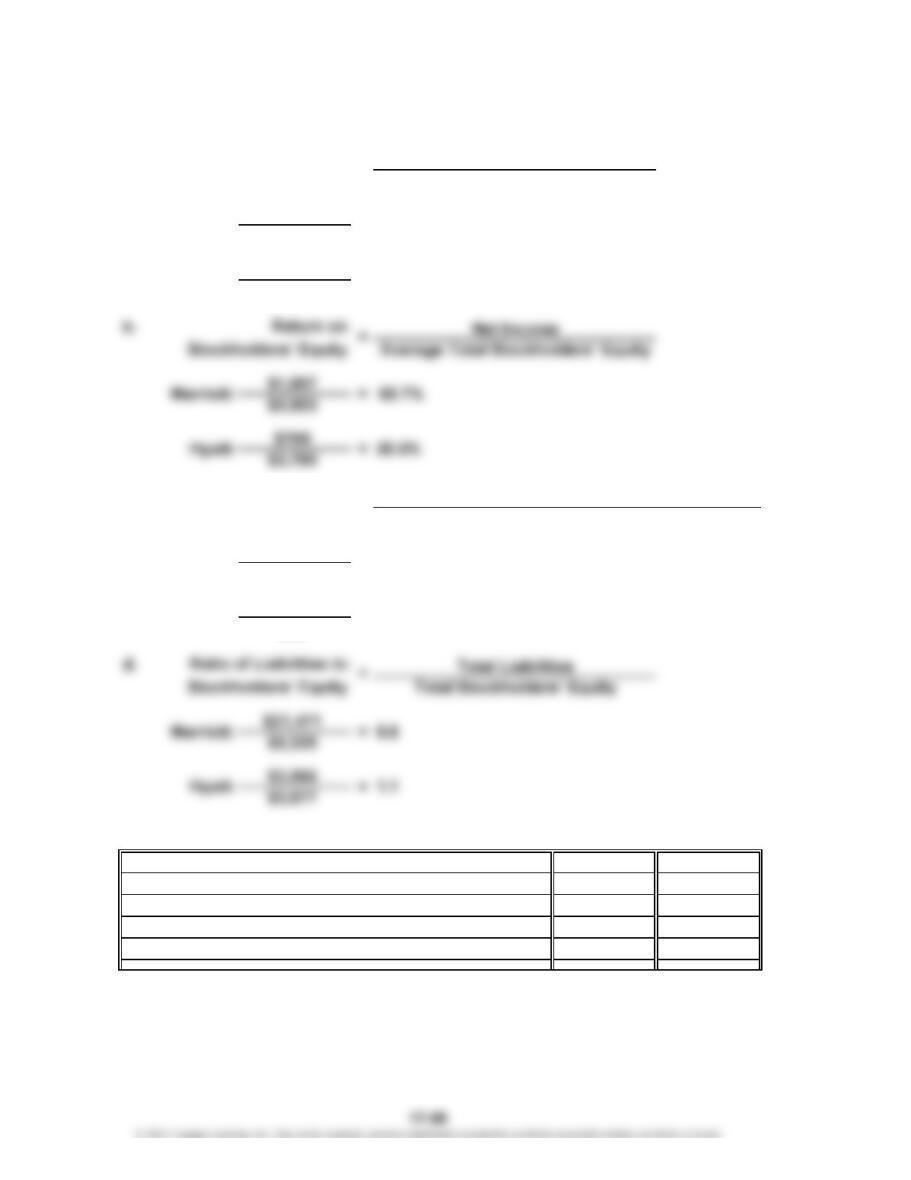
1.
Summary Table:
a. Return on total assets
b. Return on stockholders’ equity
c. Times interest earned
d. Ratio of liabilities to stockholders’ equity
Marriott: $1,907 + $340 = 9.5%
$23,771
a. Return on Total Assets = Net Income + Interest Expense
Average Total Assets
11.1%
$7,608
Hyatt: $769 + $76 =
c. Times Interest Earned = Income Before Income Tax + Interest Expense
Interest Expense
Marriott: $2,345 + $340 = 7.9
$340
Hyatt: $951 + $76 = 13.5
$76
9.6 1.1
Hyatt
9.5% 11.1%
65.7% 20.5%
7.9 13.5
Marriott
CHAPTER 17 Financial Statement Analysis
CP 17-6 (Concluded)
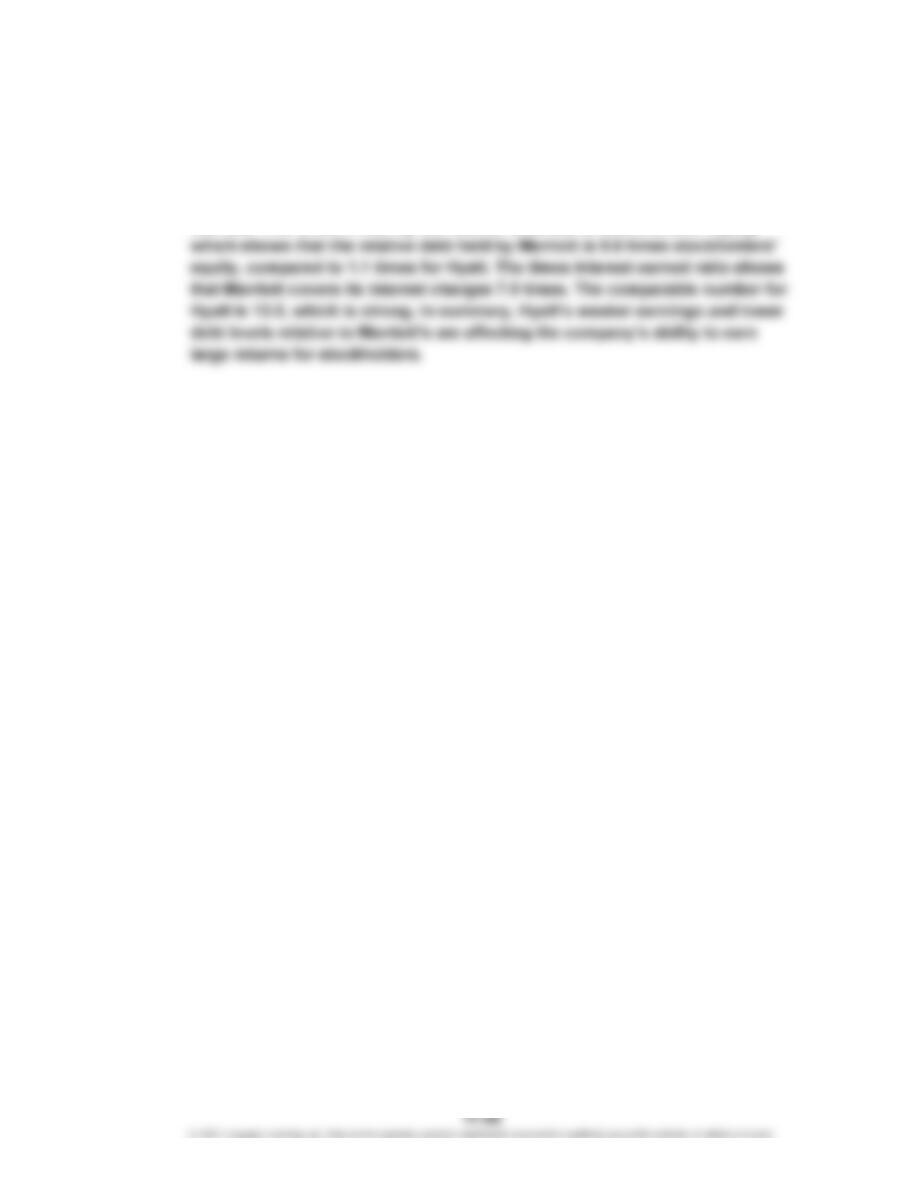
2. Hyatt has a slightly higher return on total assets (11.1% vs. 9.5%), while
Marriott has a significantly higher return on stockholders’ equity (65.7% vs.
20.5%). Hyatt’s weaker performance relative to Marriott’s appears to be due to
its weak earnings relative to its debt level. Hyatt has less leverage than
Marriott. This is confirmed by the ratio of liabilities to stockholders’ equity,