
chapter
17
Financial Statement
Analysis
______________________________________________
OPENING COMMENTS
This chapter presents techniques for analyzing financial statements and the contents of annual reports.
The techniques for analyzing financial statements include horizontal analysis, vertical analysis, and ratio
analysis. Since an analytical technique has been presented at the end of most chapters, some of the
material presented in Chapter 17 will be a review. The appendix presents unusual items on the income
statement.
When covering this chapter, you should guard against getting bogged down in the calculations
surrounding ratio analysis. Try to spend at least as much class time interpreting ratios as calculating them.
Emphasize that computing ratios is only the starting point for assessing the performance of a business. To
be meaningful, current-year ratios must be compared with ratios from prior years and ratios of other
companies in the same industry. The influence of the general economic and business environment should
be considered. Finally, sound financial judgment should be applied.
After studying the chapter, your students should be able to:
2. Use financial statement analysis to assess the solvency of a business.
4. Describe the contents of corporate annual reports.
STUDENT FAQS
• Do we have to memorize all these formulas?
• Which formulas are the most important?

294 Chapter 17 Financial Statement Analysis
• What are the top five formulas?
• Should we use these formulas to tell how a company is doing before we invest in it?
• These are hard since I did not learn some of this information earlier. What do you suggest I do?
• What do these formulas really tell us about the company?
• How do I know if a ratio of fixed assets to long-term liabilities of 3.8 is good or bad?
• Is vertical or horizontal analysis better?
• How are some of these ratios related? If a company’s accounts receivable turnover is poor, then won’t
the numbers of days’ sales in receivables be poor too?
• How much emphasis should I put on unusual items in a company’s income statement when evaluating
its financial condition?
OBJECTIVE 1
Describe basic financial statement analytical methods.
KEY TERMS
Common-Sized Statement Vertical Analysis
Horizontal Analysis
SUGGESTED APPROACH
The basic financial statement analytical procedures are horizontal analysis, vertical analysis, and ratio
analysis. Ratio analysis is covered under Objectives 2 and 3.
DEMONSTRATION PROBLEM — Horizontal Analysis
Ask your students to turn to the annual report for Nike in Appendix C at the end of the text. Specifically,
direct them to the Consolidated Statements of Income. Ask your students to compute the dollar increase
in net sales (Gross Margin) between fiscal year 2010 and fiscal year 2011. (Answer: $708 million, or
$708,000,000)
Next, ask your students to calculate the percentage increase in Gross Margin from 2010 to 2011. The
correct answer is 8 percent, calculated as follows:
Increase in Gross Margin between 2010 and 2011 ÷ Net Sales in 2010 (base year) =
$708 million ÷ $8,800 million = 8%
Most likely, a few students will have 7.4 percent as an answer. These students have compared the $708
million increase in net sales to sales in fiscal year 2011. Remind them that a percentage change in a

Chapter 17 Financial Statement Analysis 295
financial statement item is computed by comparing the change in dollars to the base year amount. The
base year is the starting point—fiscal year 2010 in this case.
Ask your students to calculate the percentage increase in Gross Margin from 2009 to 2010. The answer is
as follows:
8800.4 million – 8604.4 million = 196 million ÷ 8604.4 million = 2.3%
Remind students that this analytical technique is called horizontal analysis (or trend analysis). It is used to
compare changes in operating results from year to year.
GROUP LEARNING ACTIVITY — Horizontal Analysis
Divide your class into small groups. Ask them to perform the horizontal analysis requested on
Transparency Master (TM) 17-1 using the financial statements. The correct answers are displayed on TM
17-2.
GROUP LEARNING ACTIVITY — Vertical Analysis
Under vertical analysis, all financial statement items are shown as a percentage of a significant total on
the statement. On an income statement, all items are shown as a percentage of net sales. On a balance
sheet, all items are shown as a percentage of total assets.
Divide your class into small groups. Ask each group to perform vertical analysis on Nike’s 2011 Income
Statement (called the Consolidated Statements of Income), showing each item through Net Income as a
percentage of Gross Margin. Suggest that percentages be rounded to one decimal place. The correct
solution is shown on TM 17-3.
Emphasize that TM 17-3 shows a common-size income statement. Common-size statements use vertical
analysis to show all items as percentages. Expressing financial statements as percentages is useful when
comparing one company with another or with industry averages.
OBJECTIVE 2
Use financial statement analysis to assess the solvency of a business.
KEY TERMS
Accounts Receivable Analysis Number of Times Interest Charges Are Earned
Accounts Receivable Turnover Profitability
Current Position Analysis Quick Assets
Current Ratio Quick Ratio

296 Chapter 17 Financial Statement Analysis
Inventory Analysis Ratio of Fixed Assets to Long-Term Liabilities
Inventory Turnover Ratio of Liabilities to Stockholders’ Equity
Number of Days’ Sales in Inventory Solvency
Number of Days’ Sales in Receivables Working Capital
SUGGESTED APPROACH
Solvency, which is a company’s ability to pay debts as they become due, is assessed through ratio
analysis. TM 17-4 lists the ratios that measure a firm’s solvency.
Use the following group learning activities to give your students the opportunity to practice ratio analysis
as it relates to solvency.
GROUP LEARNING ACTIVITY — Computing Solvency Measures
The ratios that assess solvency are listed in the text in the first section of Exhibit 10. Calculating these
ratios using real-life financial statements is a challenge for most students, due to the differences in
terminology used by companies. For example, a company may use the term “plant assets” or “property,
plant, and equipment” instead of fixed assets. Of course, students need to become proficient at
recognizing different terms for the concepts they have learned in this course. You can help your students
make these connections by calculating ratios using financial statements of real companies.
The textbook includes a Nike Inc. Financial Statement Analysis problem immediately following the series
B problems. Ask your students to calculate each of the solvency ratios in this problem (items a through
h). Remind your students to assume that all of Nike’s sales were on account. The solution to this problem
is found in the Instructor’s Solutions. You may also want to ask your students to describe, in their own
words, what each ratio measures.
GROUP LEARNING ACTIVITY — Analyzing Solvency Measures
TM 17-5 shows solvency ratios for Ace Company over a two-year period. The TM also presents industry
averages for the solvency ratios. Ask your students to analyze the data related to Ace Company and
comment on its performance. Specifically, ask them to answer the following questions:
1. For each solvency ratio, state whether or not Ace has improved from the prior year.
3. Comment on any significant items noticed when reviewing the solvency ratios and Ace’s overall
solvency.
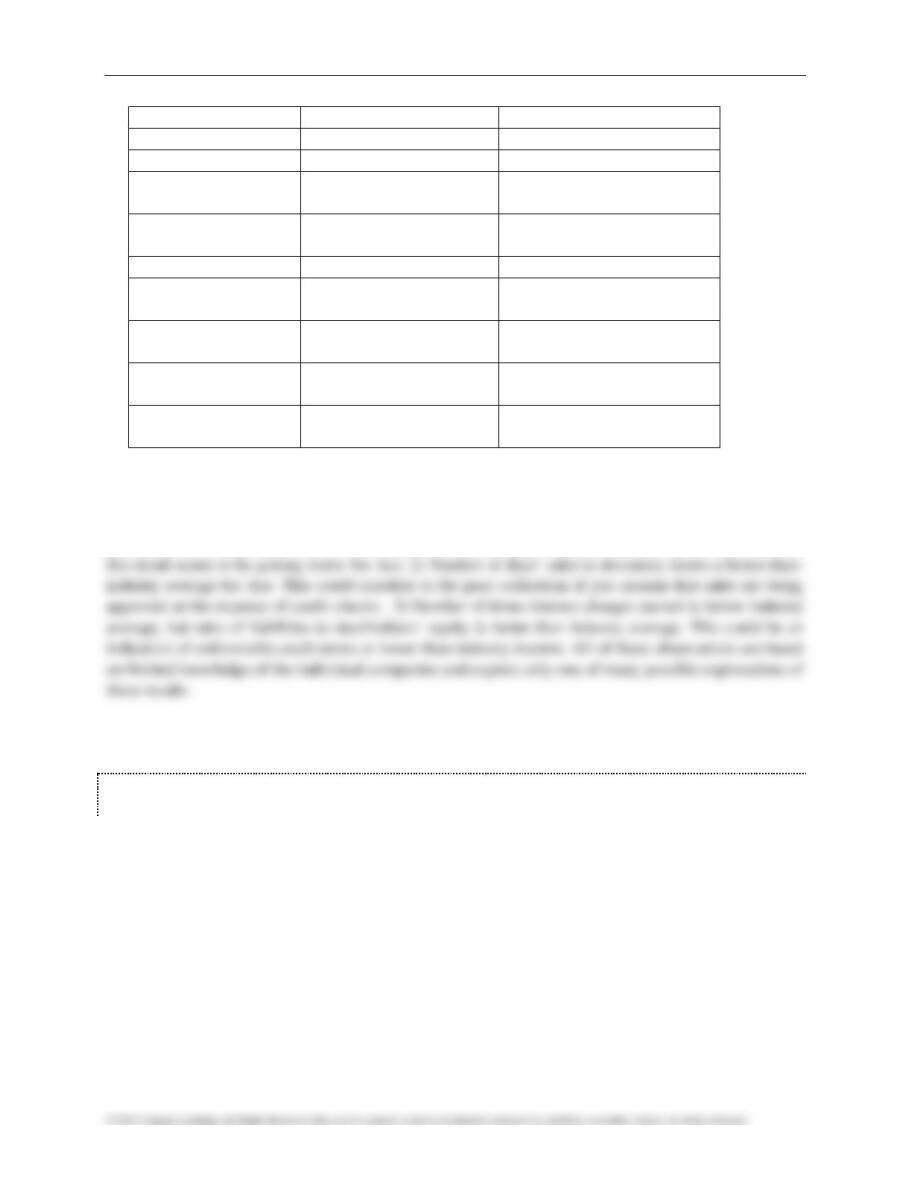
Possible response: The table below provides a summary of the questions listed above:
Chapter 17 Financial Statement Analysis 297
Ratio
Ace Prior Year
Ace vs. Industry
Current Ratio
Improved
Better
Quick Ratio
Unchanged
Better
Account receivable
turnover
Worse
Worse
Number of days’ sales
in receivables
Worse
Worse
Inventory turnover
Worse
Worse
Number of days’ sales
in inventory
Improved
Better
Ratio of fixed assets to
long-term liabilities
Unchanged
No significant difference
Ratio of liabilities to
stockholders’ equity
Improved
Better
Number of times
interest charges earned
Improved
Worse
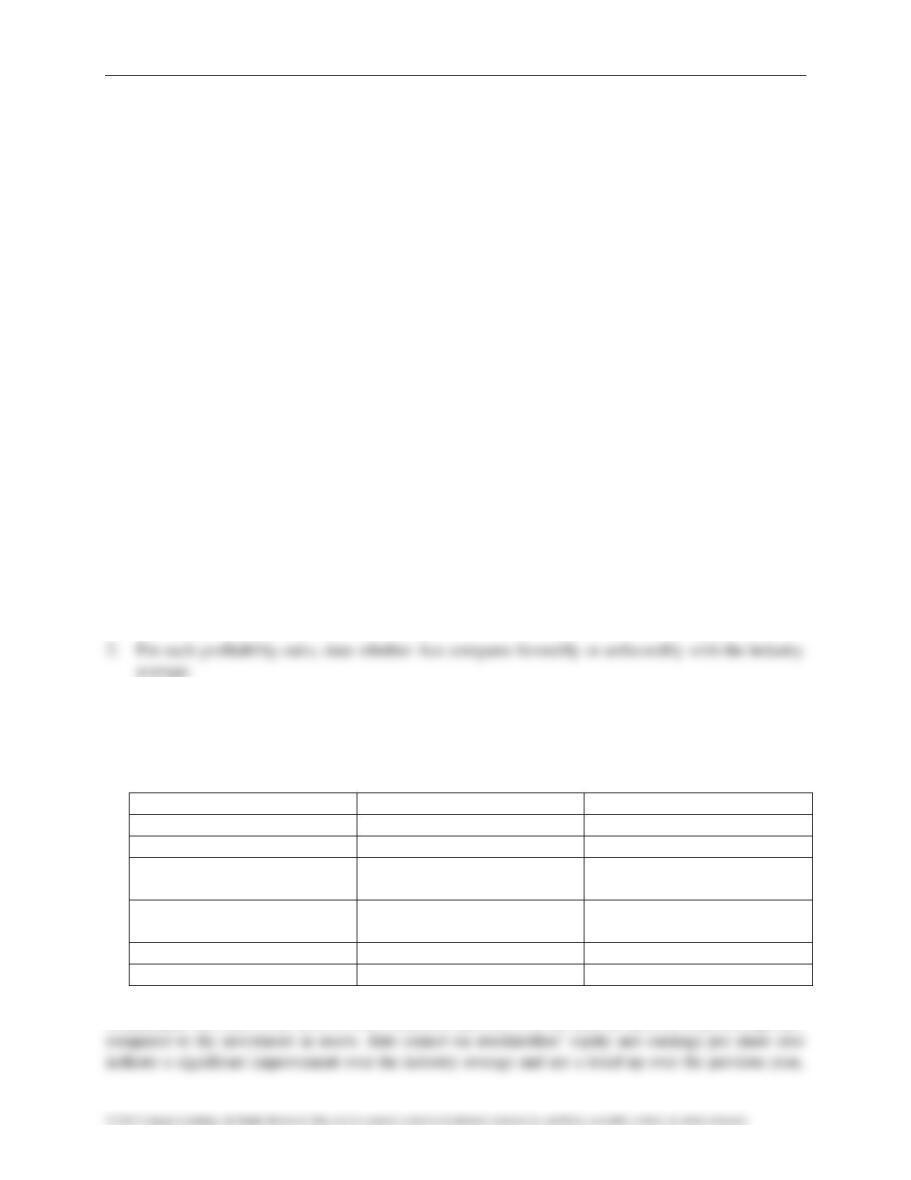
Comments: 1) The accounts receivable turnover and number of days’ sales in receivables show higher
than the industry average. This could mean that Ace’s terms are longer than industry average (45 days vs.
30 days) or that Ace does not perform adequate credit checking or does a poor job of collections. Also,
OBJECTIVE 3
Use financial statement analysis to assess the profitability of a business.
KEY TERMS
Dividends per Share Rate Earned on Common Stockholders’ Equity
Dividend Yield Rate Earned on Stockholders’ Equity
Earnings per Share (EPS) on Common Rate Earned on Total Assets
Stock Ratio of Net Sales to Assets
Leverage
Price Earnings (P/E) Ratio
298 Chapter 17 Financial Statement Analysis
SUGGESTED APPROACH
Profitability, which is a company’s ability to earn income, is also assessed through ratio analysis. TM 17-
6 lists the ratios that measure a firm’s profitability.
Use the Group Learning Activities below to give your students the opportunity to practice ratio analysis
as it relates to profitability.
GROUP LEARNING ACTIVITY — Computing Profitability Measures
The ratios that assess profitability are listed in the text in the second part of Exhibit 10. Ask your students
to calculate each of the profitability ratios (items i through m) for the Nike Inc. Financial Statement
Analysis problem in the text. You will also want to emphasize that earnings per share (called “Basic
Earnings per Share”) are reported on Nike’s income statement; therefore, students do not need to calculate
these amounts. The solution to this problem can be found in the Instructor’s Solutions. You may want to
ask your students to describe, in their own words, what each ratio measures.
GROUP LEARNING ACTIVITY — Analyzing Profitability Measures
TM 17-7 shows profitability ratios for Ace Company over a two-year period. The TM also presents
industry averages for the profitability ratios.
Ask your students to analyze the data related to Ace Company and comment on its performance.
Specifically, ask them to answer the following questions:
1. For each profitability ratio, state whether or not Ace has improved from the prior year.
3. Comment on any significant items noticed when reviewing the profitability ratios and Ace’s overall
profitability.
Possible response: The table below provides a summary of the questions listed above:
Ratio
Ace Prior Year
Ace vs. Industry
Ratio of net sales to assets
Improved
Better
Rate earned on total assets
No change
No significant difference
Rate earned on stockholders’
equity
Improved
Better
Earnings per share on common
stock
Improved
No comparison
Price earnings ratio
Worse
Worse
Dividend yield
No Change
Better
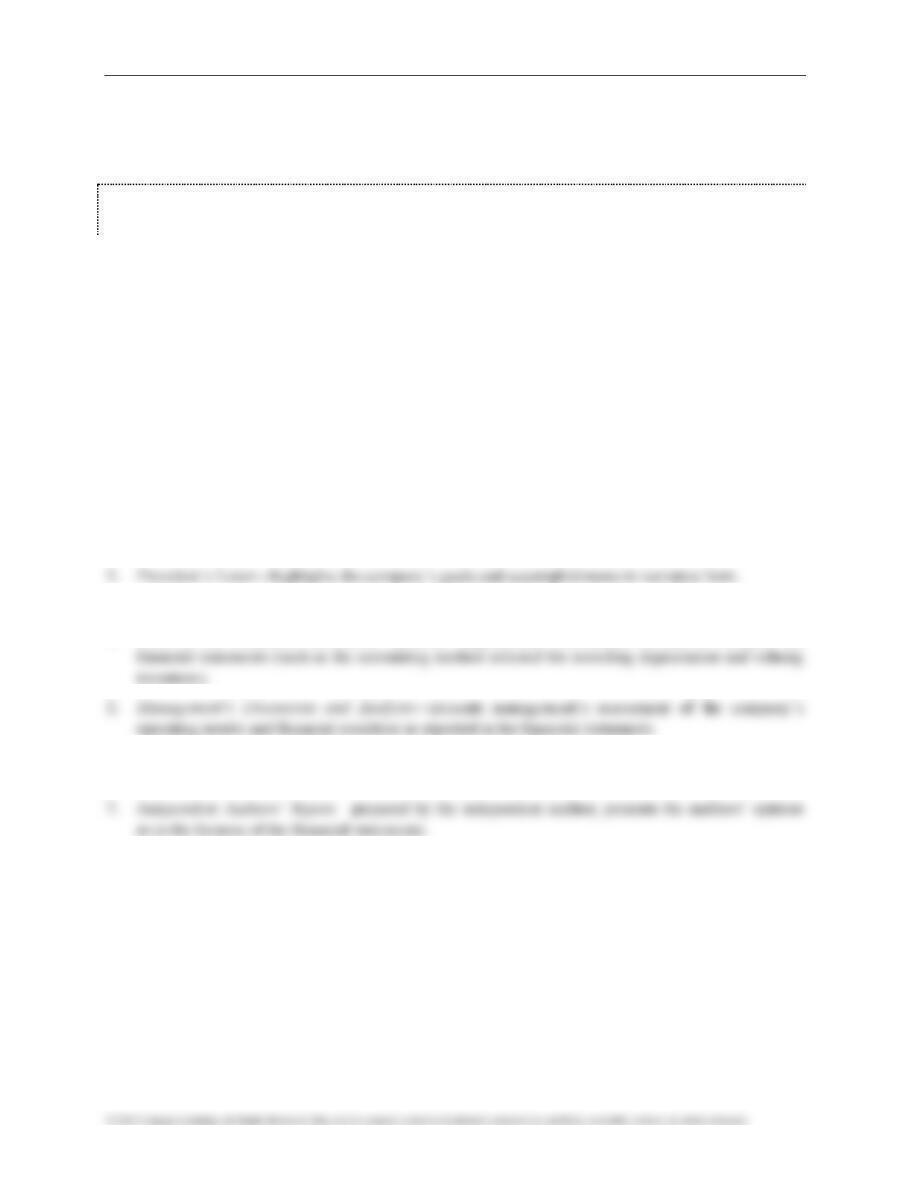
Comments: The ratio of net sales to assets indicates that Ace is better than the industry at producing sales
Chapter 17 Financial Statement Analysis 299
which would indicate that sales are up, as is net income, but the price earnings ratio has not resulted in an
increase to market price of the stock.
OBJECTIVE 4
Describe the contents of corporate annual reports.
KEY TERMS
Management’s Discussion and Analysis (MD&A)
SUGGESTED APPROACH
The text presents information on the Management Discussion and Analysis section of the annual report
plus the Independent Auditor’s Report. You may want to briefly mention other components of the annual
report. TM 17-8 lists several sections typically included in a corporate annual report. Briefly review these
sections and their content with your students, using the notes below.
1. Financial Highlights—presents selected financial data that summarize operations for the past year or
two.
3. Financial Statements
4. Notes to the Financial Statements—presents supplemental information needed to interpret the
6. Management Report—affirms management’s responsibility for internal controls and the accuracy of
financial statements; usually signed by the company’s CFO.
8. Historical Summary—presents key financial data for the past five to ten years.
Ask your students to look through the financial statements of Nike and locate as many of these sections as
possible.
Use the following Group Learning Activity to cover the independent auditors’ report and the management
report in more detail.
300 Chapter 17 Financial Statement Analysis
GROUP LEARNING ACTIVITY — Independent Auditors’ Report
Obtain copies of several different annual reports. Divide the class into small groups; give each group an
annual report. Ask each group to locate the independent auditors’ report. Next, instruct the groups to
outline the auditors’ report by briefly describing the main point(s) in each paragraph. Ask two or more
groups to share their outlines with the class. Discuss how closely these student outlines follow the outline
of a standard audit report (TM 17-9).
You may also want to use a similar exercise to review the management reports. The management reports
will show much greater variation than the highly standardized audit report. However, the basic message
INTERNET ACTIVITY — Annual Reports
It is possible to find the annual reports of many companies by searching the Internet. Ask your students to
locate the annual report for a corporation and list the main sections that appear in that report. As an
alternative, have them print out a section of the annual report, such as the Financial Statements and
Supplemental Data. Ask them to compare and contrast their company’s Financial Statements and
Supplemental Data with the one for Nike in Appendix C.
WRITING EXERCISE — Historical Summary
Ask your students to write an answer to the following question (TM 17-10):
Many annual reports include a Historical Summary section, which shows key financial data for the past
five to ten years. Why would information that is five to ten years old be presented in an annual report?
Possible response: Although not specifically discussed in the text, historical summary may provide
APPENDIX – UNUSUAL ITEMS ON THE
INCOME STATEMENT
KEY TERM
Extraordinary Item
Chapter 17 Financial Statement Analysis 301
SUGGESTED APPROACH
The text presents unusual items in two sections, those affecting the current period income statement
(discontinued operations and extraordinary items) and those affecting a prior period income statement
LECTURE AID — Unusual Income Statement Items
1. Fixed Asset Impairments: A fixed asset impairment occurs when the carrying amount (book value) of
2. Restructuring Charges: These are costs associated with involuntarily terminating employees,
terminating contracts, consolidating facilities, or relocating employees. For example, assume a
restaurant chain decides to close several of its unprofitable locations. Closing the restaurants may
create the following costs: severance packages for managers, fees associated with breaking a lease, or
3. Discontinued Operations: This section contains information concerning any segment of a business
(such as a division, department, or product line) that is sold or closed during the year. The amount
displayed in this section is calculated as follows:
4. Extraordinary Items: These are revenues or expenses that result from events that are “unusual and
5. Changes in Accounting Principles: This section shows the effect of changing from one accepted
accounting principle to another. For example, a corporation might choose to change its depreciation
WRITING EXERCISE — Below-the-Line Items Reported on the Income
Statement
Ask your students to write a response to the following questions found on TM 17-11:
1. Why are the results of discontinued operations and extraordinary items shown in separate sections at
the bottom of the income statement?
2. Why are discontinued operations and extraordinary items shown net of tax?
Possible response: Discontinued operations and extraordinary items are reported at the bottom of the
DIFFICULTY BUSPROG AICPA ACBSP BLOOM’S TIME
Problem
Learning
Objective
Description Primary Functional Primary
Spread–
sheet
GL
DQ17-1 17-1 Easy Analytic Measurement Financial Statement Analysis Knowledge 5 min.
DQ17-2 17-1 Easy Analytic Measurement Financial Statement Analysis Knowledge 5 min.
DQ17-3 17-1 Easy Analytic Measurement Financial Statement Analysis Knowledge 5 min.
DQ17-4 17-2 Easy Analytic Measurement Financial Statement Analysis Knowledge 5 min.
DQ17-5 17-2 Easy Analytic Measurement Financial Statement Analysis Knowledge 5 min.
DQ17-6 17-2 Easy Analytic Measurement Financial Statement Analysis Knowledge 5 min.
DQ17-7 17-3 Easy Analytic Measurement Financial Statement Analysis Knowledge 5 min.
DQ17-8 17-3 Easy Analytic Measurement Financial Statement Analysis Knowledge 5 min.
DQ17-9 17-3 Easy Analytic Measurement Financial Statement Analysis Knowledge 5 min.
DQ17-10 17-4 Easy Analytic Measurement Financial Statement Analysis Knowledge 5 min.
PE17-1A 17-1 Horizontal analysis Easy Analytic Measurement Financial Statement Analysis Application 5 min.
PE17-1B 17-1 Horizontal analysis Easy Analytic Measurement Financial Statement Analysis Application 5 min.
PE17-2A 17-1 Vertical Analysis Easy Analytic Measurement Financial Statement Analysis Application 5 min.
PE17-2B 17-1 Vertical Analysis Easy Analytic Measurement Financial Statement Analysis Application 5 min.
PE17-3A 17-2 Current position analysis Easy Analytic Measurement Financial Statement Analysis Application 5 min.
PE17-3B 17-2 Current position analysis Easy Analytic Measurement Financial Statement Analysis Application 5 min.
PE17-4A 17-2 Accounts receivable analysis Easy Analytic Measurement Financial Statement Analysis Application 5 min.
PE17-4B 17-2 Accounts receivable analysis Easy Analytic Measurement Financial Statement Analysis Application 5 min.
PE17-5A 17-2 Inventory analysis Easy Analytic Measurement Financial Statement Analysis Application 5 min.
PE17-5B 17-2 Inventory analysis Easy Analytic Measurement Financial Statement Analysis Application 5 min.
PE17-6A 17-2 Long-term solvency analysis Easy Analytic Measurement Financial Statement Analysis Application 5 min.
PE17-6B 17-2 Long-term solvency analysis Easy Analytic Measurement Financial Statement Analysis Application 5 min.
PE17-7A 17-2 Times interest charges are earned Easy Analytic Measurement Financial Statement Analysis Application 5 min.
PE17-7B 17-2 Times interest charges are earned Easy Analytic Measurement Financial Statement Analysis Application 5 min.
PE17-8A 17-3 Net sales to assets Easy Analytic Measurement Financial Statement Analysis Application 5 min.
PE17-8B 17-3 Net sales to assets Easy Analytic Measurement Financial Statement Analysis Application 5 min.
PE17-9A 17-3 Rate earned on total assets Easy Analytic Measurement Financial Statement Analysis Application 5 min.
PE17-9B 17-3 Rate earned on total assets Easy Analytic Measurement Financial Statement Analysis Application 5 min.
PE17-
10A
17-3
Common stockholders’ profitability
analysis
Easy Analytic Measurement Financial Statement Analysis Application 5 min.
PE17-
10B
17-3
Common stockholders’ profitability
analysis
Easy Analytic Measurement Financial Statement Analysis Application 5 min.
HOMEWORK CHART WITH LEARNING OUTCOMES TAGGING
DIFFICULTY BUSPROG AICPA ACBSP BLOOM’S TIME
Problem
Learning
Objective
Description Primary Functional Primary
Spread–
sheet
GL
PE17-
11A
17-3
Earnings per share and price-
earnings
Easy Analytic Measurement Financial Statement Analysis Application 5 min.
PE17-
11B
17-3
Earnings per share and price-
earnings
Easy Analytic Measurement Financial Statement Analysis Application 5 min.
statement
Easy Analytic Measurement Financial Statement Analysis Application 15 min.
Vertical analysis of income
Vertical analysis of income
Ex17-2 17-1
statement
Easy Analytic Measurement Financial Statement Analysis Application 15 min. X
Ex17-3 17-1 Common-sized income statement Easy Analytic Measurement Financial Statement Analysis Application 15 min.
Ex17-4 17-1 Vertical analysis of balance sheet Easy Analytic Measurement Financial Statement Analysis Application 20 min. X
Ex17-5 17-1
Horizontal analysis of the income
statement
Easy Analytic Measurement Financial Statement Analysis Application 20 min. X
Ex17-6 17-2 Current position analysis Easy Analytic Measurement Financial Statement Analysis Application 10 min.
Ex17-7 17-2 Current position analysis Easy Analytic Measurement Financial Statement Analysis Application 10 min.
Ex17-8 17-2 Current position analysis Moderate Analytic Measurement Financial Statement Analysis Application 15 min.
Ex17-9 17-2 Accounts receivable analysis Easy Analytic Measurement Financial Statement Analysis Application 10 min.
Ex17-10 17-2 Accounts receivable analysis Easy Analytic Measurement Financial Statement Analysis Application 10 min.
Ex17-11 17-2 Inventory analysis Easy Analytic Measurement Financial Statement Analysis Application 10 min.
Ex17-12 17-2 Inventory analysis Easy Analytic Measurement Financial Statement Analysis Application 10 min.
Ex17-13 17-2
Ratio of liabilities to stockholders‘
equity and number of times interest
charges earned
Easy Analytic Measurement Financial Statement Analysis Application 10 min.
Ex17-14 17-2
Ratio of liabilities to stockholders‘
equity and number of times interest
charges earned
Easy Analytic Measurement Financial Statement Analysis Application 15 min.
Ex17-15 17-2
long-term liabilities
Easy Analytic Measurement Financial Statement Analysis Application 10 min.
Ex17-16 17-3 Ratio of net sales to assets Easy Analytic Measurement Financial Statement Analysis Application 10 min.
Ex17-17 17-3 Profitability ratios Easy Analytic Measurement Financial Statement Analysis Application 10 min.
Ex17-18 17-3 Profitability ratios Easy Analytic Measurement Financial Statement Analysis Application 15 min.
Ex17-19 17-2, 17-3
profitability
Moderate Analytic Measurement Financial Statement Analysis Application 20 min.
Ex17-20 17-2, 17-3
Six measures of solvency or
profitability
Moderate Analytic Measurement Financial Statement Analysis Application 20 min.
DIFFICULTY BUSPROG AICPA ACBSP BLOOM’S TIME
Problem
Learning
Objective
Description Primary Functional Primary
Spread–
sheet
GL
Ex17-21 17-3
ratio, dividend yield
Easy Analytic Measurement Financial Statement Analysis Application 15 min.
Earnings per share, price-earnings
Ex17-22 17-3 Price-earnings ratio; dividend yield Easy Analytic Measurement Financial Statement Analysis Application 10 min.
Ex17-23 Appendix
Earnings per share, extraordinary
item
Easy Analytic Measurement Financial Statement Analysis Application 10 min.
Ex17-24 Appendix Extraordinary item Easy Analytic Measurement Financial Statement Analysis Application 10 min.
Ex17-25 Appendix
share for extraordinary items and
discontinued operations
Easy Analytic Measurement Financial Statement Analysis Application 10 min.
Ex17-26 Appendix Unusual items Easy Analytic Measurement Financial Statement Analysis Knowledge 10 min.
Pr17-1A 17-1
Horizontal analysis for income
statement
Moderate Analytic Measurement Financial Statement Analysis Application 1 hour X X
Pr17-2A 17-1
statement
Moderate Analytic Measurement Financial Statement Analysis Application 1 hour X X
Vertical analysis for income
Pr17-3A 17-2
position analysis
Moderate Analytic Measurement Financial Statement Analysis Application 1 hour X
Pr17-4A 17-2,17-3
Nineteen measures of solvency and
profitability
Moderate Analytic Measurement Financial Statement Analysis Application 2 hours X
Pr17-5A 17-2,17-3
Solvency and profitability trend
analysis
Moderate Analytic Measurement Financial Statement Analysis Application 1.5 hours
Pr17-1B 17-1
statement
Moderate Analytic Measurement Financial Statement Analysis Application 1 hour X X
Vertical analysis for income
Horizontal analysis for income
Pr17-2B 17-1
statement
Moderate Analytic Measurement Financial Statement Analysis Application 1 hour X X
Pr17-3B 17-2
Effects of transactions on current
position analysis
Moderate Analytic Measurement Financial Statement Analysis Application 1 hour X
Pr17-4B 17-2, 17-3
Nineteen measures of solvency and
profitability
Moderate Analytic Measurement Financial Statement Analysis Application 2 hours X
Pr17-5B 17-2, 17-3
Solvency and profitability trend
analysis
Moderate Analytic Measurement Financial Statement Analysis Application 1.5 hours
Inc.,
17-1, 17-2,
Problem
17-3
Financial statement analysis Moderate Analytic Measurement Financial Statement Analysis Application 1.5 hours
CP17-1 17-2
Analysis of financial corporate
growth
Easy Analytic Measurement Financial Statement Analysis Analysis 5 min.
CP17-2 17-2 Receivables and inventory turnover Moderate Analytic Measurement Financial Statement Analysis Analysis 10 min.
CP17-3 17-1 Vertical analysis Easy Analytic Measurement Financial Statement Analysis Analysis 15 min.
DIFFICULTY BUSPROG AICPA ACBSP BLOOM’S TIME
Problem
Learning
Objective
Description Primary Functional Primary
Spread-
sheet
GL
CP17-4 17-3 Profitability and stockholder ratios Moderate Analytic Measurement Financial Statement Analysis Application 20 min.
Comprehensive profitability and