17
Additional Topics in Variance Analysis
Solutions to Review Questions
17–1.
When production is not equal to sales, a portion of the sales comes from inventory or a
17–2.
False. Variances simply represent differences between plans and actual outcomes.
17–3.
Variances are usually “expensed” as a period cost (e.g., charged to Cost of Goods Sold).
17–4.
17–5.
17–6.
17–7.
17–8.
Examples include:
• Steel mills which can process both new steel and recycled scrap
17–9.
The concept of management by exception suggests managers not focus on things that are
Solutions to Critical Analysis and Discussion Questions
17–10.
By recognizing the materials price variance at the time of purchase, management
captures any difference between actual materials cost and the standard costs as reflected
17–11.
17–12.
17–13.
In a hospital, as in other professional firms, billing rates vary with the level of the
17–14.
Salary rates vary according to the classification of the service providers (e.g., nurses’ pay
is higher than nurse practitioners’ pay), and the hospital will budget a certain amount of
17–15.
Disagree. The purpose of variance analysis is to identify items that are different from what
17–16.
Answers will vary. Variance analysis is helpful in any setting where budgets are
calculated, including business schools (and other academic institutions). In addition to the
17–17.
Answers will vary. A company such as Uber with several services (Uber-X, Uber-Black,
and so on), would likely learn something from sales activity and mix. Whether they would
Solutions to Exercises
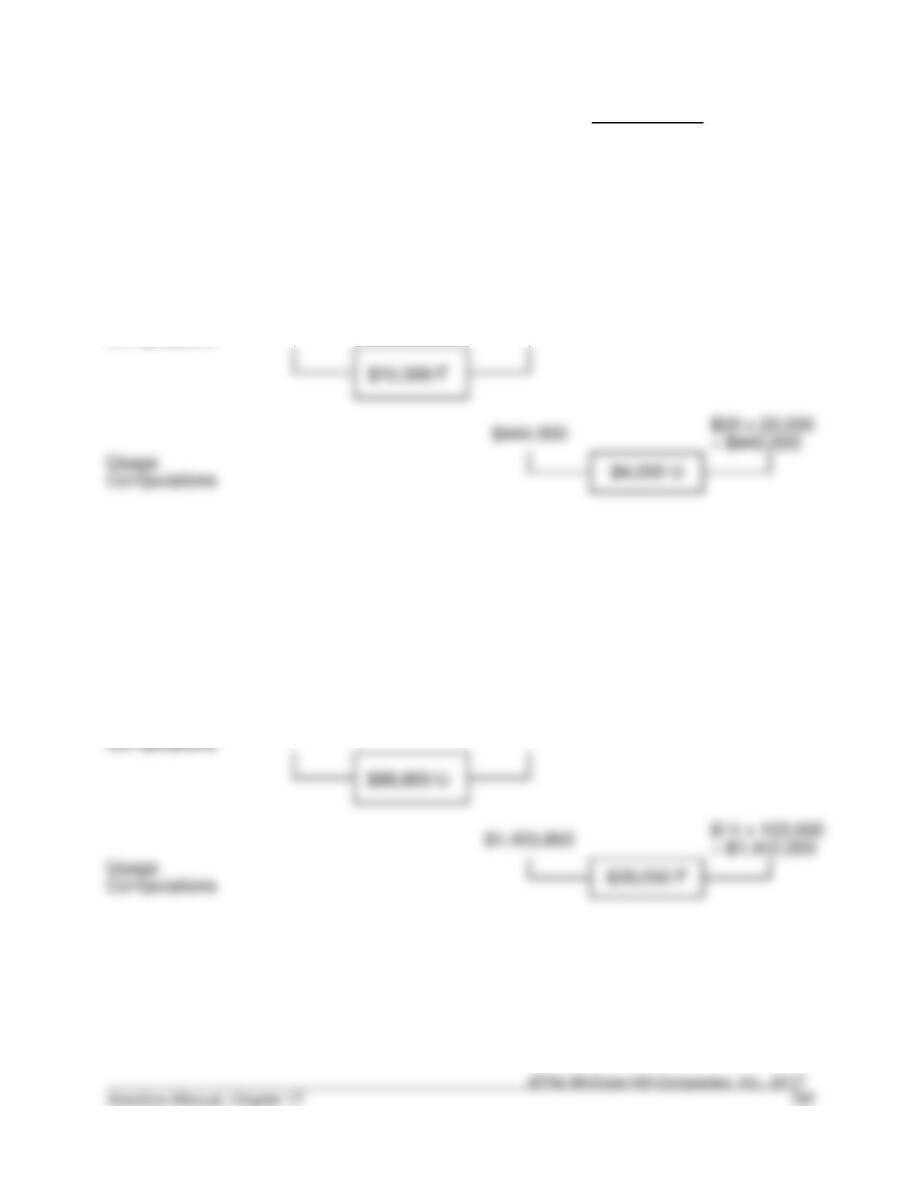
17–18. (15 min.) Variable Cost Variances: Materials Purchased And Used Are Not
Equal: Gates Corporation.
Actual
Costs
Price
Variance
Actual
Inputs at
Standard
Price
Efficiency
Variance
Flexible
Budget
(Standard
Allowed for
Good Output)
Purchase
Computations
$673,000
$688,000
= $440,000
17–19. (15. Min) Variable Cost Variances: Materials Purchased And Used Are Not
Equal: Mathis, Inc.
Actual
Costs
Price
Variance
Actual
Inputs at
Standard
Price
Efficiency
Variance
Flexible
Budget
(Standard
Allowed for
Good Output)
Computations
= $1,442,000
Purchase
$1,642,800
$1,554,000
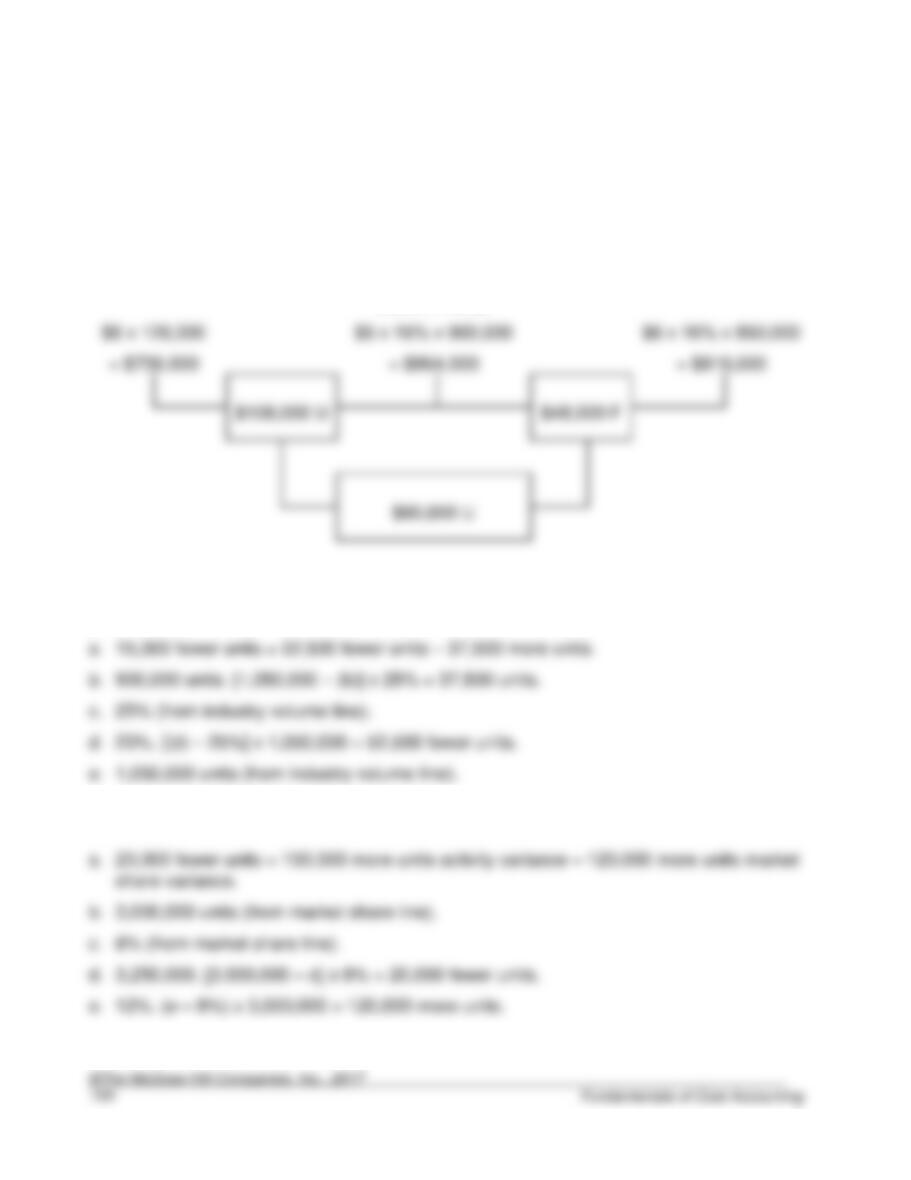
17–20. (15 min.) Industry Volume And Market Share Variances: D&B Ice Cream.
Flexible Budget
(SCM x AQ)
Market
Share
Variance
Standard Contribution
Margin Times
Budgeted Market
Share Times Actual
Industry Volume
(SCM x ASQ)
Industry
Volume
Variance
Master Budget
(SCM x SQ)
17–21. (20 min.) Industry Volume And Market Share Variances—Missing Data.
17–22. (20 min.) Industry Volume And Market Share—Missing Data.
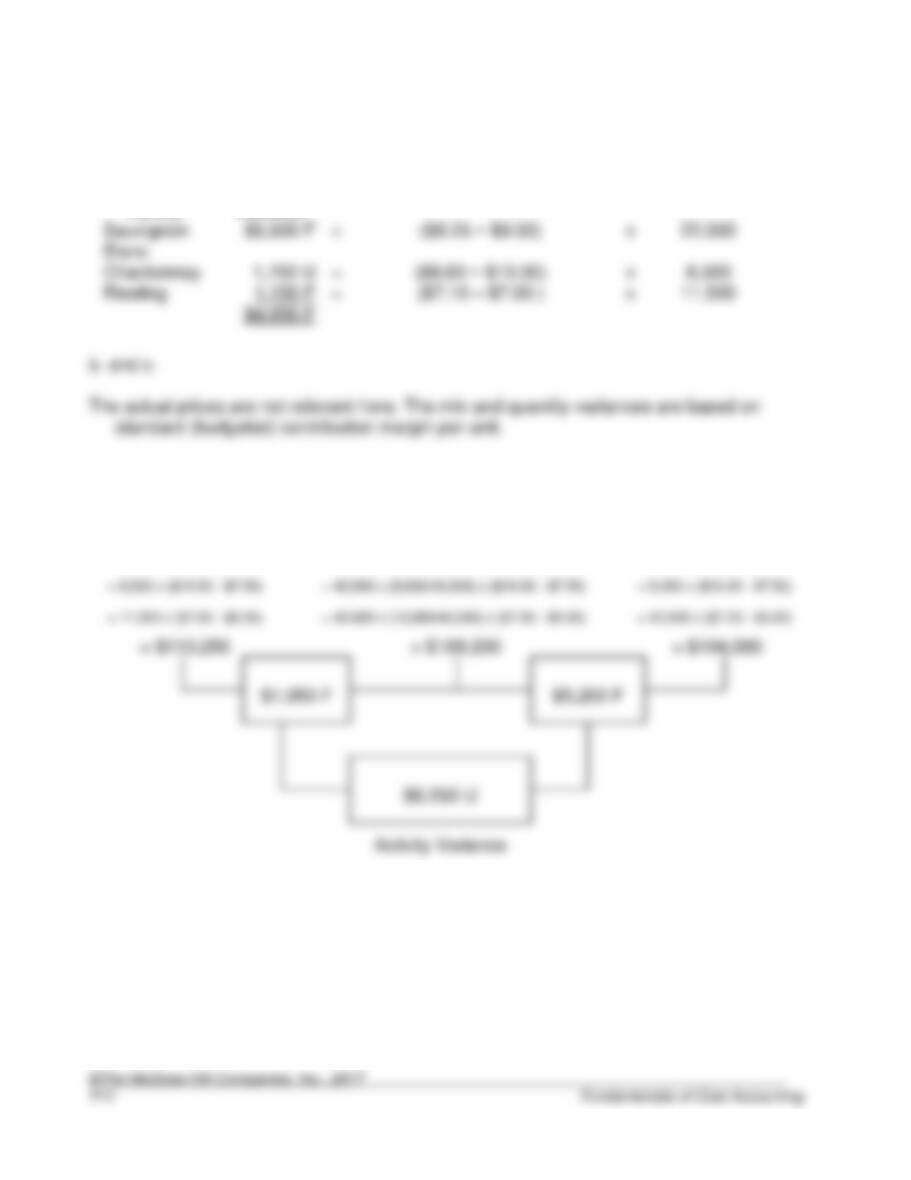
17–23. (20 min.) Sales Mix And Quantity Variances: A-Zone Media.
a. and b.
The actual prices are not relevant here. The mix and quantity variances are based on
standard (budgeted) contribution margin per unit.
Flexible Budget
AQ x (SP – SV)
Mix
Variance
ASQ x (SP – SV)
Quantity
Variance
Master Budget
7,500 x ($192 – $80)
11,500 x (10,000/12,500) x ($192 – $80)
17–24. (20 min.) Sales Mix And Quantity Variances: Sara’s Systems.
a. and b.
Flexible Budget
AQ x (SP – SV)
Mix
Variance
ASQ x (SP – SV)
Quantity
Variance
Master Budget
26,400 x ($200 – $80)
33,600 x (22,500/30,000) x ($200 – $80)
22,500 x ($200 – $80)
17–25. (20 min.) Sales Mix And Quantity Variances: Hotel Galaxy.
a. and b.
Flexible Budget
AQ x (SP – SV)
Mix
Variance
ASQ x (SP – SV)
Quantity
Variance
Master Budget
1,350 x ($35 – $15)
2,300 x (1,000/2,500) x ($35 – $15)
1,000 x ($35 – $15)
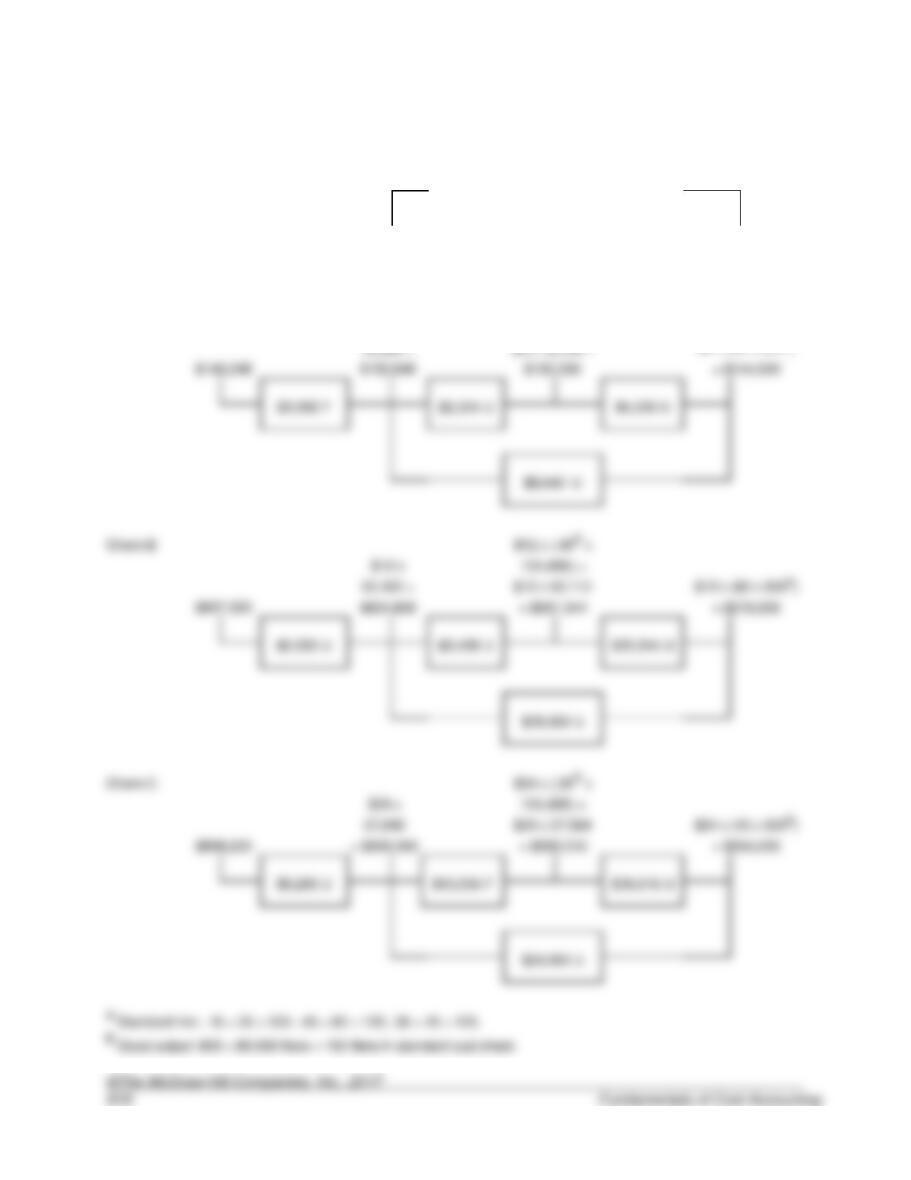
17–26. (20 min.) Sales Mix And Quantity Variances: Chow-4-Hounds.
a. and b.
Flexible Budget
AQ x (SP – SV)
Mix
Variance
ASQ x (SP – SV)
Quantity
Variance
Master Budget
60,000 x ($12 – $5)
210,000 x (60,000/200,000) x ($12 – $5)
60,000 x ($12 – $5)
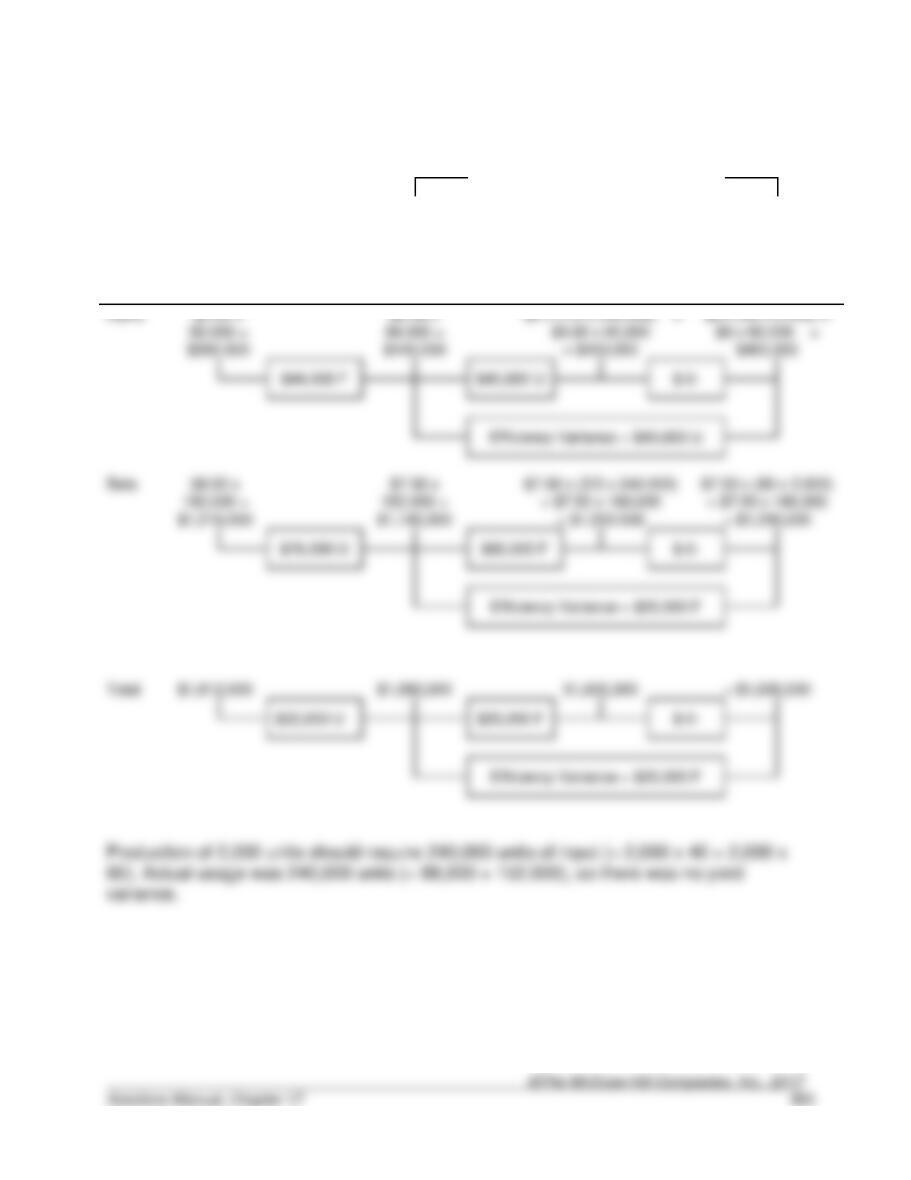
17–27. (35 min.) Materials Mix and Yield Variances: Stacy, Inc.
a. and b.
Efficiency Variance
Actual
(AP x AQ)
Purchase
Price
Variance
(SP x AQ)
Mix
Variance
(SP x ASQ)
Yield
Variance
Flexible
Production
Budget (SP
x SQ)
Material:
$4.50 x
= $7.50 x 160,000
Total
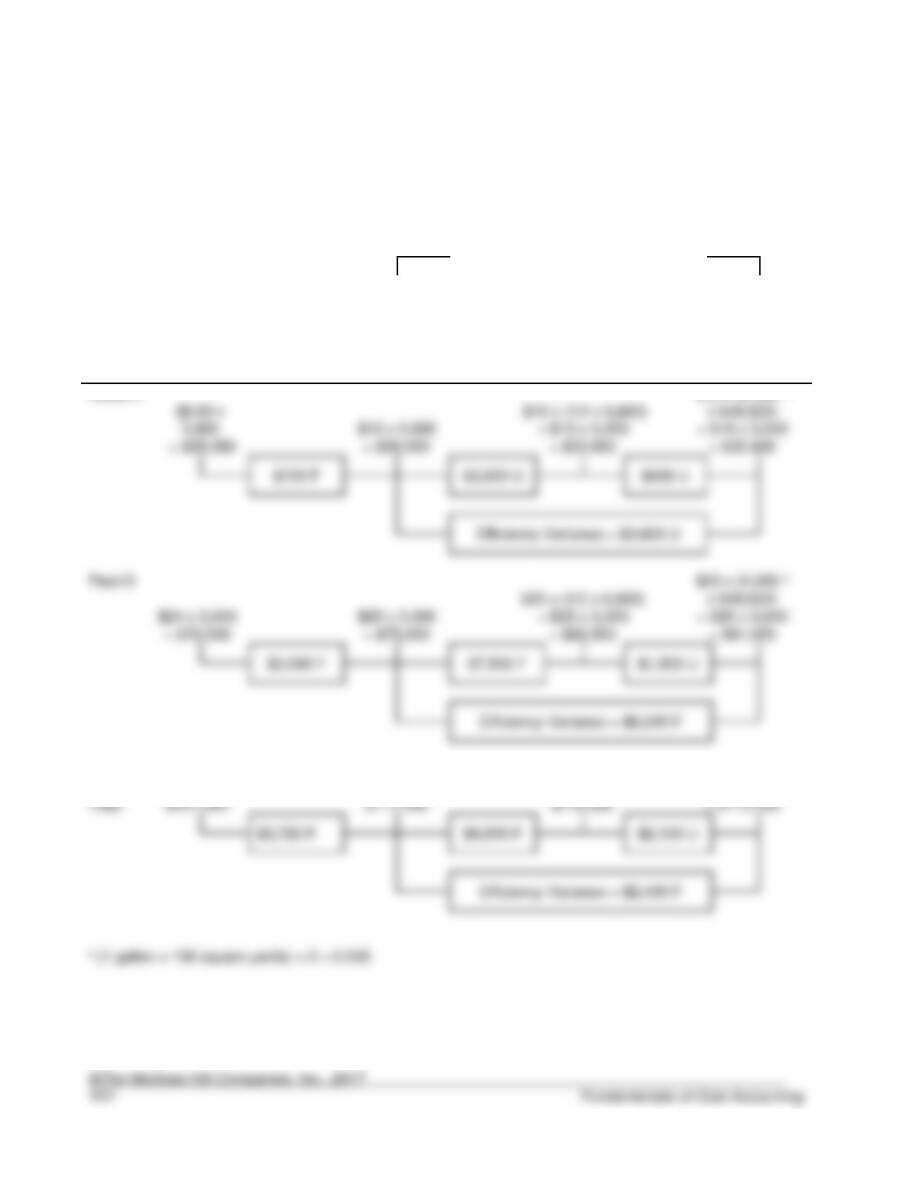
17–28. (35 min.) Materials Mix and Yield Variances: John’s Weed-B-Gone.
a. and b.
The actual purchase prices were $9.80 (= $35,280 ÷ 3,600) for Weed-X and $24.00 (=
$72,000 ÷ 3,000) for Pest-O.
Efficiency Variance
Actual
(AP x AQ)
Purchase
Price
Variance
(SP x AQ)
Mix
Variance
(SP x ASQ)
Yield
Variance
Flexible
Production
Budget
(SP x SQ)
Material:
Weed-X
3,600
= $35,280
= $36,000
= $72,000
= $75,000
$10 x (0.005 a
Total
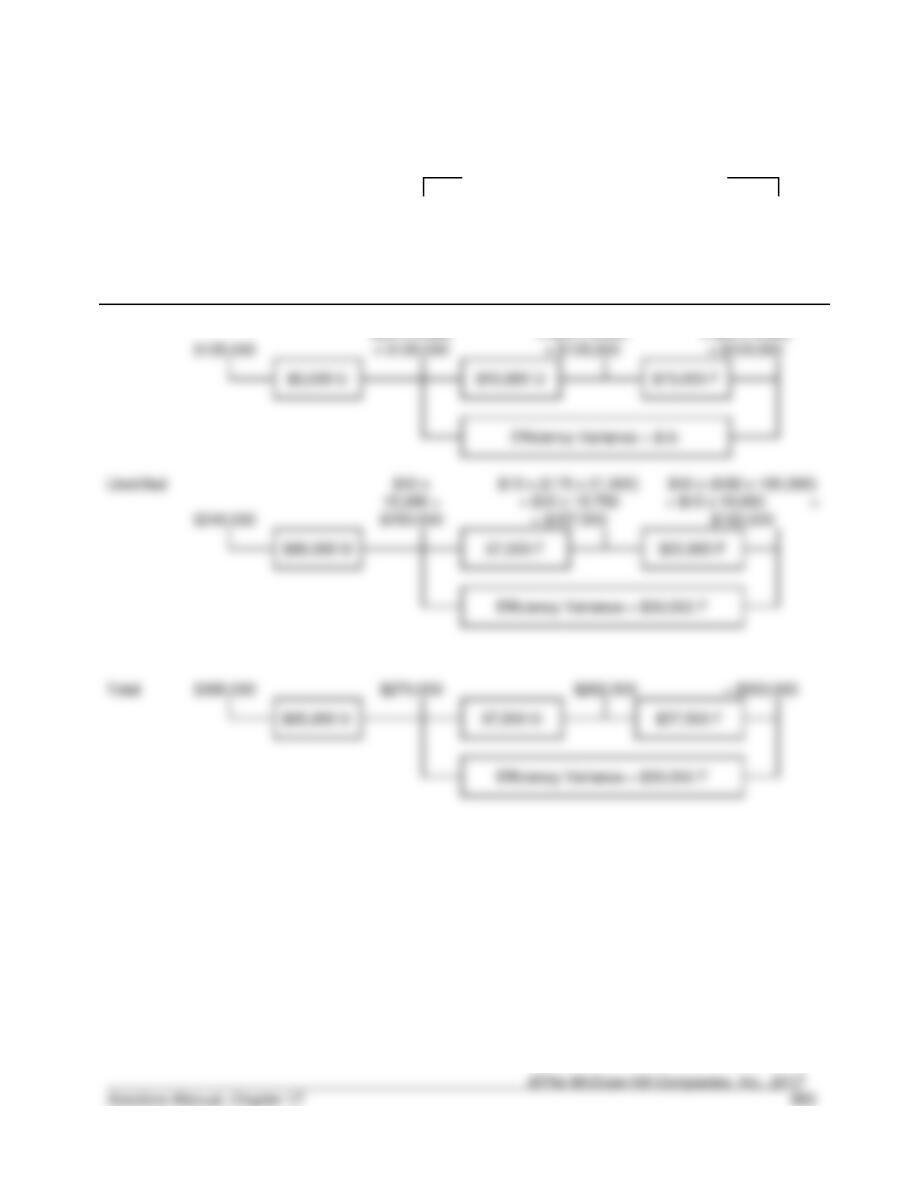
17–29. (35 min.) Labor Mix and Yield Variance: Matt’s Eat ‘N Run.
a. and b.
Efficiency Variance
Actual
(AP x
AQ)
Purchase
Price
Variance
(SP x AQ)
Mix
Variance
(SP x
ASQ)
Yield
Variance
Flexible
Production
Budget
(SP x SQ)
Labor:
Skilled
= $120,000
Unskilled
Total
$270,000
$20 x (0.25 x 21,000)
$20 x (2/60 x 180,000)
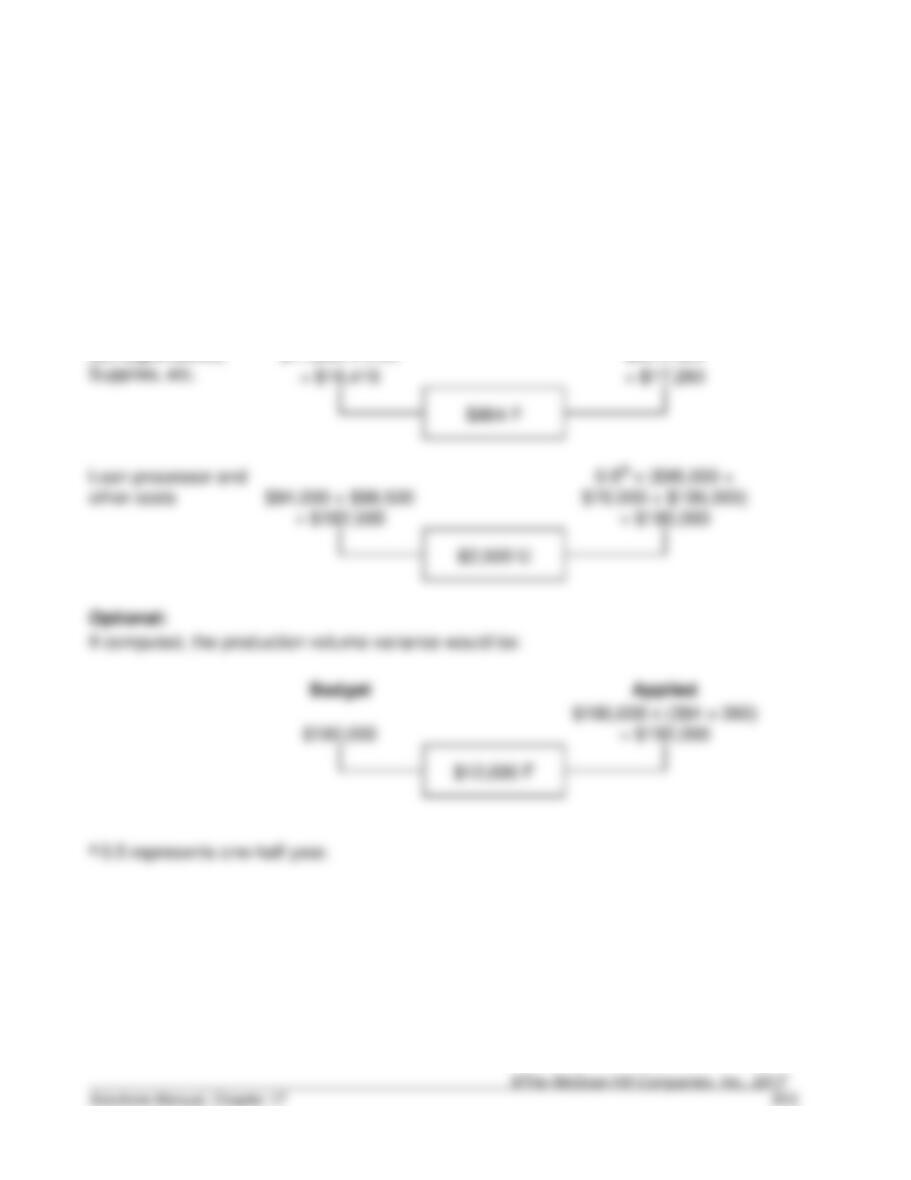
17–30. (10 min.) Flexible Budgeting—Service Organization: K&B.
Flexible Budget
(based on
actual of
7,200 hours)
Revenue ………………………….
$648,000a
Costs:
17–31. (20 min.) Sales Activity Variance—Service Organization: K&B.
Flexible Budget
(based on
actual of
7,200 hours)
Sales
Activity
Variance
Master Budget
(based on
budgeted 9,000
hours)
$616,000
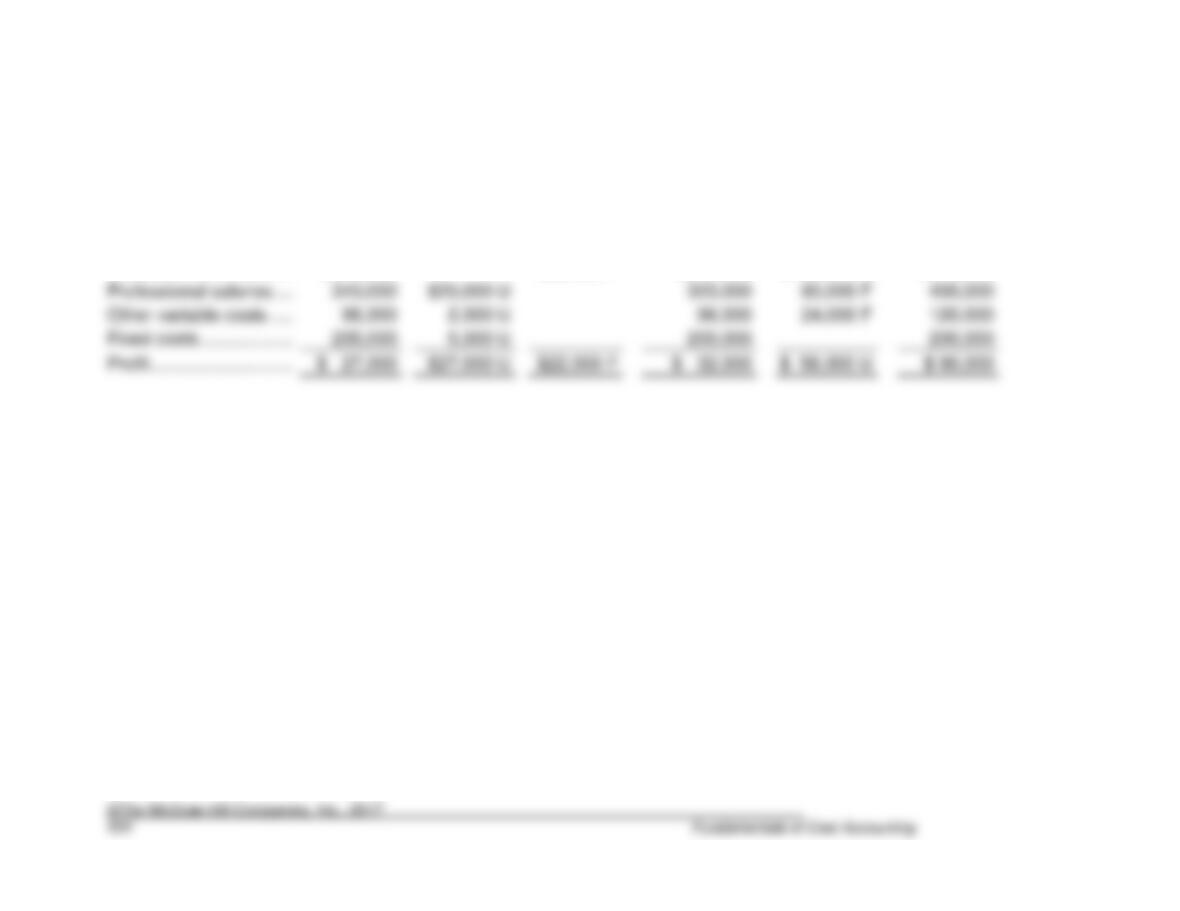
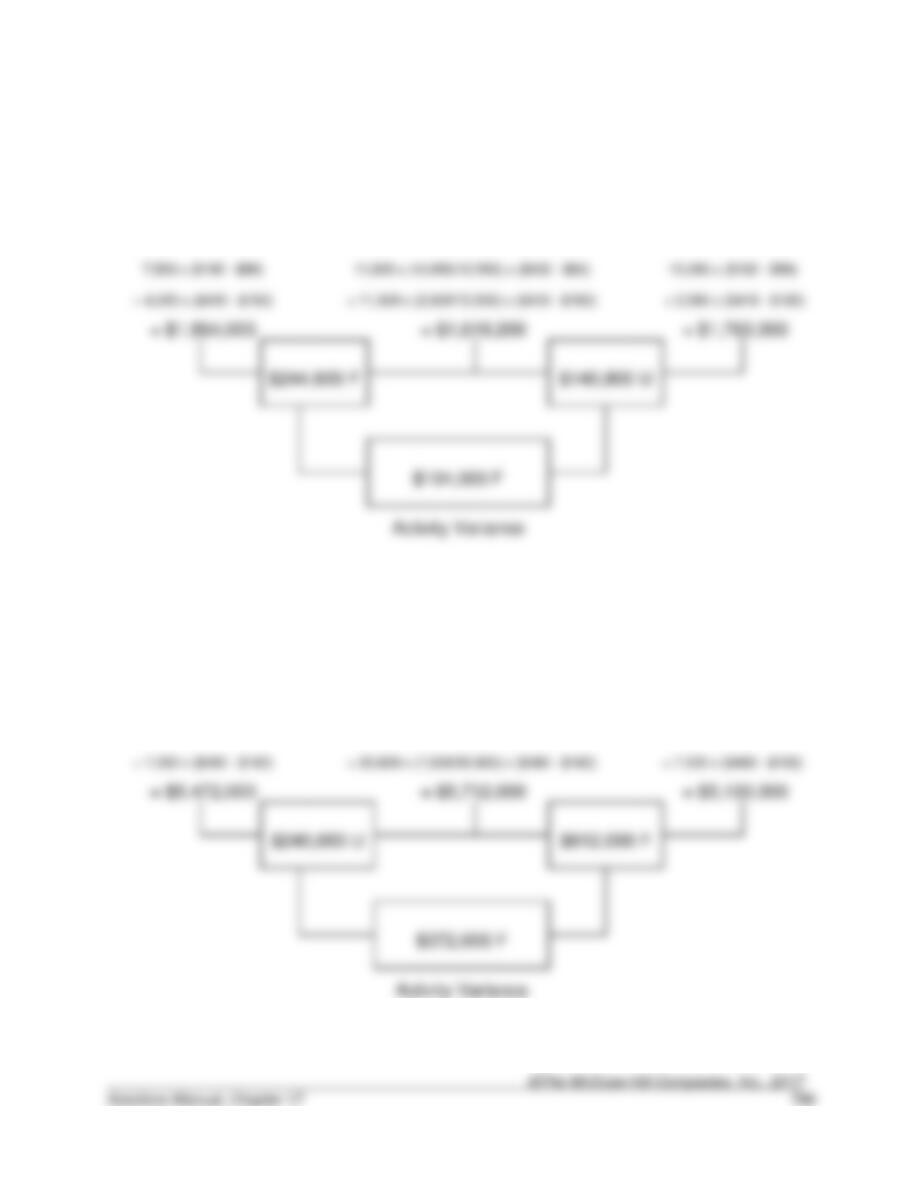
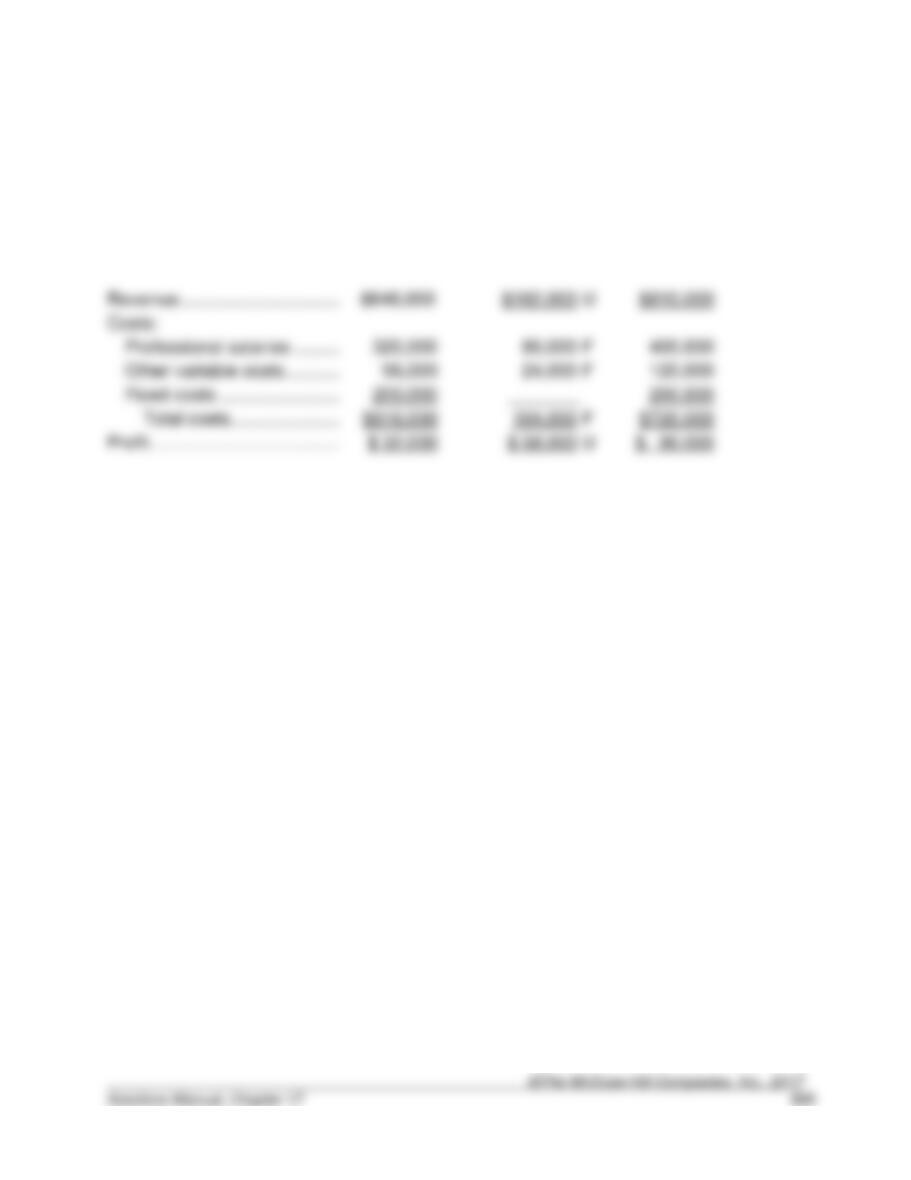
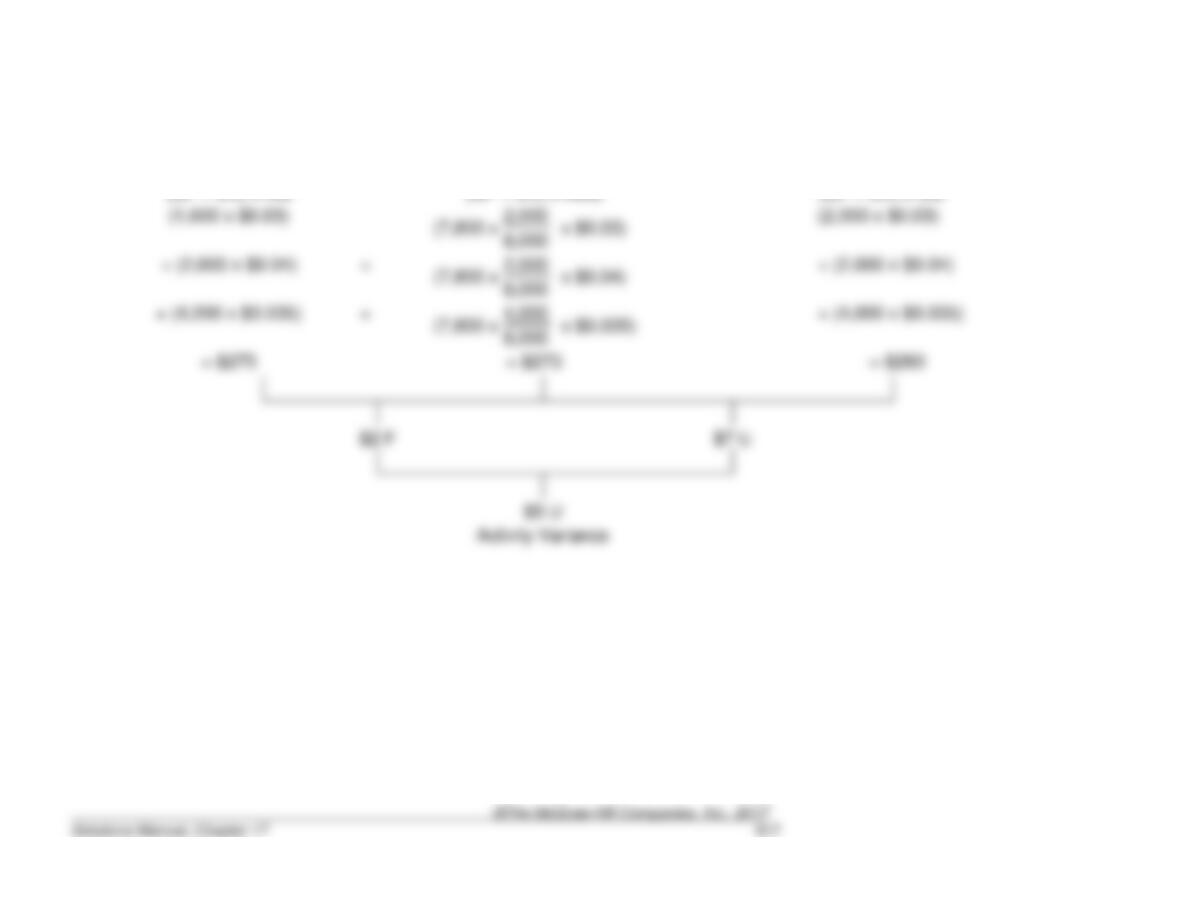
17–32. (30 min.) Profit Variance Analysis—Service Organization: K&B.
(1)
(2)
(3)
(4)
(5)
(6)
Actual
(7,200 hrs.)
Cost
Variances
Price
Variances
Flexible
Budget
(7,200 hrs.)
Sales
Activity
Variance
Master
Budget
(9,000 hrs.)
Revenue ……………………….
$670,000
$22,000 F
$648,000
$162,000 U
$810,000
Fixed costs ……………………
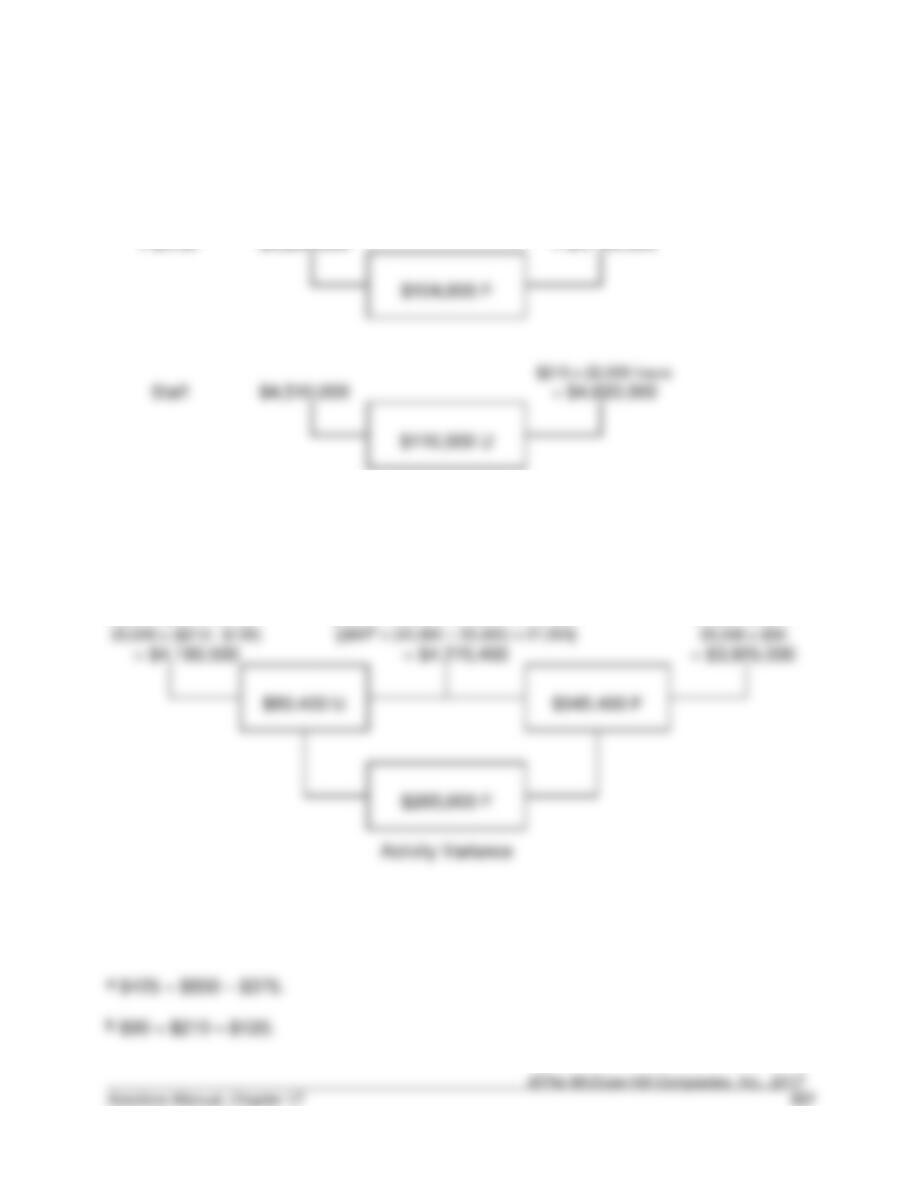
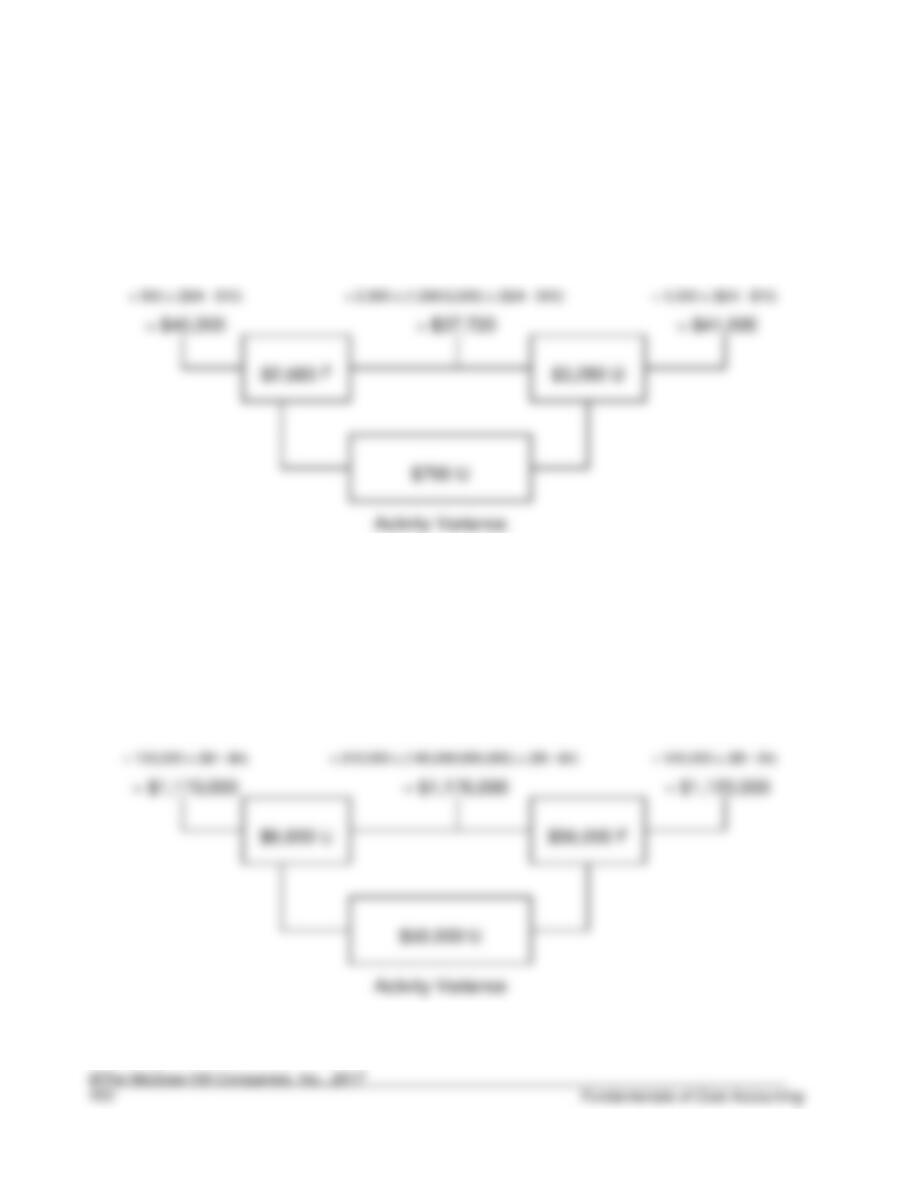
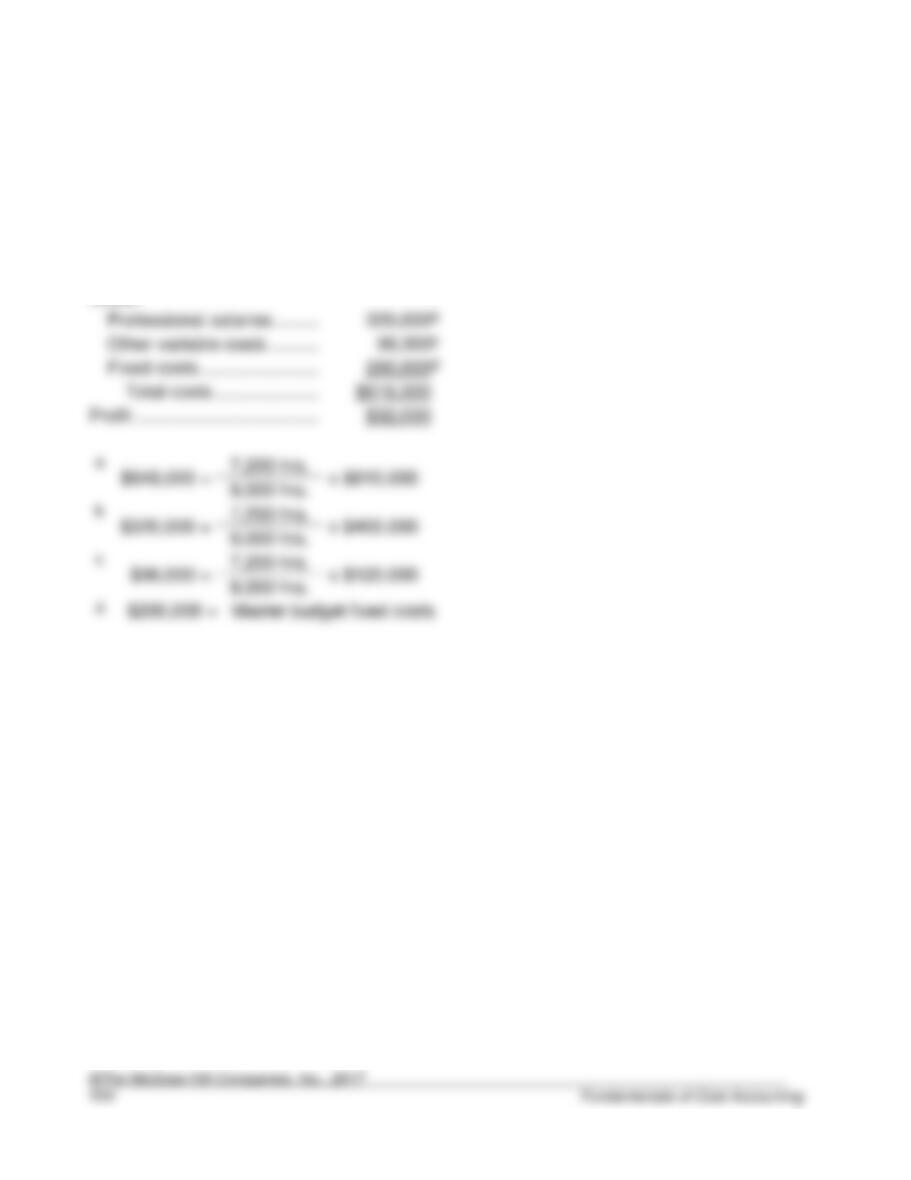
17–33. (20 min.) Sales Price and Activity Variances: EZ-Tax.
Actual
(AP x AQ)
Price Variance
Flexible Budget
(SP x AQ)
Partner
$4,264,000
$800 x 5,200 hours
= $4,160,000
$4,510,000
= $4,620,000
Flexible
Budget
Master Budget
AQ x (SP – SV)
Mix Variance
(SP – SV) x ASQ
Quantity
Variance
SQ x (SP – SV)
= $3,925,000
Activity Variance
5,200 x ($800 – $375) +
[$425a x (5,000 ÷ 25,000) x 27,200] +
5,000 x $425 +
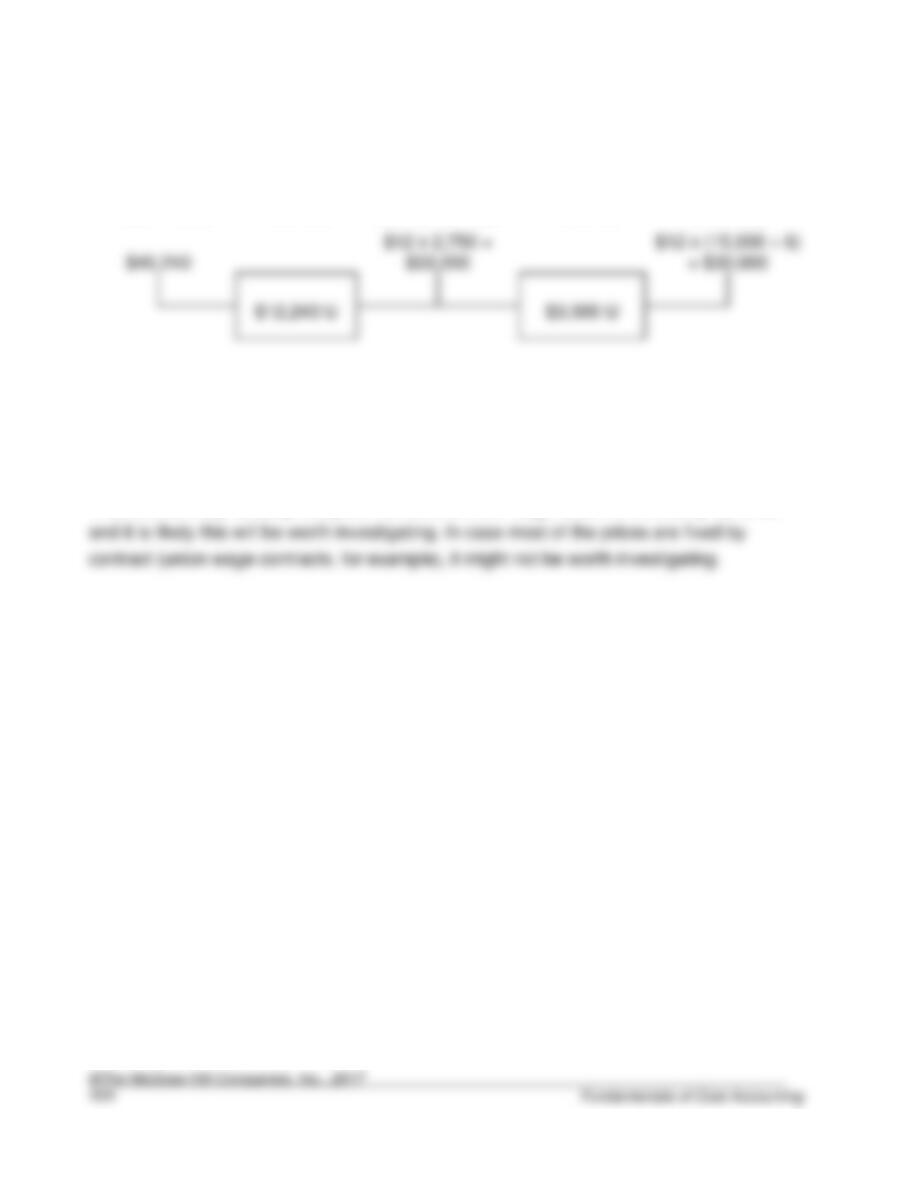
17–34. (10 min.) Variable Cost Variances: Harry’s Hotel.
Actual Costs
Price
Variance
Actual Inputs at
Standard Price
Efficiency
Variance
Flexible Budget
(Standard
Allowed)
17–35. (10 min.) Investigating Variances: Harry’s Hotel.
Answers will vary. Clearly, the price variance is much larger than the efficiency variance
Solutions to Problems
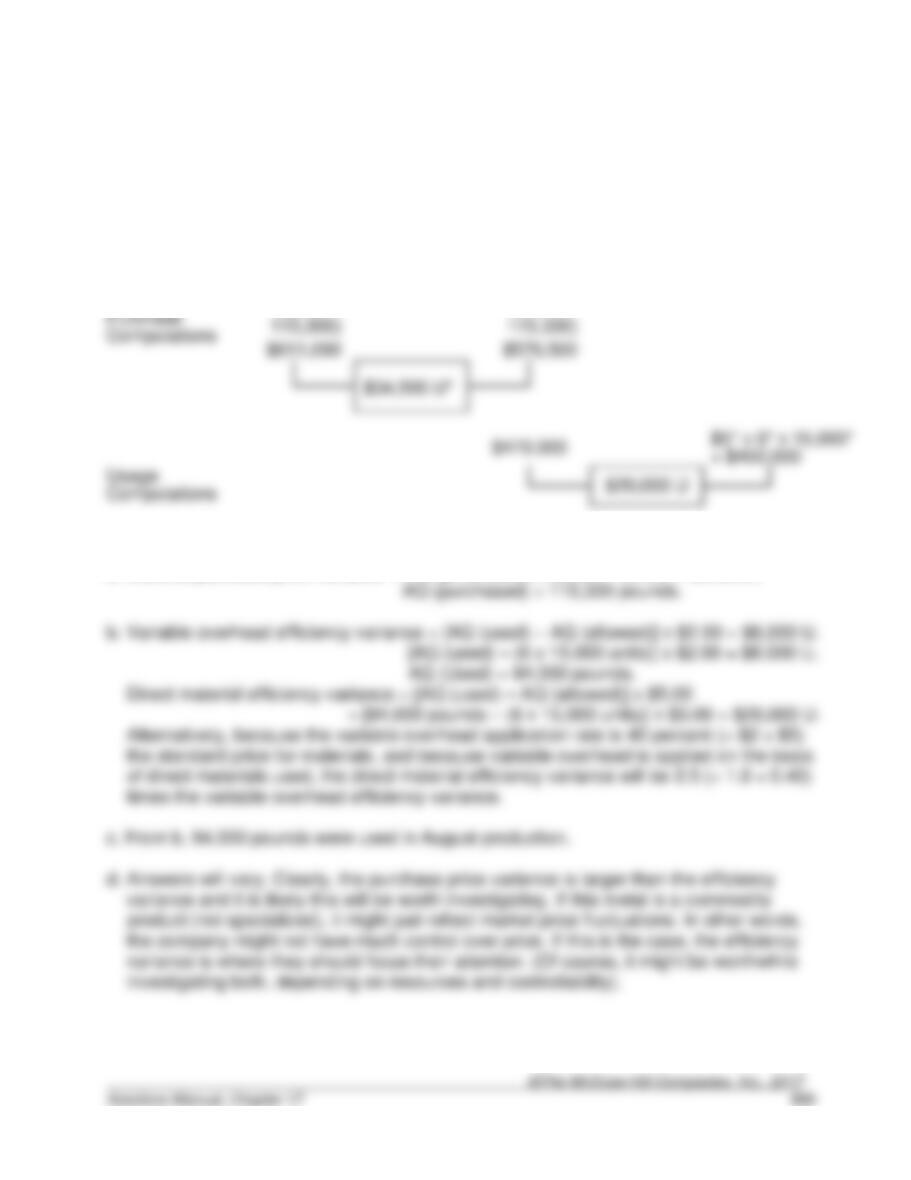
17–36. (20 min.) Variable Cost Variances: Materials Purchased And Used Are Not
Equal: Griffen Company.
Actual Costs
Price
Variance
Actual
Inputs at
Standard
Price
Efficiency
Variance
Flexible Budget
(Standard
Allowed for
Good Output)
($5.30 x
($5.00 x
Notes:
* Given.
a. Material purchase price variance = AQ (purchased) x ($5.30 – $5.00) = $34,590;
17–37. Sales Mix And Quantity Variances: Lake Cellars.
a. Price Variance = (Actual Price − Budgeted Price) x Actual Quantity:
Variety:
Price
Variance
=
(Actual Price − Budgeted Price)
x
Actual Quantity
Flexible Budget
AQ x (SP – SV)
Mix
Variance
ASQ x (SP – SV)
Quantity
Variance
Master Budget
22,000 x ($9.00 – $6.00)
42,000 x (20,000/40,000) x ($9.00 – $6.00)
20,000 x ($9.00 – $6.00)
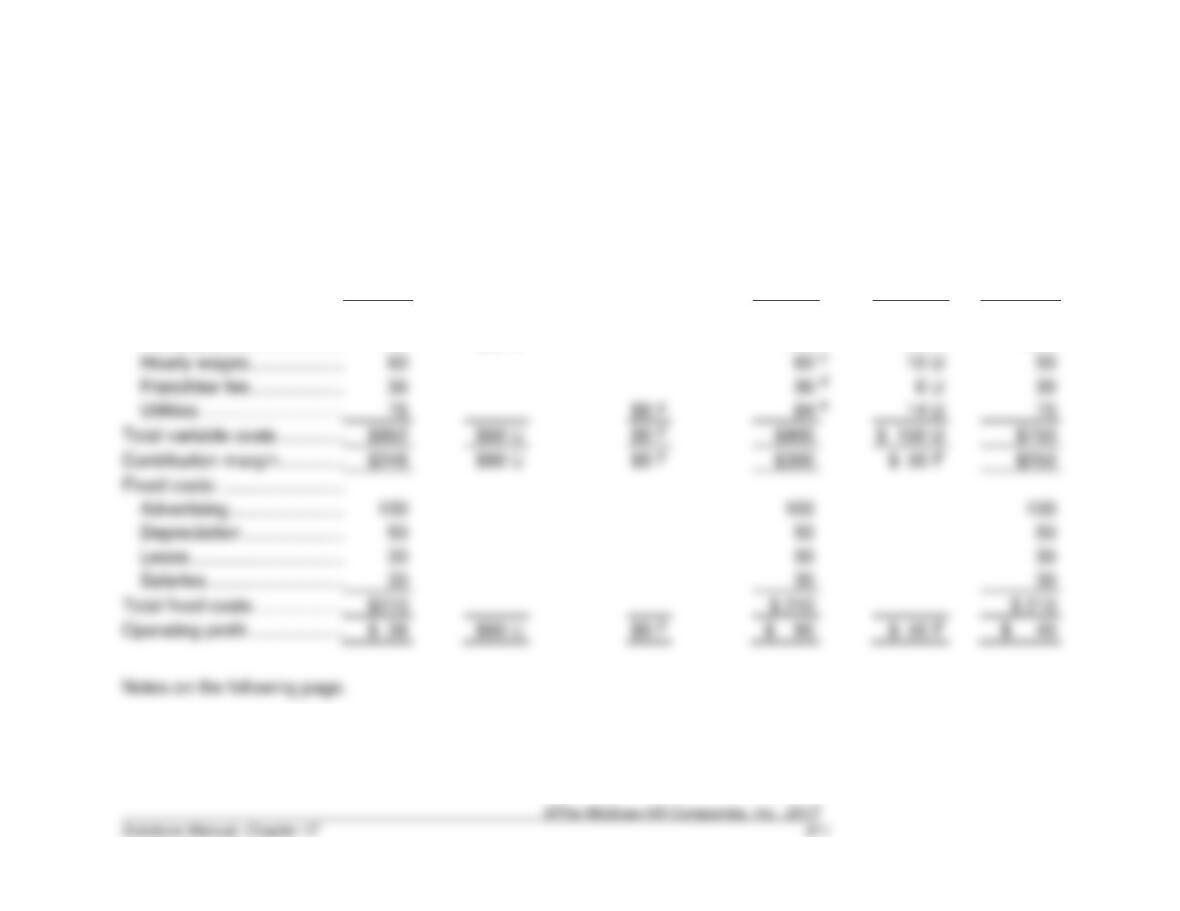
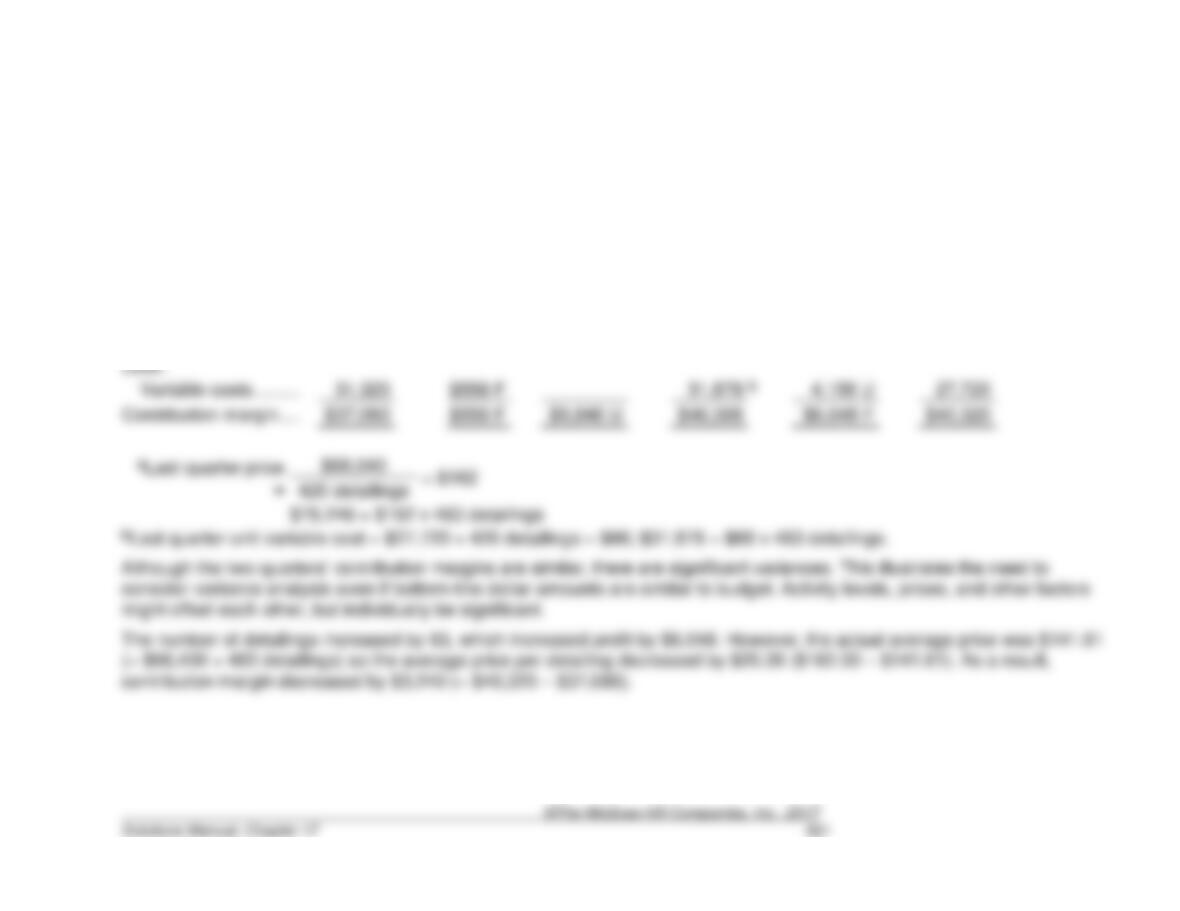
17–38. (40 min.) Analyze Performance for a Restaurant: Doug’s Diner.
Hint for working the problem: Use sales revenue as the basis for measuring volume.
($000)
Actual
Purchases
Variances
Marketing &
Administrative
Variances
Flexible
Budget
Activity
Variance
Master
Budget
Sales revenuea …………………………………………..
$1,200
$1,200
$200 F
$1,000
Variable costs:
Purchases……………………………………………….
780
$60 U
720
b
120 U
600
Franchise fee …………………………………………..
Utilities ……………………………………………………
e
14 U
Total variable costs ……………………………………..
$60 U
$900
Contribution margin ……………………………………..
$60 U
$300
$ 50 F
Fixed costs: ……………………………………………….
Advertising ………………………………………………
100
100
100
Lease ……………………………………………………..
Salaries…………………………………………………..
Total fixed costs ………………………………………….
17-37. (continued)
a Sales revenue is used as the basis of volume measurement because there are no price changes.
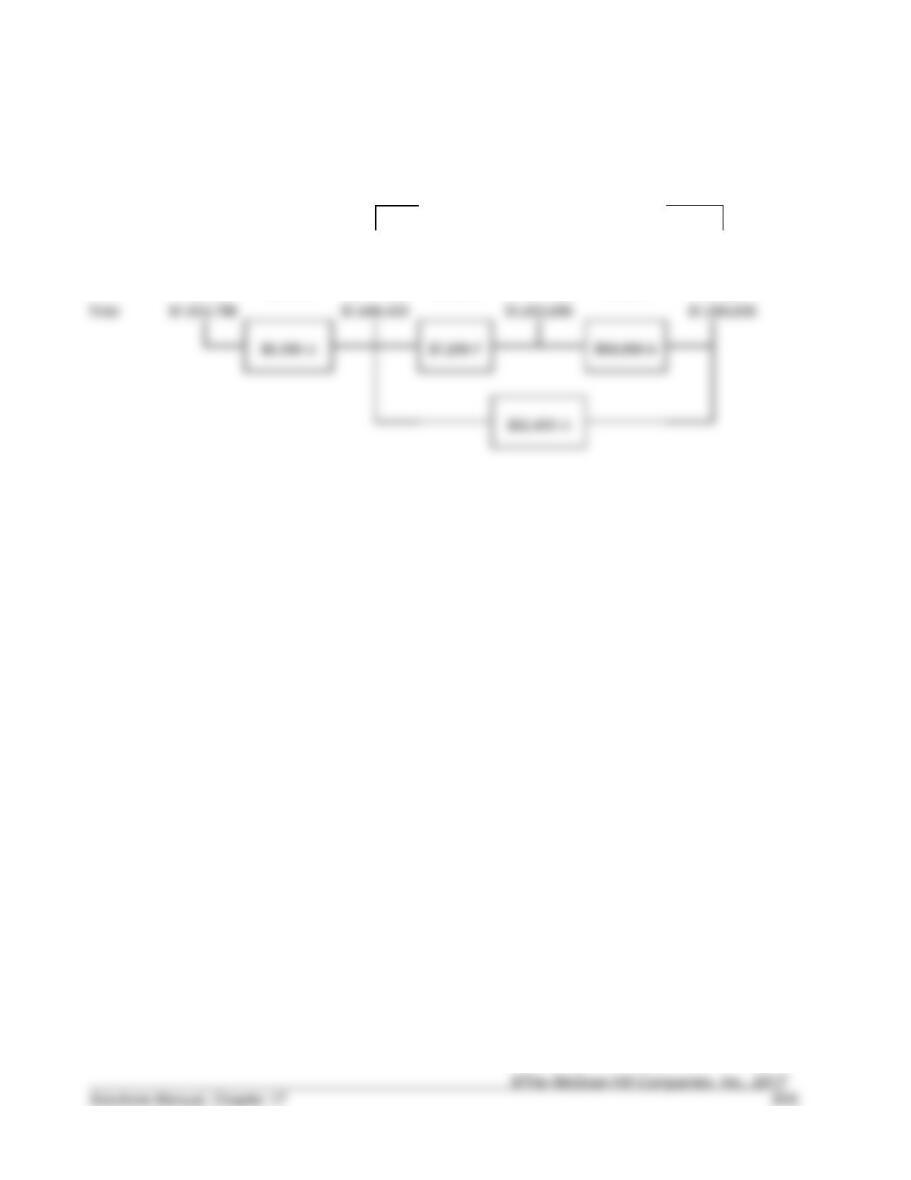
17–39. (30 min.) Nonmanufacturing Cost Variances: FSBCU.
Incidental office costs comprise the variable costs. Salaries and the fixed office costs are
all fixed. Variance analysis for the two classes of overhead is as follows:
Actual Costs
Combined
Price and
Efficiency
Variance
Flexible Budget
(Standard Allowed
for Actual Output)
Correspondence,
$17,280 x 0.95
$45 x 384
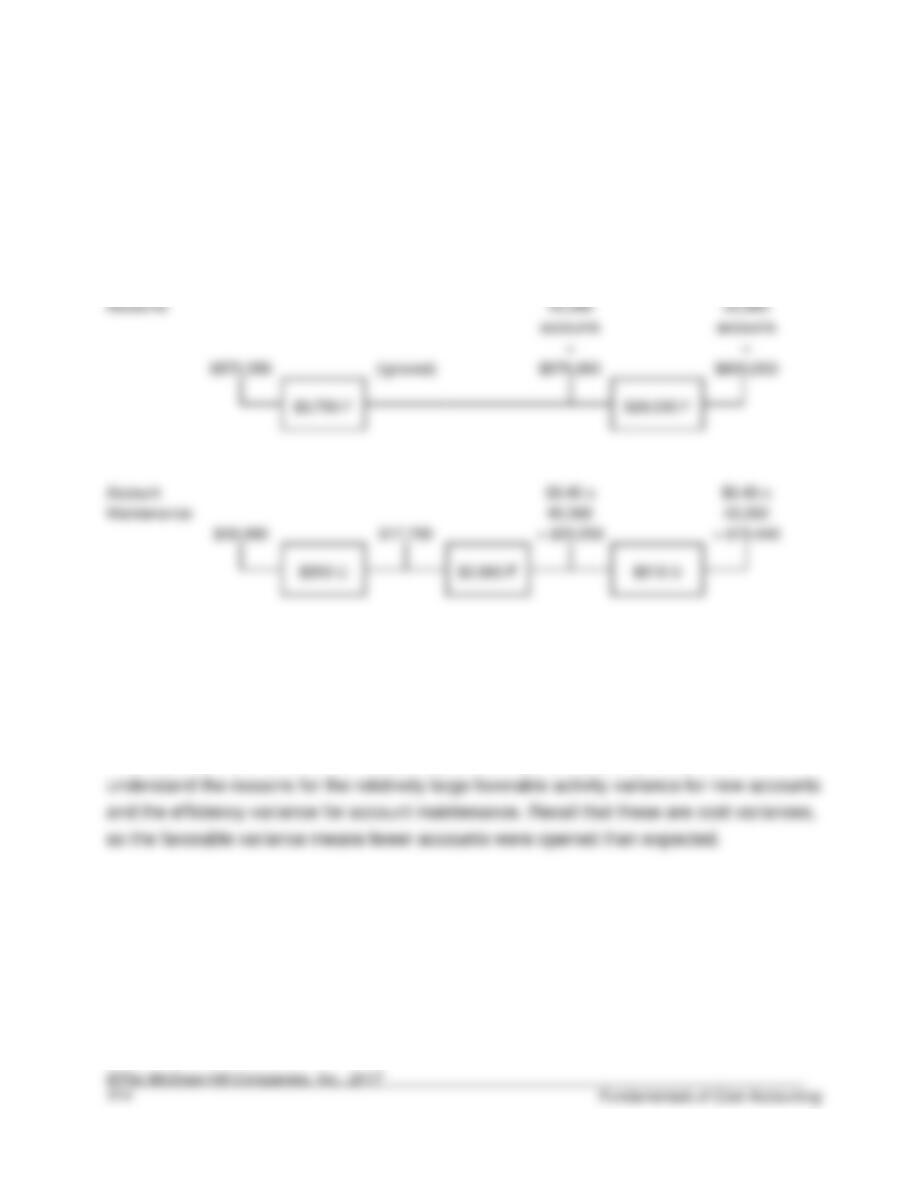
17–40. (30 min.) Performance Evaluation In Service Industries: Bay Area Bank.
Actual
Costs
Price
Variance
Actual
Inputs at
Standard
Price
Efficiency
Variance
Flexible
Budget
Activity
Variance
Master
Budget
(Ignored)
$600,000
= $20,250
New
$30 x
$30 x
17–41. (10 min.) Investigating Variances: Bay Area Bank.
Answers will vary. From the variance analysis above, it would be useful to better
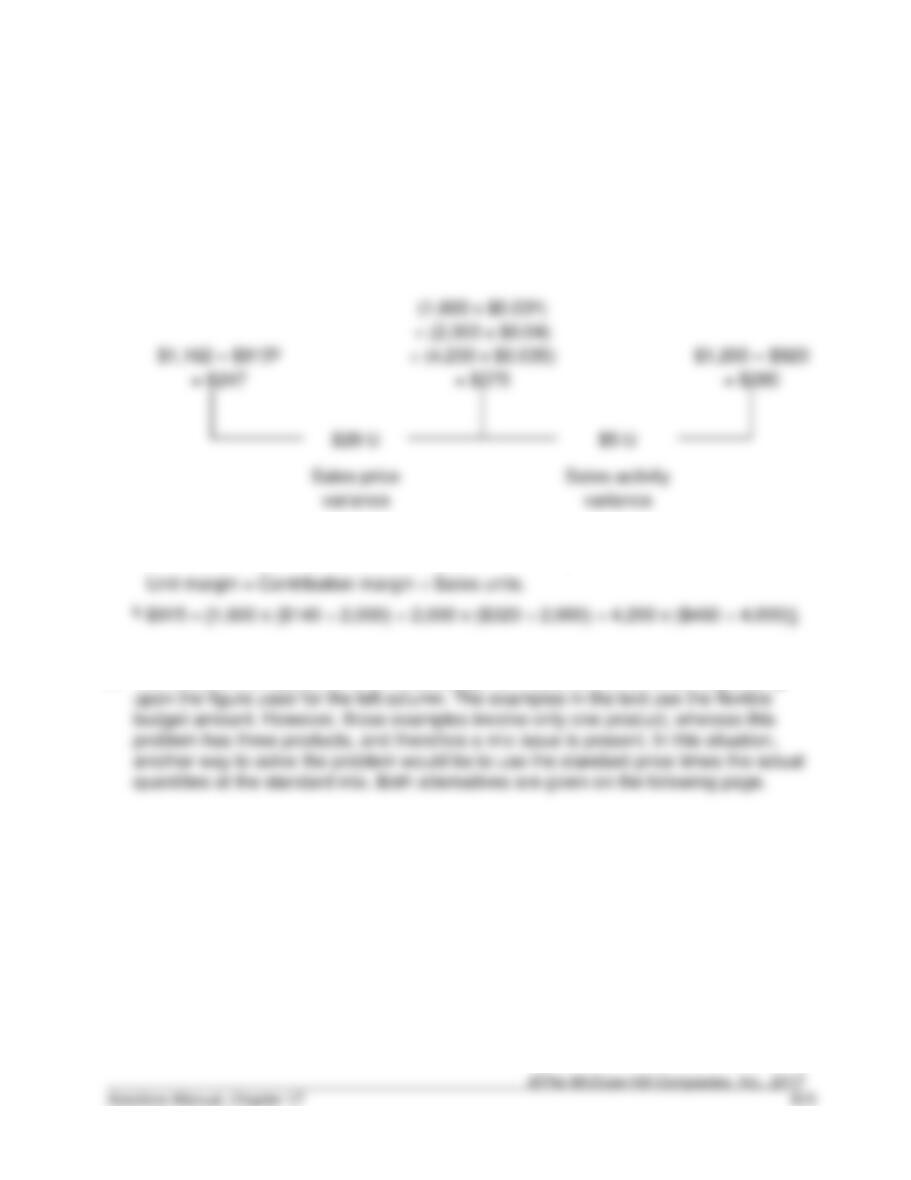
17–42. Revenue Analysis Using Industry Data and Multiple Product Lines: Peninsula
Candy Co.
a. Sales price and activity variances.
Flexible
Master
budget
budget
(AP – SV) x AQ
(SP – SV) x AQ
(SP – SV) x SQ
a Unit contribution margins calculated from master budget panel as follows:
b. Two solutions are possible when calculating the market share variance, depending
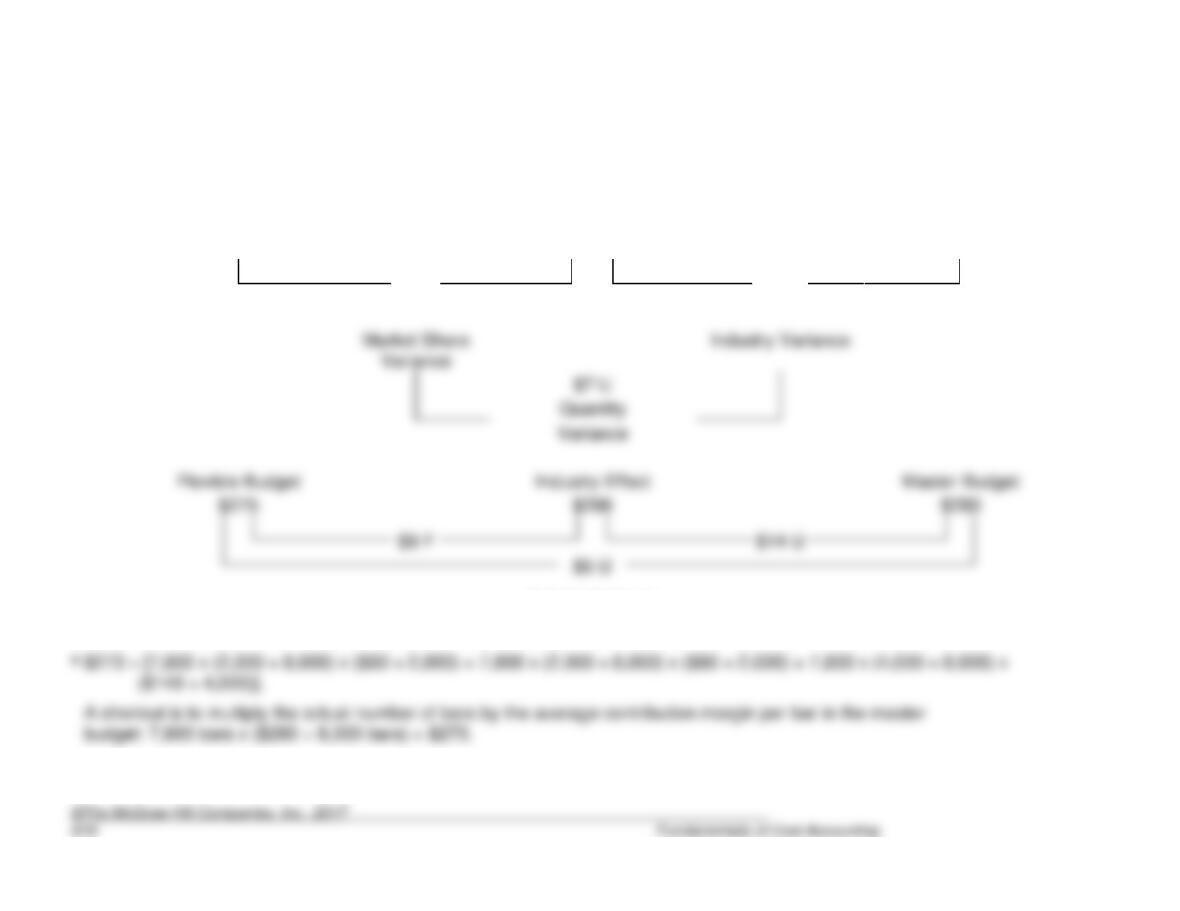
17-42b. (continued)
Contribution margin variance
Actual Quantities at
Standard Mix and
Industry
Master
Standard Prices
Effect
Budget
$280 x (76,000 ÷ 80,000)
$273a
= $266
$280
$7 F
$14 U
Variance
$7 U
Quantity
Variance
Master Budget
$275
$9 F
$14 U
Activity Variance
The $2 difference in the market share variance is explained by the difference in the mix.
17–43. (20 min.) Sales Mix And Quantity Variances: Peninsula Candy Co.
Flexible Budget
Mix
Variance
Quantity
Variance
Master Budget
(SP – SV) x AQ
(SP – SV) x ASQ
(SP – SV) x SQ
8,000
8,000
8,000
17–44. (45 min.) Materials Mix And Yield Variances: Plano Products.
a. and b.
Efficiency Variance
Material
Actual
(AP x
AQ)
Purchase
Price
Variance
(SP x AQ)
Mix
Variance
(SP x ASQ)
Yield
Variance
Flexible
Production
Budget
Chem-A
$9 x
$9 x (.16a x
104,400) =
$9 x (20 x 800b)
17-44. (continued)
Efficiency Variance
Actual
Purchase
Price
Variance
(SP x AQ)
Mix
Variance
(SP x ASQ)
Yield
Variance
Flexible
Production
Budget
Total
$1,654,788
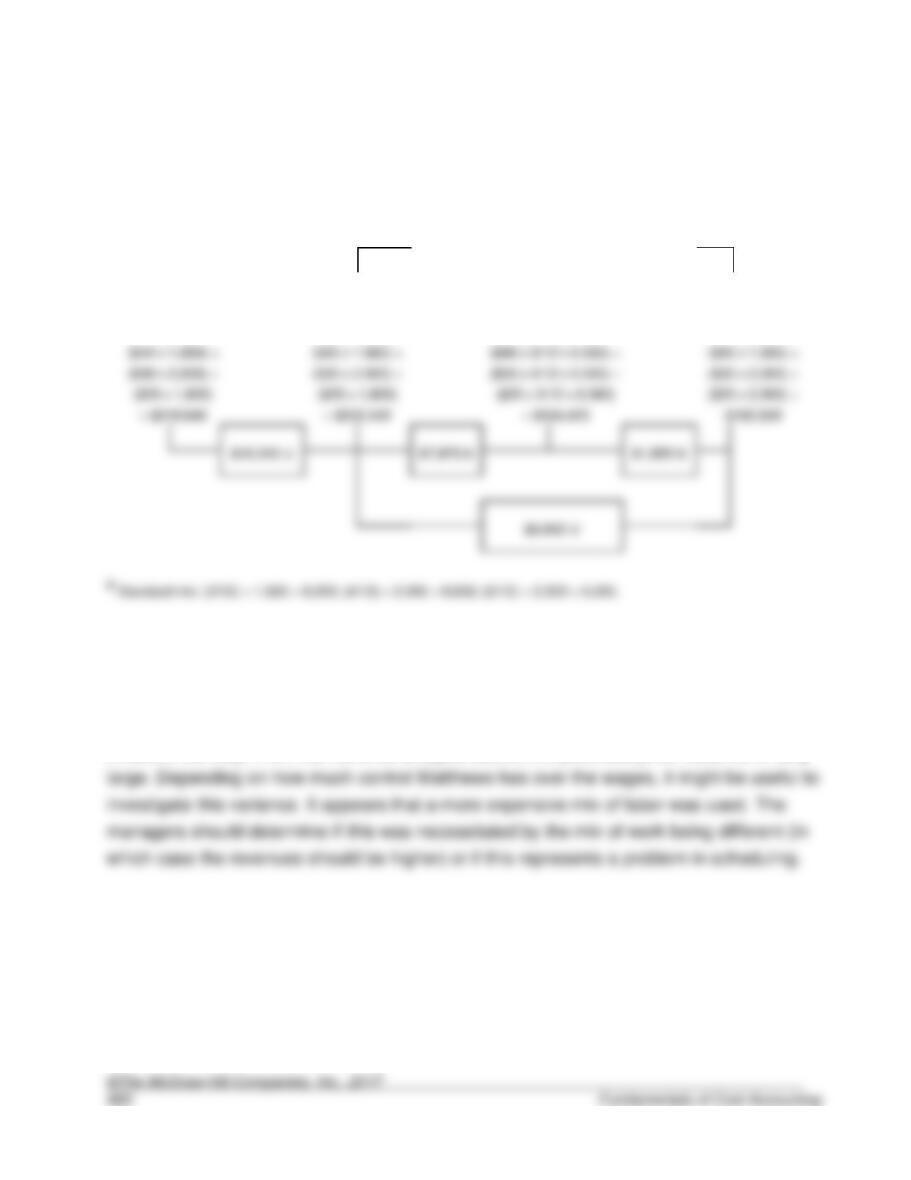
17–45. (30 min.) Labor Mix and Yield Variances: Matthews & Bros.
a. and b.
Efficiency Variance
Actual
Purchase
Price
Variance
(SP x AQ)
Mix
Variance
(SP x ASQ)
Yield
Variance
Flexible
Production
Budget
17–46. (10 min.) Investigating Variances: Matthews & Bros.
Answers will vary. From the variance analysis above, the purchase price variance is fairly
17–47. (20 min.) Derive Amounts for Profit Variance Analysis: Classics Ltd.
Hint: Use last quarter’s actual as master budget.
Actual (based
on actual
activity of
483
detailings)
Variable
Cost
Variance
Sales
Price
Variance
Flexible Budget
(based on
actual activity
of 483
detailings)
Sales
Activity
Variance
Master Budget
(based on a
prediction of
420 detailings)
Sales revenue …………………………………………….
$68,400
$9,846 U
$78,246
a
$10,206 F
$68,040
Less:
Contribution margin ……………………………………..
$37,080
$558 F
$9,846 U
$46,368
$40,320
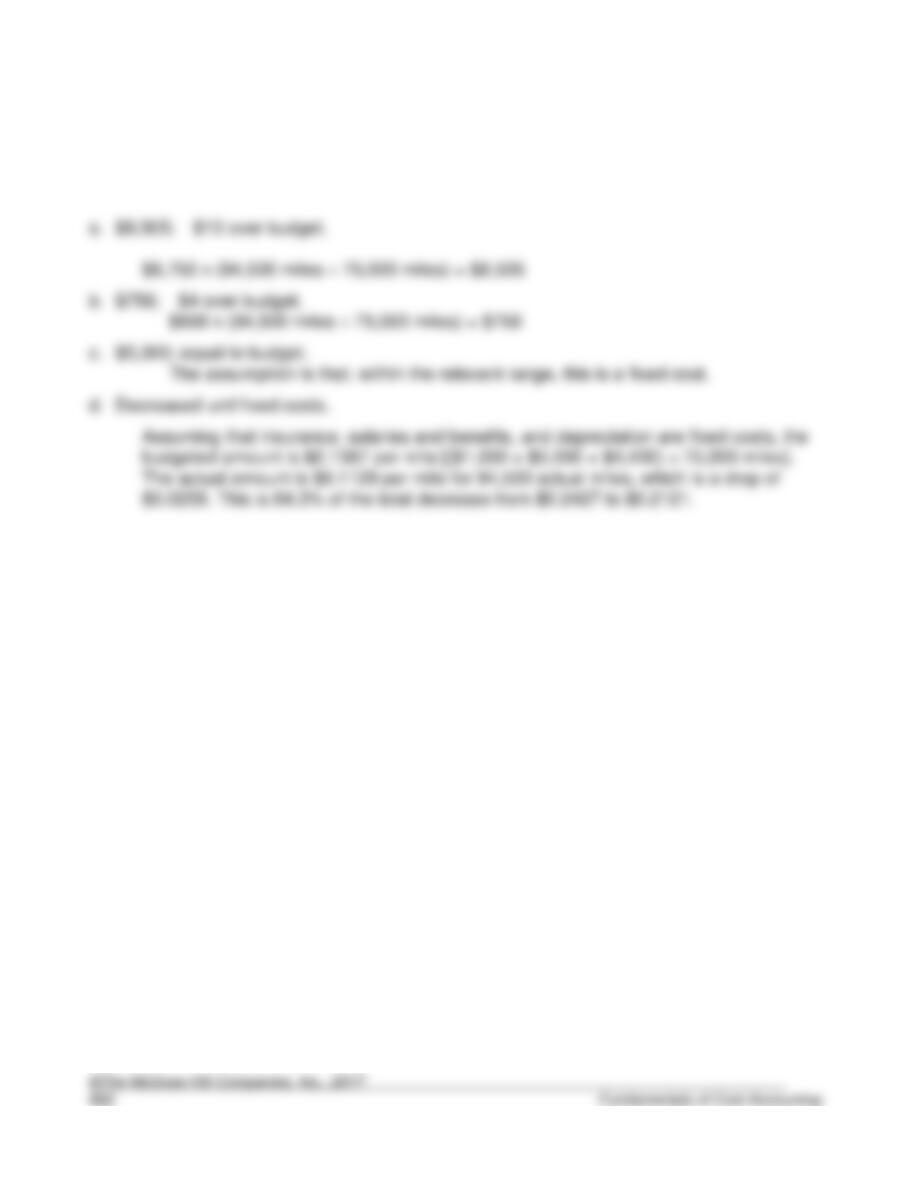
17–48. (20 min.) Flexible budget: Oak Hill Township.
Flexible budget is based on actual activity of 94,500 miles for costs that vary per mile.
Solutions to Case
17–49. Comprehensive Overview of Budgets and Variances Racketeer, Inc.
The following solution is based on a report by Tom Terpstra.
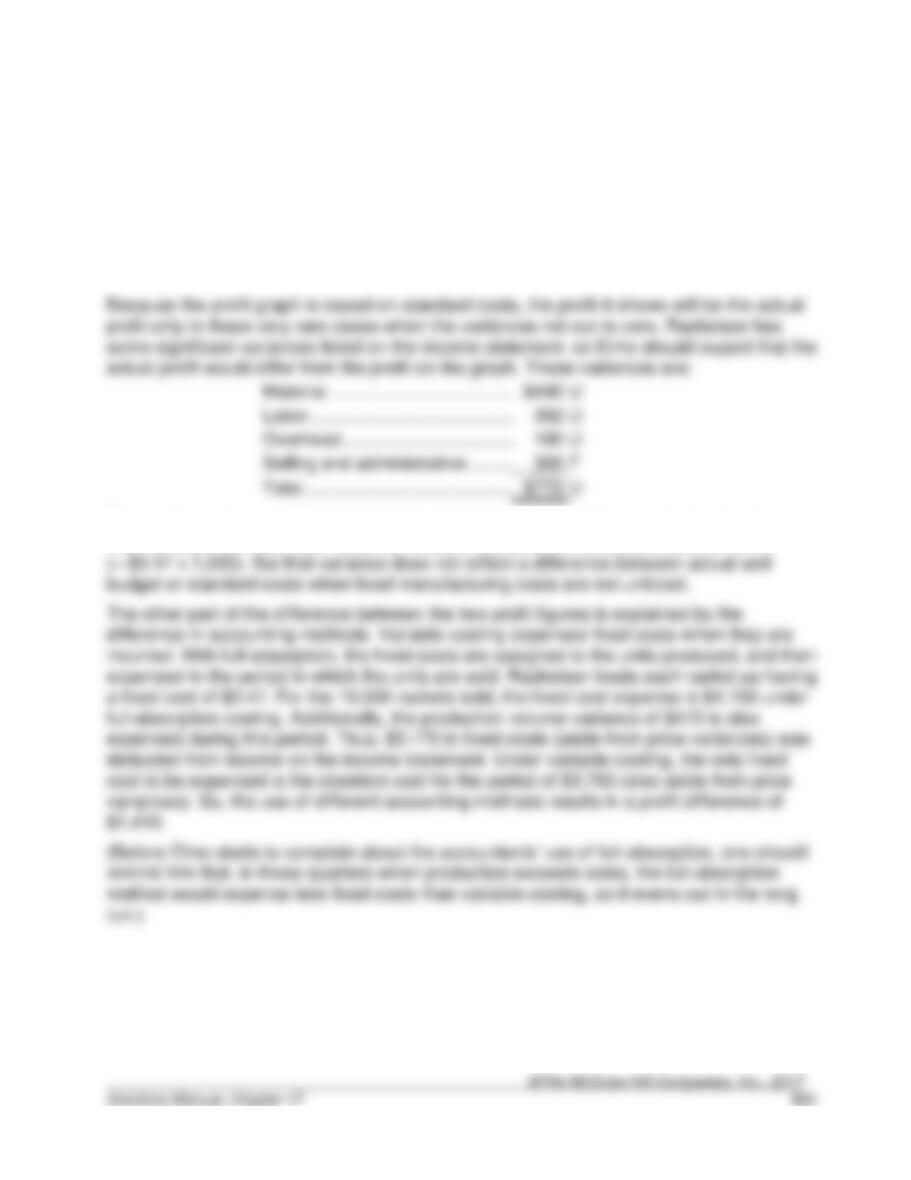
Elmo’s problem is that he thinks that the graph and the income statement measure the
same thing. Otto should have told him that they do not. The income statement presents
actual costs in a full-absorption costing format, while the profit graph is based on standard
costs in a variable costing format. These differences account for the difference in the profit
measurement.
The overhead amount differs from the figure on the income statement, because the
income statement overhead variance includes a production volume variance of $470
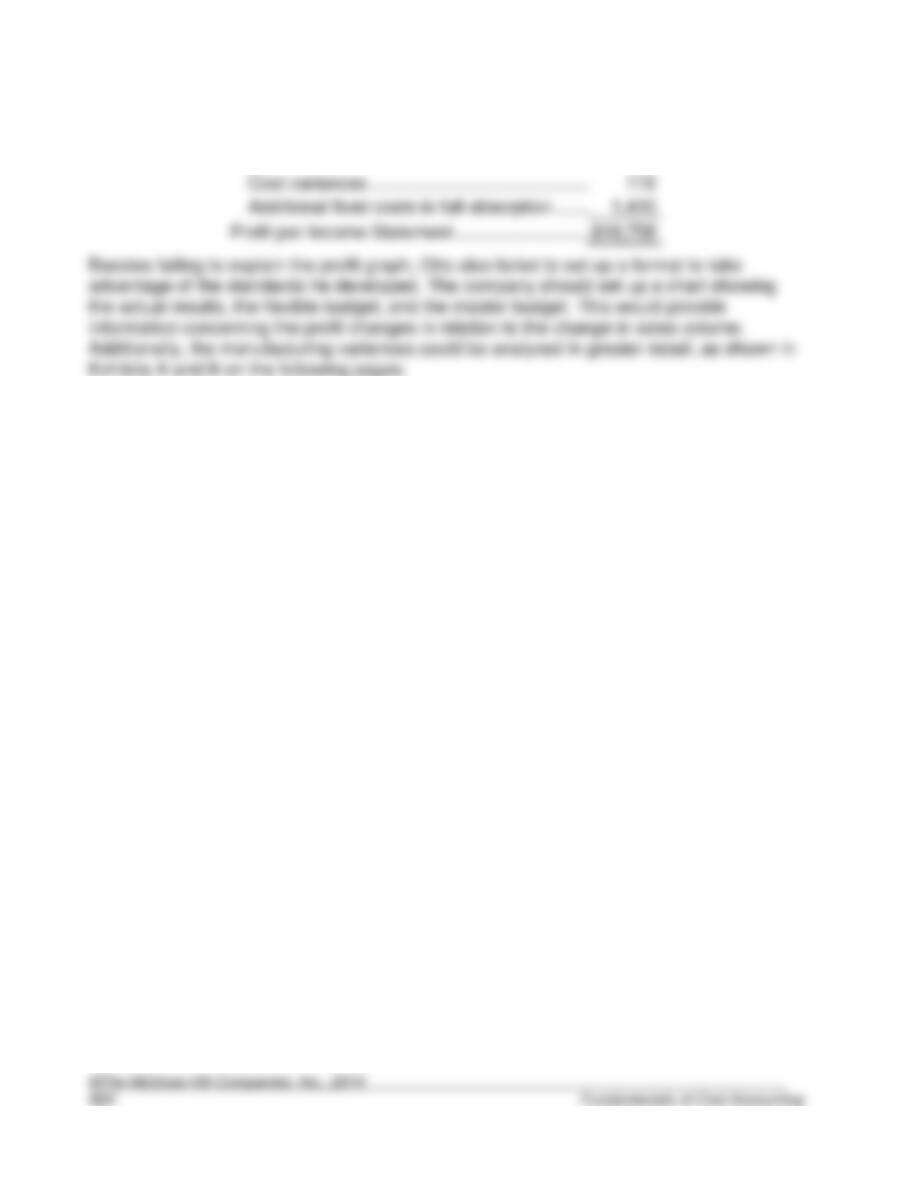
17-49. (continued)
Now the two results can be reconciled:
Profit per chart …………………………………………….
$20,940
Less:
Profit per Income Statement ………………………….
17-49. (continued)
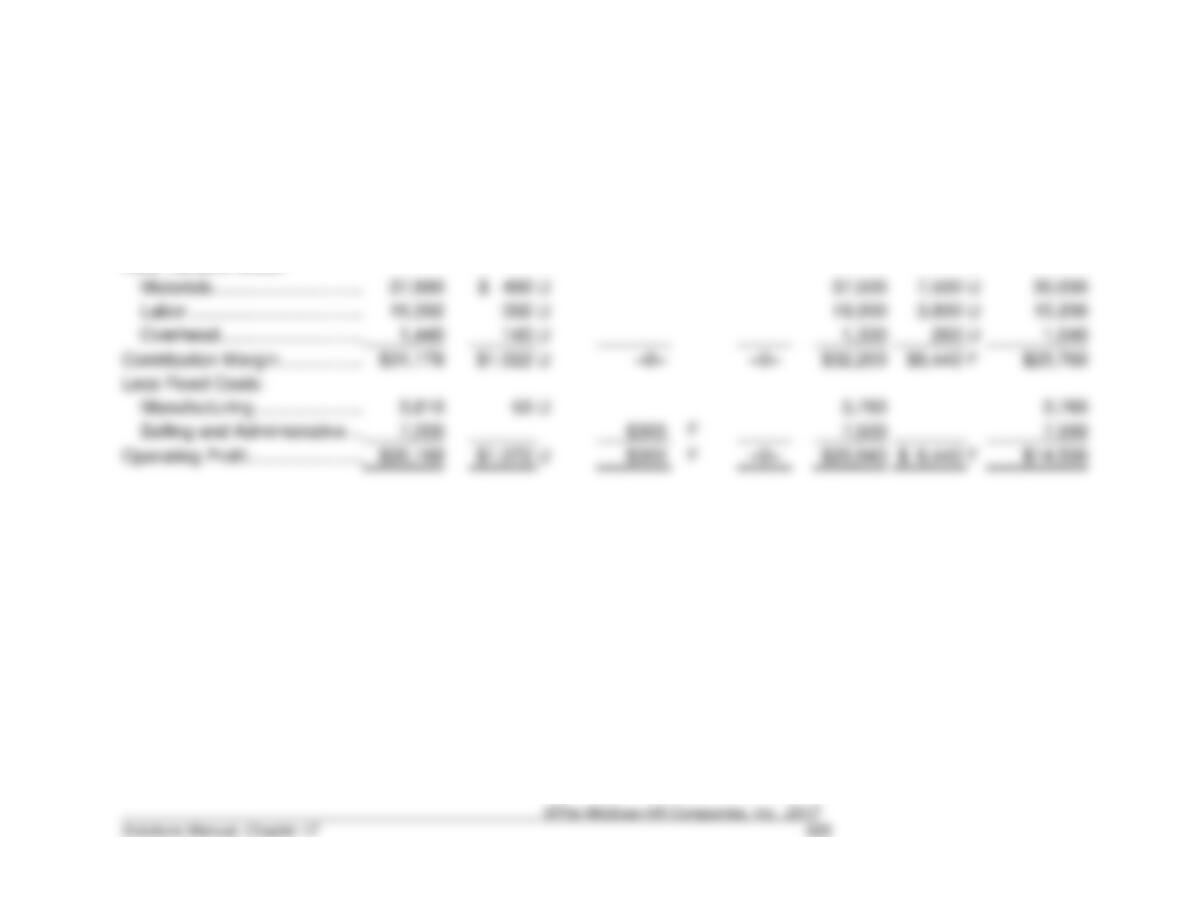
Exhibit A Comparison of Master Budget to Actual Results.
Actual
Manufacturing
Variance
Selling and
Administrative
Variance
Sales Price
Variance
Flexible
Budget
Activity
Variance
Master
Budget
Sales revenue ……………………..
$90,000
–0–
–0–
$90,000
$18,000
F
$72,000
Less Variable Costs:
19,392
U
U
U
U
Contribution Margin ………………
$31,178
$1,022
U
–0–
–0–
$32,200
$6,440
F
$25,760
Less Fixed Costs:
17-49. (continued)
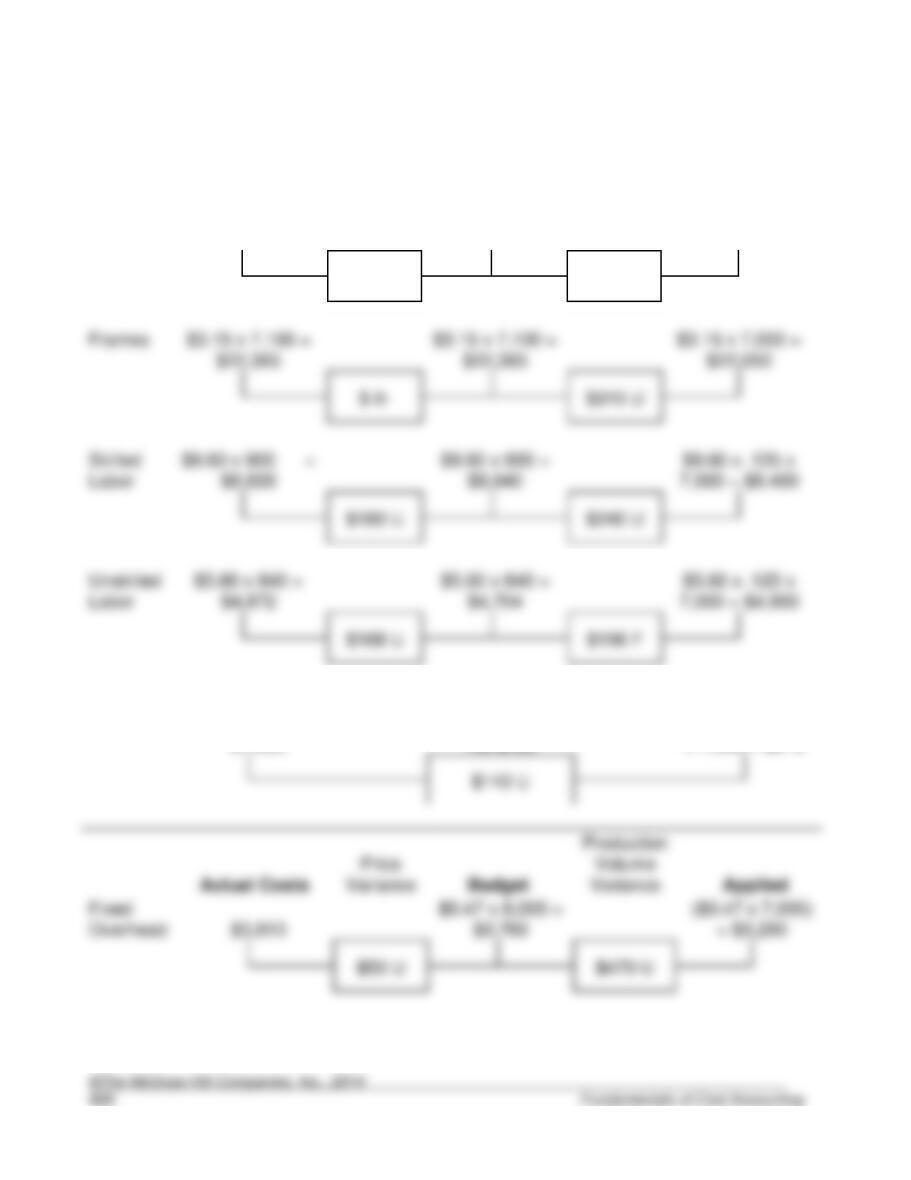
Exhibit B Manufacturing Cost Variances.
Actual Costs
Price
Variance
Actual Inputs
at Standard
Price
Efficiency
Variance
Flexible Budget
String
$0.025 x 175,000
= $4,375
$0.03 x 175,000
= $5,250
$0.03 x 20 x
7,000 = $4,200
$875 F
$1,050 U
Frames
Skilled
Labor
7,000 = $8,400
Unskilled
Labor
7,000 = $4,900
$196 F
Variable
Overhead
$1,050
Total Variable
Overhead
Variance
($0.10 + $.03)
x 7,000 = $910
Actual Costs
Variance
Fixed
Overhead
17-49. (continued)
The variance breakdown in Exhibits A and B highlights the areas that Elmo and Otto
should research. One area involves the strings. Is the combination of a favorable price
variance and unfavorable efficiency variance an indicator that low quality string was