CHAPTER 16
FINANCIAL STATEMENT ANALYSIS
DISCUSSION QUESTIONS
1. Liquidity is the ability of a company to convert assets into cash. Short-term creditors such as banks and
2. Comparative statements provide information about changes between dates or periods. Trends indicated by
comparisons may be far more significant than the data for a single date or period.
3. Before this question can be answered, the increase in net income should be compared with changes in
sales, expenses, and assets for the current year. The return on total assets for both periods should also be
compared. If these comparisons indicate favorable trends, the operating performance has improved. If not,
the apparent favorable increase in net income may be offset by unfavorable trends in other areas.
4. Generally, the two ratios would be very close because most service businesses sell services and hold very
little inventory.
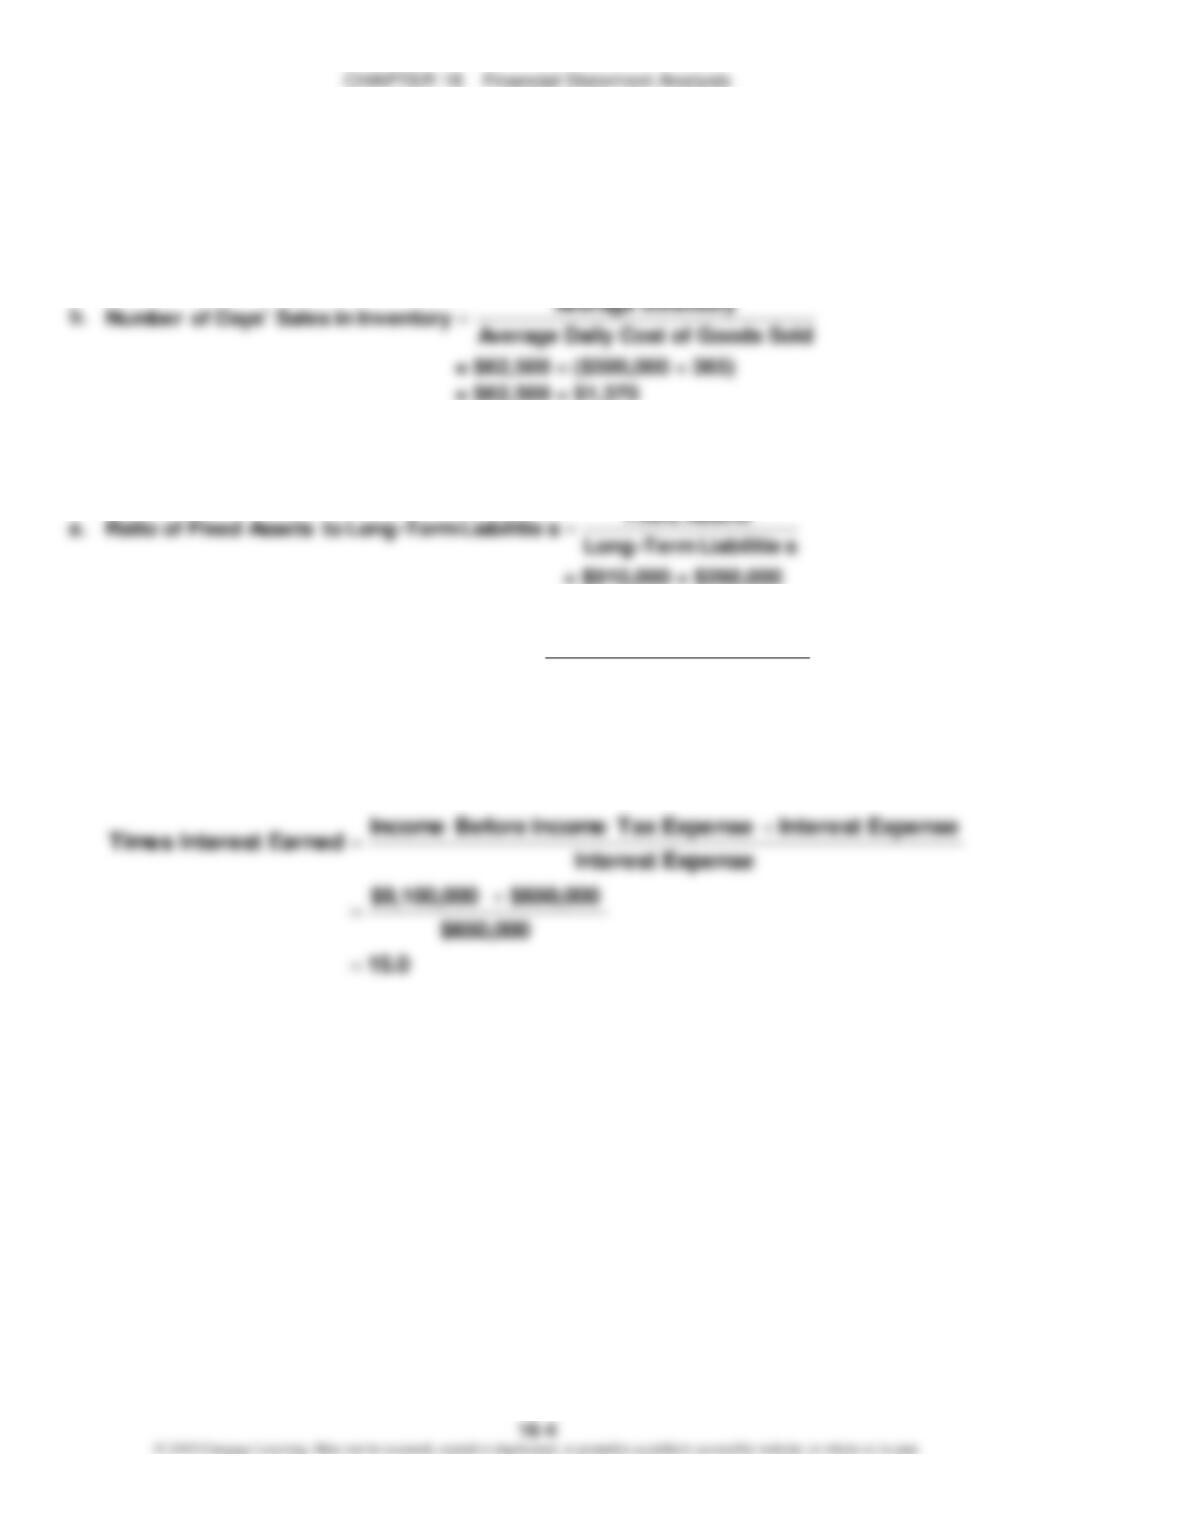
6. The ratio of fixed assets to long-term liabilities increased from 3.4 ($1,360,000 ÷ $400,000) in the
preceding year to 4.2 ($1,260,000 ÷ $300,000) in the current year. This indicates that the company is in a
stronger position this year to borrow additional long-term debt.
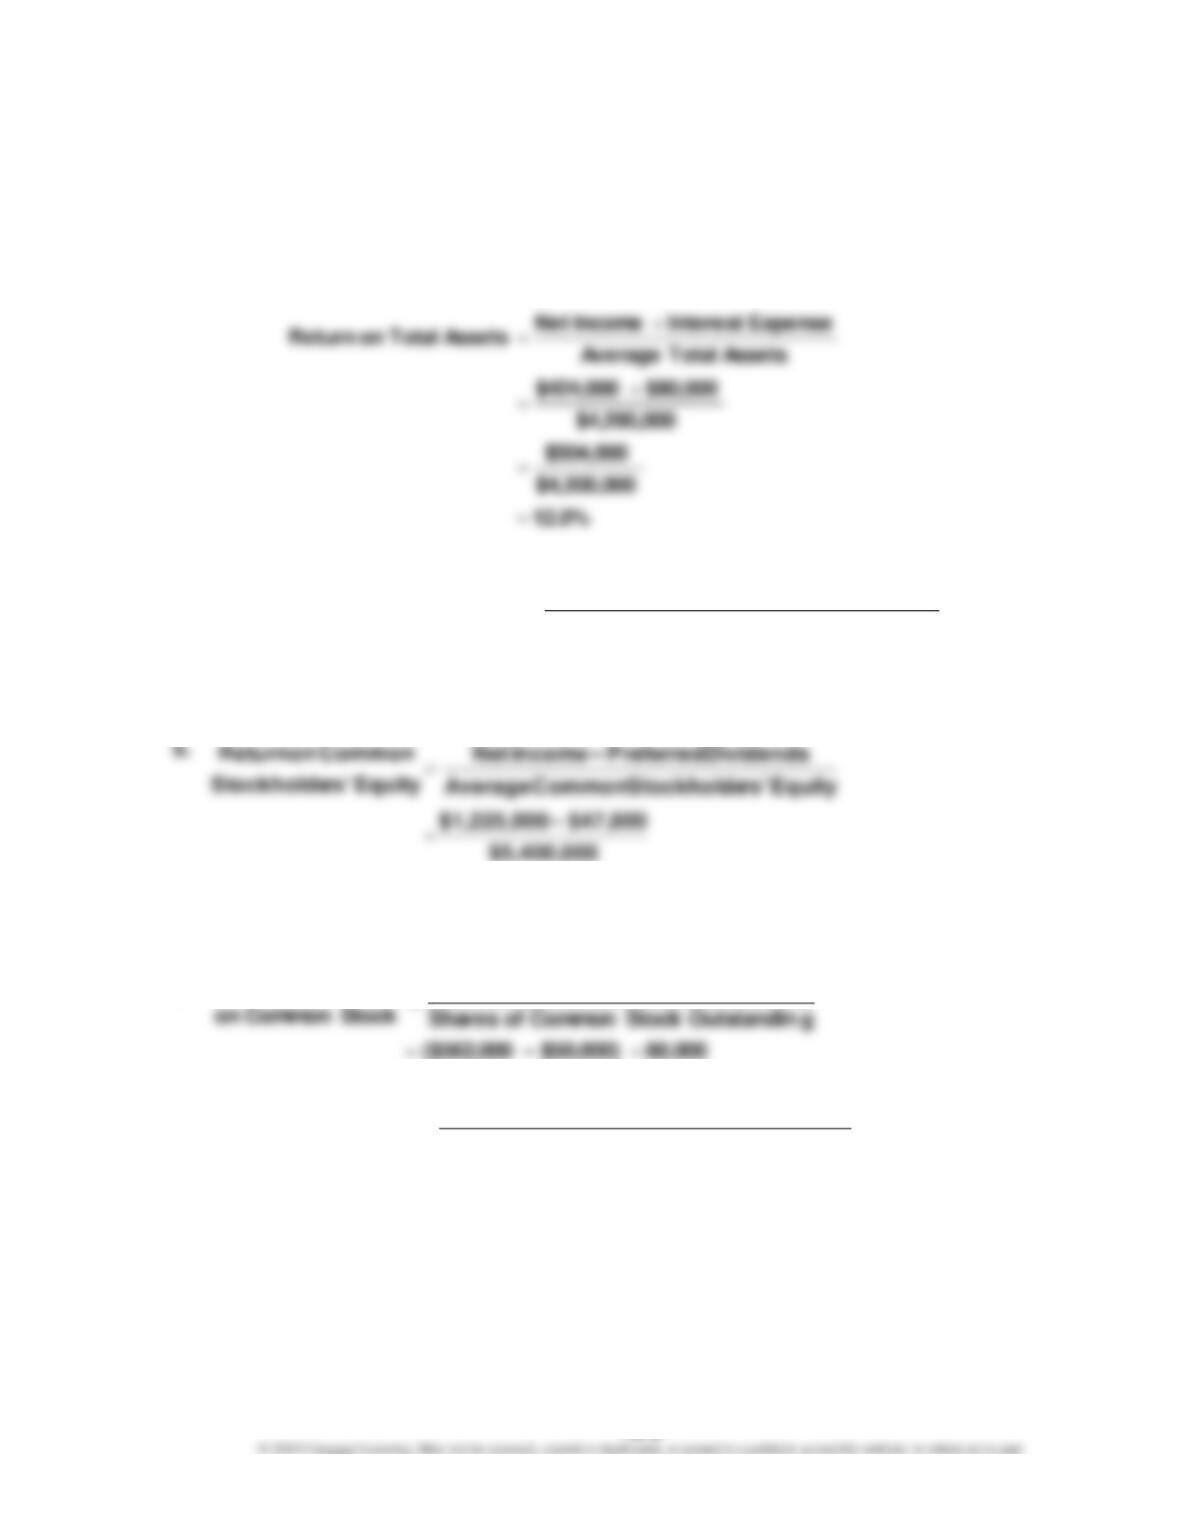
7. a. The return on total assets measures the profitability of the total assets, without regard for how the
assets are financed. The return on stockholders’ equity measures the profitability of the stockholders’
CHAPTER 16 Financial Statement Analysis
DISCUSSION QUESTIONS (Concluded)
8. The price-earnings ratio measures the market’s expectations of a company’s future earnings prospects.
Kroger’s low price-earnings ratio compared to the industry average suggests that the market has low
expectations about the company’s future earnings.
9. The dividend yield measures the return common stockholders receive from a cash dividend. The high
CHAPTER 16 Financial Statement Analysis
BASIC EXERCISES
BE 16–1
Accounts payable ……………………………….. $12,240 increase ($114,240 – $102,000), or 12%
Long-term debt …………………………………… $7,200 increase ($127,200 – $120,000), or 6%
BE 16–2
Amount
Percentage
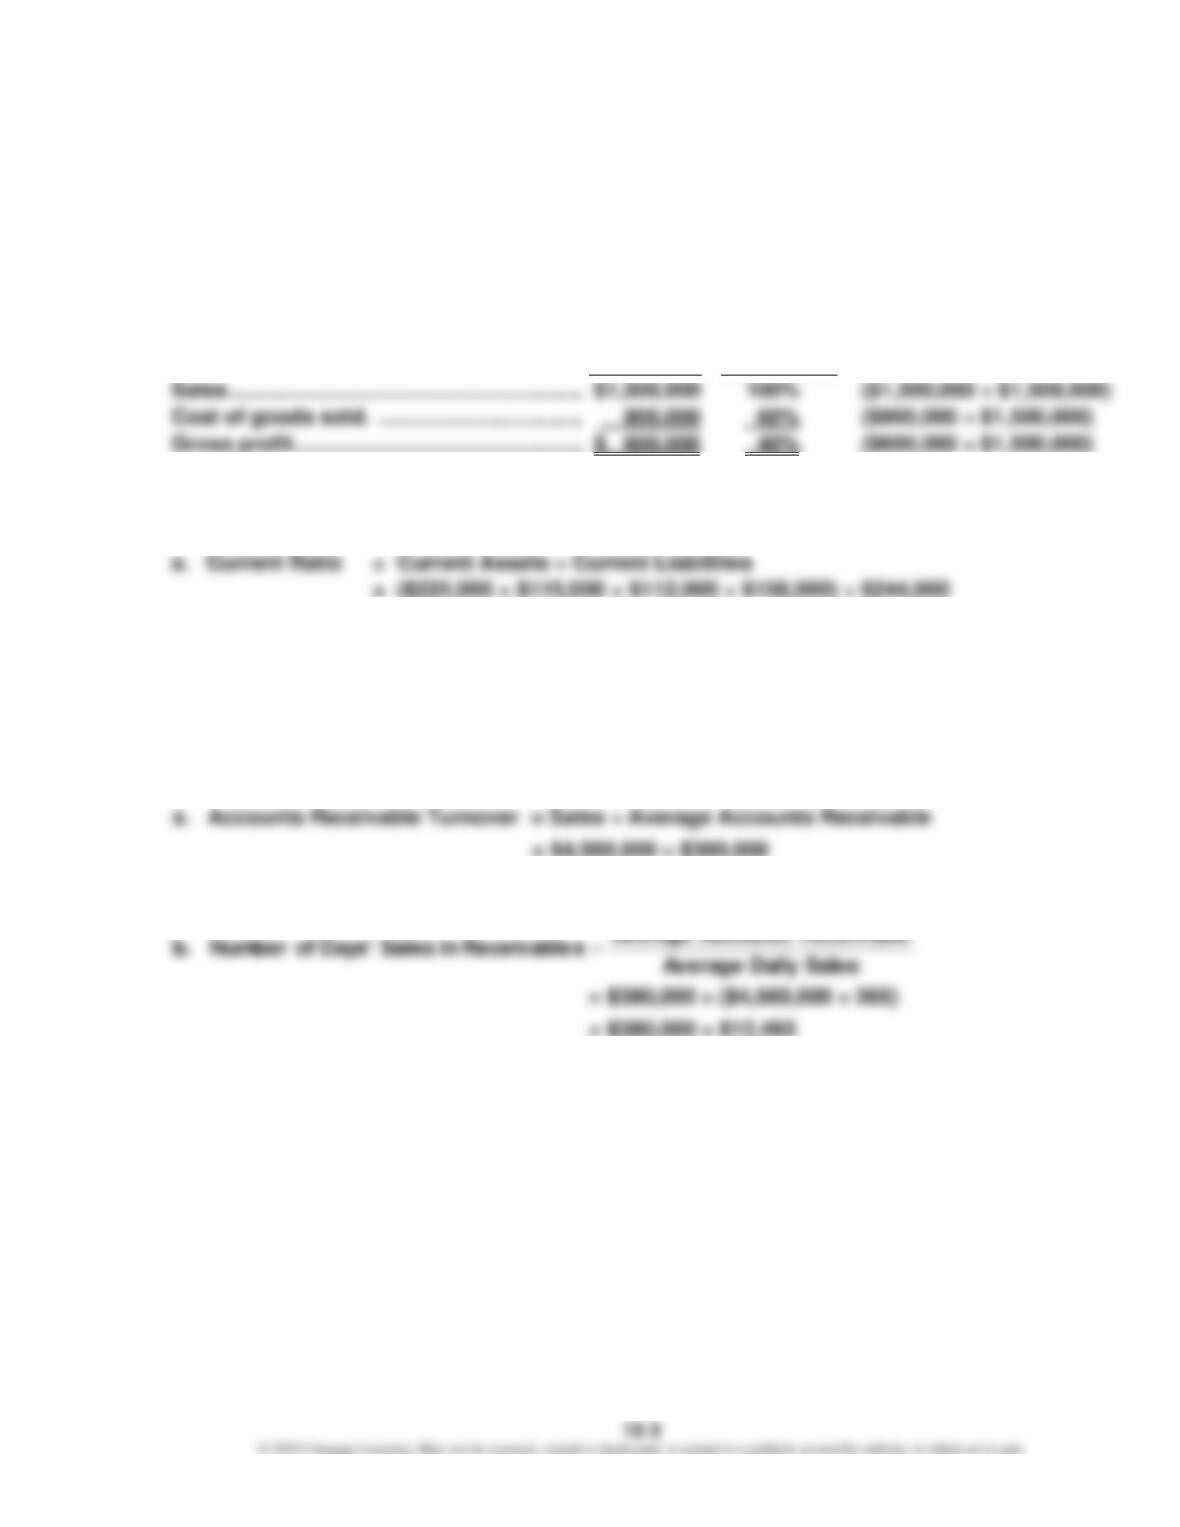
Sales ………………………………………………….. $1,500,000
100% ($1,500,000 ÷ $1,500,000)
Cost of goods sold. ……………………………. 900,000
BE 16–3
= 2.5
b. Quick Ratio = Quick Assets ÷ Current Liabilities
= ($225,000 + $115,000 + $112,000) ÷ $244,000
= 1.9
BE 16–4
= 12.0
= 30.4 days
BE 16–5
a. Inventory Turnover = Cost of Goods Sold ÷ Average Inventory
= $500,000 ÷ $62,500
= 8.0
= 45.6 days
BE 16–6
= 3.5
b.
= $800,000 ÷ $320,000
= 2.5
BE 16–7
Equity rs’Stockholde Total
sLiabilitie Total
Equity rs’Stockholde to sLiabilitie of Ratio =
CHAPTER 16 Financial Statement Analysis
BE 16–8
Asset Turnover = Sales ÷ Average Total Assets
= $6,750,000 ÷ $2,500,000
= 2.7
BE 16–9
BE 16–10
a.
BE 16–11
a.
b.
14.0%
$8,750,000 $1,225,000
Equity rs’Stockholde Common Average
IncomeNet
Equity rs’Stockholde on Return
=
=
=
21.8%
=
Dividends Preferred – IncomeNet
Share per Earnings =
$6.40=
5.0
$6.40 $32.00
Stock Common on Share per Earnings
Stock Common of Share per PriceMarket
Ratio EarningsPrice
=
=
=–
CHAPTER 16 Financial Statement Analysis
EXERCISES
Ex. 16–1
a.
Innovation Quarter Inc.
Comparative Income Statement
For the Years Ended December 31
Current Year
Previous Year
Amount
Percent
Amount
Percent
Sales
$ 4,000,000
100%
$ 3,600,000
100%
Cost of goods sold
(57)%
Gross profit
Administrative expenses
(13)%
Total operating expenses
(28)%
$(1,008,000)
Operating income
$ 720,000
Income tax expense
Net income
$ 504,000
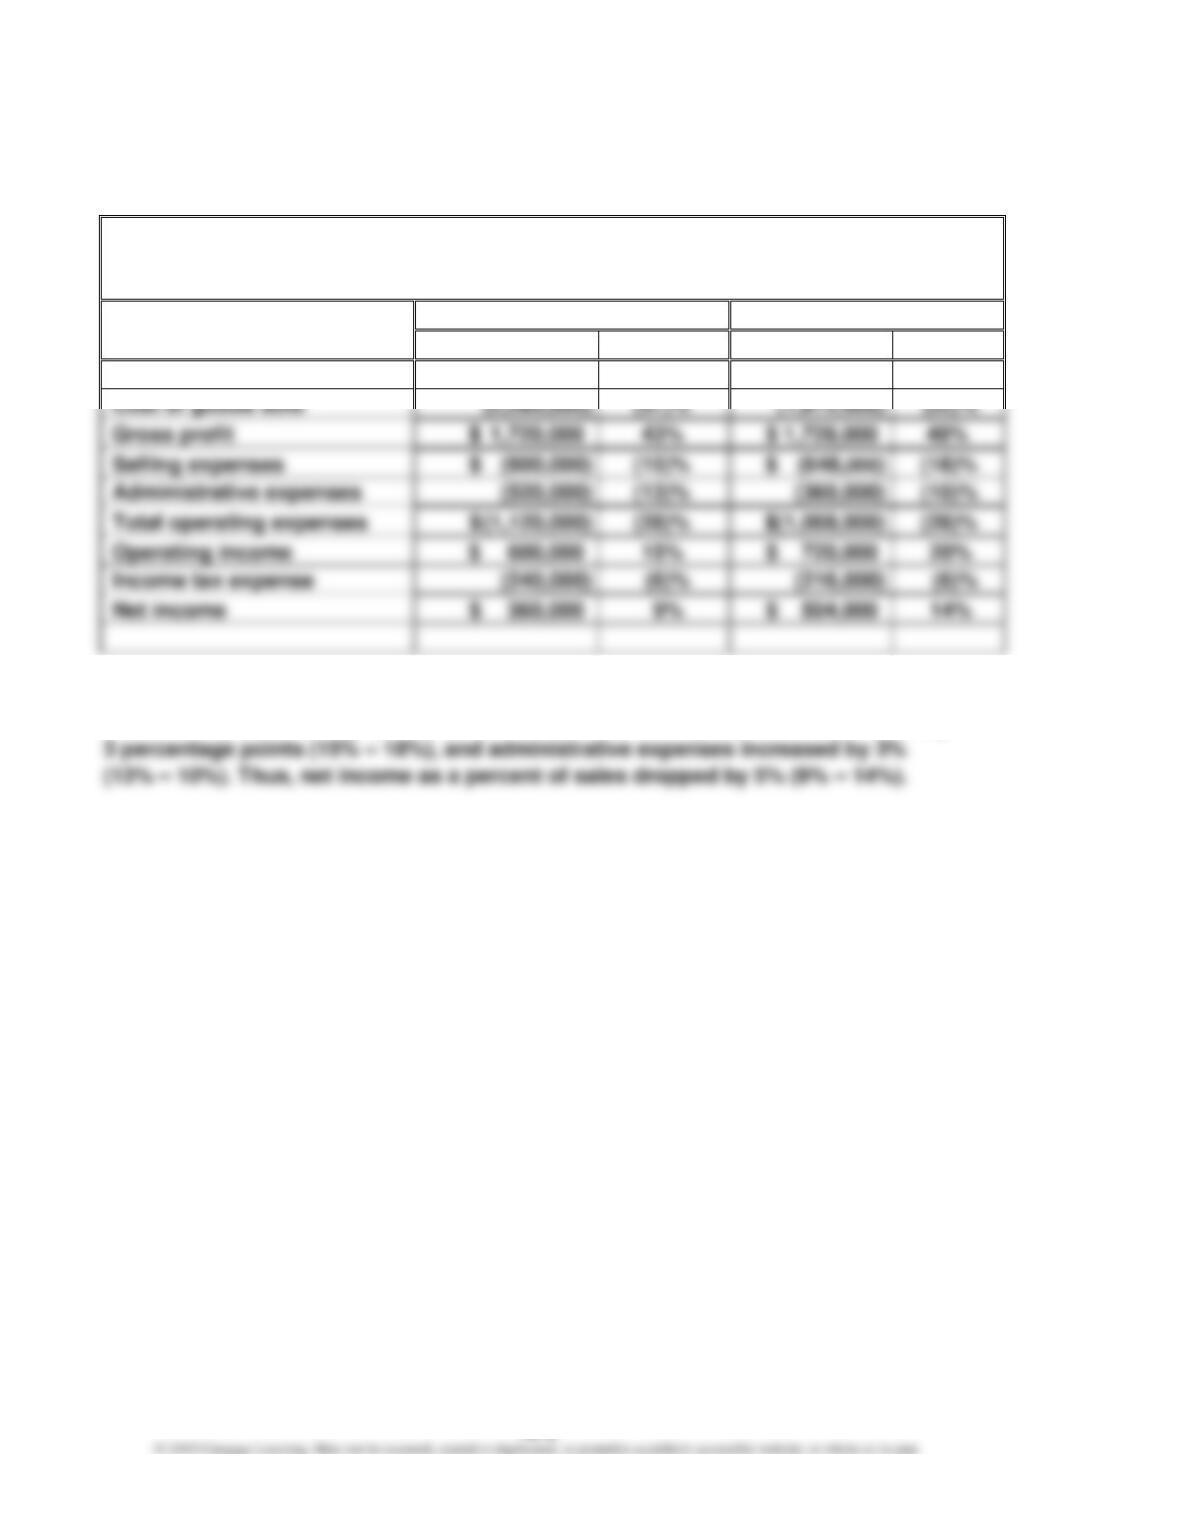
b. The vertical analysis indicates that the cost of goods sold as a percent of sales
increased by 5 percentage points (57% – 52%), while selling expenses decreased by
CHAPTER 16 Financial Statement Analysis
Ex. 16–2
a.
Speedway Motorsports, Inc.
Comparative Income Statement (in thousands of dollars)
For the Years Ended December 31
Current Year
Prior Year
Amount
Percent
Amount
Percent
Revenues:
Admissions
$ 90,639
17.7%
$ 100,694
20.3%
Event-related revenue
136,900
26.7%
29.6%
NASCAR broadcasting
224,227
43.8%
43.8%
Other operating revenue
Total revenues
$ 512,156
$ 496,463
Expenses and other:
Direct expense of events
$(102,786)
(20.1)%
$(104,303)
(21.0)%
NASCAR event
management fees
(137,727)
(26.9)%
(133,682)
(26.9)%
Other direct expenses
General and administrative
(32.5)%
(285,166)
(57.4)%
Total expenses and other
$(450,960)
(88.1)%
$(542,692)
Income from continuing
operations
11.9%
$ (46,229)
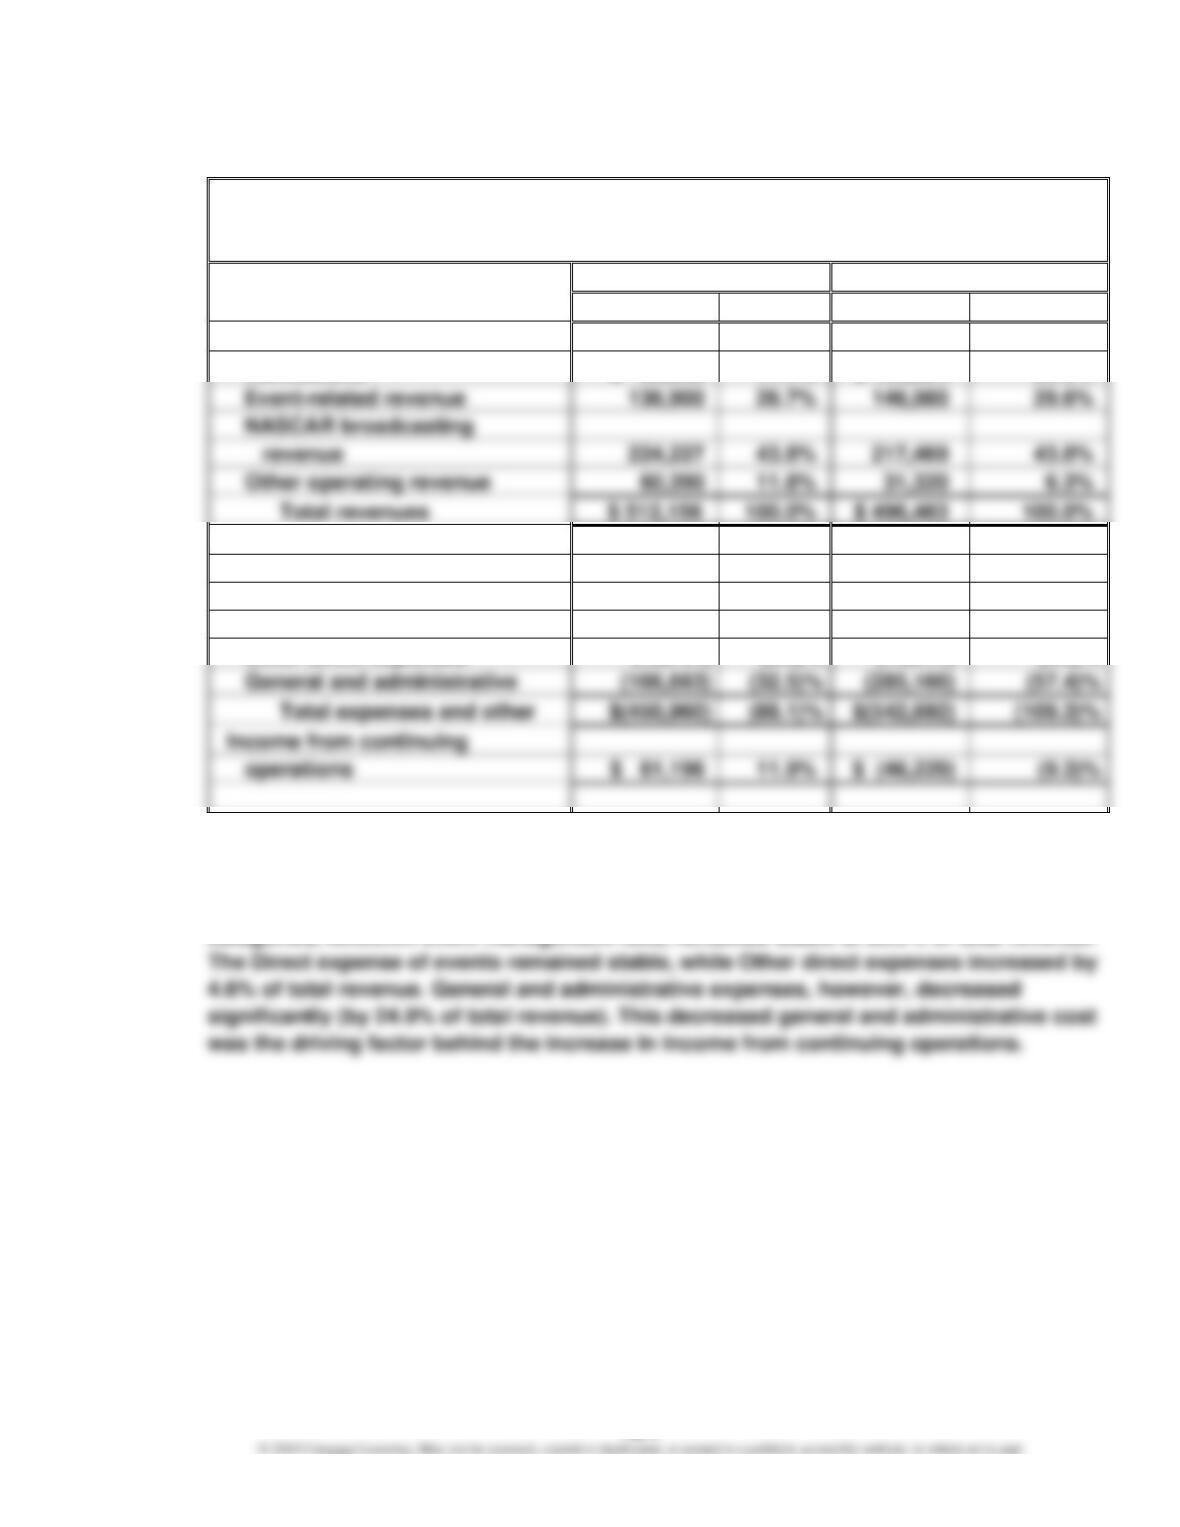
b. Overall revenue increased between the two years, with changes in the mix of revenue
sources. The NASCAR broadcasting revenue remained stable (43.8% of total revenue),
while admissions revenue decreased by 2.6% of total revenue. One of the major expense
CHAPTER 16 Financial Statement Analysis
Ex. 16–3
a.
Tannenhill Company
Common-Sized Income Statement
For the Year Ended December 31
Tannenhill
Company
Electronics
Industry
Average
Amount
Percent
Sales
$ 4,000,000
100%
100%
Cost of goods sold
(2,120,000)
(53)%
(60)%
Gross profit
$ 1,880,000
47%
40%
Selling expenses
$(1,080,000)
(27)%
(24)%
Administrative expenses
(640,000)
(16)%
(14)%
Total operating expenses
$(1,720,000)
(43)%
(38)%
Operating income
Other revenue and expense:
Income before income tax expense
Income tax expense
Net income
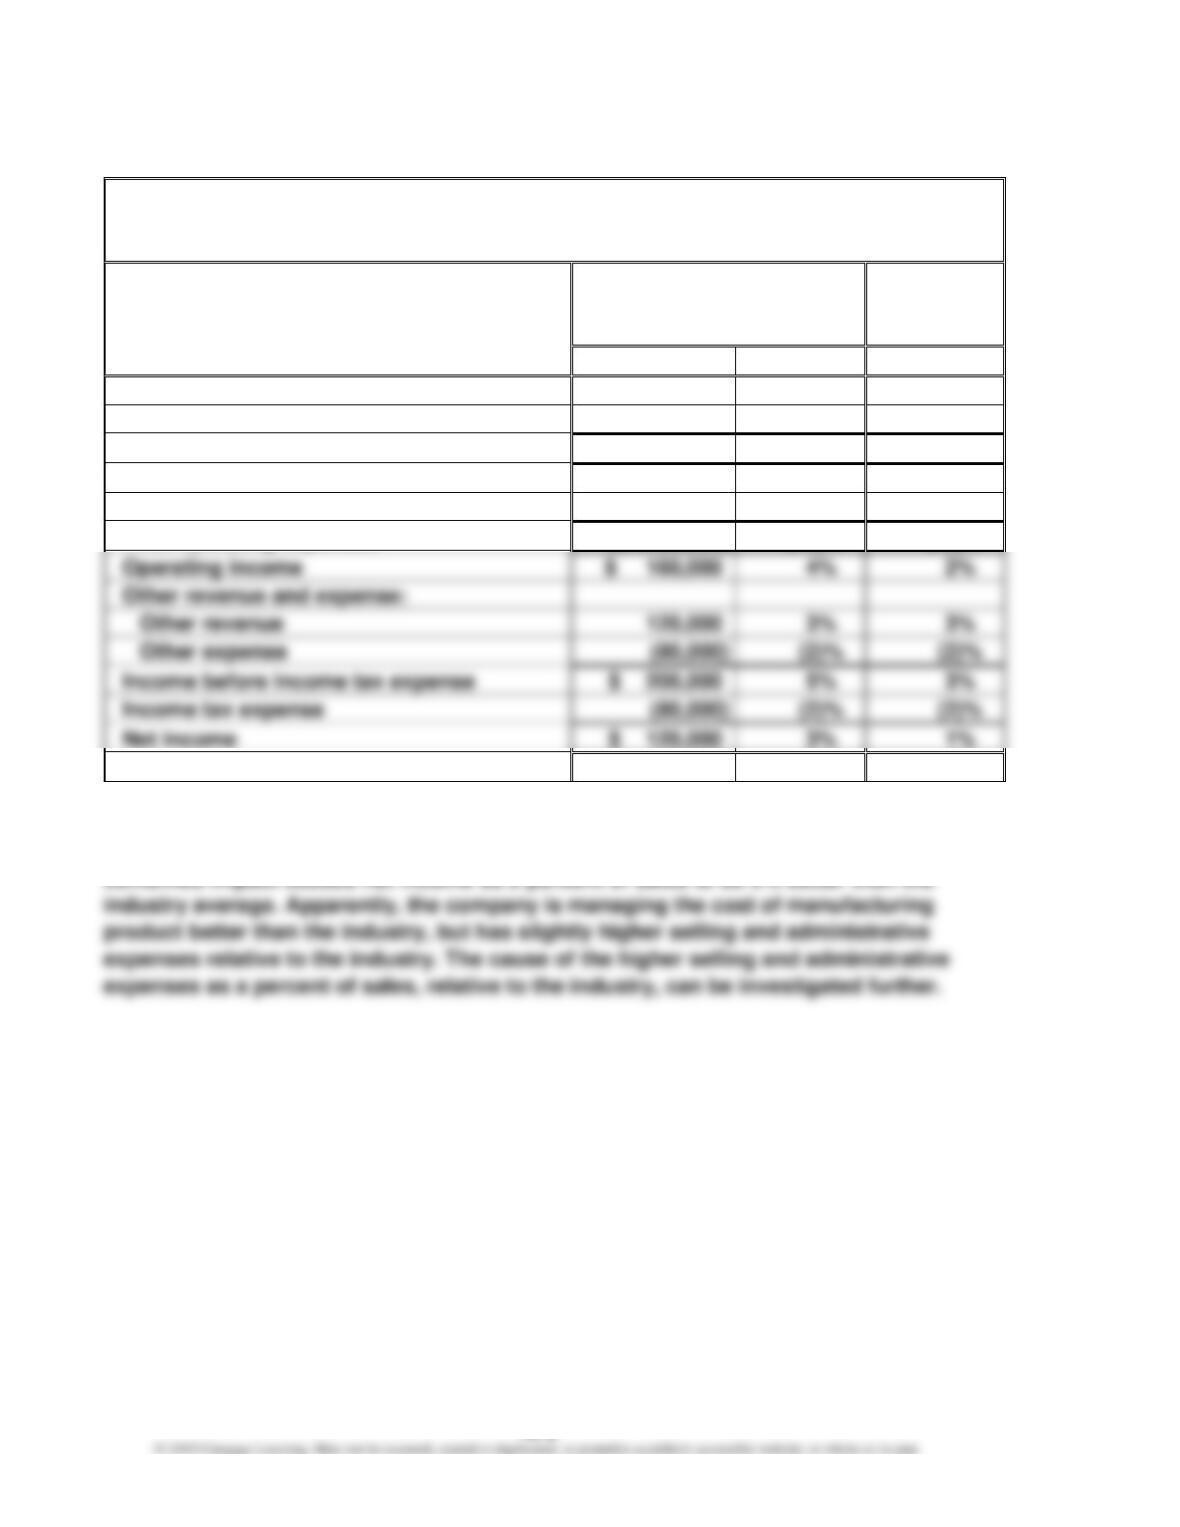
b. The cost of goods sold is 7% lower than the industry average, but the selling expenses
and administrative expenses are 3% and 2% higher than the industry average. The
CHAPTER 16 Financial Statement Analysis
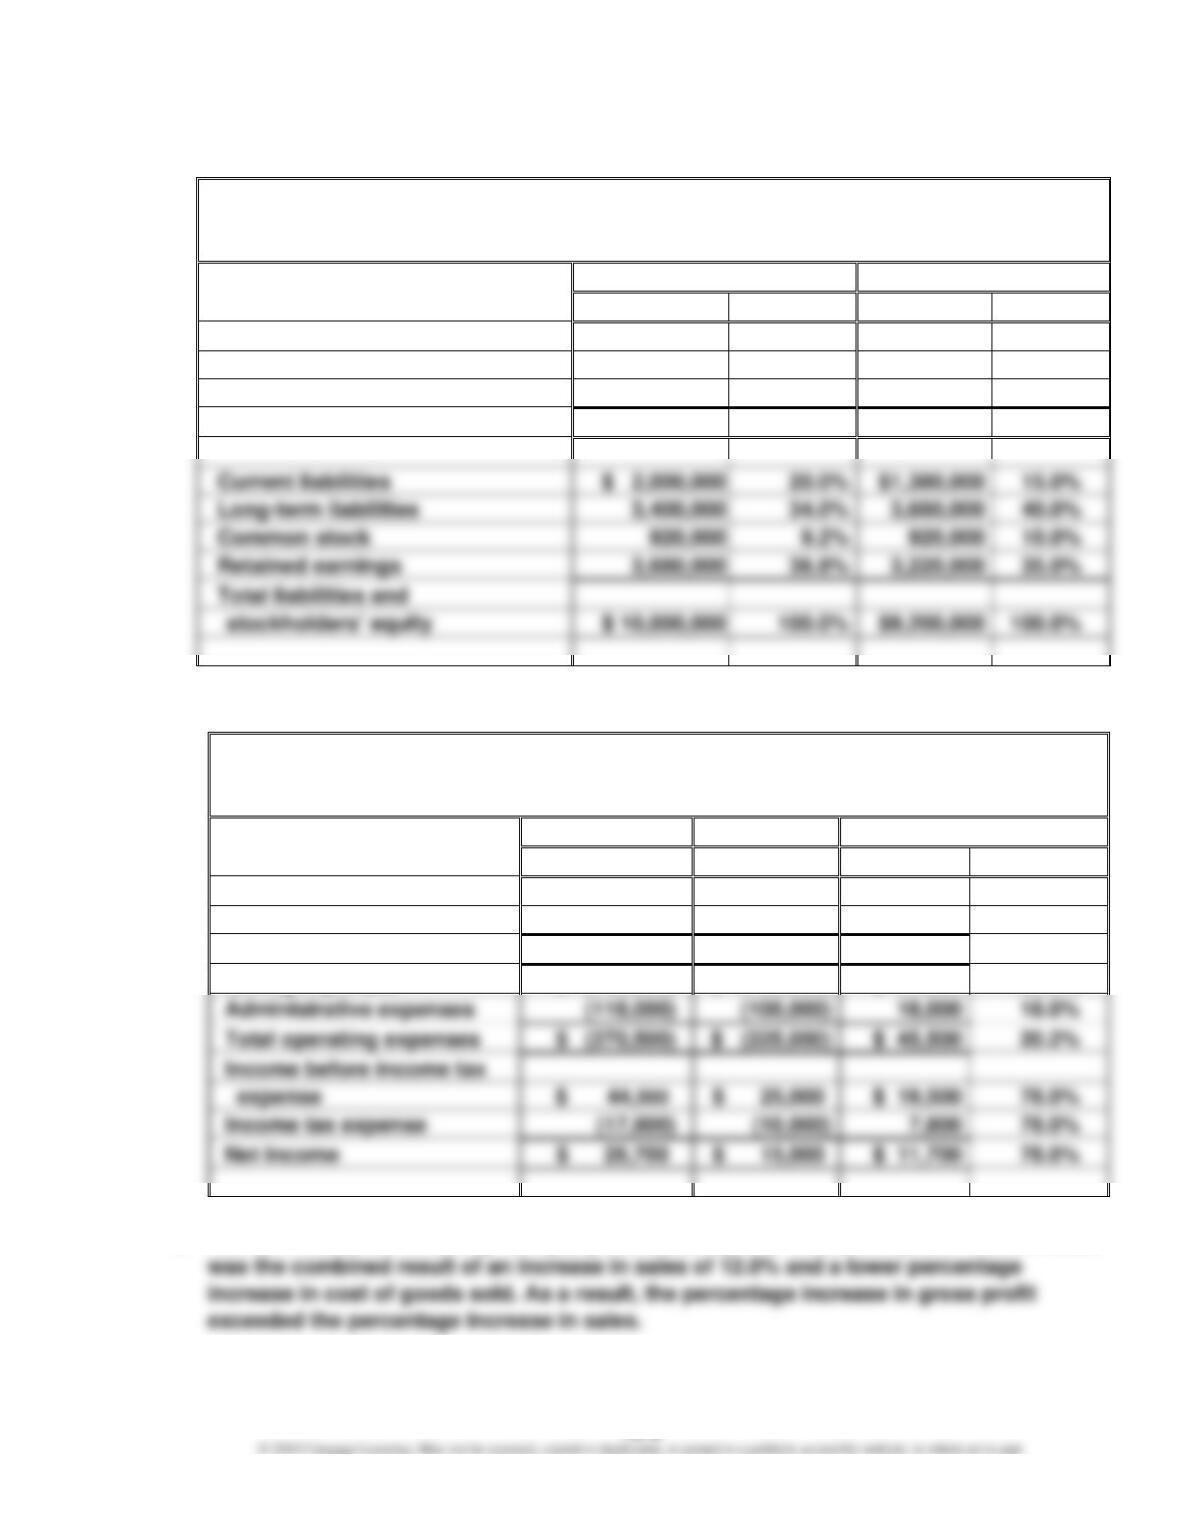
Ex. 16–4
Alvarez Company
Comparative Balance Sheet
For the Years Ended December 31
Current Year
Previous Year
Amount
Percent
Amount
Percent
Current assets
$ 2,500,000
25.0%
$1,840,000
20.0%
Property, plant, and equipment
5,600,000
56.0%
6,072,000
66.0%
Intangible assets
1,900,000
19.0%
1,288,000
14.0%
Total assets
$ 10,000,000
100.0%
$9,200,000
100.0%
Current liabilities
$ 2,000,000
$1,380,000
15.0%
3,400,000
34.0%
3,680,000
40.0%
Common stock
920,000
10.0%
Retained earnings
3,680,000
36.8%
3,220,000
35.0%
Total liabilities and
$ 10,000,000
100.0%
$9,200,000
100.0%
Ex. 16–5
a.
Winthrop Company
Comparative Income Statement
For the Years Ended December 31
Current Year
Previous Year
Increase/(Decrease)
Amount
Amount
Amount
Percent
Sales
$ 2,240,000
$ 2,000,000
$240,000
12.0%
Cost of goods sold
(1,925,000)
(1,750,000)
175,000
10.0%
Gross profit
$ 315,000
$ 250,000
$ 65,000
26.0%
Selling expenses
$ (152,500)
$ (125,000)
$ 27,500
22.0%
Administrative expenses
18.0%
Total operating expenses
$ (270,500)
$ 45,500
20.2%
Income before income tax
expense
$ 44,500
$ 19,500
78.0%
Income tax expense
78.0%
Net income
$ 26,700
$ 15,000
$ 11,700
78.0%
b. The net income for Winthrop Company increased by 78.0% between years. This increase
CHAPTER 16 Financial Statement Analysis
Ex. 16–6
a. (1) Working Capital = Current Assets – Current Liabilities
Current year: $1,090,000 = $2,090,000 – $1,000,000
Previous year: $540,000 = $1,440,000 – $900,000
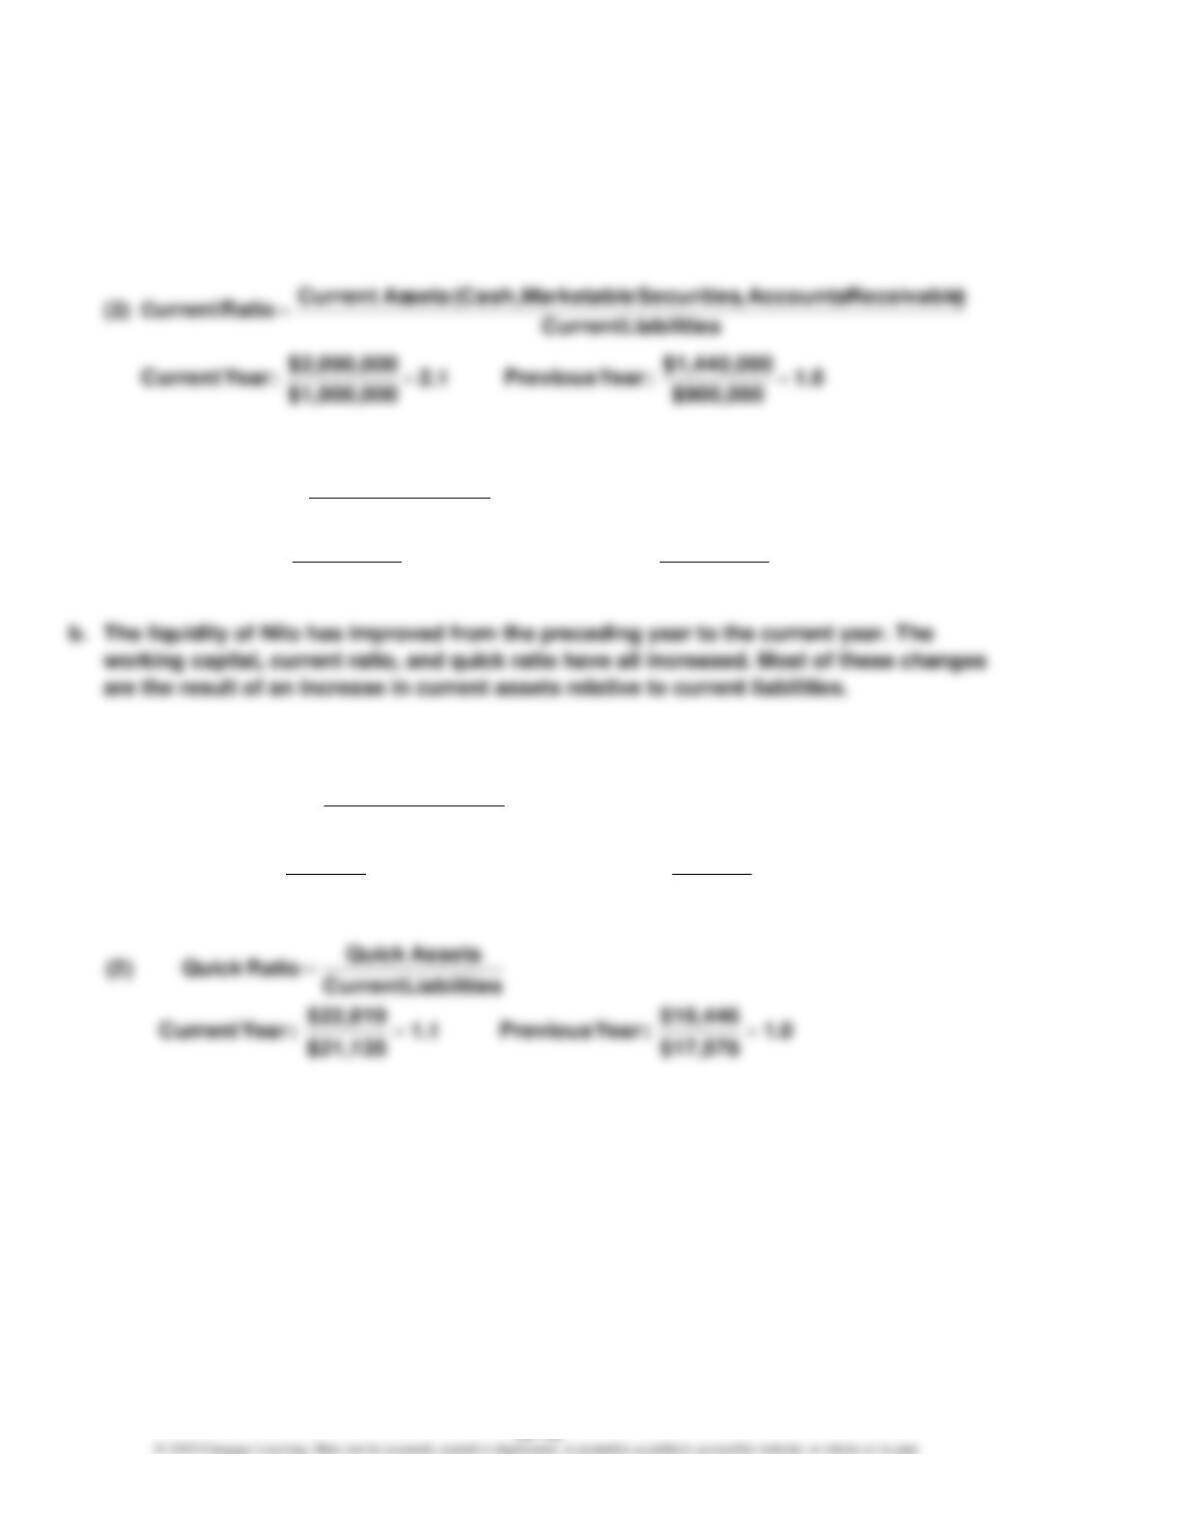
Ex. 16–7
a. (1)
b. The liquidity of PepsiCo has increased slightly over this time period. The current ratio
has remained stable at 1.3, and the quick ratio has increased by 0.1. PepsiCo appears to
have ample resources to meet its short-term obligations, and these resources have
remained constant during this time period.
1.2
$900,000
$1,080,000
:Year Previous1.5
$1,000,000
$1,540,000
:YearCurrent
sLiabilitieCurrent
AssetsQuick
Ratio Quick(3)
==
=
1.3
$17,578
$23,031
:Year Previous1.3
$21,135
$27,089
:YearCurrent
sLiabilitieCurrent
setsCurrent As
RatioCurrent
==
=
CHAPTER 16 Financial Statement Analysis
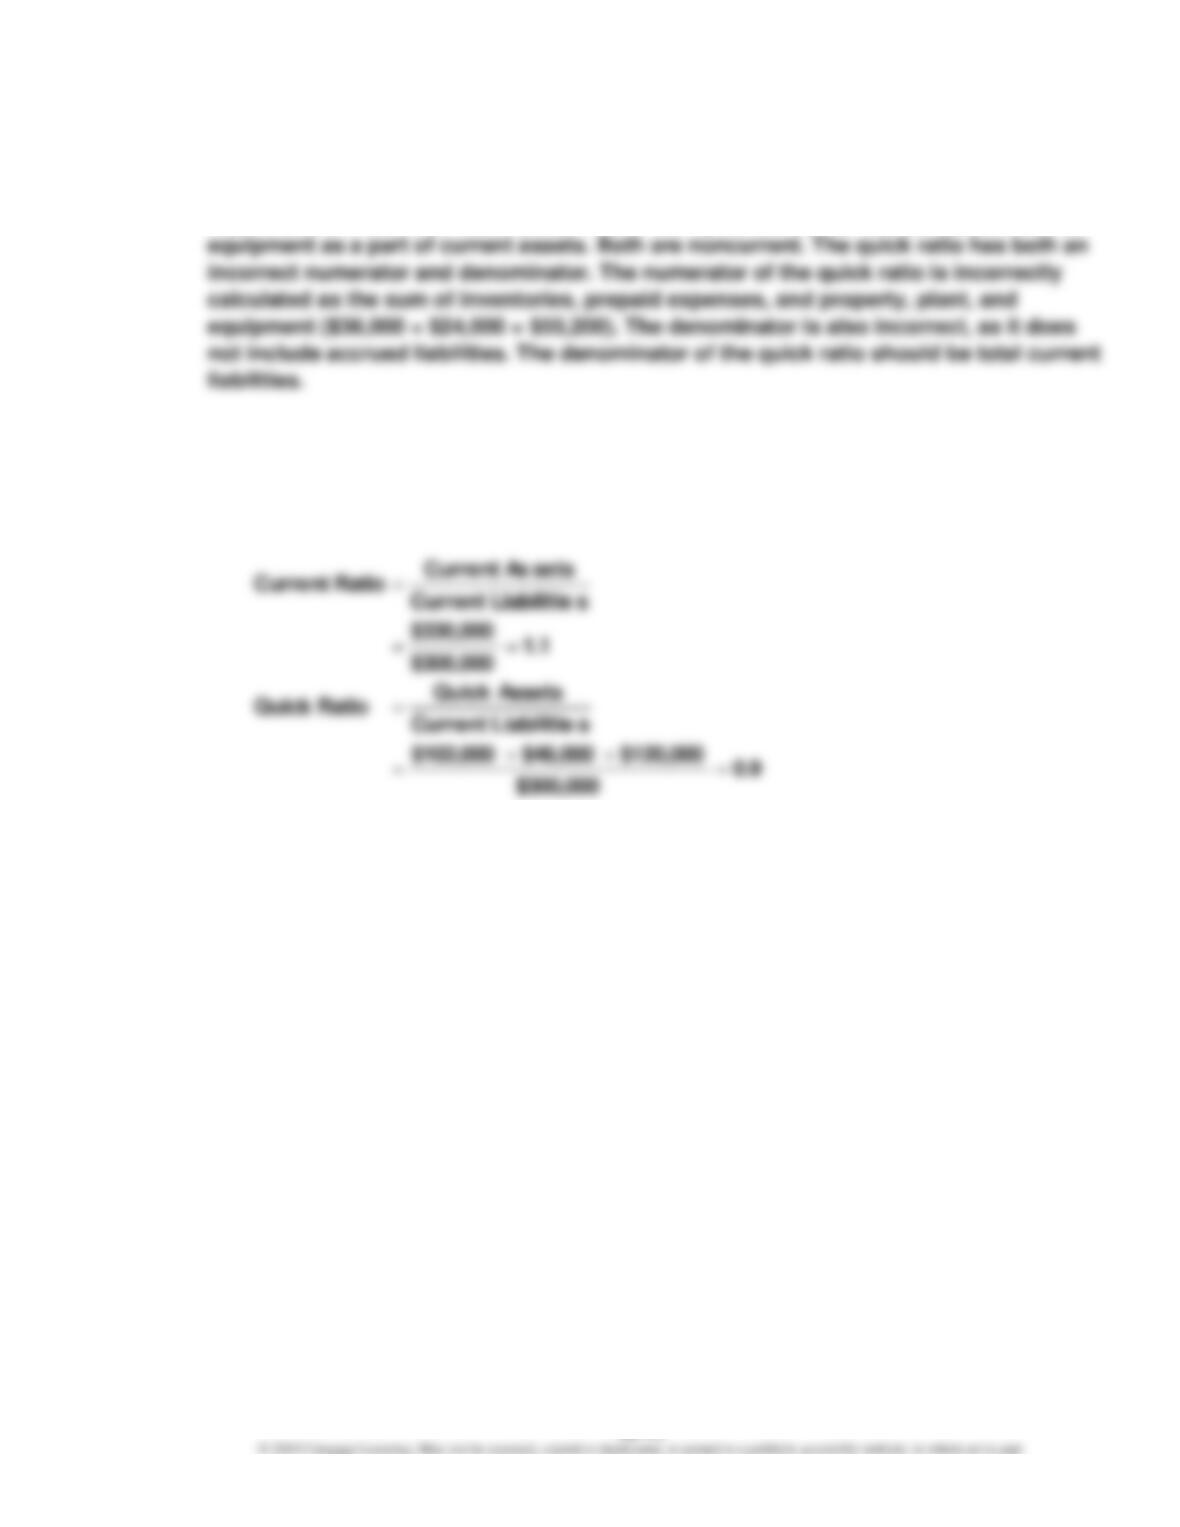
Ex. 16–8
a. The working capital, current ratio, and quick ratio are calculated incorrectly. The working
capital and current ratio incorrectly include intangible assets and property, plant, and
The correct calculations are as follows:
Working Capital = Current Assets – Current Liabilities
$30,000 = $330,000 – $300,000
b. Unfortunately, the working capital, current ratio, and quick ratio are below the minimum
threshold required by the bond indenture. This may require the company to renegotiate
the bond contract, including a possible unfavorable change in the interest rate.
CHAPTER 16 Financial Statement Analysis
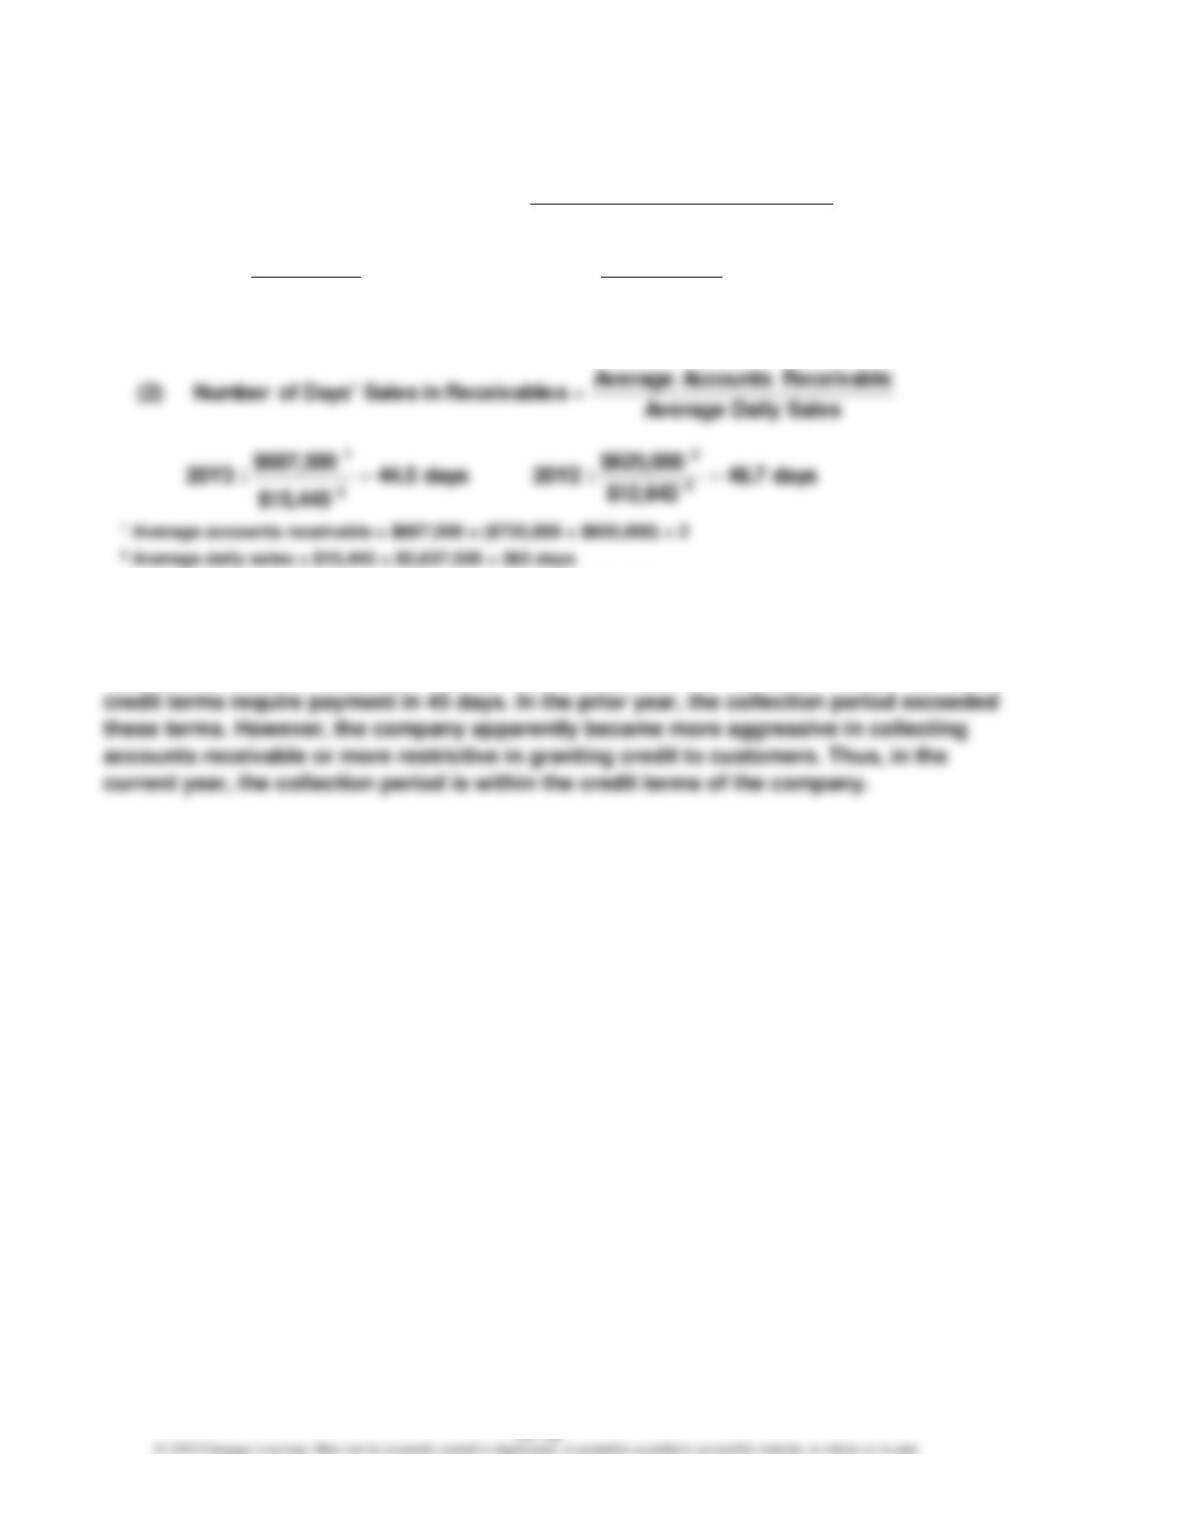
Ex. 16–9
a.
3 Average accounts receivable = $625,000 = ($650,000 + $600,000) ÷ 2
4 Average daily sales = $12,842 = $4,687,500 ÷ 365 days
b. The collection of accounts receivable has improved. This can be seen in both the
increase in accounts receivable turnover and the reduction in the collection period. The
7.5
**$625,00
0$4,687,500
:20Y28.2
*$687,500
$5,637,500
:20Y3
Receivable AccountsAverage
Sales
Turnover Receivable Accounts(1)
2 $600,000) ($650,000 $625,000 **2 $650,000) ($725,000 $687,500*
==
=
+=+=
CHAPTER 16 Financial Statement Analysis
Ex. 16–10
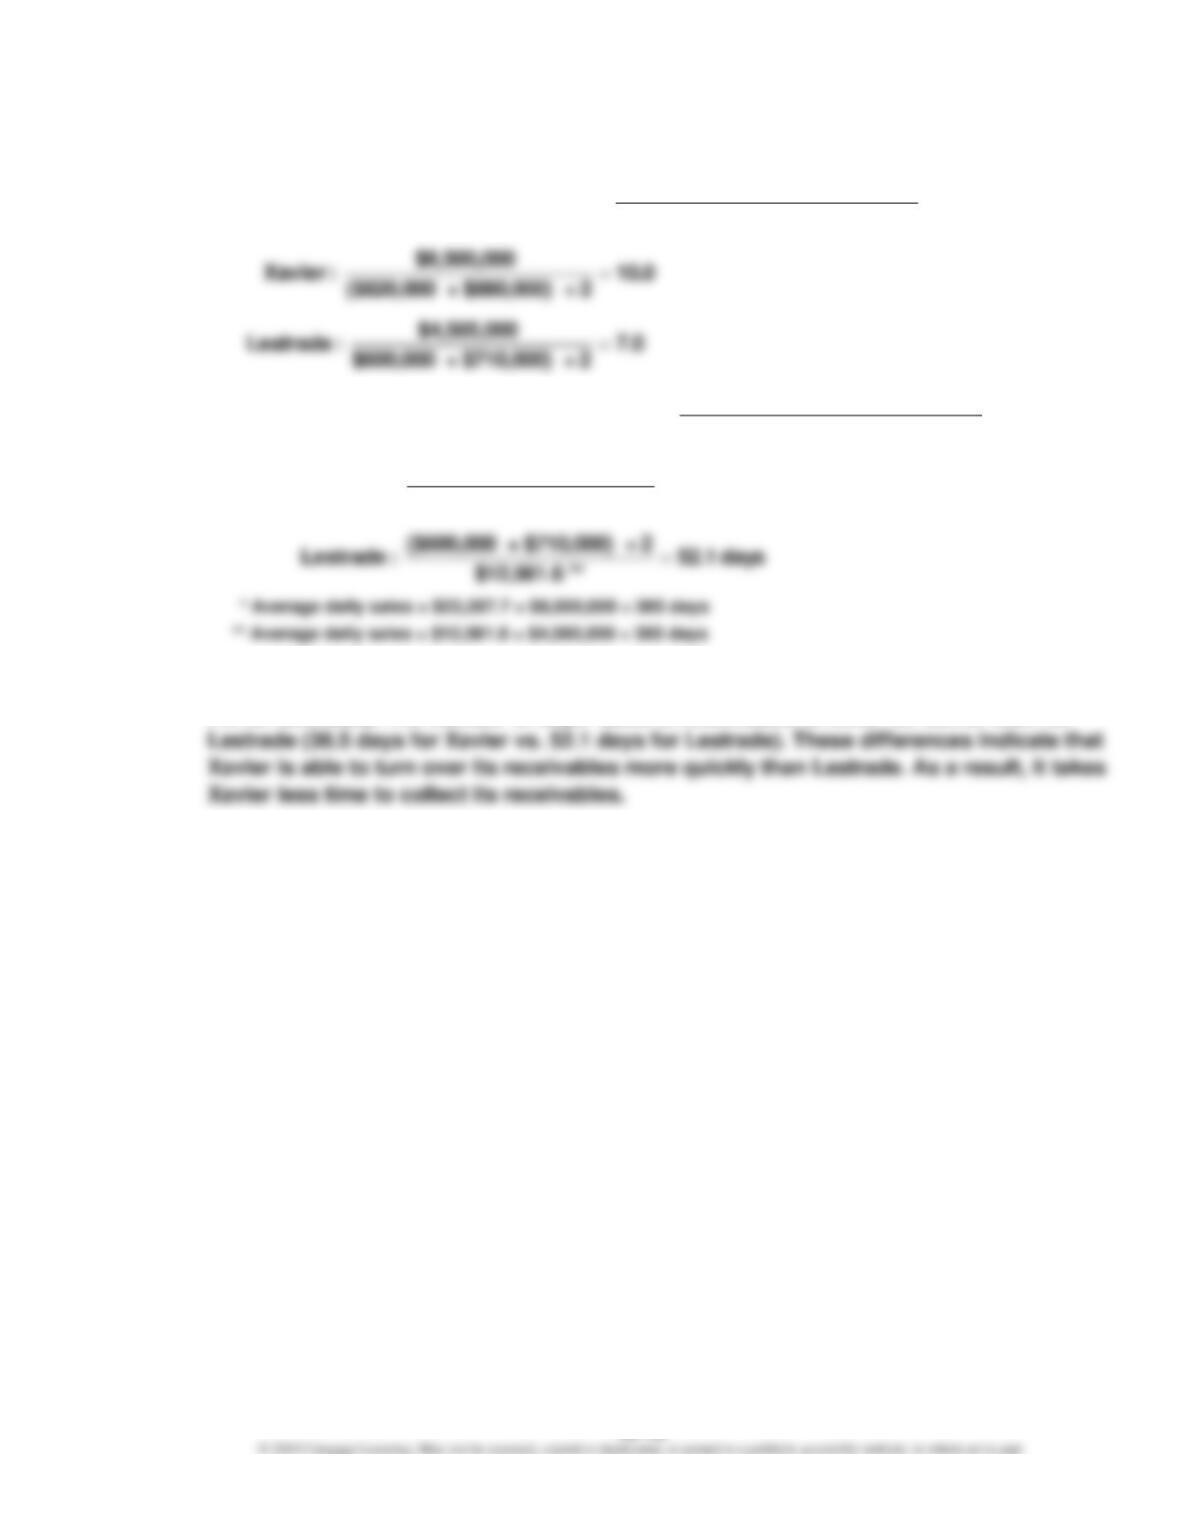
a.
b. Xavier’s accounts receivable turnover is much higher than Lestrade’s (10.0 for Xavier vs.
7.0 for Lestrade). The number of days’ sales in receivables is lower for Xavier than for
days 36.5
*$23,287.7
2 ÷ $880,000) + ($820,000
:Xavier
Sales Daily Average
Receivable AccountsAverage
=sReceivable in Sales Days’ of Number(2)
Receivable AccountsAverage
Sales
=Turnover Receivable Accounts(1)
=
CHAPTER 16 Financial Statement Analysis
Ex. 16–11
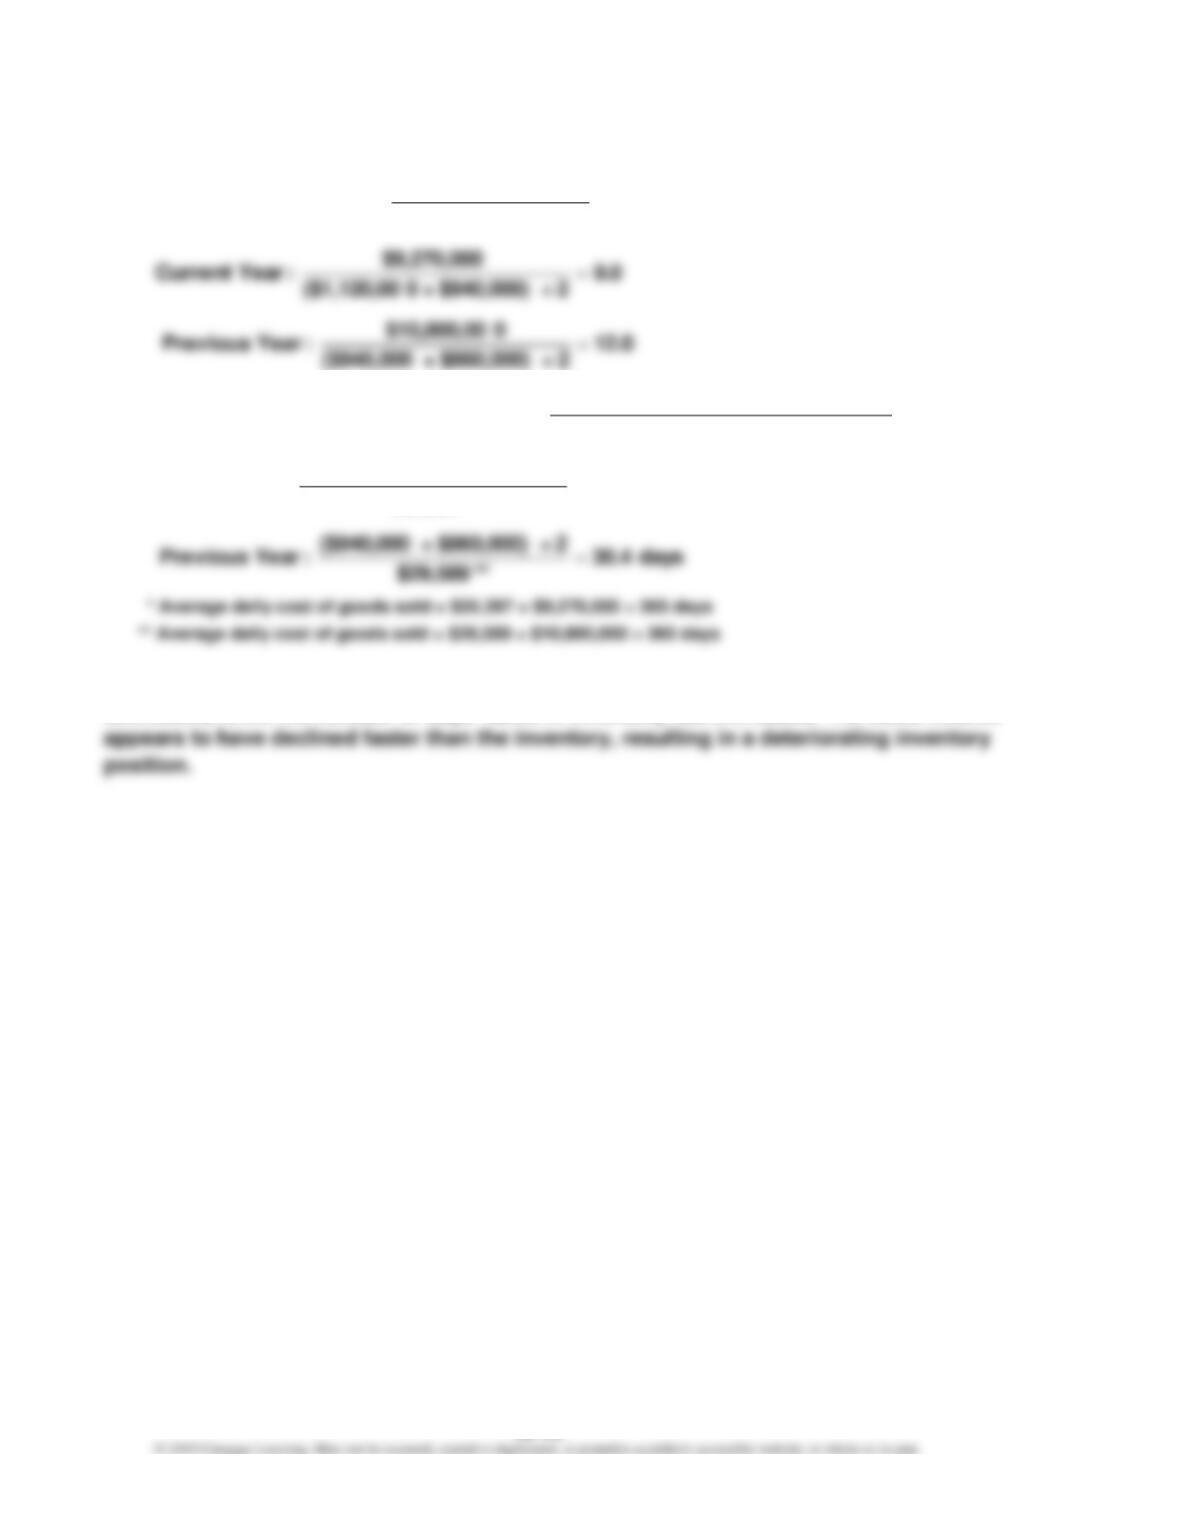
a.
b. The inventory position of the business has deteriorated. The inventory turnover has
decreased, while the number of days’ sales in inventory has increased. The sales volume
days 40.6
*$25,397
2 ÷ $940,000) + 0($1,120,00
:YearCurrent
Sold Goods ofCost Daily Average
Inventory Average
Inventory in Sales Days’ of Number(2)
InventoryAverage
Sold Goods ofCost
=Turnover Inventory(1)
=
=
CHAPTER 16 Financial Statement Analysis
Ex. 16–12
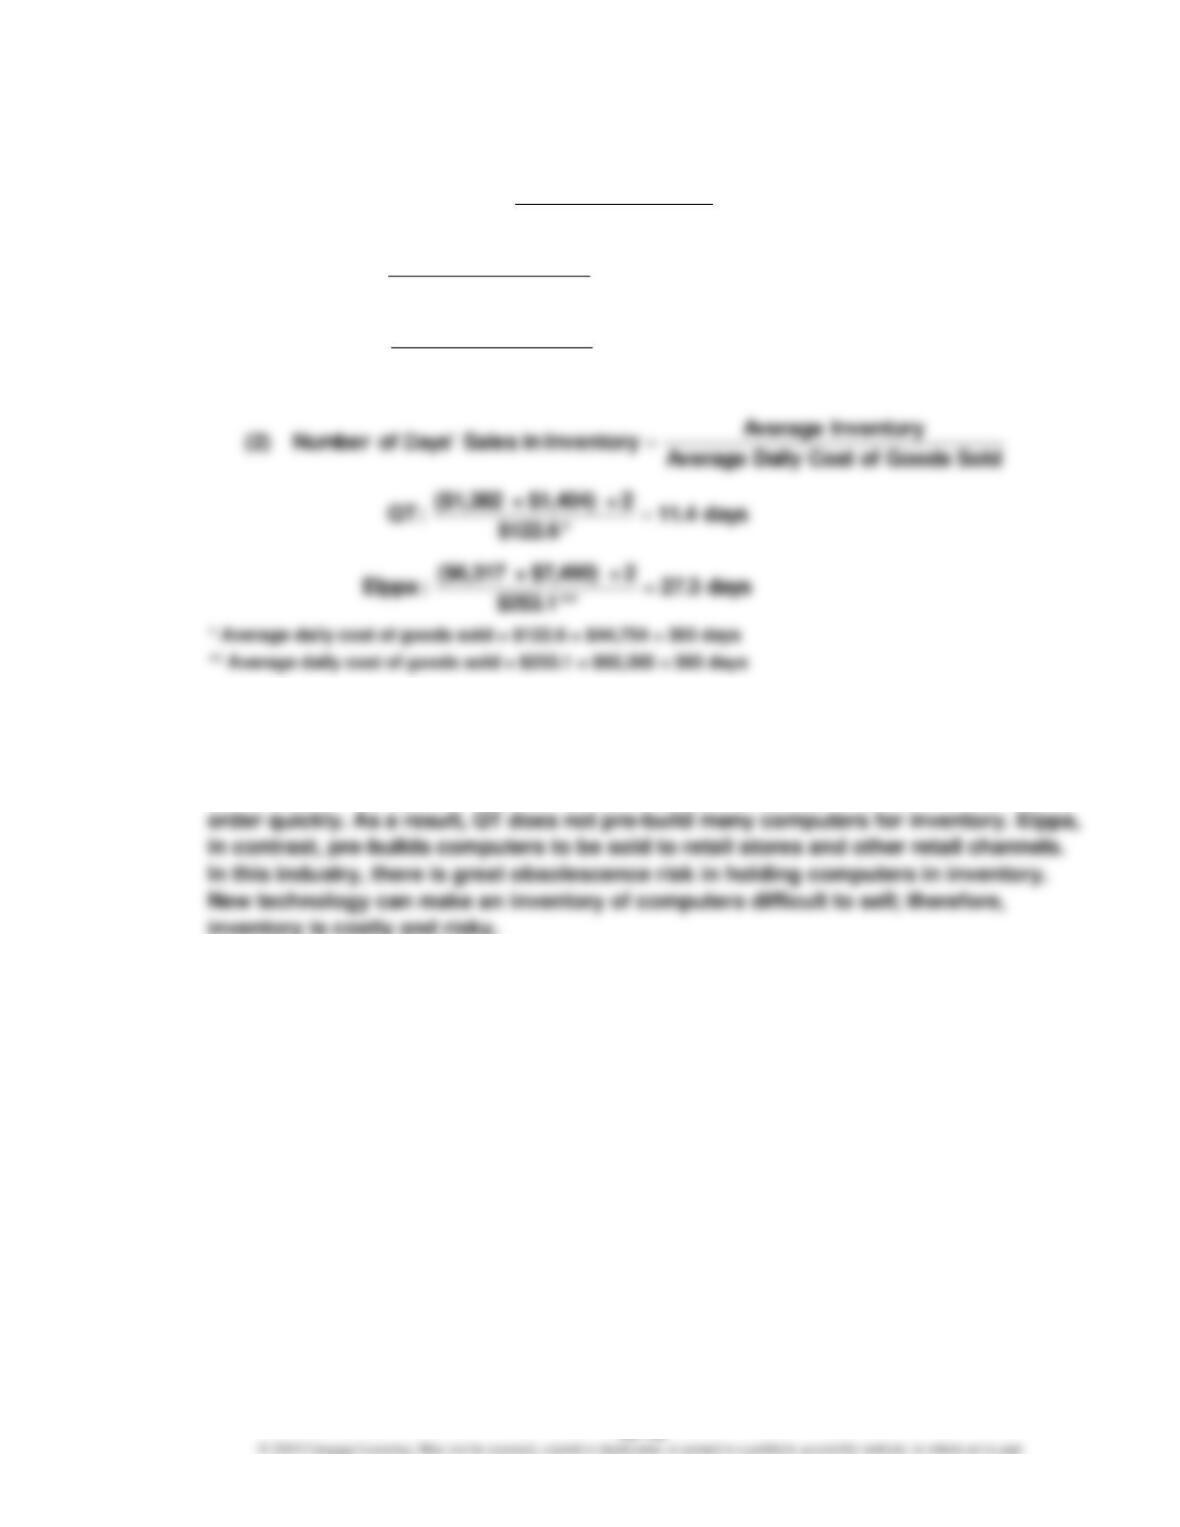
a.
b. QT has a much higher inventory turnover ratio than does Elppa (32.1 vs. 13.4).
Likewise, QT has a much smaller number of days’ sales in inventory (11.4 days vs.
27.3 days). These significant differences are a result of QT’s make-to-order strategy.
QT has successfully developed a manufacturing process that is able to fill a customer
13.4
2 ÷ $7,490) + ($6,317
$92,385
:Elppa
32.1
2 ÷ $1,404) + ($1,382
$44,754
:QT
InventoryAverage
Sold Goods ofCost
=Turnover Inventory(1)
=
=
CHAPTER 16 Financial Statement Analysis
Ex. 16–13
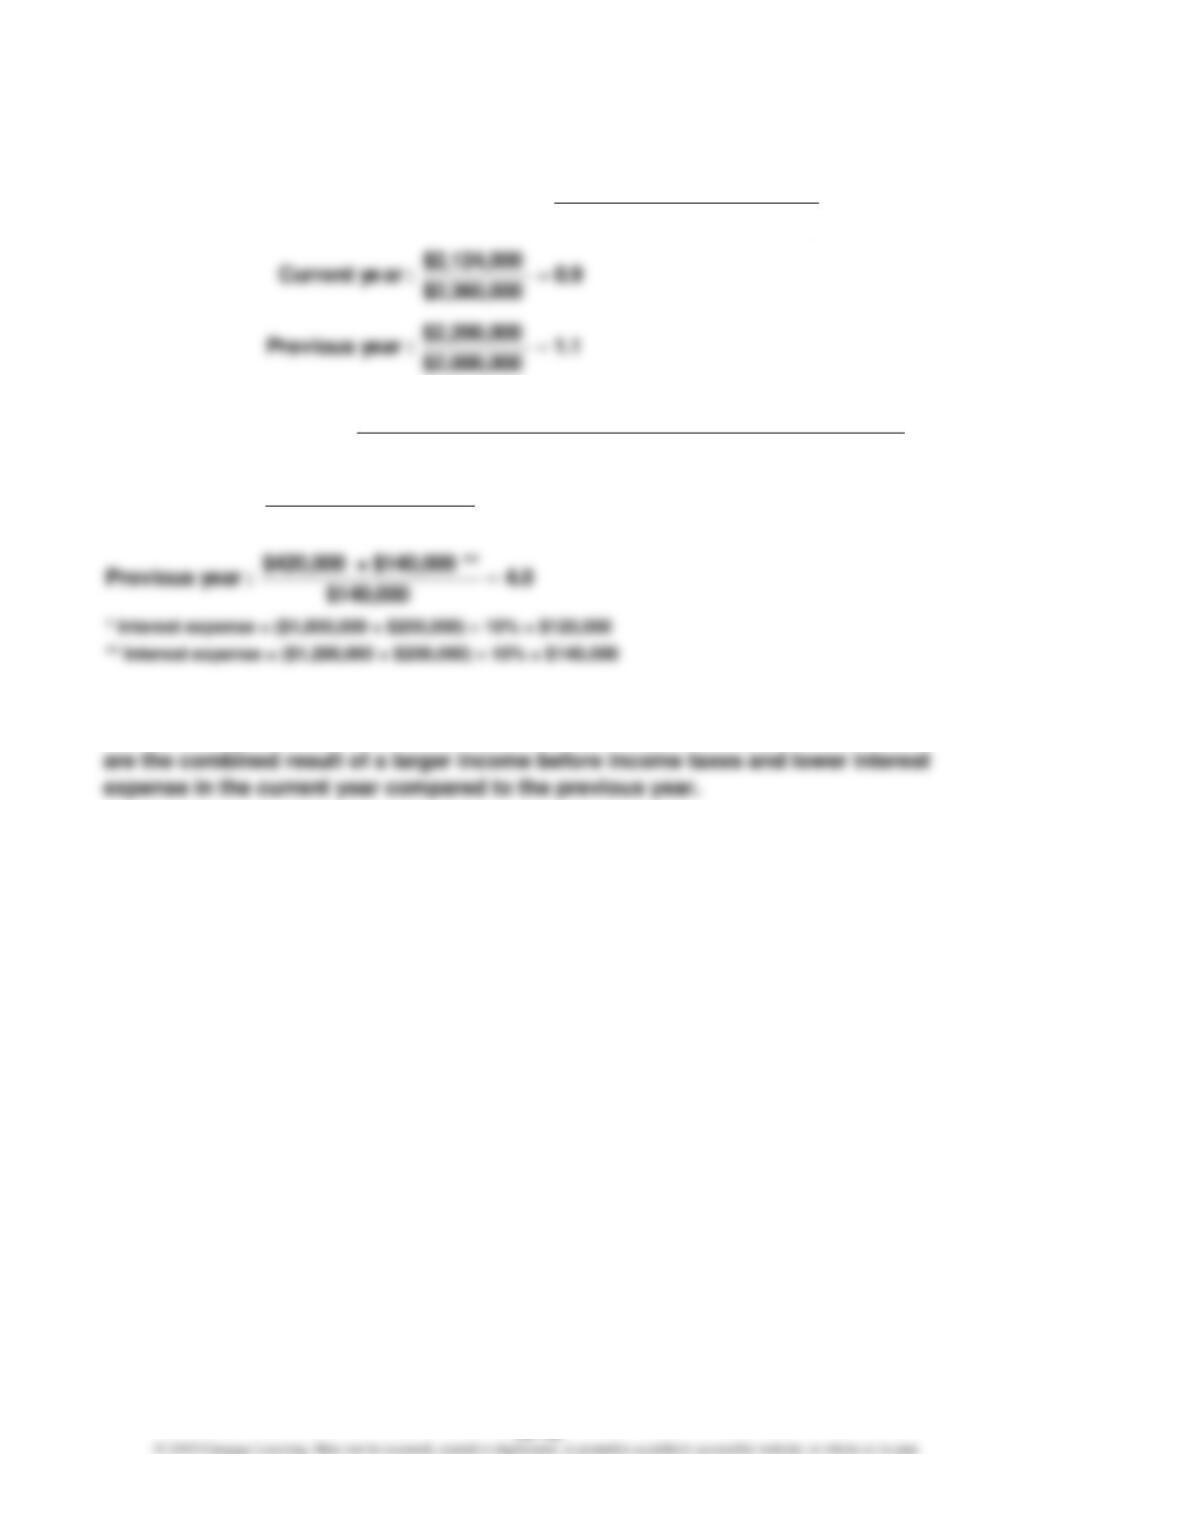
a.
b.
c. Both the ratio of liabilities to stockholders’ equity and the number of times bond
interest charges were earned have improved from the previous year. These results
Equity rs’Stockholde Total
sLiabilitie Total
=Equity rs’Stockholde to sLiabilitie of Ratio
5.0
$120,000
*$120,000 + $480,000
:arCurrent ye
ExpenseInterest
ExpenseInterest + Expense Tax Income Before Income
=EarnedInterest Times
=
CHAPTER 16 Financial Statement Analysis
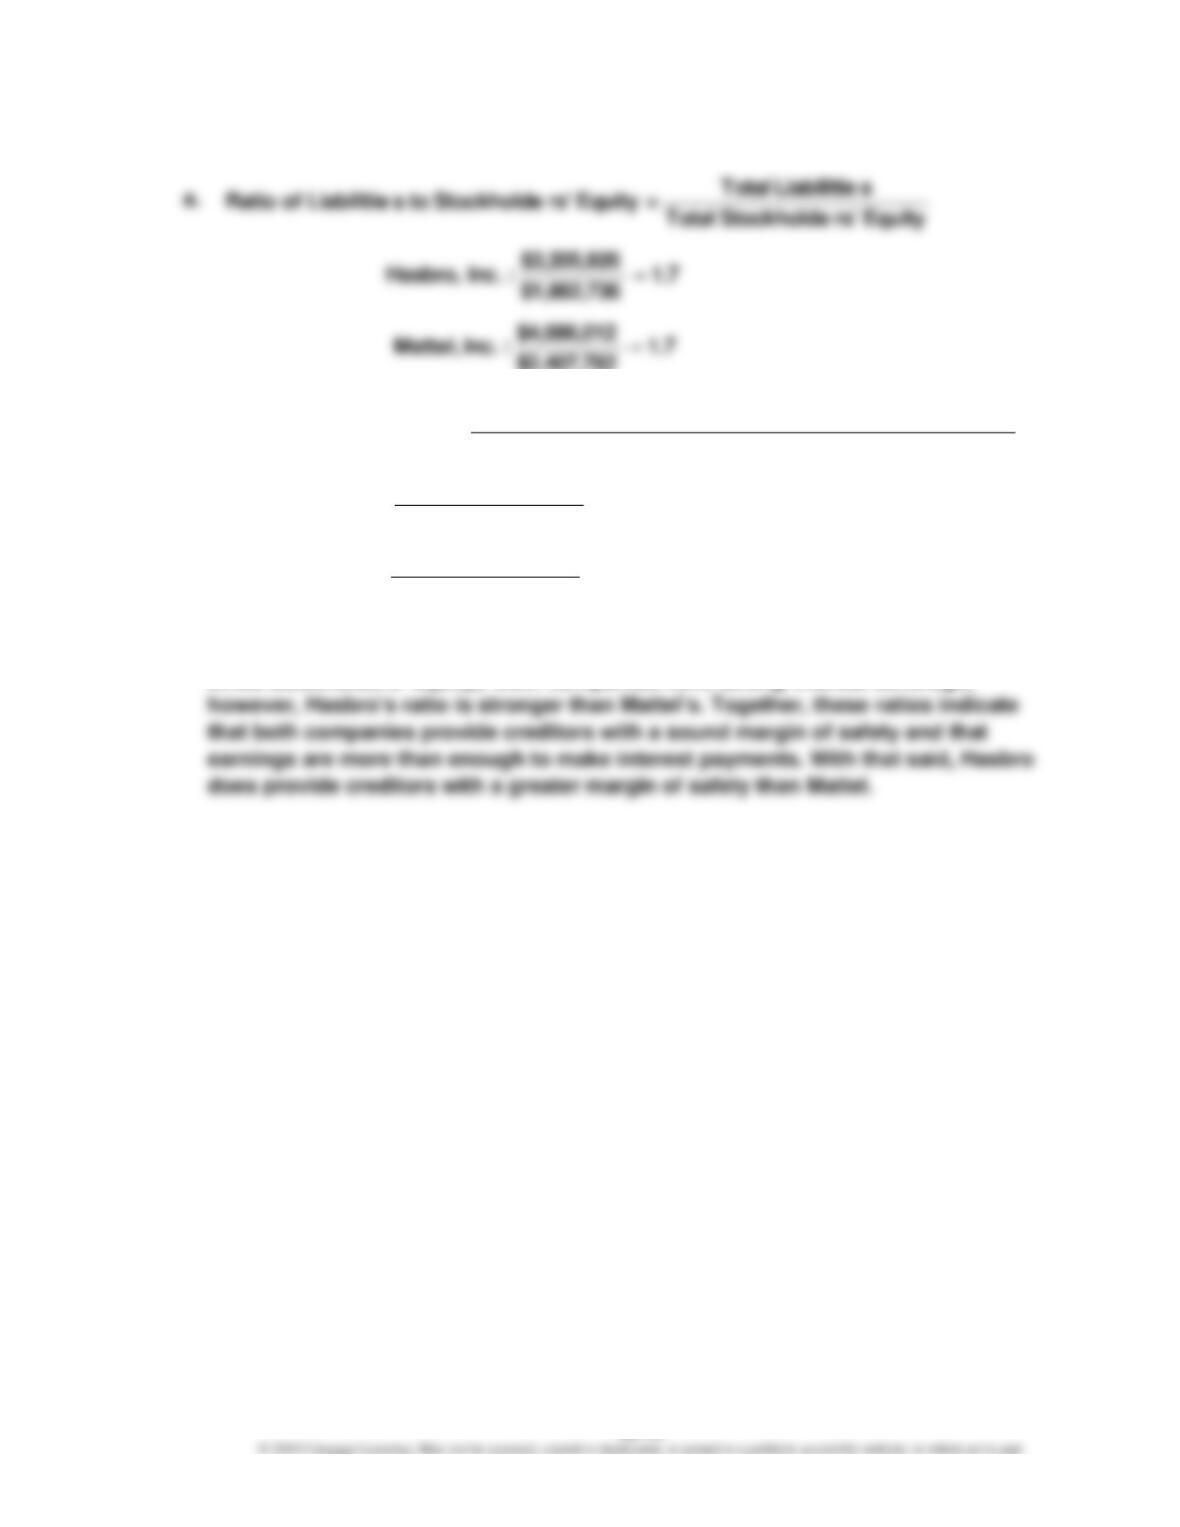
Ex. 16–14
b.
c. Hasbro carries the same proportion of debt to stockholders’ equity as Mattel (1.7
$2,407,782
5.3
$95,118
$95,118 + $409,472
:Inc. Mattel,
8.1
$97,405
$97,405 + $692,489
:Inc. Hasbro,
ExpenseInterest
ExpenseInterest + Expense Tax Income Before Income
=EarnedInterest Times
=
=
CHAPTER 16 Financial Statement Analysis
Ex. 16–15
a.
b.
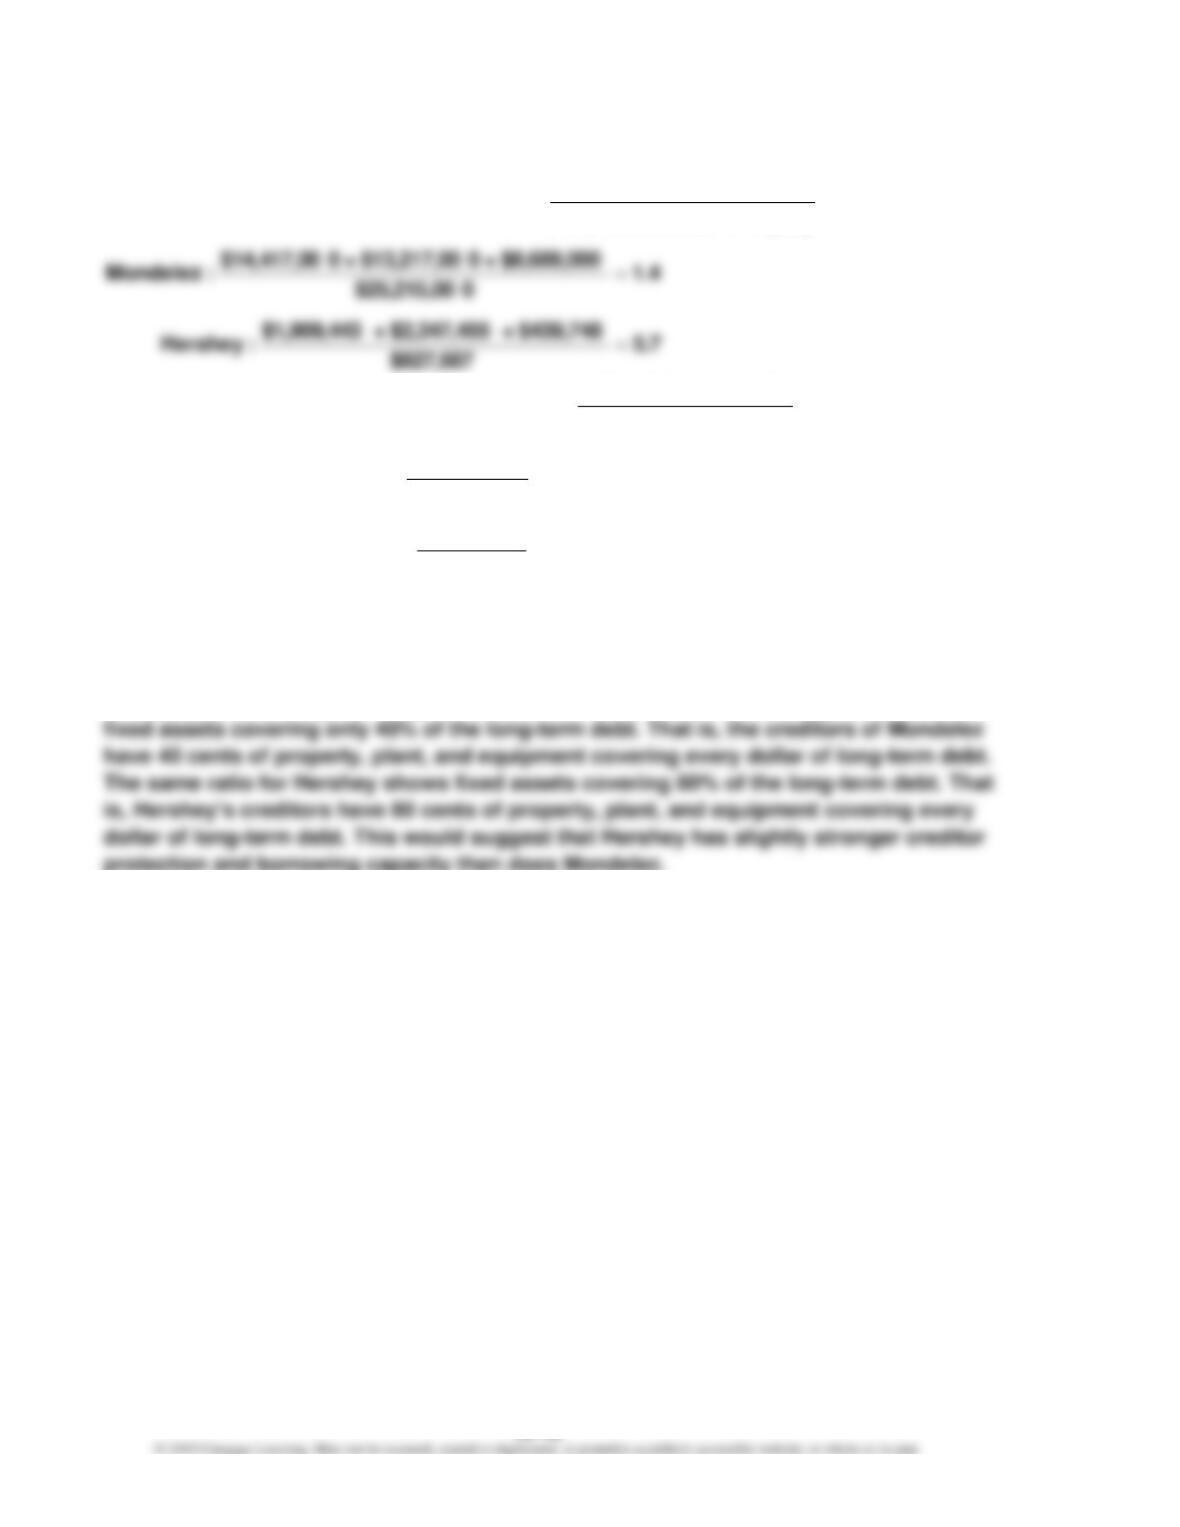
c. Hershey’s total liabilities to stockholders’ equity ratio is higher than Mondelez’s (5.7 vs.
1.4), meaning Hershey uses more debt than Mondelez. Mondelez has a lower ratio of
fixed assets to long-term liabilities than Hershey. This ratio divides the property, plant,
and equipment (net) by the long-term debt. The ratio for Mondelez is aggressive, with
Equity rs’Stockholde Total
sLiabilitie Total
Equity rs’Stockholde to sLiabilitie of Ratio
=
0.8
$2,787,203
$2,177,248
:Hershey
0.4
0$21,906,00
$8,229,000
:Mondelez
sLiabilitie Term–Long
(net) AssetsFixed
sLiabilitie Term–Long to AssetsFixed of Ratio
=
=
=
CHAPTER 16 Financial Statement Analysis
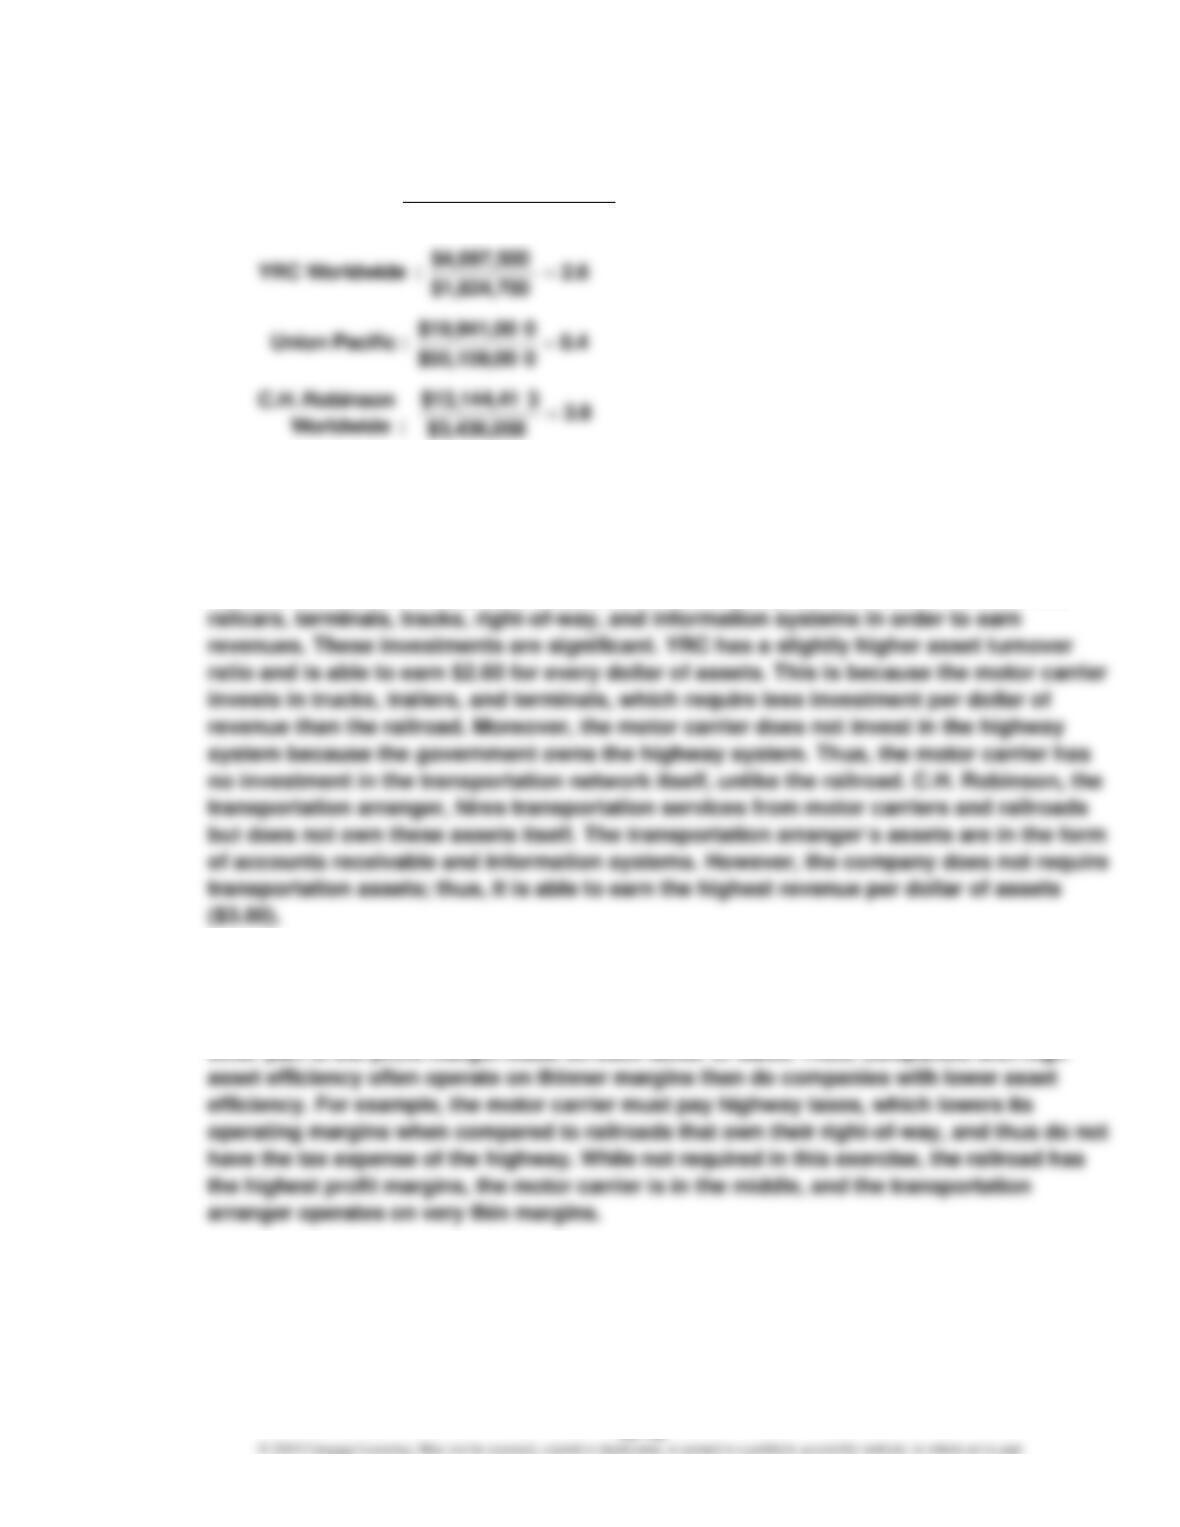
Ex. 16–16
a.
b. The asset turnover ratio measures the number of sales dollars earned for each dollar of
assets. The greater the number of sales dollars earned for every dollar of assets, the
more efficient a firm is in using assets. Thus, the ratio is a measure of each company’s
asset efficiency. Union Pacific earns only 40 cents for every dollar of assets. This is
because railroads are very asset intensive. The company must invest in locomotives,
Note to Instructors: Students may wonder how asset-intensive companies overcome their
asset efficiency disadvantages to competitors with better asset efficiencies, as in the case
between railroads and motor carriers. Asset efficiency is part of the financial equation; the
AssetsTotal Average
Sales
TurnoverAsset
=
CHAPTER 16 Financial Statement Analysis
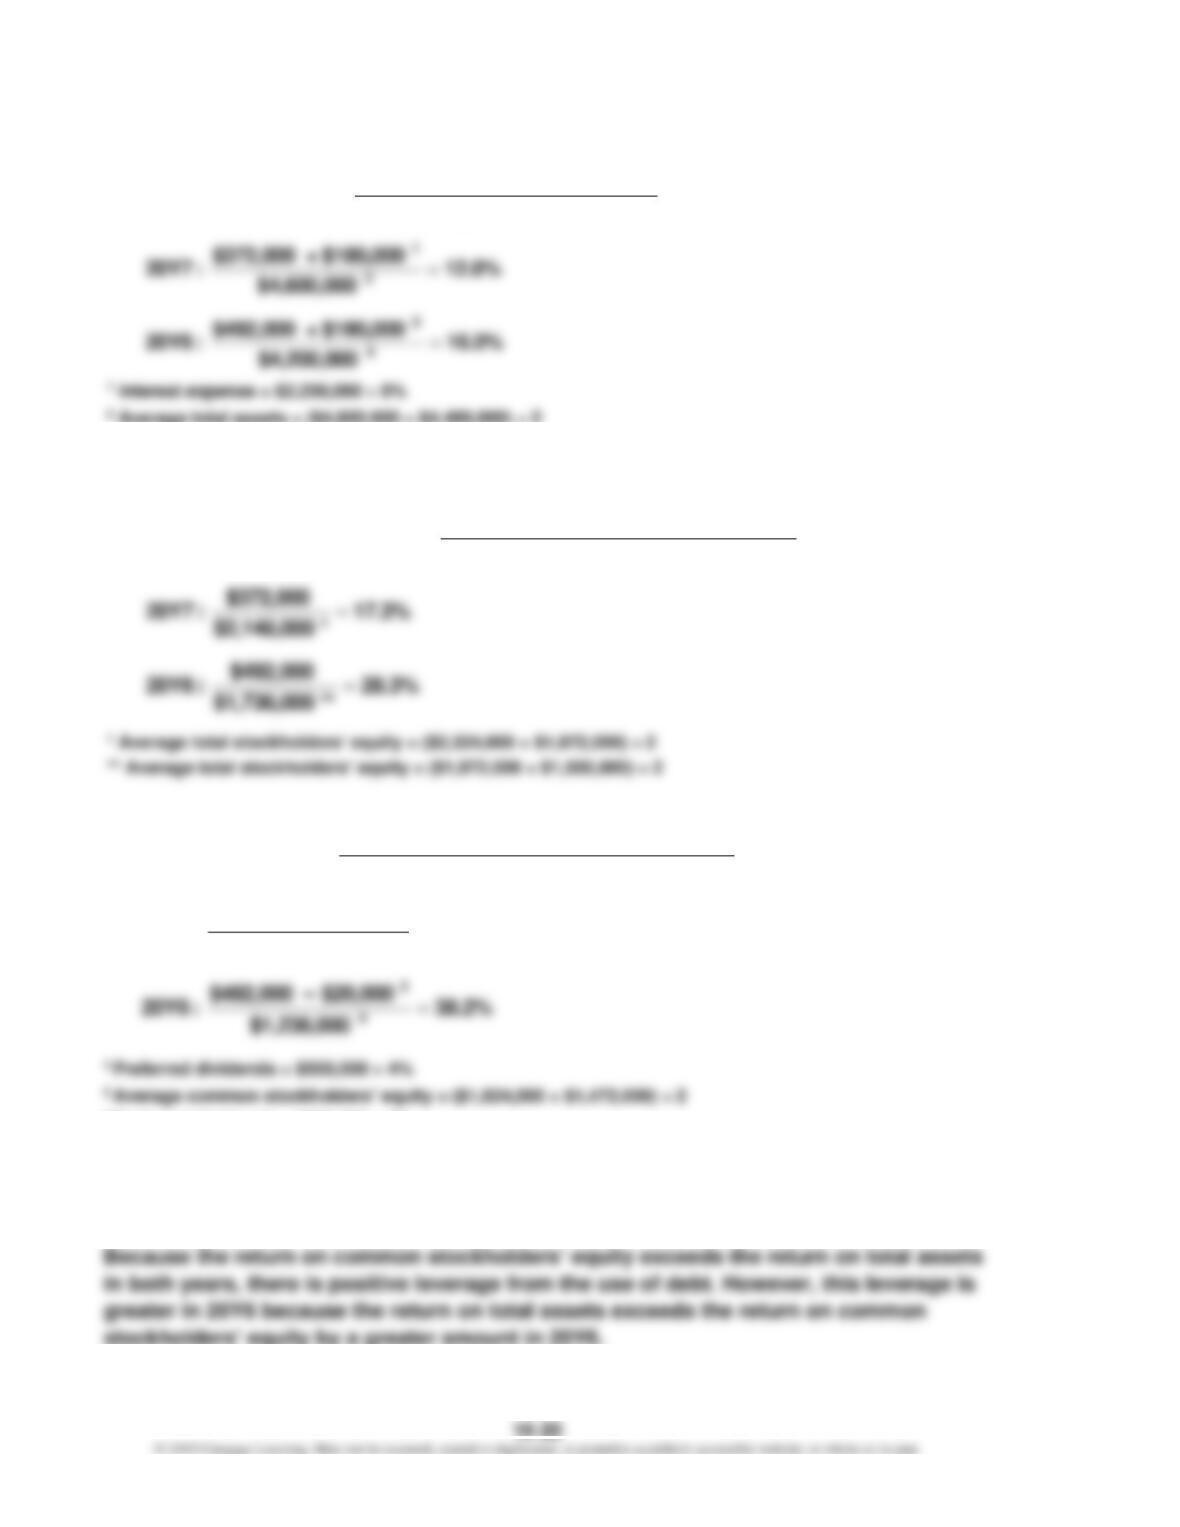
Ex. 16–17
a.
3 Interest expense = $2,250,000 8%
4 Average total assets = ($4,400,000 + $4,000,000) ÷ 2
3 Preferred dividends = $500,000 4%
4 Average common stockholders’ equity = ($1,472,000 + $1,000,000) ÷ 2
b. The profitability ratios indicate that the company’s profitability has deteriorated. Most of
this change is from net income falling from $492,000 in 20Y6 to $372,000 in 20Y7.
AssetsTotal Average
ExpenseInterest + IncomeNet
AssetsTotal on Return
=
Equity rs’Stockholde Total Average
IncomeNet
Equity rs’Stockholde on Return
=
21.4%
$1,648,000
$20,000 – $372,000
:20Y7
Equity rs’Stockholde Common Average
Dividends Preferred – IncomeNet
Equity rs’Stockholde
Common on Return
2
1
=
=