CHAPTER 27 Cost Management for Just-in-Time Environments
Prob. 27–4A (FIN MAN); Prob. 12–4A (MAN) (Concluded)
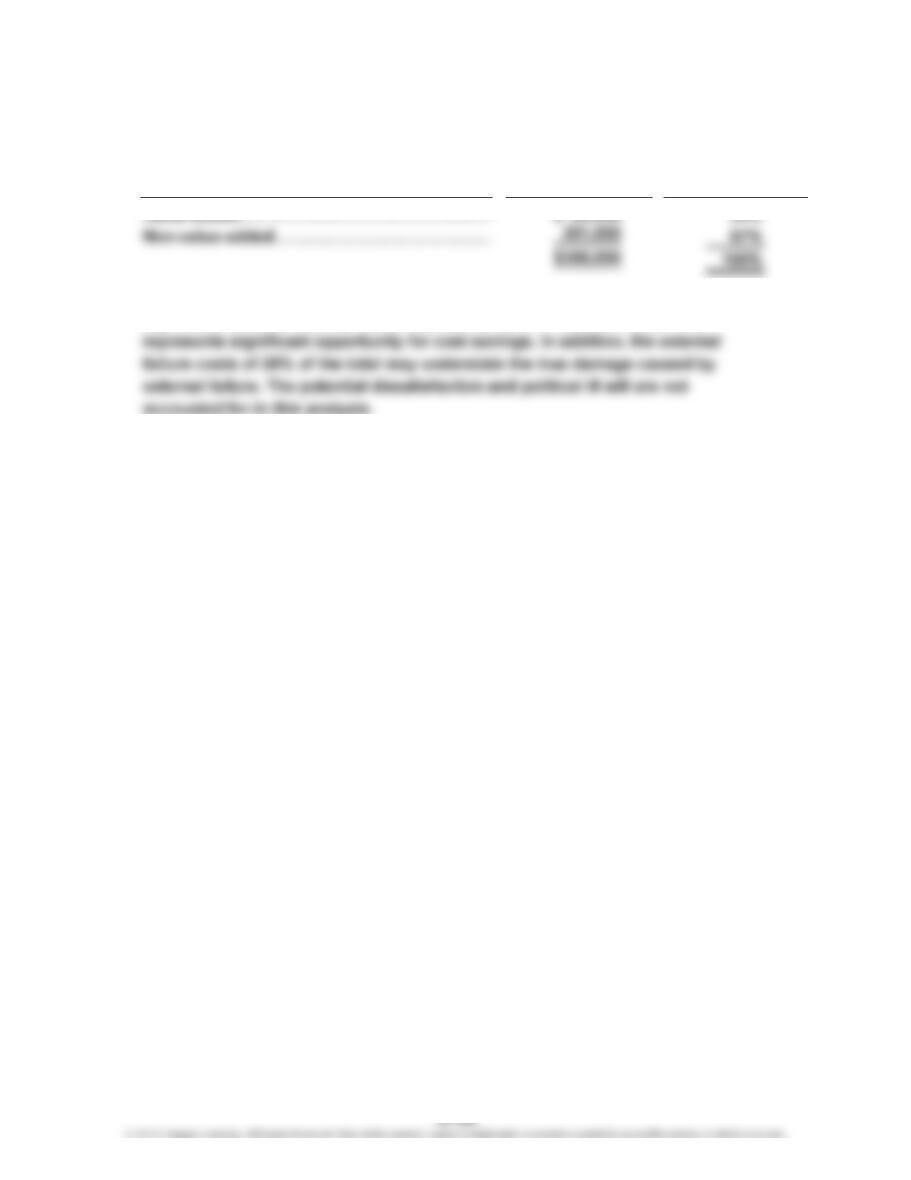
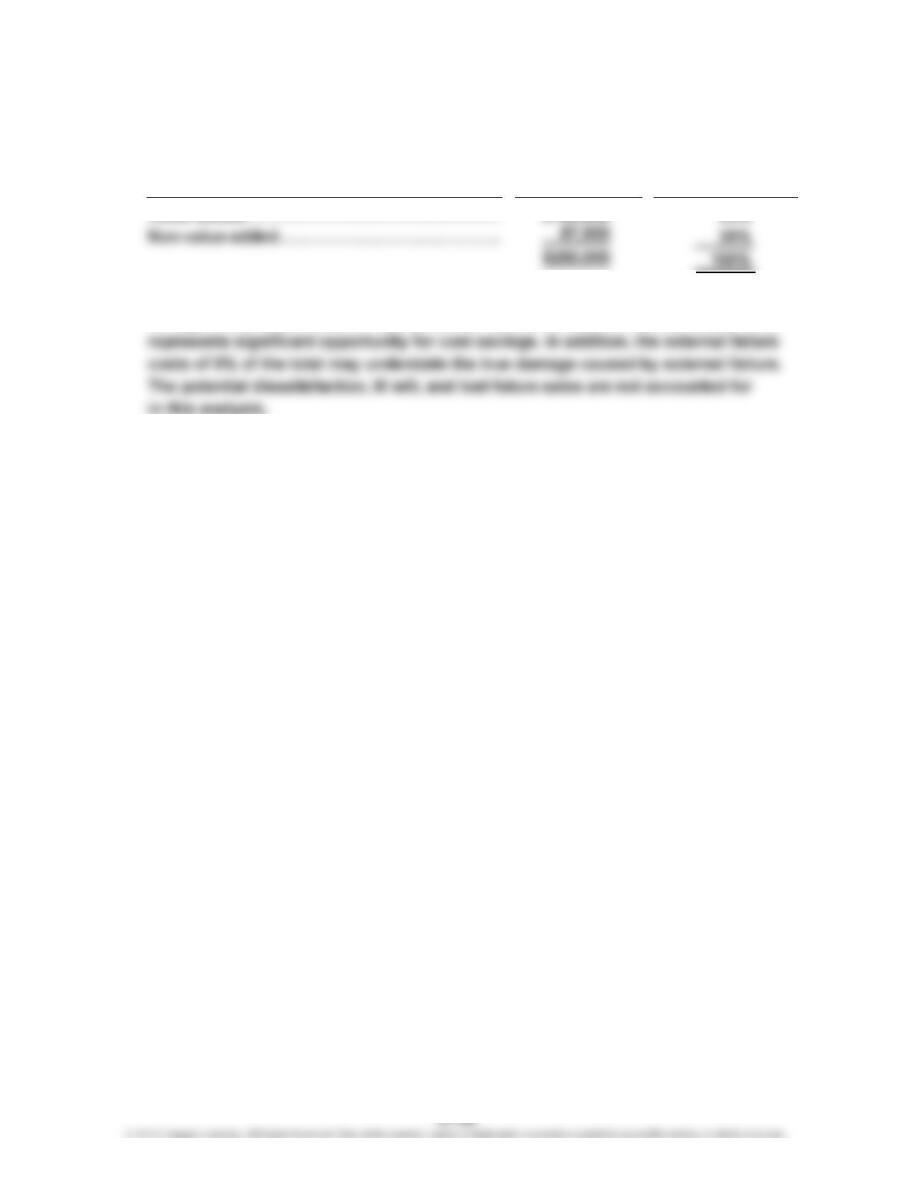
3. Percentages of total activity cost that are value- and non-value-added:
4. The department has 67% of its total costs as non-value-added. This is a very
significant amount. Internal failure represents 39% of the total costs. This
Percent of Total
Department Cost
Activity
Cost
CHAPTER 27 Cost Management for Just-in-Time Environments
Prob. 27–1B (FIN MAN); Prob. 12–1B (MAN)
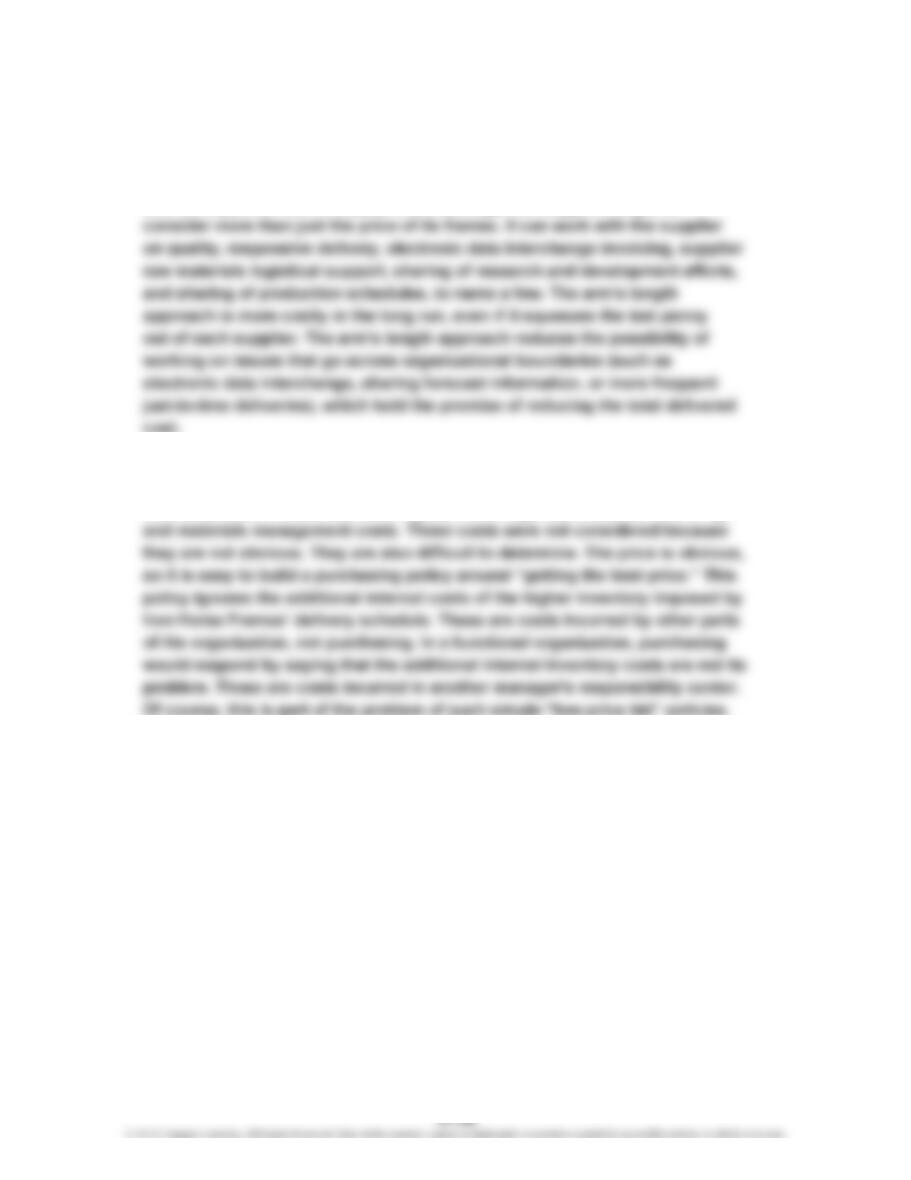
1. HD Hogg’s purchasing policy is very short-sighted. It does not involve
developing partnerships with suppliers. HD Hogg should consider changing
its arm’s length policy and work on building a long-term supply chain strategy
with its suppliers. With a supply chain strategy, HD Hogg can begin to
2. The hidden costs beyond the price include the costs associated with the
higher inventory required by Iron Horse Frames’ delivery schedule. These
inventory costs include additional space, handling, obsolescence, financing,
CHAPTER 27 Cost Management for Just-in-Time Environments
Prob. 27–1B (FIN MAN); Prob. 12–1B (MAN) (Concluded)
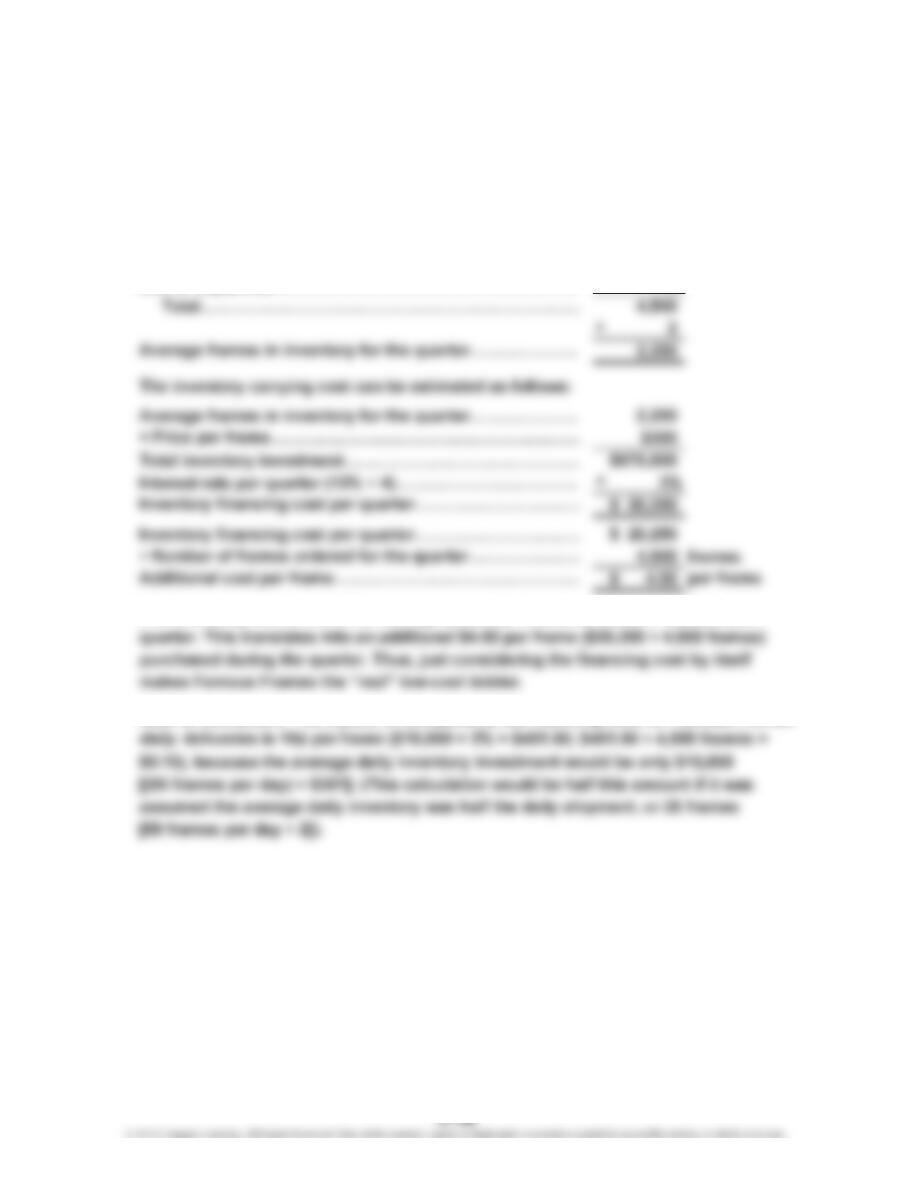
3. If the financing costs are 12%, then the additional cost of the inventory could be
determined as follows:
At the beginning of July, the new shipment of 4,500 frames arrives. Assuming that
the frame supply runs out by the end of the quarter, the average inventory for the
quarter is:
Beginning of July………………………………………………… 4,500
End of September………………………………………………
…
0
The financing cost is 3% of the average quarterly inventory value, or $20,250 per
Note to Instructors: As a point of comparison, the financing cost for Famous Frames’
…
…
CHAPTER 27 Cost Management for Just-in-Time Environments
Prob. 27–2B (FIN MAN); Prob. 12–2B (MAN)
1. Value-added time:
Stamping……………………………………………………………
…
5 min.
Non-value-added time:
Wait time:
Within-batch wait time—stamping (39 × 5 min.)……………
…
195 min.
…
Move time:
Move from stamping to final assembly………………………
…
10 min.
…
2. The existing process is very wasteful. The company could improve the process
by changing the layout from a process orientation to a product orientation. Each
appliance model could be formed into a production cell. Each cell would have
…
…
CHAPTER 27 Cost Management for Just-in-Time Environments
Prob. 27–3B (FIN MAN); Prob. 12–3B (MAN)
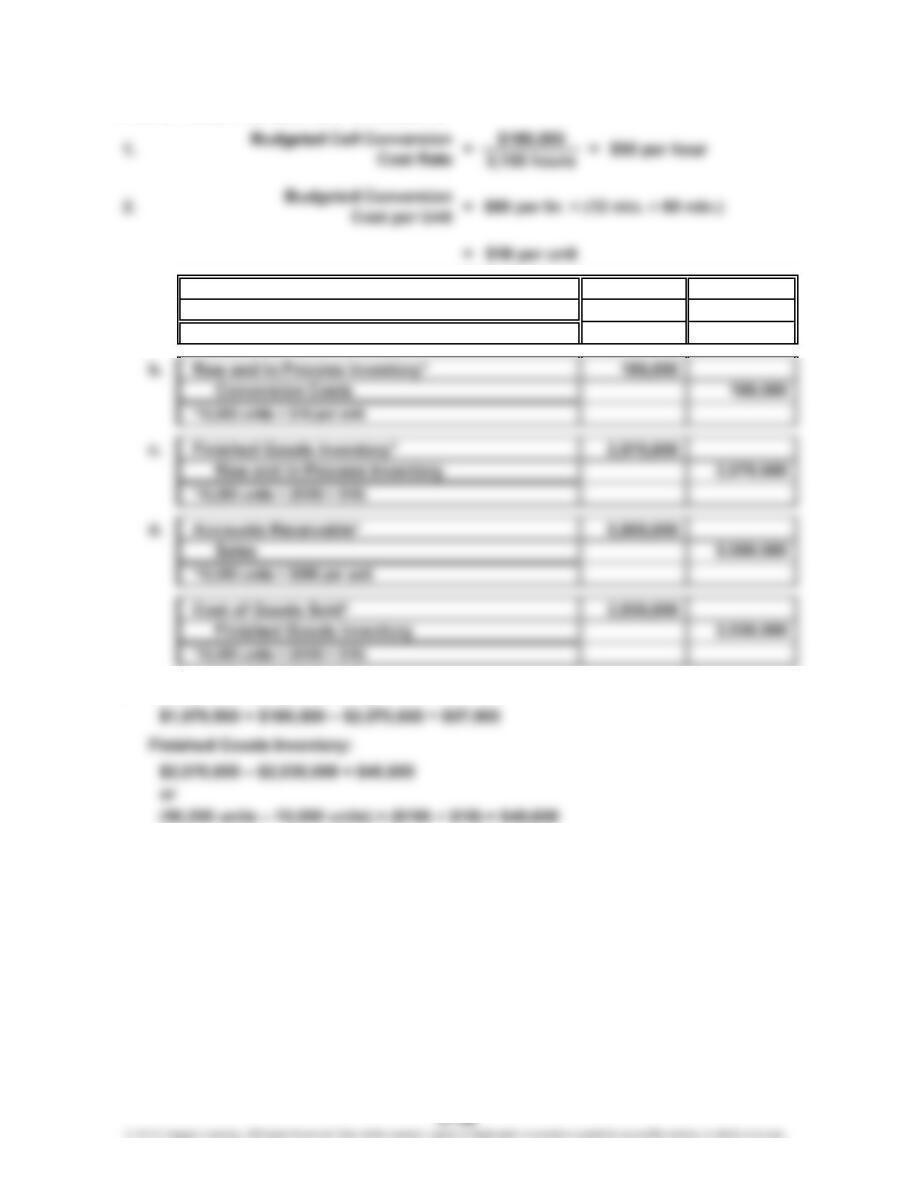
3. a. Raw and In Process Inventory*
Accounts Payable 1,979,500
*10,700 units × $185 per unit
4. Raw and In Process Inventory:
1,979,500
CHAPTER 27 Cost Management for Just-in-Time Environments
Prob. 27–3B (FIN MAN); Prob. 12–3B (MAN) (Concluded)
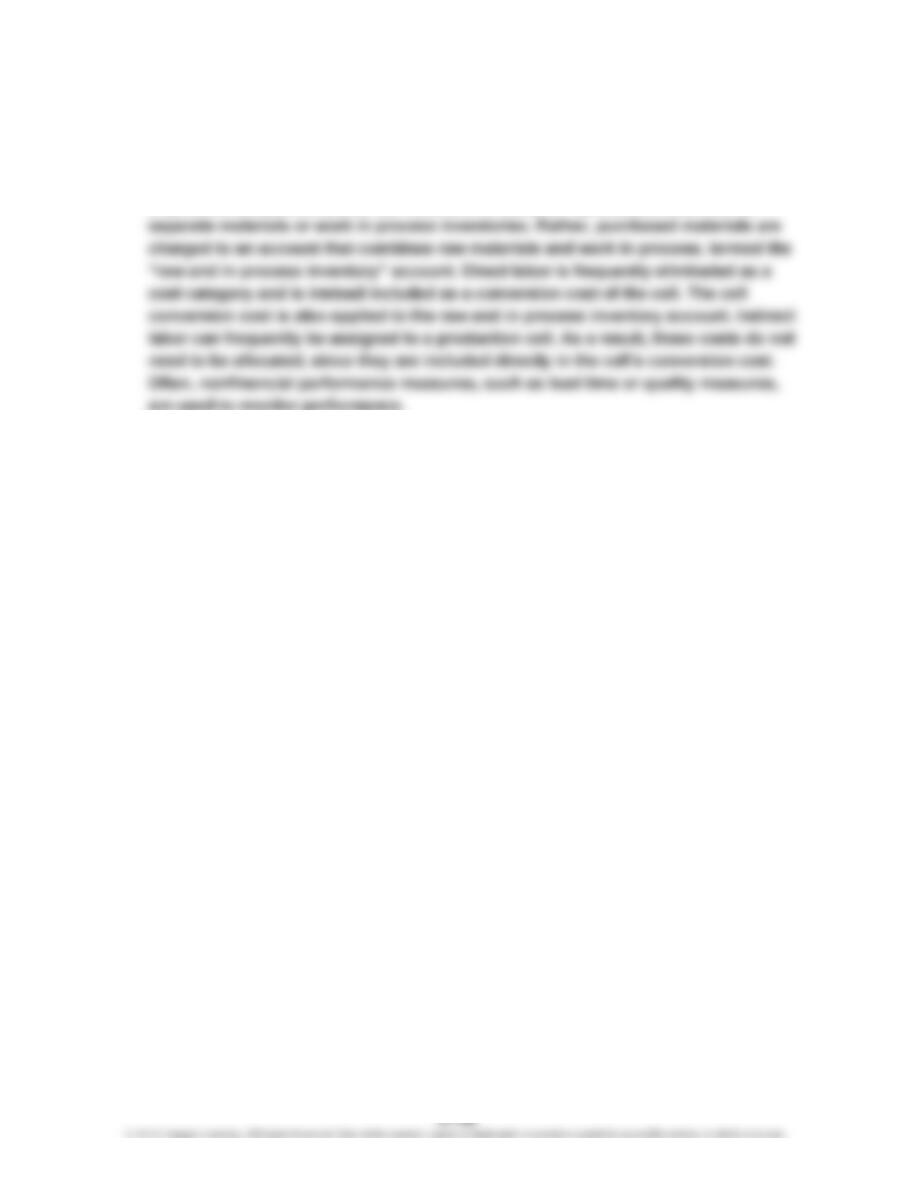
5. JIT accounting is different from traditional accounting in a number of respects. Most
importantly, JIT accounting is simplified and uses minimal control. As a result, the
number of transactions is reduced, and the control intervals between adjacent work
in process transaction points are widened. In many JIT operations, there are no
CHAPTER 27 Cost Management for Just-in-Time Environments
Prob. 27–4B (FIN MAN); Prob. 12–4B (MAN)
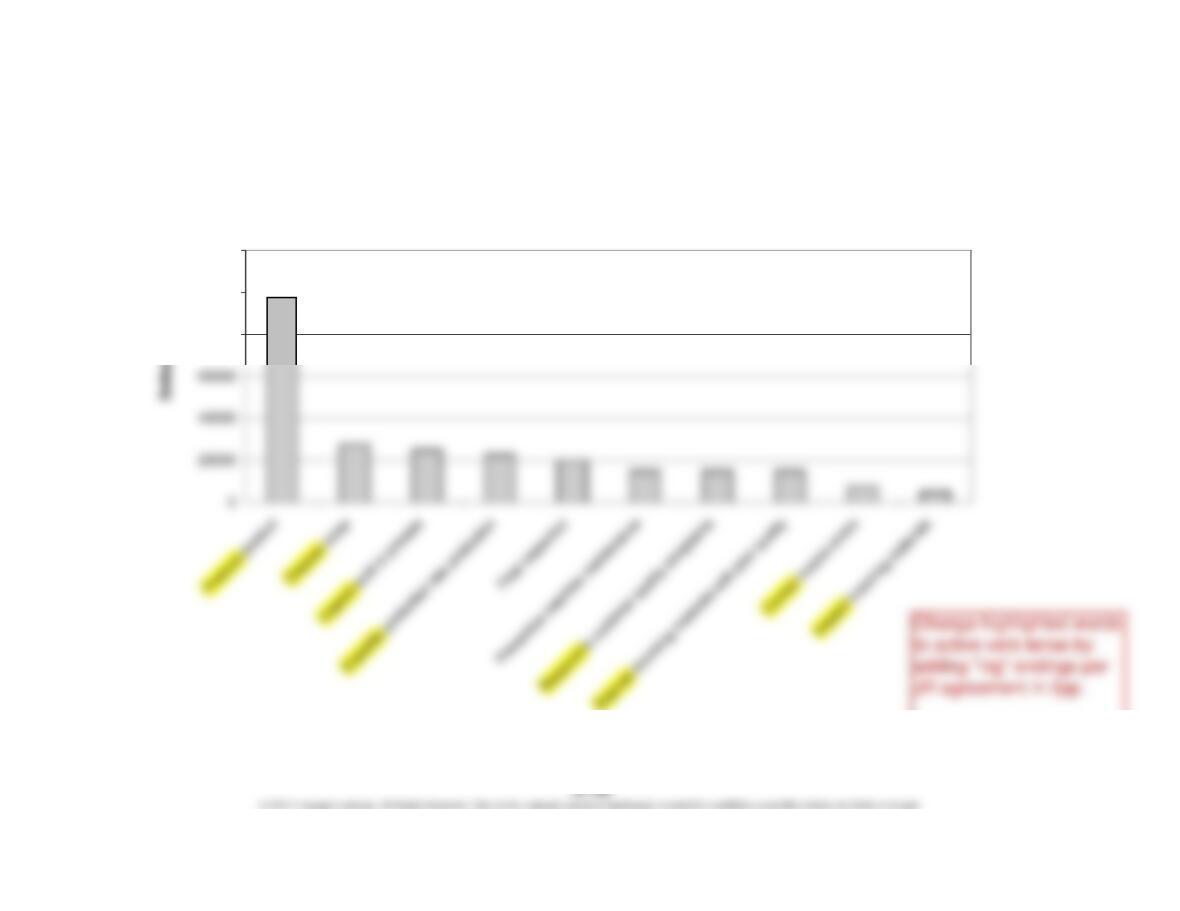
1.
Pareto Chart of Activities
80000
100000
120000
CHAPTER 27 Cost Management for Just-in-Time Environments
Prob. 27–4B (FIN MAN); Prob. 12–4B (MAN) (Continued)
The following classifications are used in answering (2) and (3):
Activity
Cost
Correcting invoice errors……
…
$7,500
Disposing of incoming
materials with poor quality…
…
15,000
2. Percent of total activity cost for each quality cost (and nonquality cost)
classification:
Prevention………………………………………… 6%
Quality Cost Classification
Cost of Quality Non-Value-Added
Non-value-added
Activity
External failure
Internal failure
ClassificationClassification
Value-Added/
Non-value-added
$ 15,000
Percent of Total
Department Cost
Activity
Cost
…
…
…
CHAPTER 27 Cost Management for Just-in-Time Environments
Prob. 27–4B (FIN MAN); Prob. 12–4B (MAN) (Concluded)
3. Percentages of total activity cost that are value- and non-value-added:
V
alue-added………………………………………… 65%
4. The company has 65% of its total costs as value-added. However, there is still room
for significant improvement. Internal failure represents 26% of the total costs. This
Percent of Total
Department Cost
Activity
Cost
$162,500
CHAPTER 27 Cost Management for Just-in-Time Environments
CP 27–1 (FIN MAN); CP 12–1 (MAN)
The controller should confront the plant manager. The plant manager is attempting to skew
the sampling results by giving the sampled items special treatment. The original intent of
the sampling plan is to represent the average performance of the manufacturing process.
Thus, the tagged items should receive no better treatment than the average product being
CASES & PROJECTS
CP 27–2 (FIN MAN); CP 12–2 (MAN)
Clark’s claim that the inventory doesn’t cost the company anything is likely not true. At
the very minimum, inventory requires working capital to be used. The financing cost
associated with the working capital represents a cost to the company. In addition, the
inventory requires space, insurance, security, and movement. Thus, these additional
CP 27–3 (FIN MAN); CP 12–3 (MAN)
All three charts indicate a steadily deteriorating situation. It seems clear that Maxxim is
not employing just-in-time strategies. The inventory is growing steadily, yet the company
CHAPTER 27 Cost Management for Just-in-Time Environments
CP 27–4 (FIN MAN); CP 12–4 (MAN)
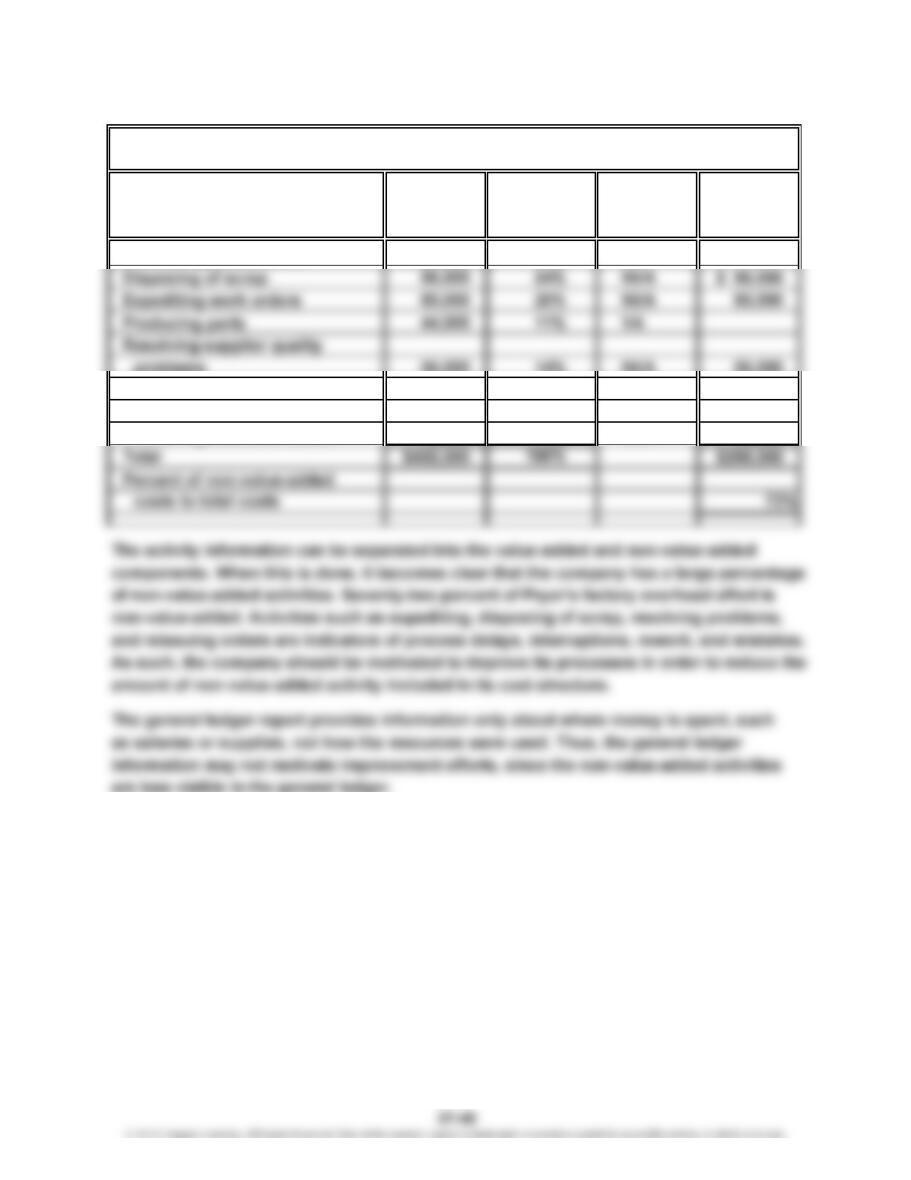
Non-Value-
Total Classifi- Added
Cost cation Costs
Processing sales orders $ 68,000 17% VA
problems 56,000 14% NVA 56,000
Reissuing corrected
purchase orders 40,000 10% NVA 40,000
Expediting customer orders 16,000 4% NVA 16,000
PRYOR COMPANY
Activity
Value-Added/Non-Value-Added Activities Report
Percent
of Total
CHAPTER 27 Cost Management for Just-in-Time Environments
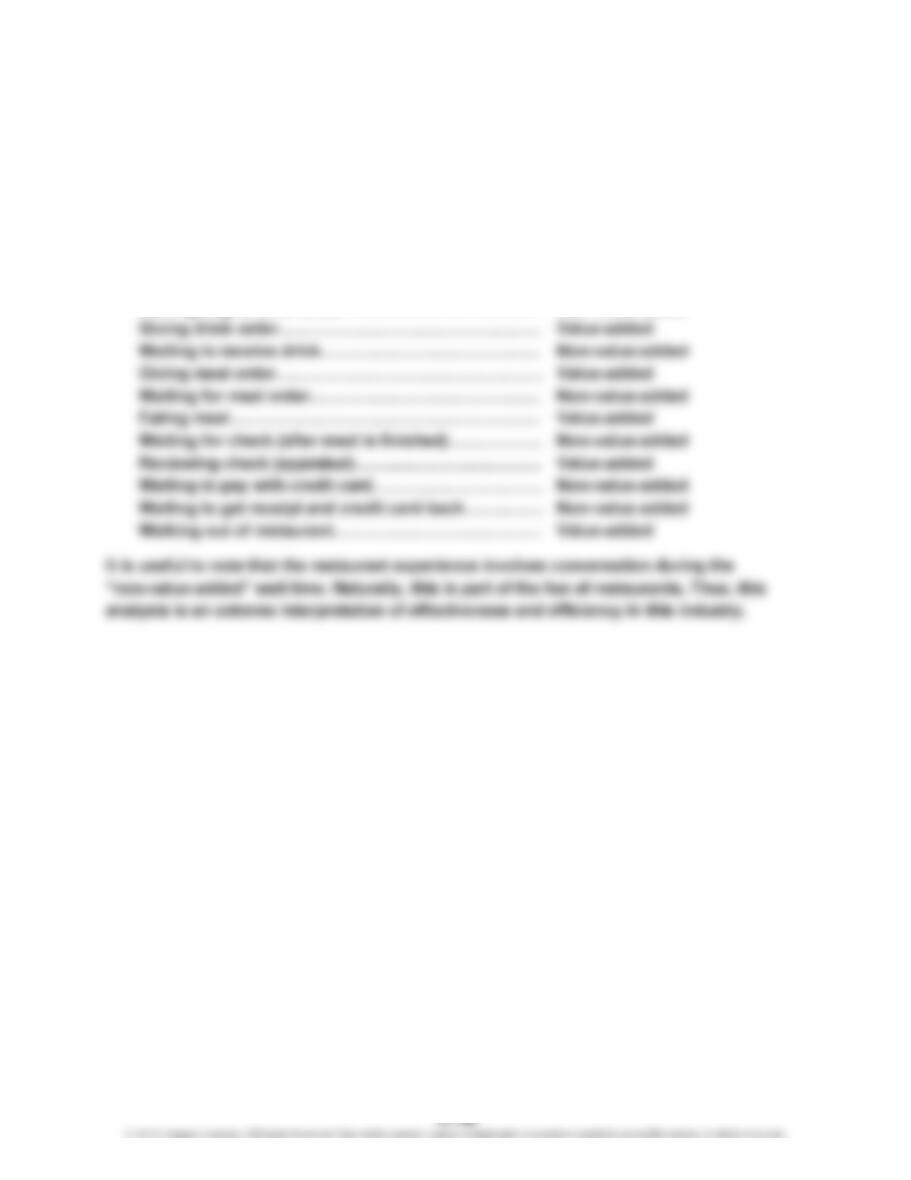
CP 27–5 (FIN MAN); CP 12–5 (MAN)
This would be a good assignment for groups of students to report back to the class. Each
of the groups will likely go to different restaurants at different times of the day and will
have different results. The results could be shared with the class, and “averages” could be
determined for the various non-value-added categories. The following types of activities
will likely be noted in students’ reports:
Waiting to be seated………………………………………
…
Non-value-added
Being seated………………………………………………
…
Value-added
Waiting to give drink order………………………………
…
Non-value-added
…
…
…