
16-1
CHAPTER 16
COST-VOLUME-PROFIT ANALYSIS
DISCUSSION QUESTIONS
1. CVP analysis allows managers to focus on
prices, volume, costs, profits, and sales mix.
Many different “what–if” questions can be
asked to assess the effect on profits of
changes in key variables.
2. The units-sold approach defines sales
volume in terms of units sold and gives
answers in terms of units. The sales–
revenue approach defines sales volume in
terms of revenues and provides answers in
these same terms.
3. Break-even point is the level of sales activity
where total revenues equal total costs, or
where zero profits are earned.
4. At the break-even point, all fixed costs are
covered. Above the break–even point, only
variable costs need to be covered. Thus,
contribution margin per unit is profit per unit,
provided that the unit selling price is greater
than the unit variable cost (which it must be
for break-even to be achieved).
5. The contribution margin is very likely negative
(variable costs are greater than revenue).
When this happens, increasing sales volume
just means increasing losses.
6. Variable cost ratio = Variable costs/Sales.
Contribution margin ratio = Contribution
margin/Sales. Also, Contribution margin
ratio = 1 – Variable cost ratio. Basically,
contribution margin and variable costs sum
to sales. Therefore, if contribution margin
accounts for a particular percentage of
sales, variable costs account for the rest.
7. The increase in contribution margin ratio
means that the amount of every sales dollar
that goes toward covering fixed cost and
profit has just gone up. As a result, the units
needed to break even will go down.
8. No. The increase in contribution is $9,000
(0.3 × $30,000), and the increase in
advertising is $10,000. This is an important
example because the way the problem is
phrased influences us to compare increased
revenue with increased fixed cost. This
comparison is irrelevant. The important
comparison is between contribution margin
and fixed cost.
9. Sales mix is the relative proportion sold of
each product. For example, a sales mix of
4:1 means that, on average, of every five
units sold, four are of the first product and
one is of the second product.
10. Packages of products, based on the expected
sales mix, are defined as a single product.
Price and cost information for this package
can then be used to carry out CVP analysis.
11. A multiple-product firm may not care about the
individual product break-even points. It may
feel that some products can even lose money
as long as the overall picture is profitable. For
example, a company that produces a full line
of spices may not make a profit on each one,
but the availability of even the more unusual
spices in the line may persuade grocery stores
to purchase from the company.
12. Income taxes do not affect the break-even
point at all. Since taxes are a percentage of
income, zero income will generate zero
taxes. However, CVP analysis is affected by
income taxes in that a target profit must be
figured in before-tax income since the CVP
equations do not include the income tax rate.
13. A change in sales mix will change the
contribution margin of the package (defined
by the sales mix) and, thus, will change the
units needed to break even.
14. Margin of safety is the sales activity in excess
of that needed to break even. Operating
leverage is the use of fixed costs to extract
higher percentage changes in profits as sales
activity changes. It is achieved by raising fixed
costs and lowering variable costs. As the
margin of safety increases, risk decreases.
Increases in leverage raise risk.
15. Activity-based costing reminds managers
that costs may vary with respect to unit and
nonunit variables, such as the number of
batches or number of products. This insight
prevents a single-minded focus on unit–
based costs, to the exclusion of factors
which might change fixed costs.
16-2
CORNERSTONE EXERCISES
Cornerstone Exercise 16.1
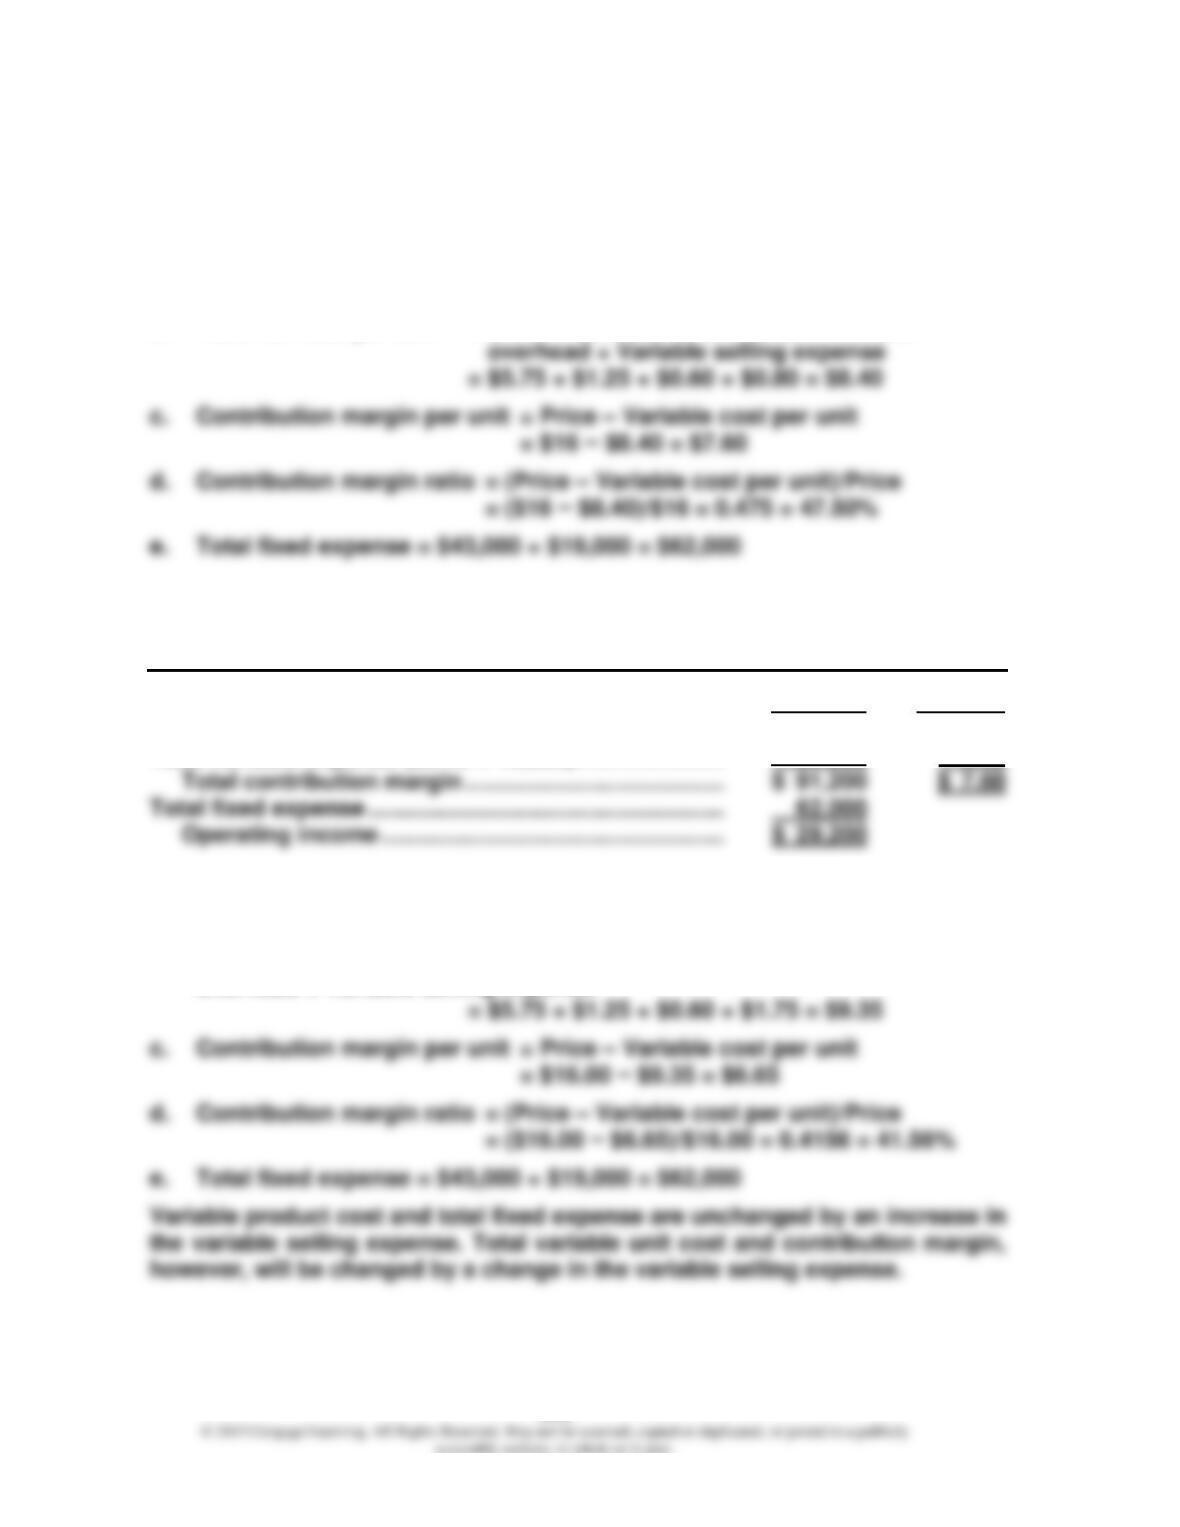
1. a. Var. product cost per unit = Direct materials + Direct labor + Var. overhead
= $5.75 + $1.25 + $0.60 = $7.60
b. Total var. cost per unit = Direct materials + Direct labor + Variable
2. Custom Screenprinting Company
Contribution-Margin-Based Operating Income Statement
For the Coming Year
Total Per Unit
Sales ($16 × 12,000 T-shirts) ………………………………….. $192,000 $16.00
Total variable expense ($8.40 × 12,000) ………………….. 100,800 8.40
3. a. Var. product cost per unit = Direct materials + Direct labor + Var. overhead
= $5.75 + $1.25 + $0.60 = $7.60
b. Total var. cost per unit = Direct materials + Direct labor + Variable
overhead + Variable selling expense
16-3
Cornerstone Exercise 16.2
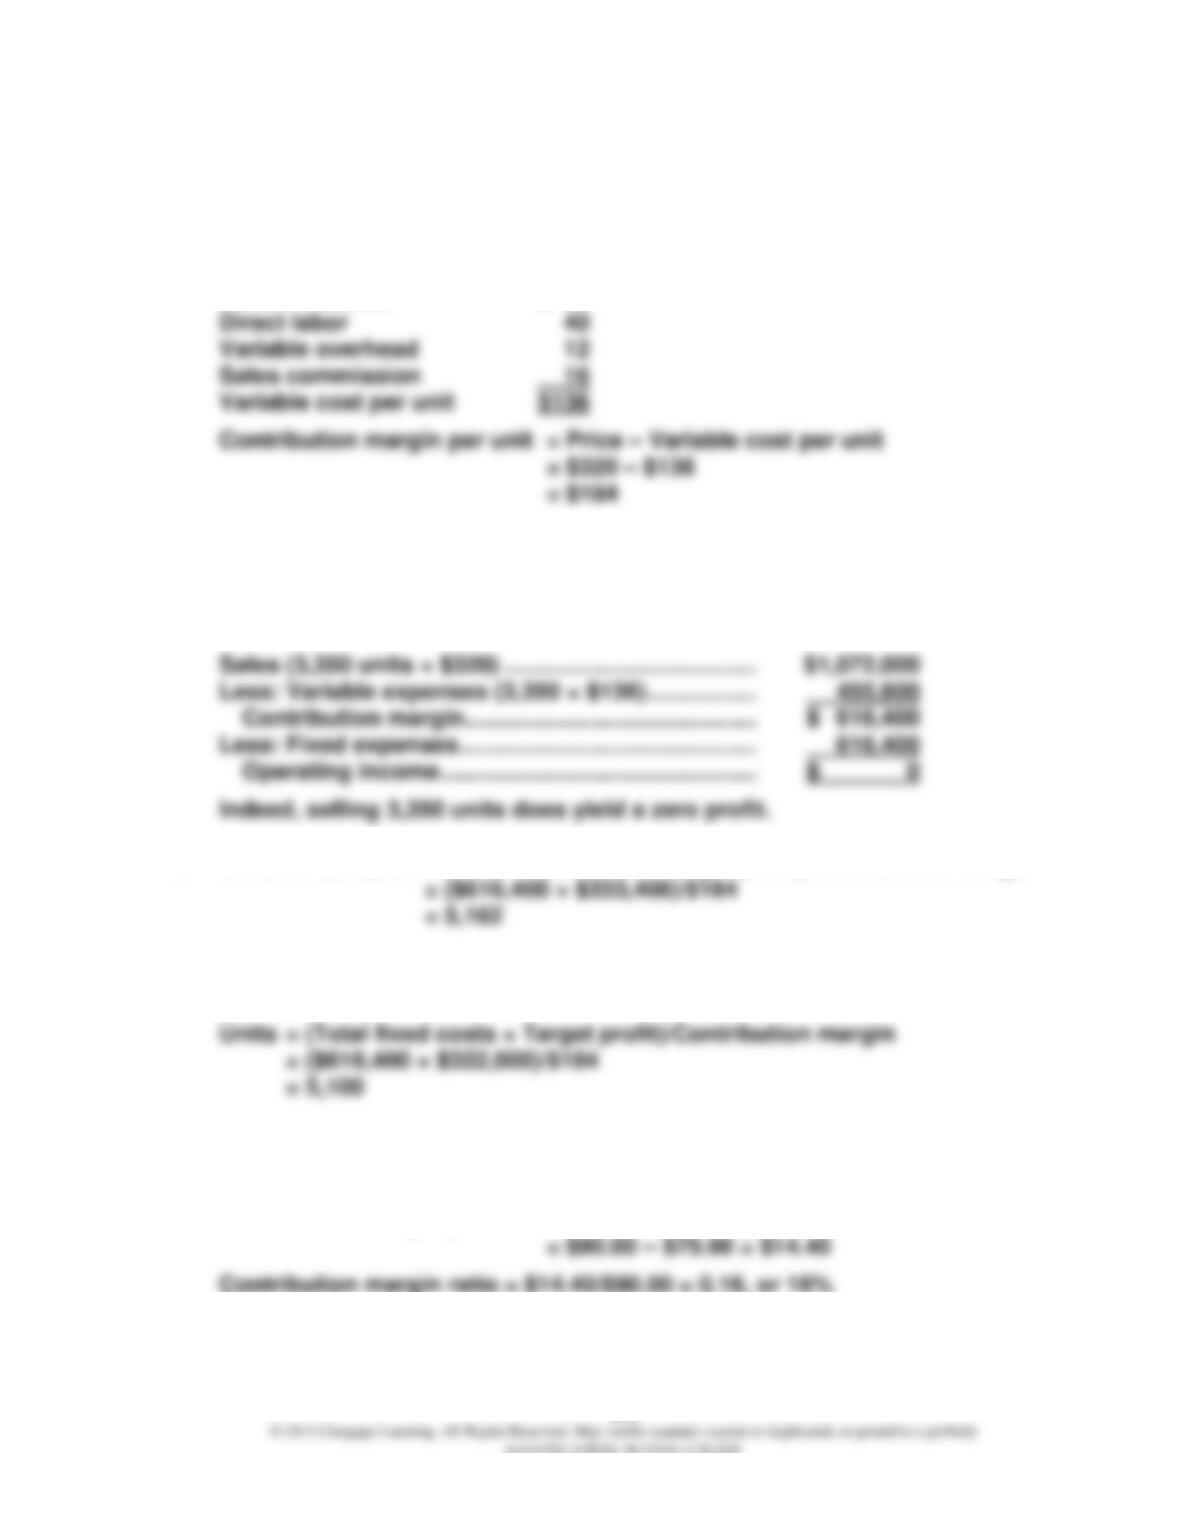
1. Sales commission per unit = Commission rate × Price
= 0.05 × $320
= $16
Direct materials $ 68
2. Break-even units = Total fixed costs/(Price – Unit variable cost)
= ($500,000 + $116,400)/($320 – $136)
= $616,400/$184
= 3,350
3. Units for $333,408 = (Total fixed costs + Target profit)/Contribution margin
4. The number of units needed to achieve operating income of $322,000 is less
than 5,162.
Cornerstone Exercise 16.3
1. Contribution margin per unit = Price – Unit variable cost
16-4
Cornerstone Exercise 16.3 (Concluded)
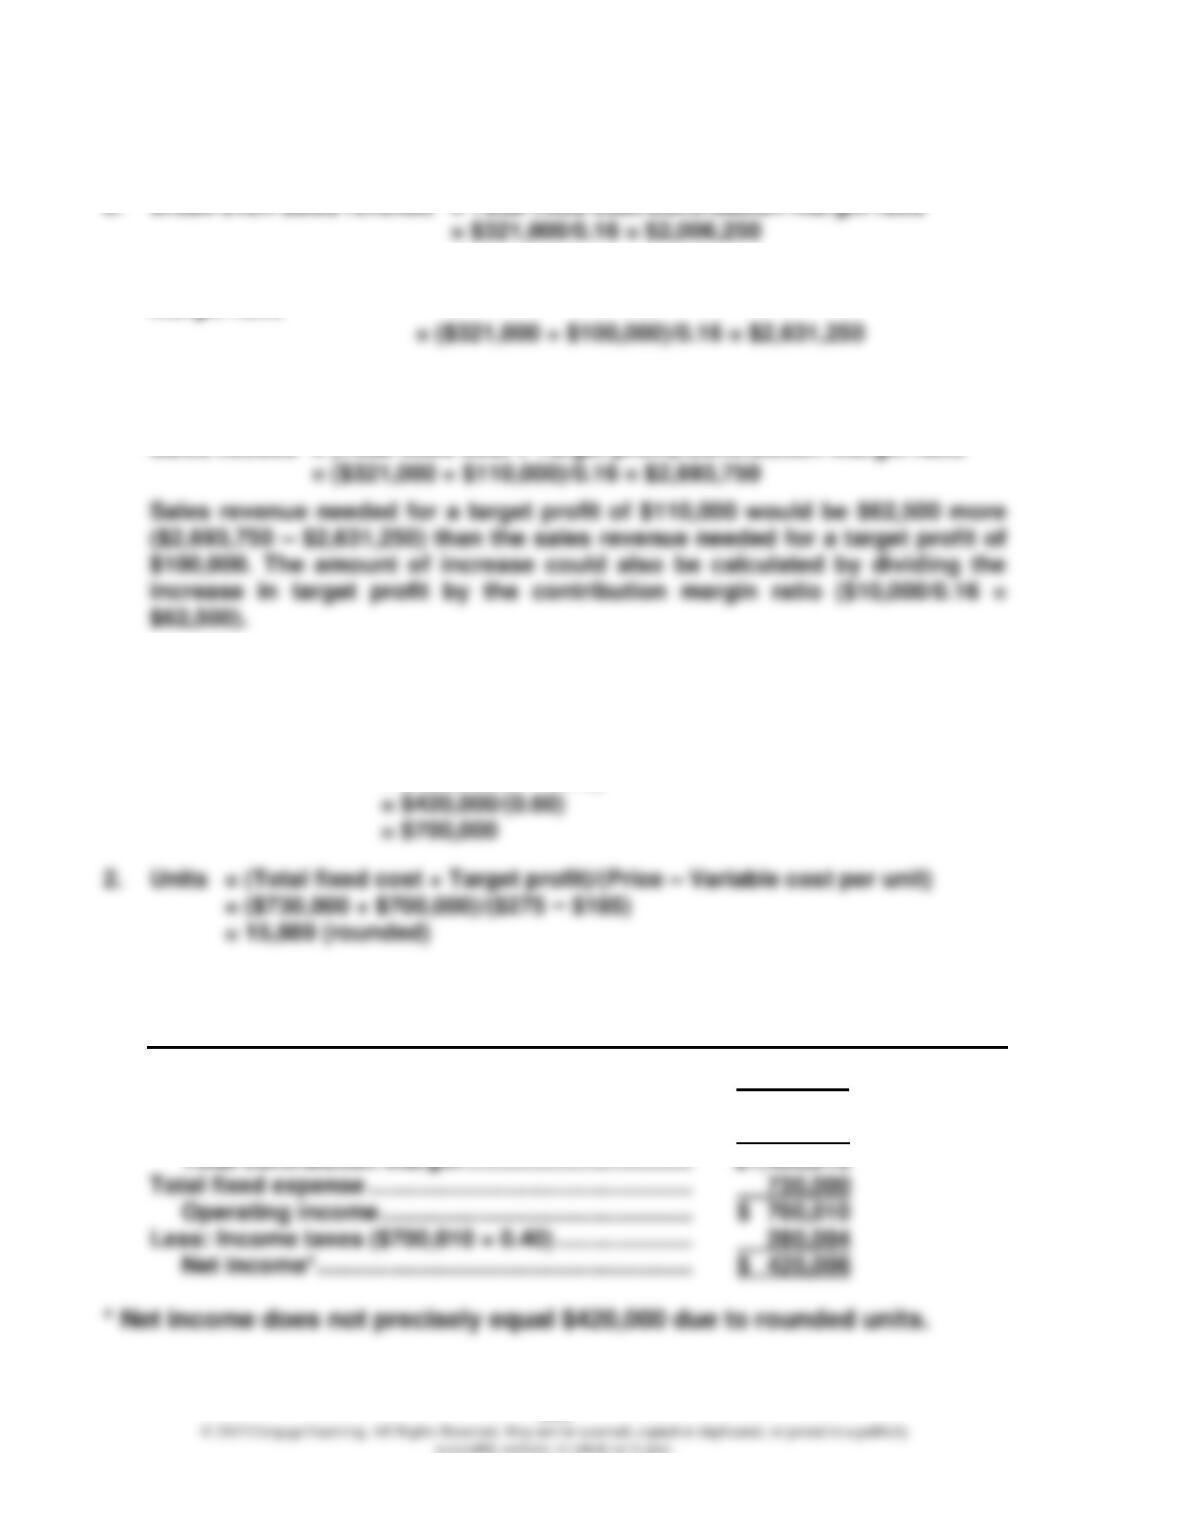
2. Break-even sales revenue = Total fixed cost/Contribution margin ratio
3. Sales revenue needed = (Total fixed cost + Target profit)/Contribution
margin ratio
4. Target profit of $110,000 is larger than $100,000, so the sales revenue needed
would be larger.
Sales needed = (Total fixed cost + Target profit)/Contribution margin ratio
Cornerstone Exercise 16.4
1. Before-tax income = After-tax income/(1 – Tax rate)
= $420,000/(1 – 0.40)
3. Cherrington Company
Income Statement
For the Coming Year
Total
Sales ($275 × 15,889 units) ……………………………….. $4,369,475
Total variable expense ($185 × 15,889) ………………. 2,939,465
16-5
Cornerstone Exercise 16.4 (Concluded)
4. The units would be lower than 15,889 since the lower tax rate means that a
smaller operating income would be needed to yield the same target net
income.
Before-tax income = $420,000/(1 – 0.35)
Cornerstone Exercise 16.5
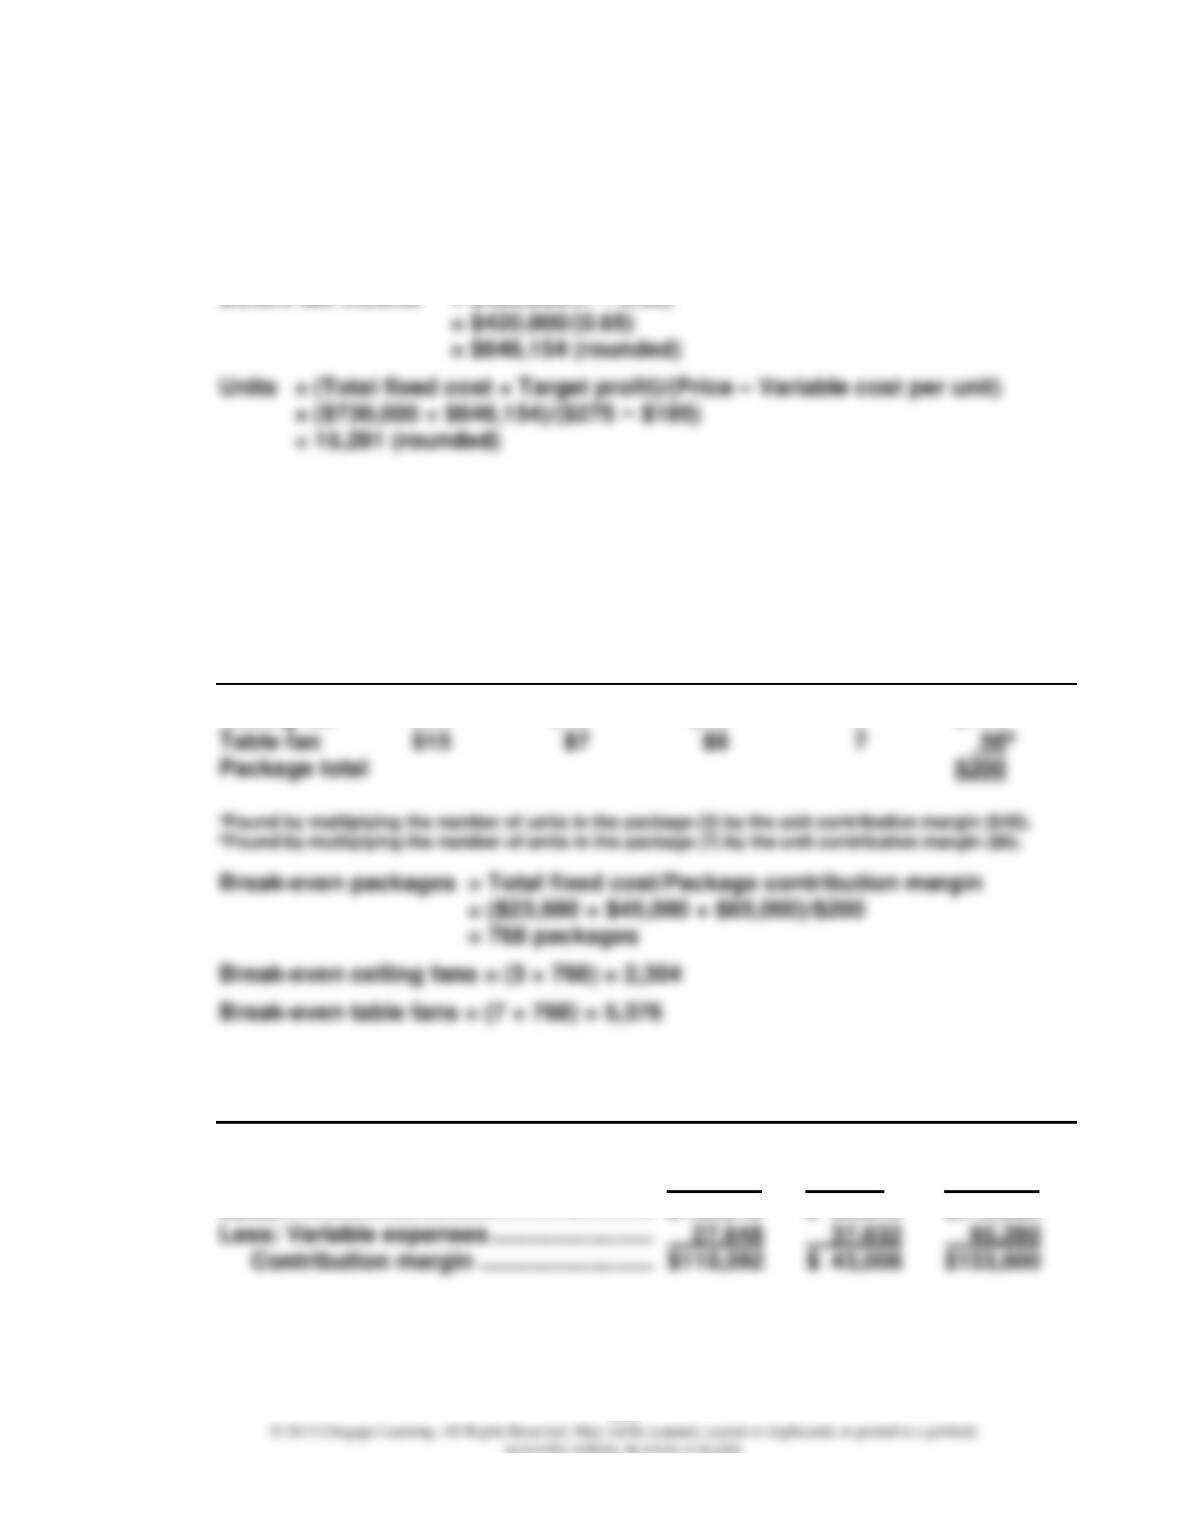
1. Sales mix of ceiling fans to table fans = 30,000:70,000 = 3:7
2. Unit Unit Package Unit
Variable Contribution Sales Contribution
Product Price Cost Margin Mix Margin
Ceiling fan $60 $12 $48 3 $144a
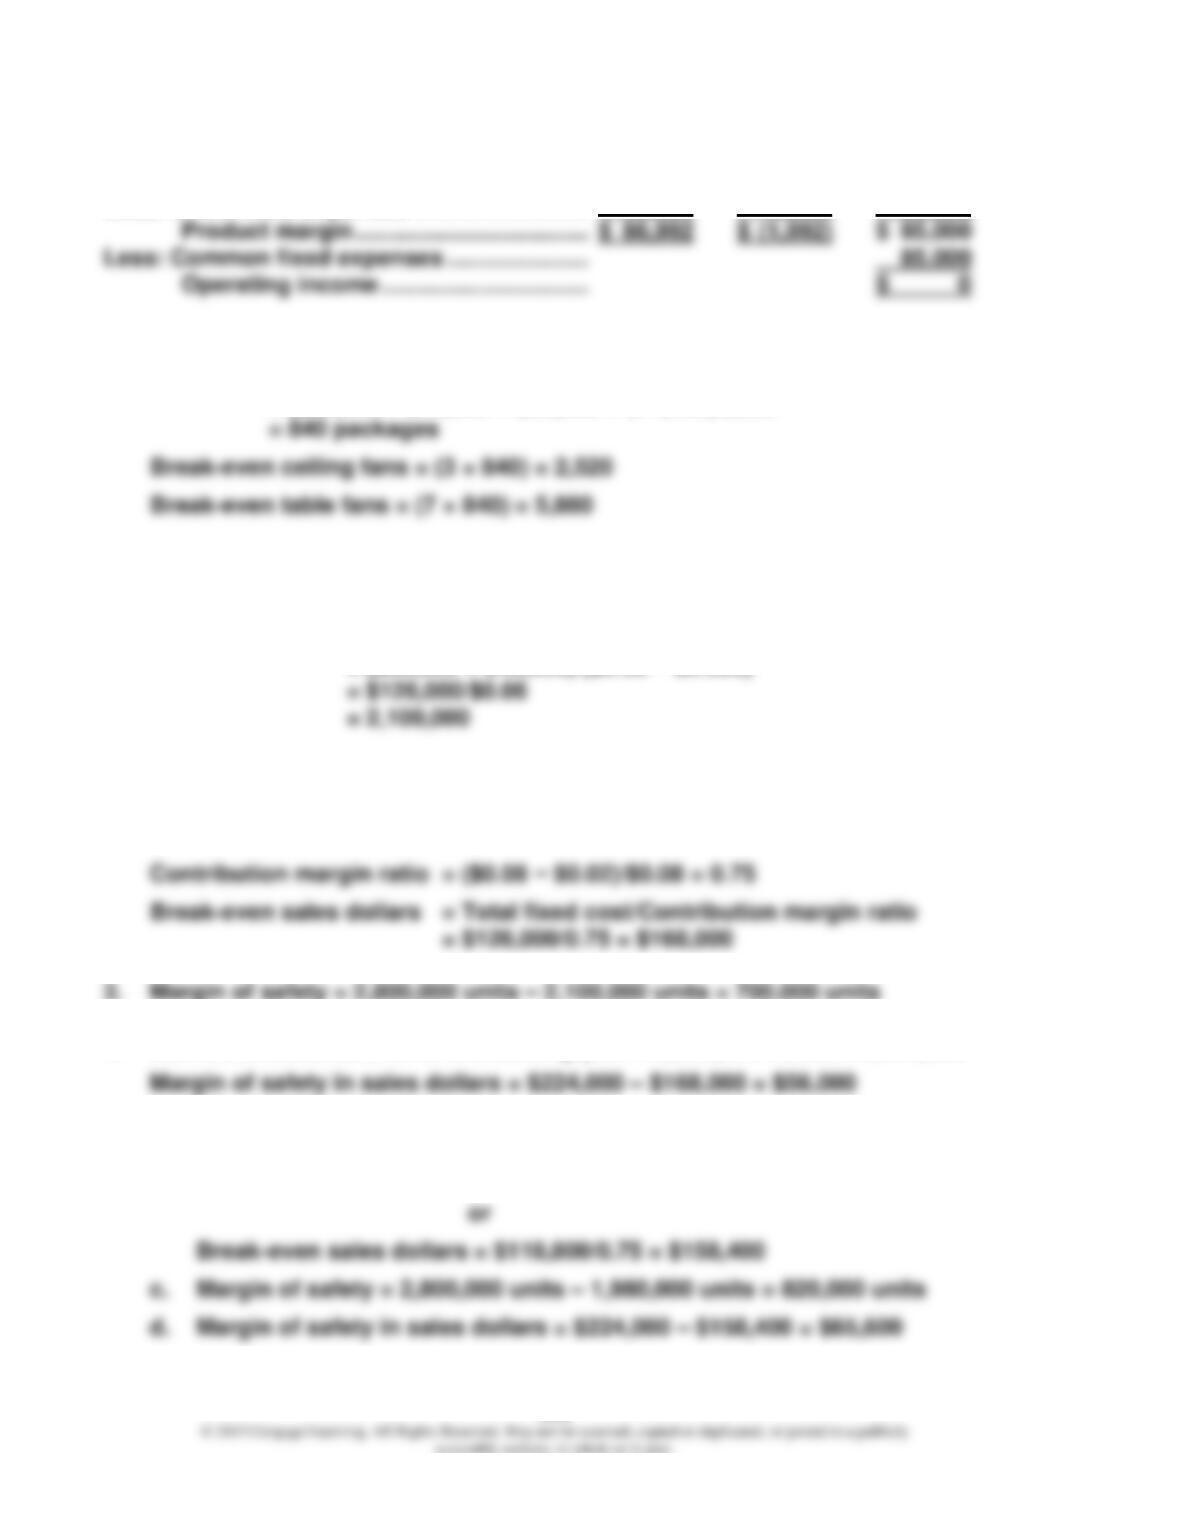
3. Vandenberg, Inc.
Contribution-Margin-Income Statement
For the Coming Year
Ceiling Table
Fans Fans Total
Sales ………………………………………………… $138,240 $ 80,640 $218,880
16-6
Cornerstone Exercise 16.5 (Concluded)
Less: Direct fixed expenses ……………………… 23,600 45,000 68,600
4. Package contribution margin is the same as that figured in Requirement 2.
Packages = (Total fixed cost + Target profit)/Package contribution margin
= ($23,600 + $45,000 + $85,000 + $14,400)/$200
Cornerstone Exercise 16.6
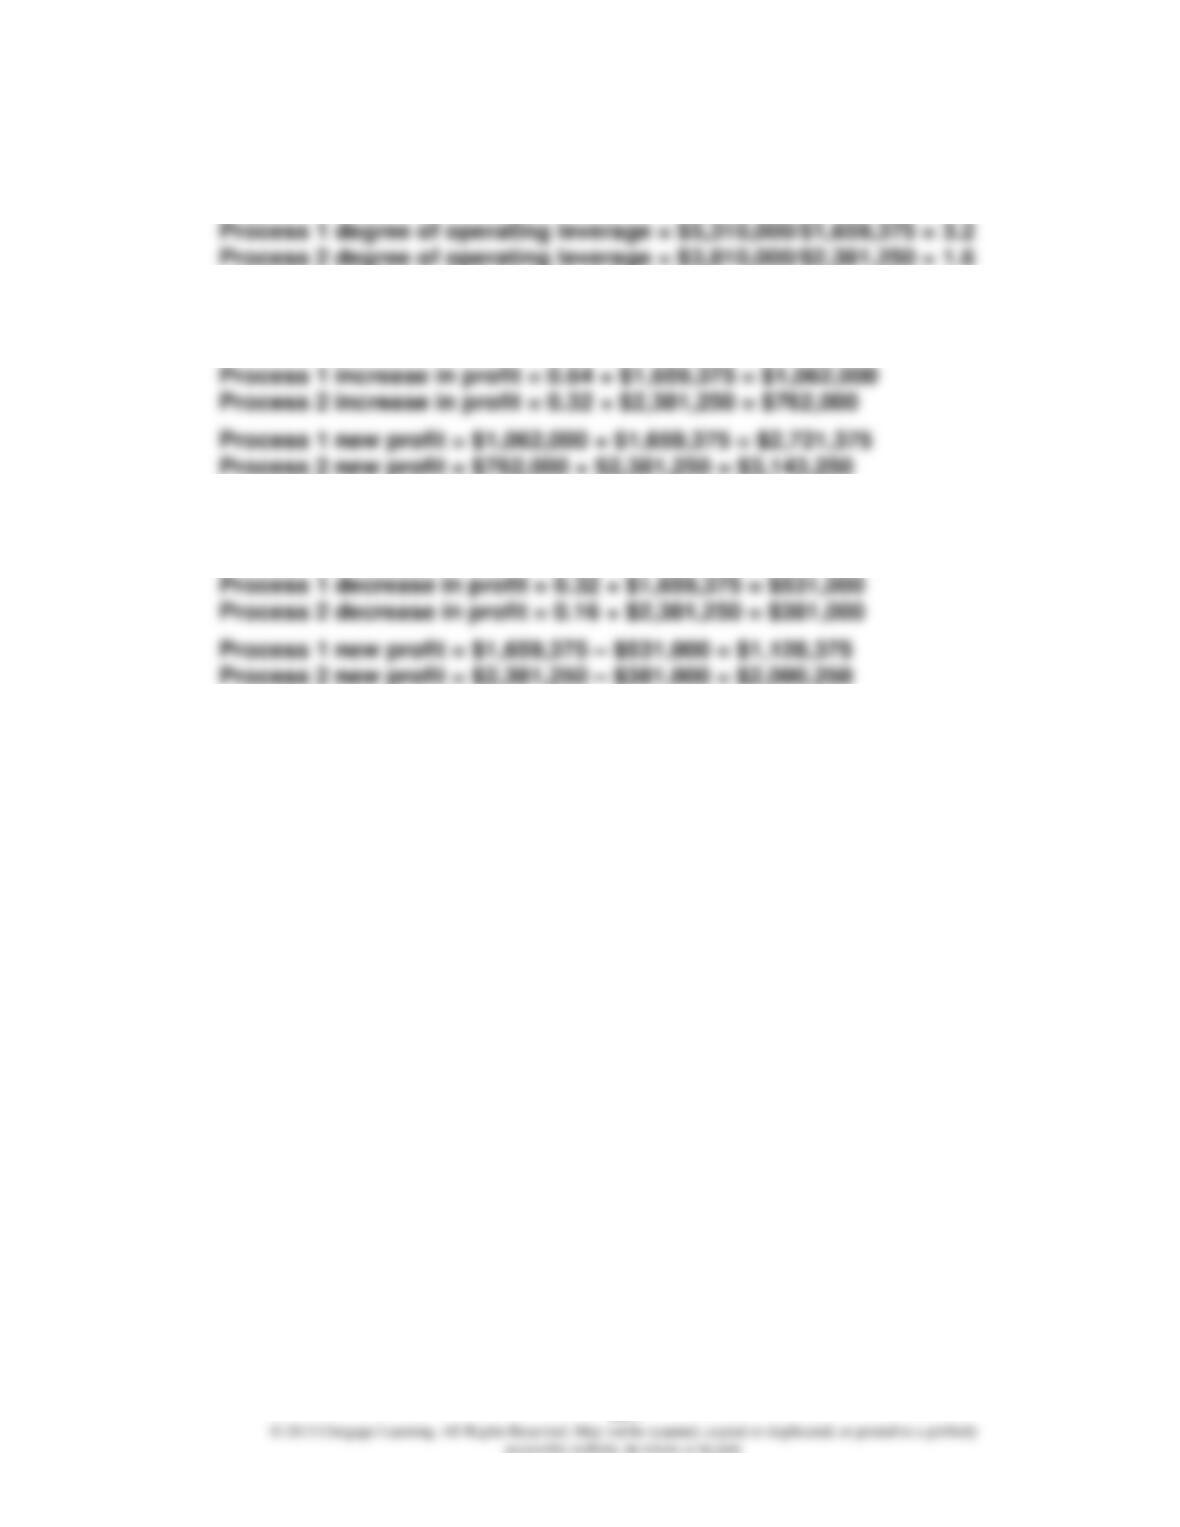
1. Break-even units = Total fixed costs/(Price – Variable cost)
= ($80,000 + $46,000)/($0.08 − $0.020)
2. Break-even sales dollars = Break-even units × Price
= 2,100,000 × $0.08 = $168,000
or
4. Estimated sales dollars for the coming year = 2,800,000 × $0.08 = $224,000
5. a. Break-even units = ($38,800 + $80,000)/($0.08 − $0.02) = 1,980,000
b. Break-even sales dollars = 1,980,000 × $0.08 = $158,400
16-7
Cornerstone Exercise 16.7
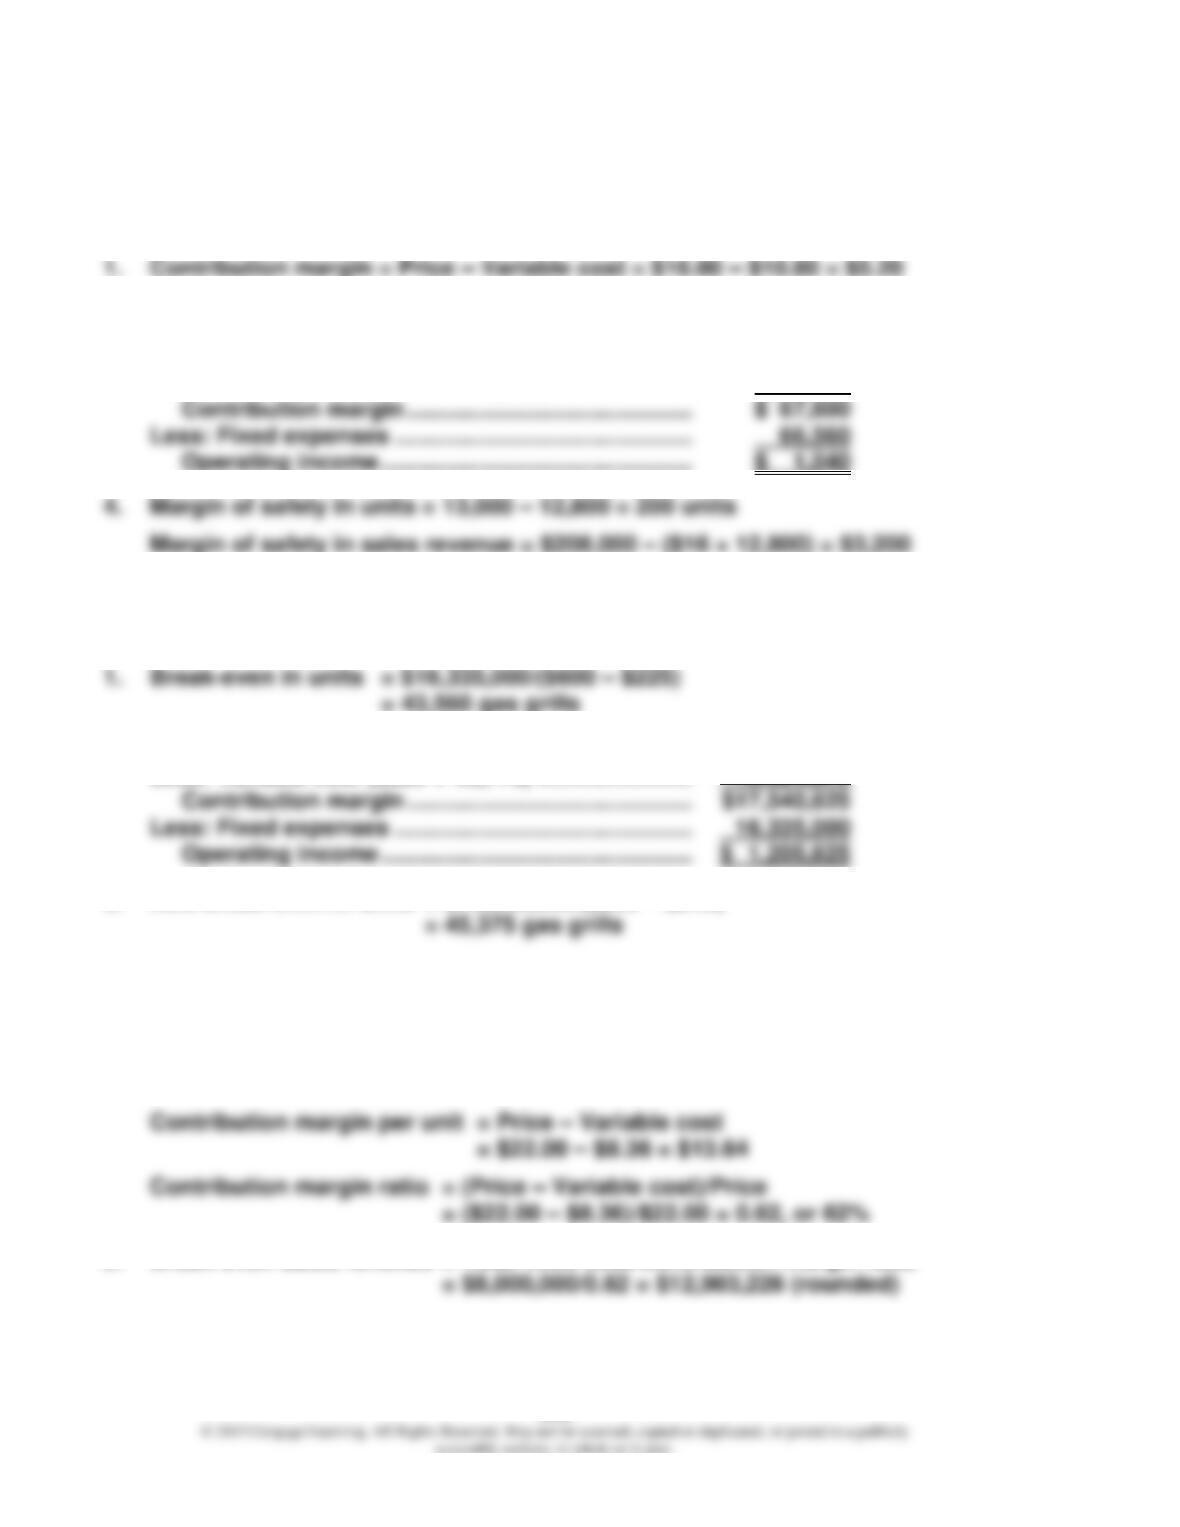
1. Degree of operating leverage = Total contribution margin/Profit
2. Process 1 increase in profit percentage = 3.2 × 20% = 64%
Process 2 increase in profit percentage = 1.6 × 20% = 32%
3. Process 1 decrease in profit percentage = 3.2 × 10% = 32%
Process 2 decrease in profit percentage = 1.6 × 10% = 16%
16-8
EXERCISES
Exercise 16.8
2. Break-even in units = $66,560/$5.20 = 12,800 custom skins
3. Sales ($16 × 13,000) ………………………………………….. $208,000
Less: Variable cost ($10.80 × 13,000) ………………… 140,400
Exercise 16.9
2. Sales ($600 × 46,775) ………………………………………… $28,065,000
Less: Variable cost ($225 × 46,775) …………………… 10,524,375
3. New break-even in units = $16,335,000/($600 – $240)
Exercise 16.10
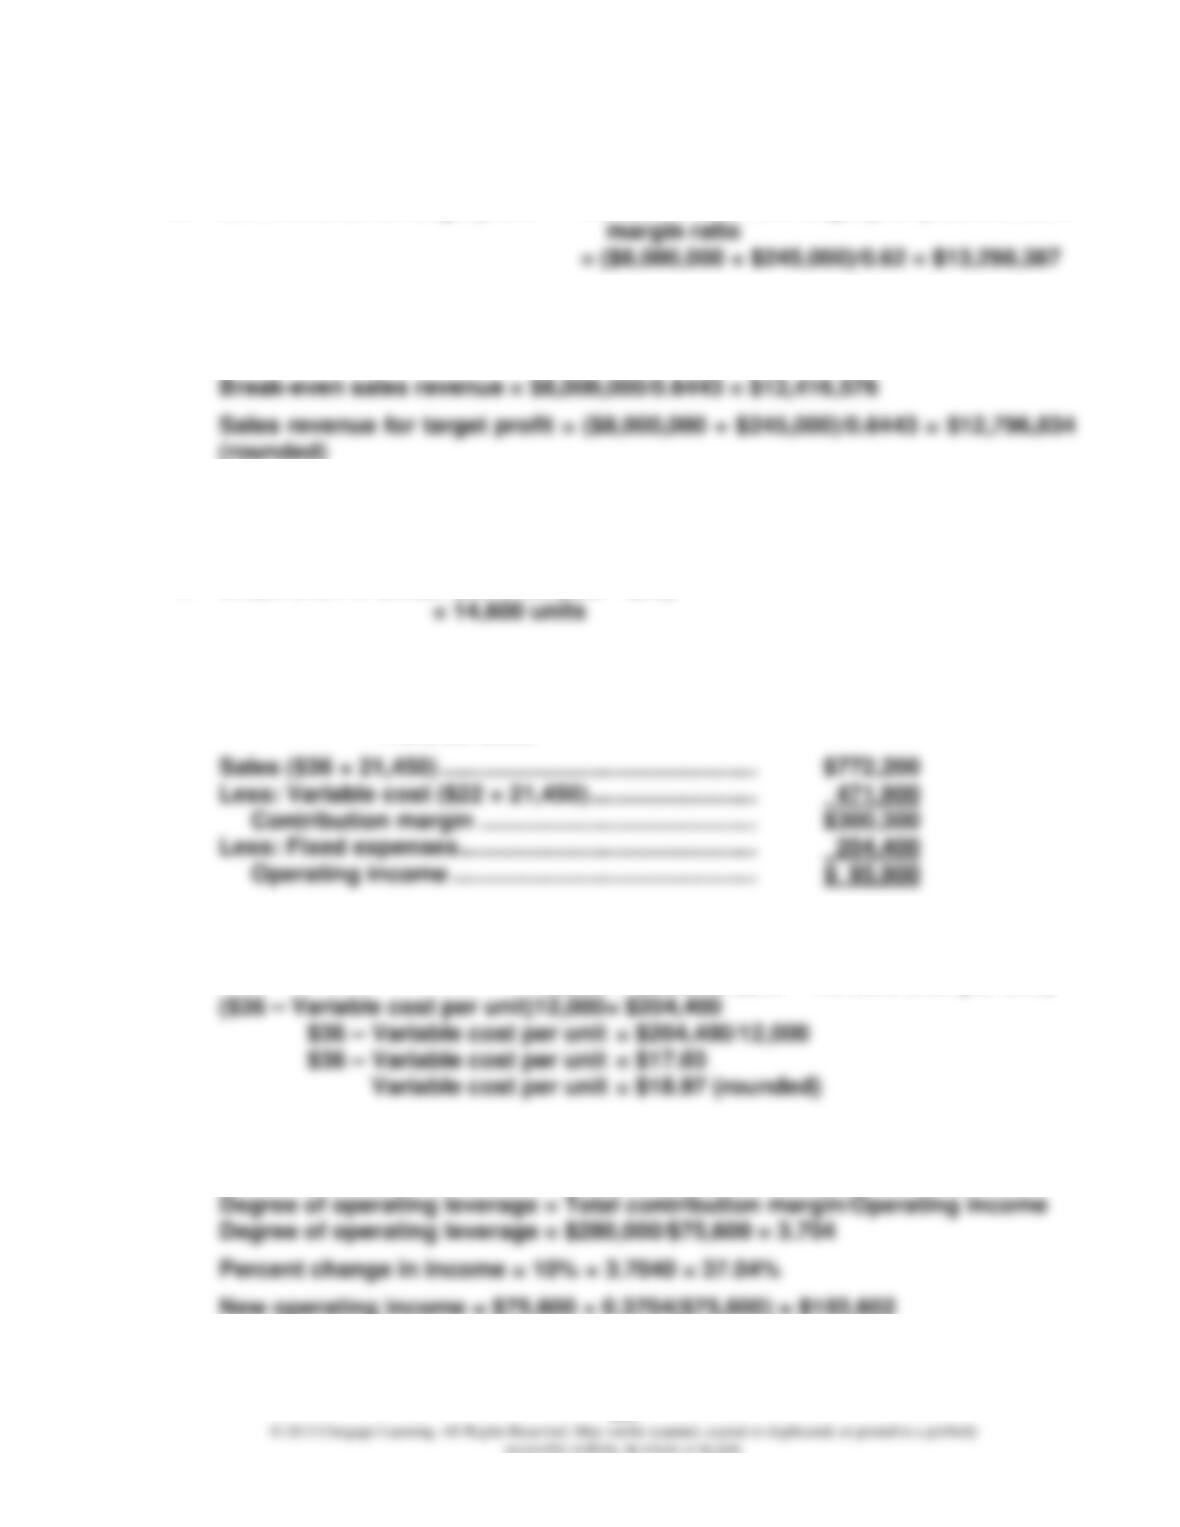
1. Variable cost per unit = Total variable cost/Units
= $1,086,800/130,000 = $8.36
2. Break-even sales revenue = Total fixed cost/Contribution margin ratio
16-9
Exercise 16.10 (Concluded)
3. Sales revenue for target profit = (Total fixed cost + Target profit)/Contribution
4. Contribution margin per unit = $23.50 – $8.36 = $15.14
Contribution margin ratio = ($23.50 – $8.36)/$23.50 = 0.6443, or 64.43%
Exercise 16.11
1. Break-even in units = $204,400/($36 – $22)
2. Number of units to earn $95,900 profit:
= ($204,400 + $95,900)/($36 – $22)
= 21,450 units
3. Break-even units= Total fixed cost/(Price – Variable cost per
unit)
12,000 = $204,400/($36 – Variable cost per unit)
4. Current contribution margin = $14 × 20,000 units = $280,000
Current operating income = $280,000 – $204,400 = $75,600
16–10
Exercise 16.12
1. Break-even in units = $3,240/($60 – $24) = 90 jobs per month
2. 88 Jobs 95 Jobs
Sales …………………………………………………. $5,280 $5,700
Exercise 16.13
0.06($75,000)X = $1,600(15) + 0.02($75,000)X
$4,500X = $24,000 + $1,500X
Exercise 16.14
1. Contribution margin ratio = 1 – ($5,678,700/$12,345,000) = 0.54
Break-even sales revenue = $2,192,400/0.54 = $4,060,000
3. Contribution margin from increased sales = ($230,000)(0.54) = $124,200
Exercise 16.15
2. First, convert after-tax profit to before-tax profit.
Before-tax profit = $225,000/(1 – 0.4) = $375,000
3. Alternative B is best, as shown by the following calculations:
Alternative A:
Revenue = $400(350) + $370(2,200) = $954,000
Variable cost = $200(350) + $175(2,200) = $455,000
4. Four assumptions underlying CVP analysis are as follows:
All costs can be divided into fixed and variable elements.
16–12
Exercise 16.16
1. Sales (14,000 × $230) ………………………………………… $3,220,000
Less: Variable expenses (14,000 × $80.50)…………. 1,127,000
2. Break-even revenue = $1,255,800/0.65* = $1,932,000
4. Before-tax net income = $650,000/(1 – 0.25) = $866,667
Units = ($1,255,800 + $866,667)/($230.00 – $80.50) = 14,197
5. Before-tax net income = $650,000/(1 – 0.35) = $1,000,000
Exercise 16.17
1. Break-even units = $90/($5 – $2) = 30
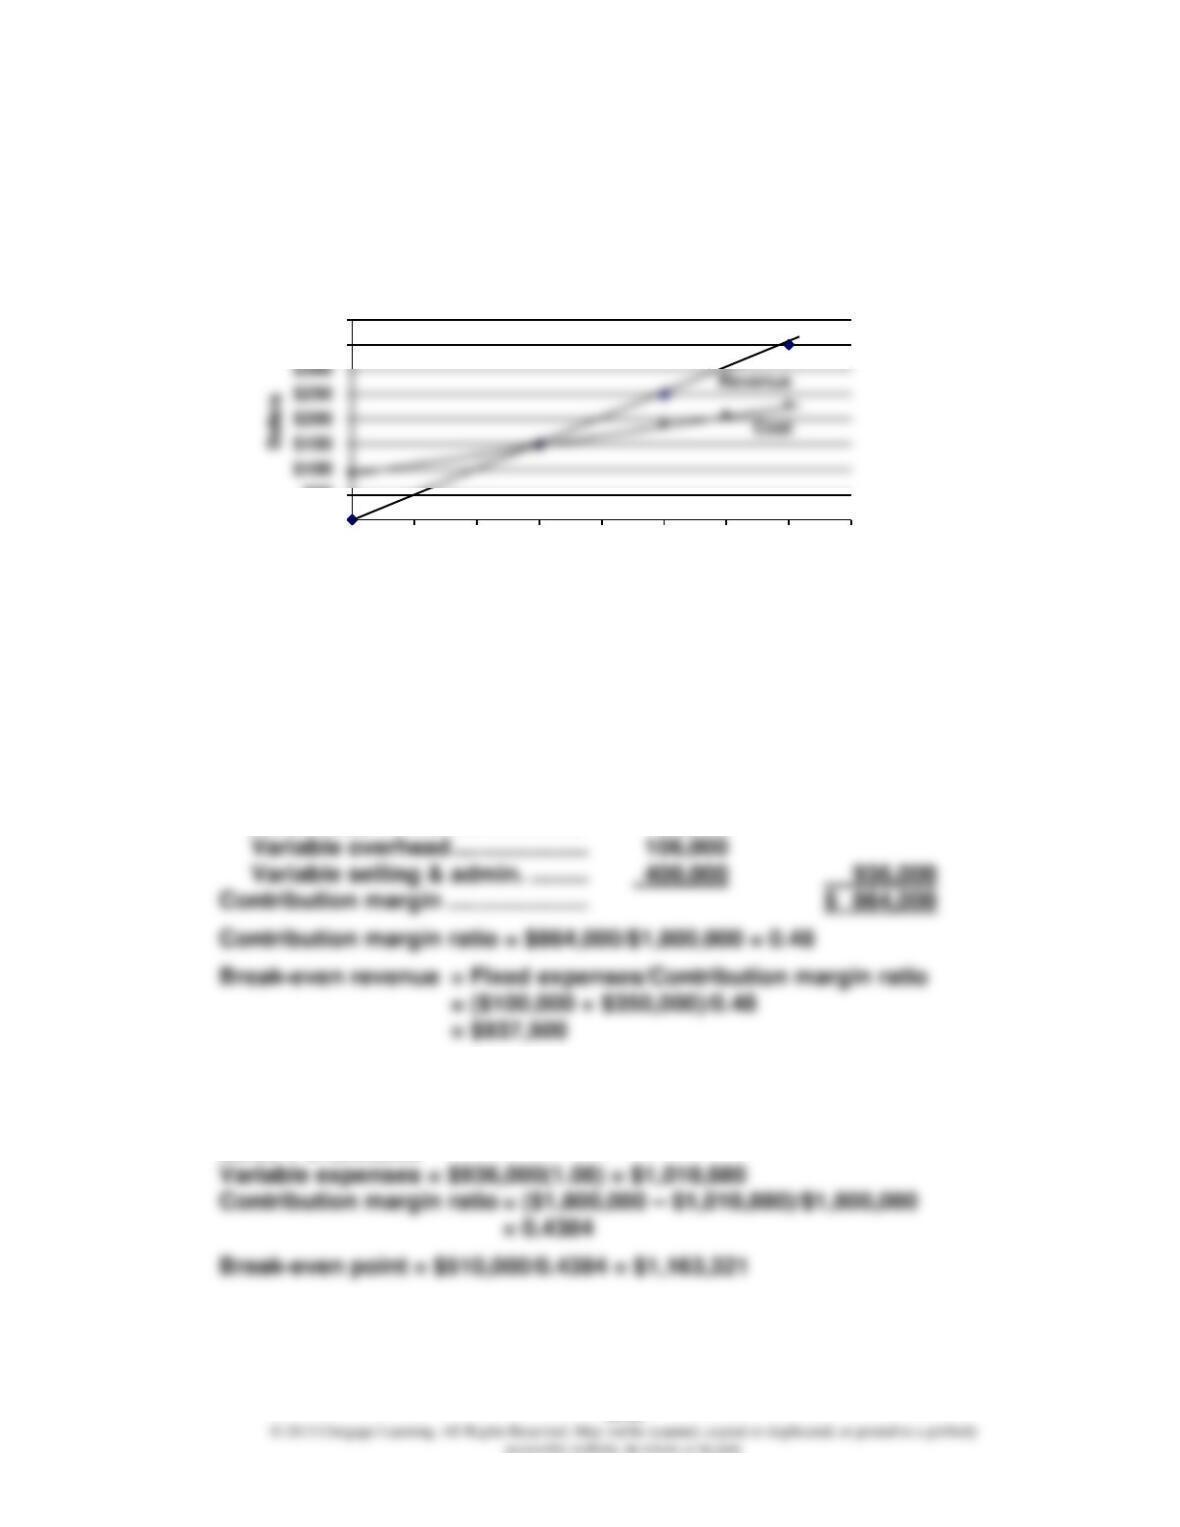
2.
Profit-Volume Graph
($150)
($100)
$0
$150
Profit
16–13
Exercise 16.17 (Concluded)
3.
Cost-Volume-Profit Graph
$0
$50
$350
$400
010 20 30 40 50 60 70 80
Units
Exercise 16.18
1. Sales ……………………………………….. $1,800,000
Less variable expenses:
Direct materials ……………………. $250,000
Direct labor ………………………….. 180,000
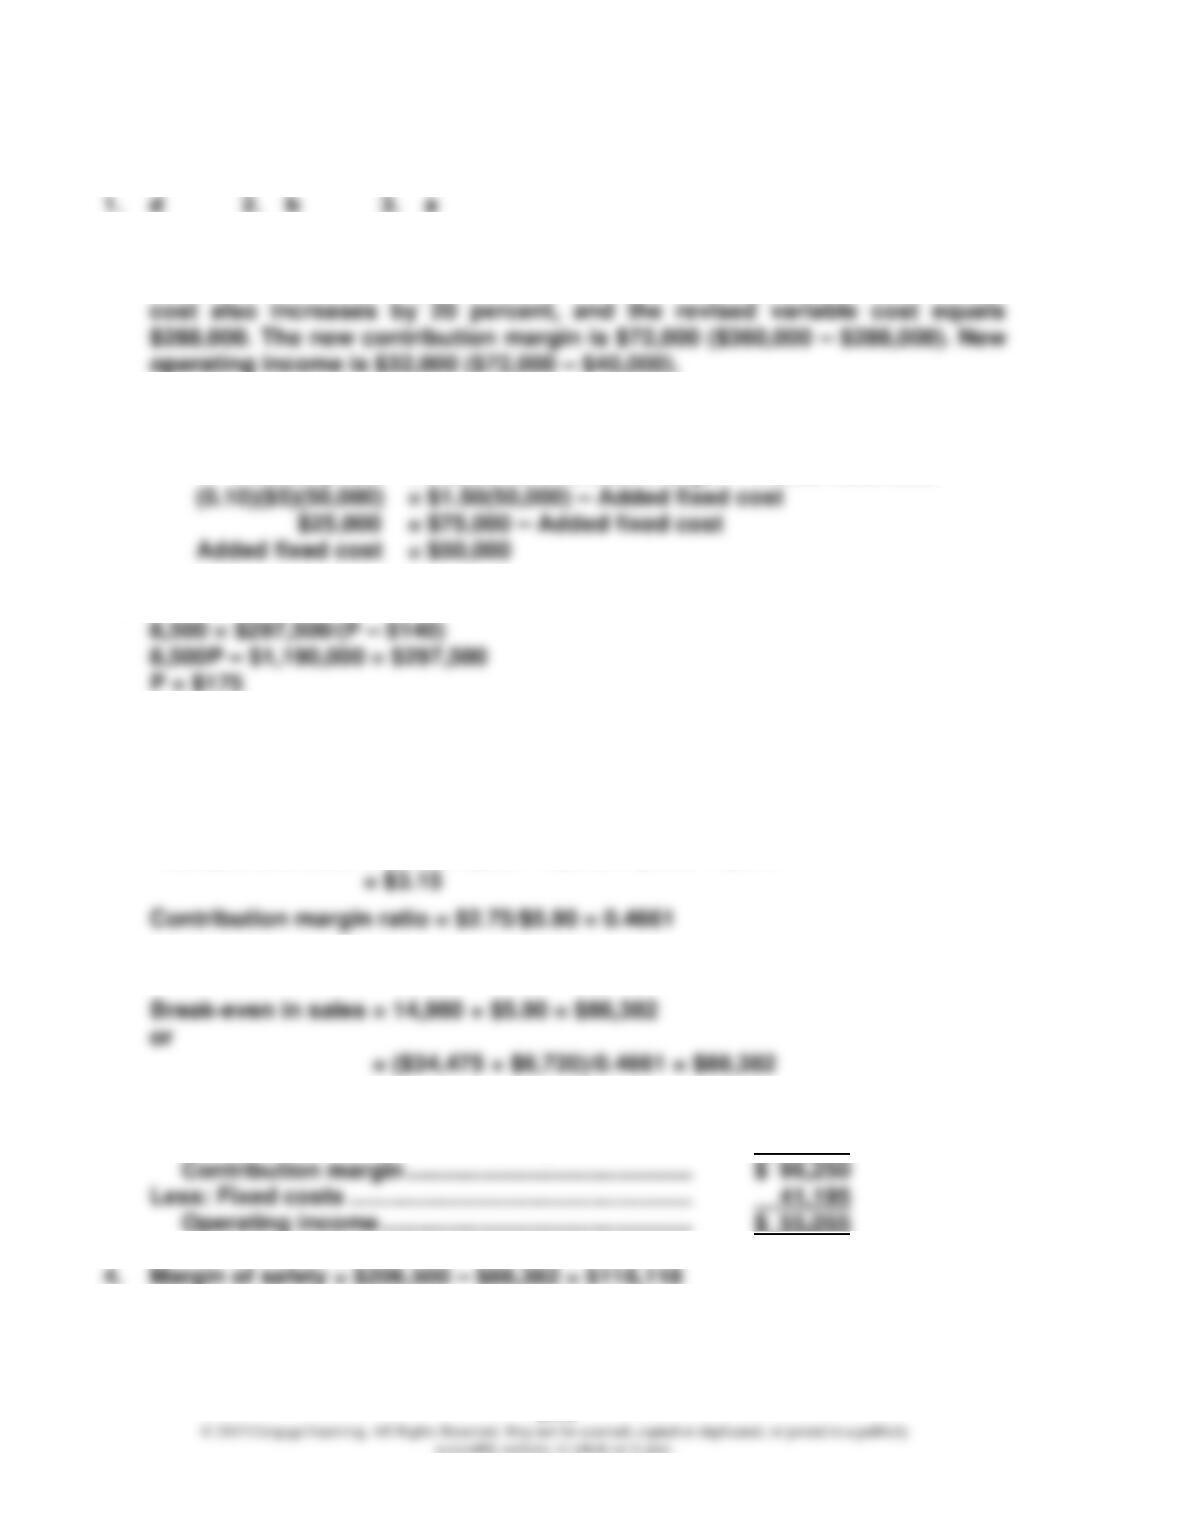
2. Next year’s data:
Fixed expenses = $100,000 + $350,000 + $60,000 = $510,000
Sales = $1,800,000
16–14
Exercise 16.19
4. c
If sales increase by 20 percent, then revised sales equal $360,000. Variable
5. a
Price = $3.50/0.7 = $5.00
Added profit = Added contribution margin – Added fixed cost
6. c
Exercise 16.20
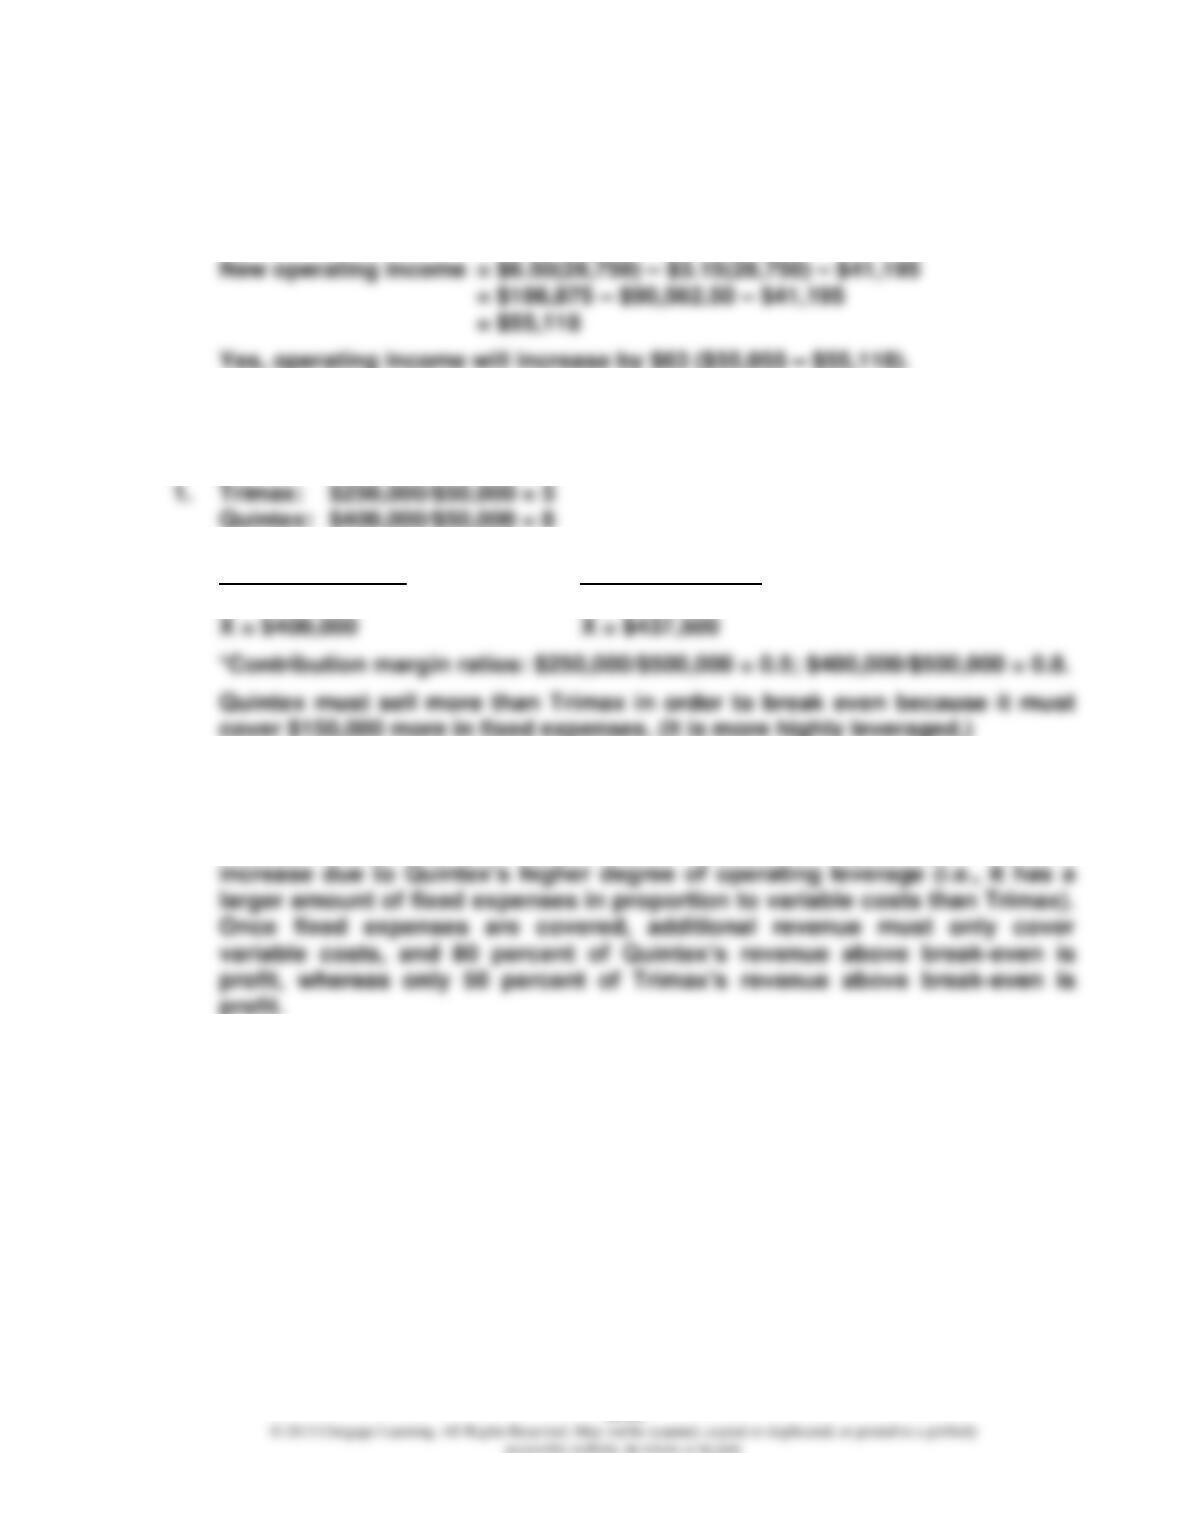
1. Contribution margin per unit = $5.90 – $3.15* = $2.75
*Variable unit cost = $0.86 + $0.57 + $0.43 + $1.15 + $0.14
2. Break-even in units = ($34,475 + $6,720)/$2.75 = 14,980 bottles
3. Sales ($5.90 × 35,000) ……………………………………….. $206,500
Less: Variable costs ($3.15 × 35,000) ………………… 110,250
16–15
Exercise 16.20 (Concluded)
5. Break-even in units = $41,195/($6.50 – $3.15)
= 12,297 (rounded)
Exercise 16.21
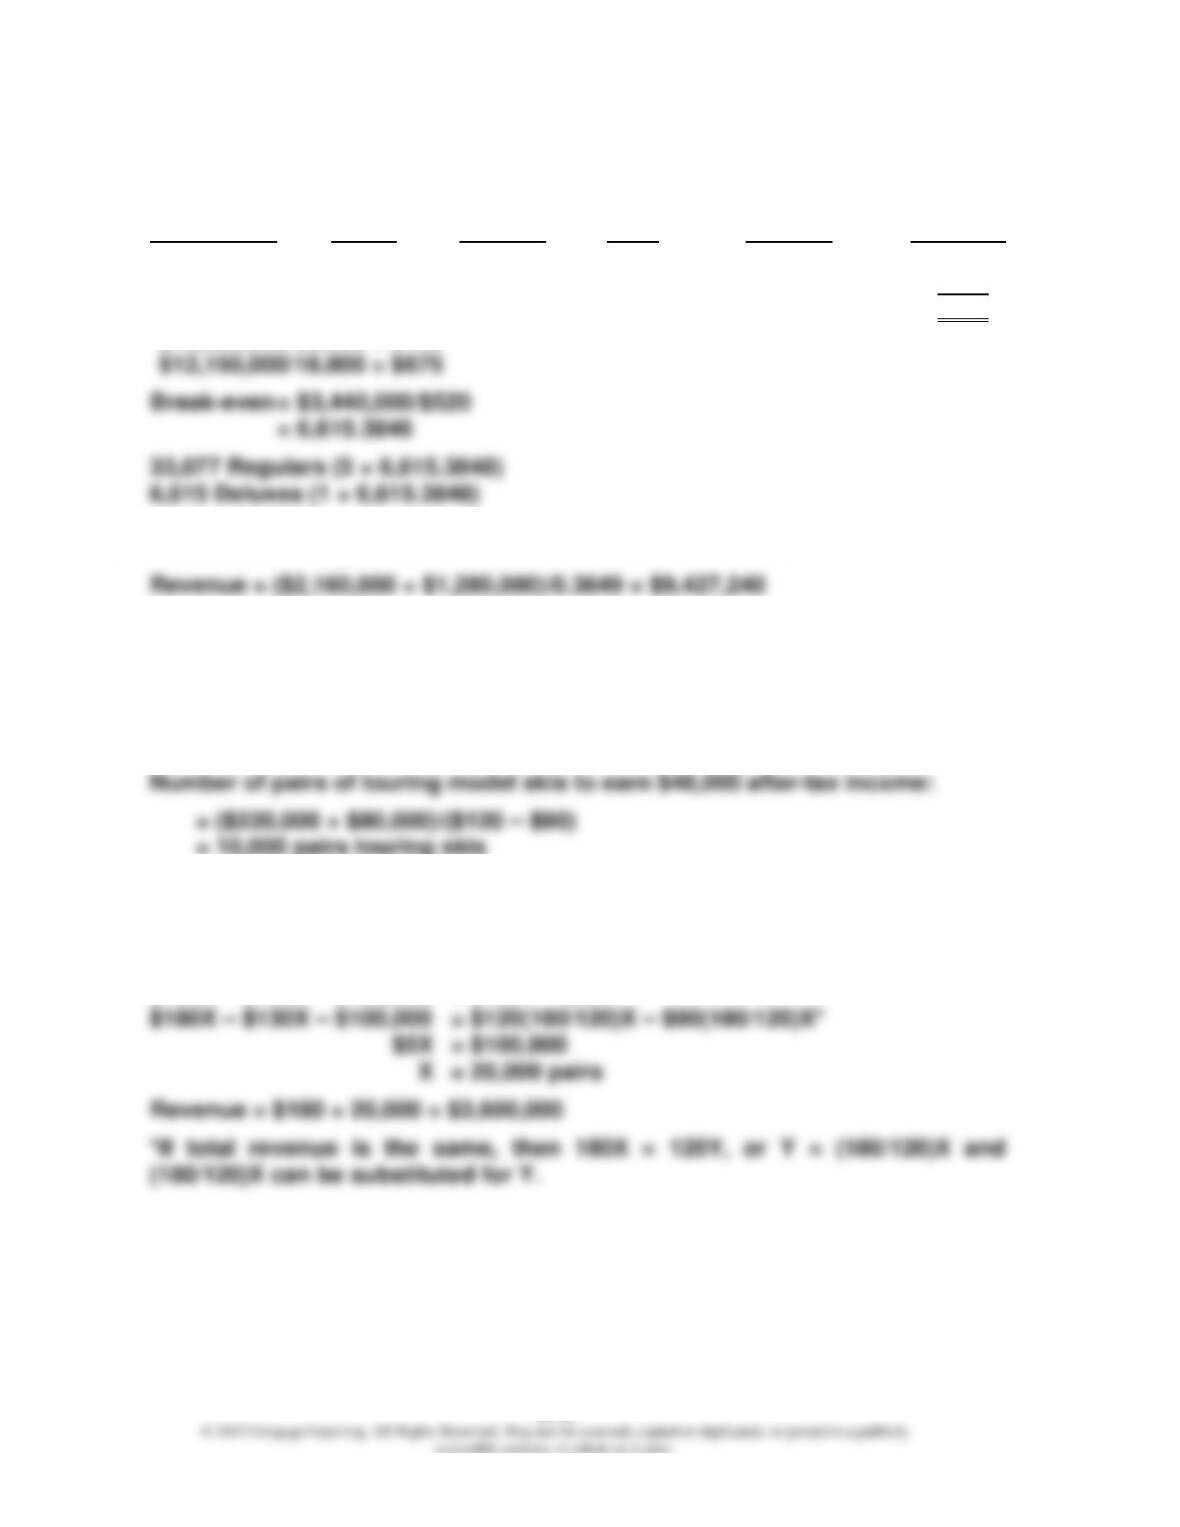
2. Trimax, Inc. Quintex, Inc.
X = $200,000/0.5* X = $350,000/0.8*
3. Trimax: 5 × 50% = 250%
Quintex: 8 × 50% = 400%
The percentage increase in profits for Quintex is higher than Trimax’s
16–16
Exercise 16.22
1. Variable Units in Package
Product Price* – Cost = CM × Mix = CM
Regular $150 $100 $ 50 5 $ 250
Deluxe 675 405 270 1 270
Total $520
*$13,500,000/90,000 = $150
2. Contribution margin ratio = $9,360,000/$25,650,000 = 0.3649
Exercise 16.23
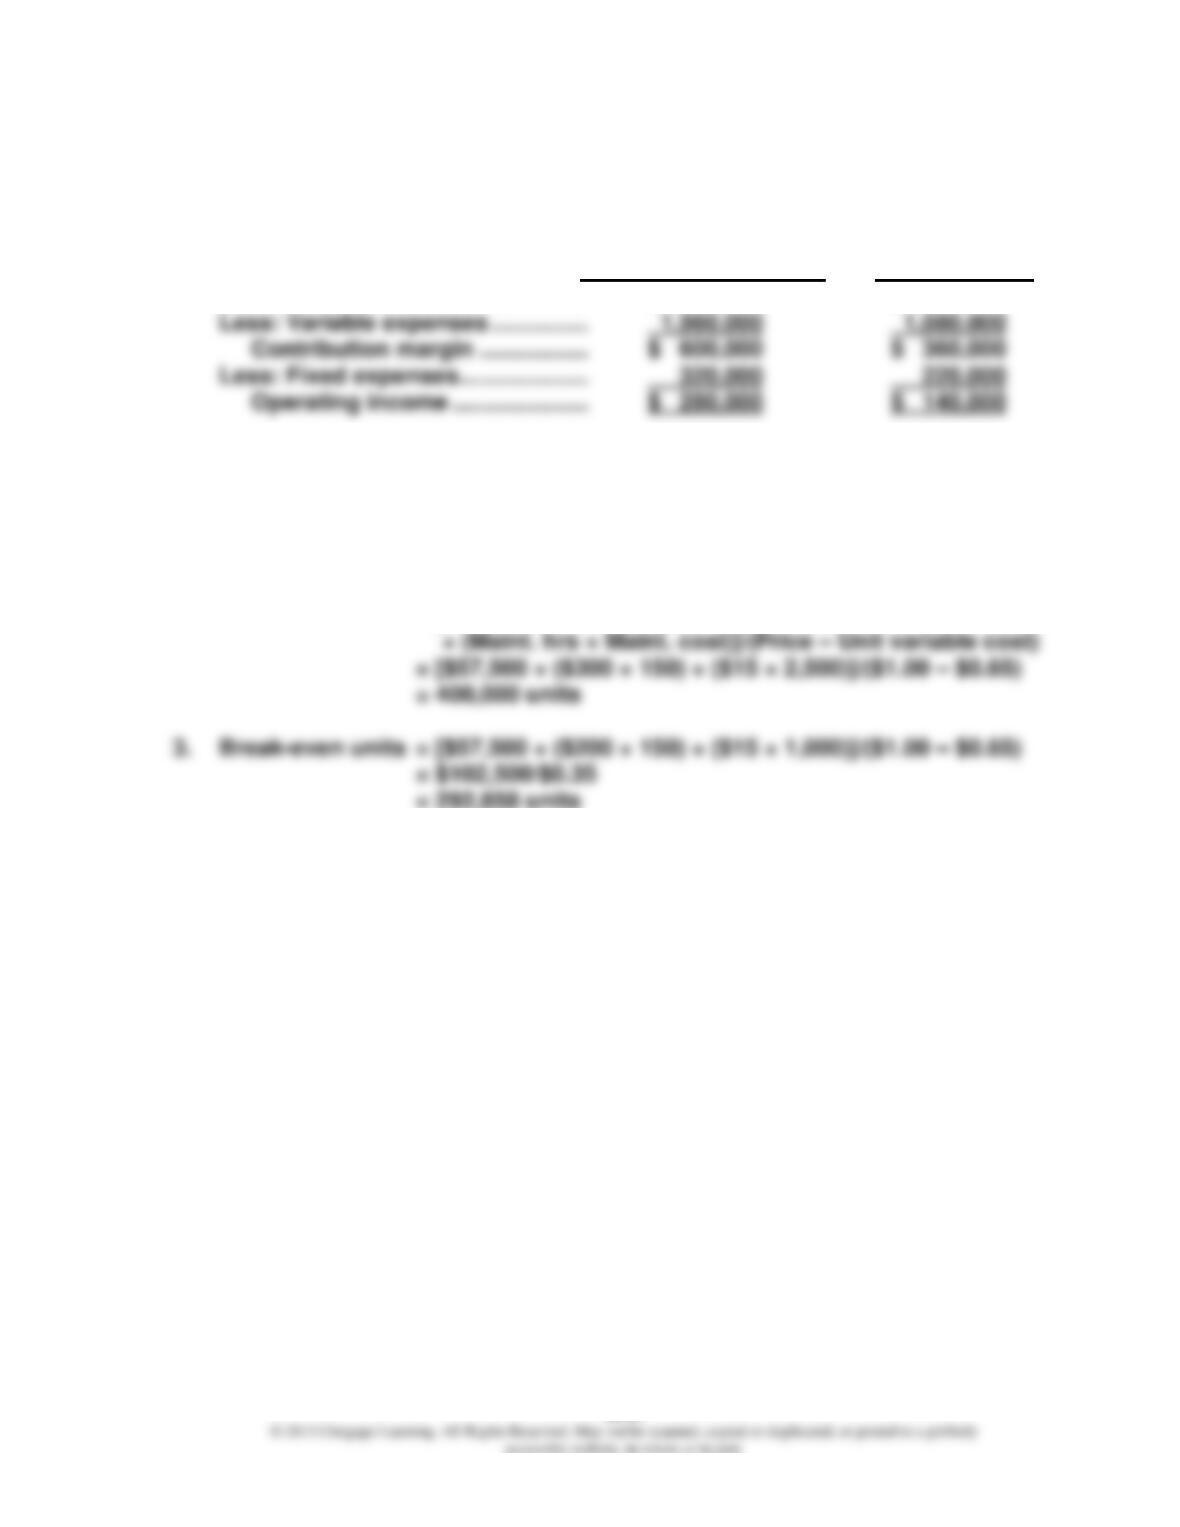
1. Before-tax income = $48,000/(1 – 0.4)
= $80,000
2. Let X = Number of pairs of mountaineering skis
and Y = Number of pairs of touring skis
$180X – $130X – $320,000 = $120Y – $90Y – $220,000
$180X – $130X – $100,000 = $120Y – $90Y
16–17
Exercise 16.23 (Concluded)
3. X-Cee-Ski Company would produce and sell 12,000 pairs of the mountaineering
skis because they are more profitable.
Mountaineering Model Touring Model
Sales ……………………………………….. $2,160,000 $1,440,000
Exercise 16.24
1. Break-even units = Fixed costs/(Price – Unit variable cost)
= $140,000/($1.00 – $0.65) = 400,000 units
2. Break-even units = [Fixed costs + (Setups × Setup cost)