CHAPTER 16 Financial Statement Analysis
Prob. 16–3B
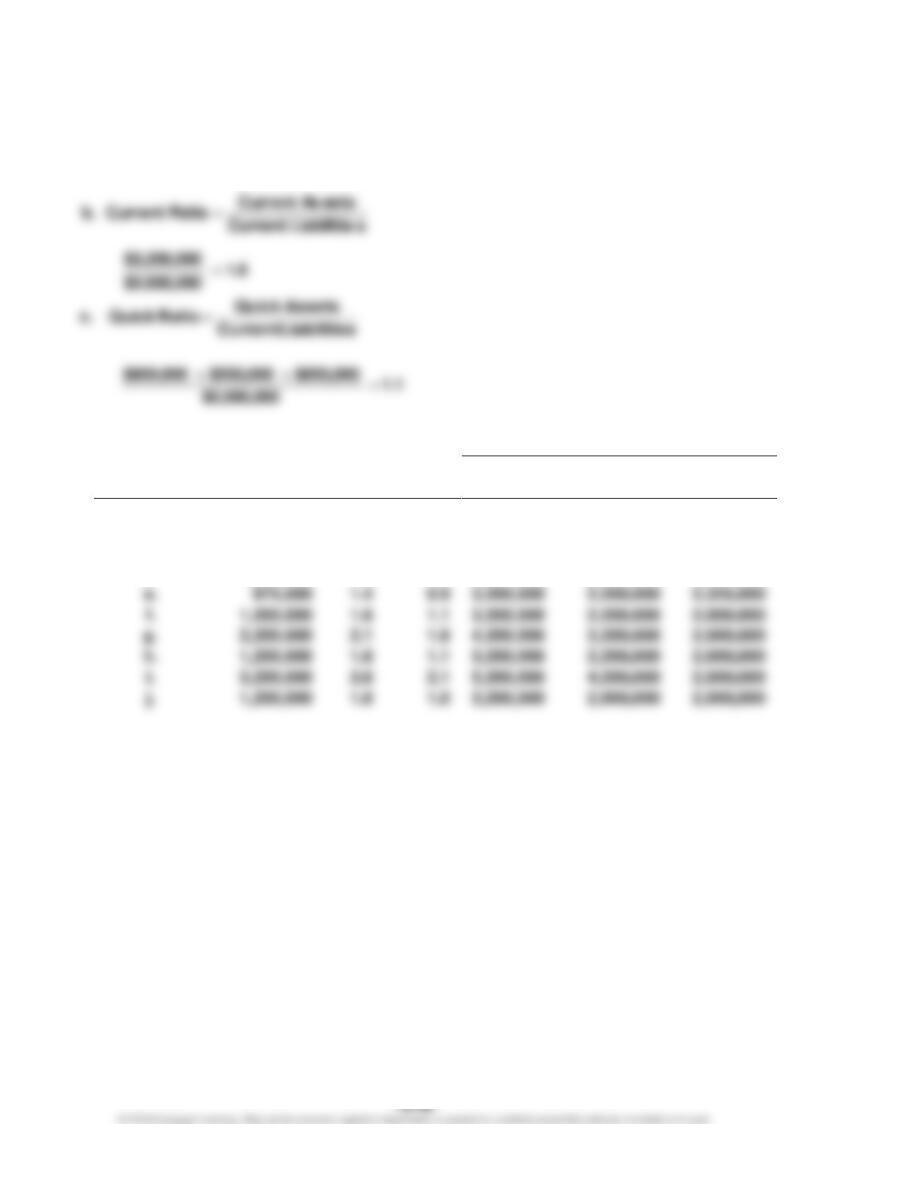
1. a. Working Capital = Current Assets – Current Liabilities
$3,200,000 – $2,000,000 = $1,200,000
2. Supporting Data
Transaction
Working
Capital
Current
Ratio
Quick
Ratio
Current
Assets
Quick
Assets
Current
Liabilities
a.
$1,200,000
1.6
1.1
$3,200,000
$2,200,000
$2,000,000
b.
1,200,000
1.7
1.1
2,912,500
1,912,500
1,712,500
c.
1,200,000
1.5
0.9
3,600,000
2,200,000
2,400,000
d.
1,200,000
1.6
1.1
3,075,000
2,075,000
1,875,000
e.
1.4
0.9
3,200,000
2,200,000
2,325,000
1,200,000
1.6
1.1
3,200,000
2,200,000
2,000,000
g.
2,200,000
2.1
1.6
4,200,000
3,200,000
2,000,000
h.
1,200,000
1.6
1.1
3,200,000
2,200,000
2,000,000
3,200,000
2.6
2.1
5,200,000
4,200,000
2,000,000
1,200,000
1.6
1.0
3,200,000
2,000,000
2,000,000
CHAPTER 16 Financial Statement Analysis
Prob.16–4B
1. Working Capital: $3,690,000 – $900,000 = $2,790,000
Calculated
Value
Ratio
Numerator
Denominator
2.
Current ratio
$3,690,000
$900,000
4.1
3.
Quick ratio
$2,250,000
$900,000
2.5
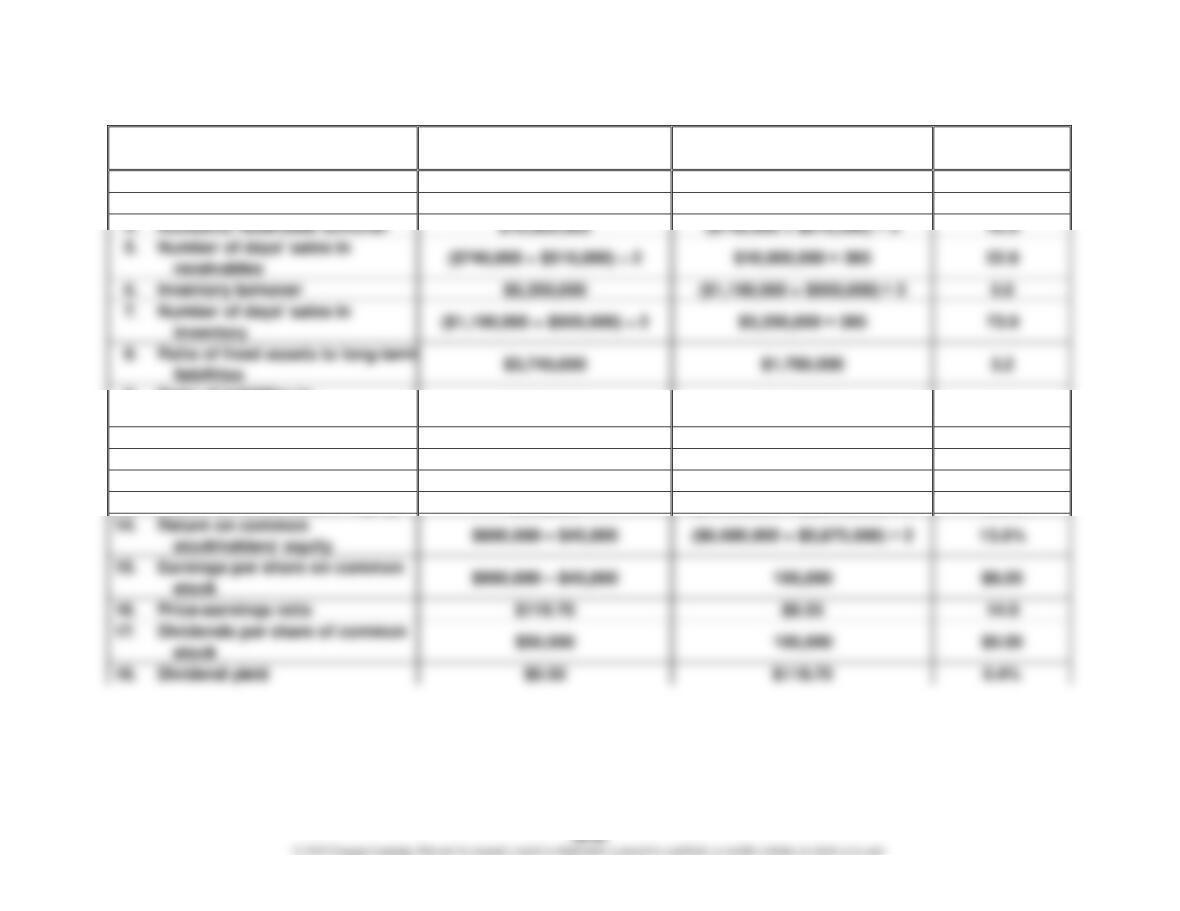
4.
Accounts receivable turnover
$10,000,000
6.
Inventory turnover
$5,350,000
5.0
7.
Number of days’ sales in
8.
Ratio of fixed assets to long-term
9.
Ratio of liabilities to
stockholders’ equity
$2,600,000
$7,180,000
0.4
10.
Times interest earned
$1,130,000 + $170,000
$170,000
7.6
11.
Asset turnover
$10,000,000
($7,430,000 + $6,455,000) ÷ 2
1.4
12.
Return on total assets
$900,000 + $170,000
($9,780,000 + $8,755,000) ÷ 2
11.5%
13.
Return on stockholders’ equity
$900,000
($7,180,000 + $6,375,000) ÷ 2
13.3%
stockholders’ equity
Earnings per share on common
16.
18.
Dividend yield
0.4%
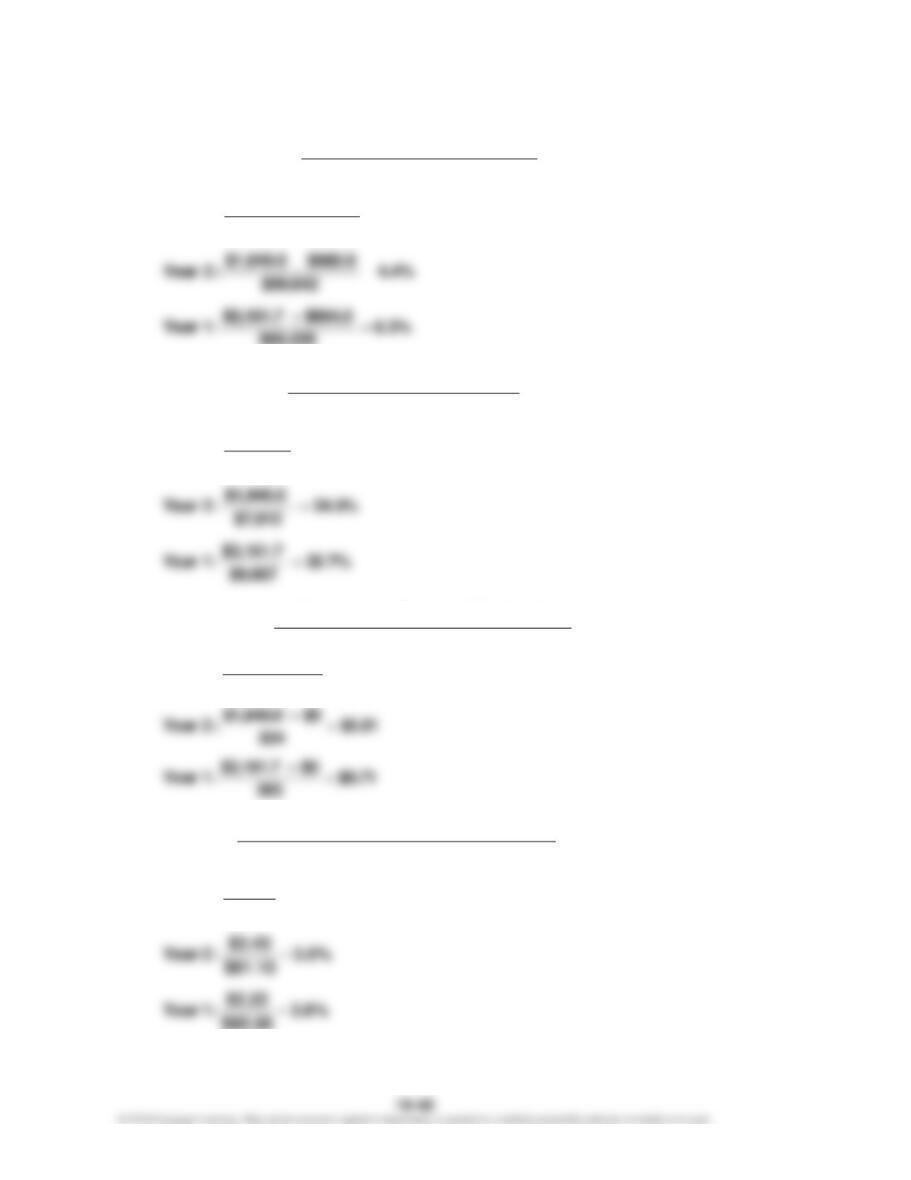
CHAPTER 16 Financial Statement Analysis
Prob. 16–5B
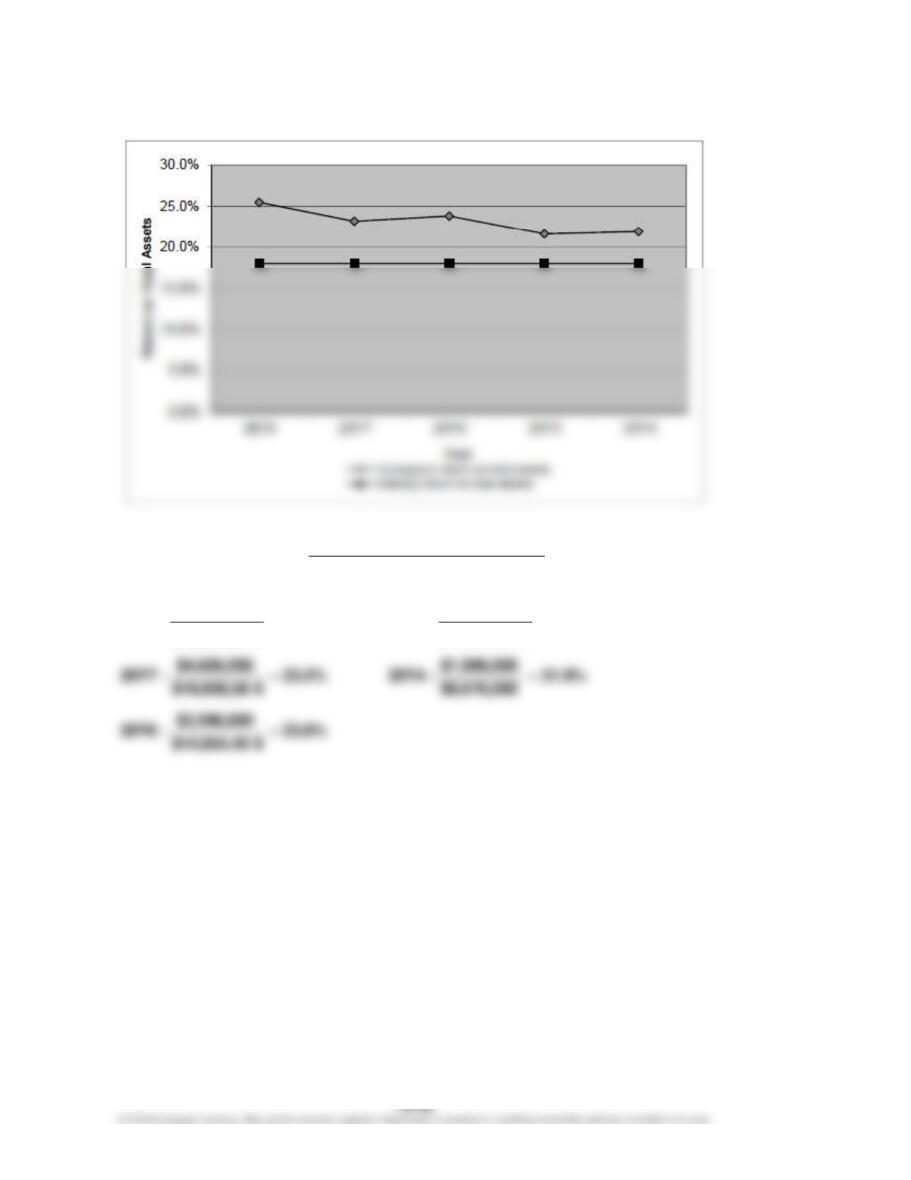
1.
a.
AssetsTotal Average
ExpenseInterest IncomeNet
AssetsTotal on Return +
=
21.6%
0$11,370,24
$2,458,000
:20Y525.5%
5$25,988,66
$6,623,780
:20Y8
==
CHAPTER 16 Financial Statement Analysis
Prob. 16–5B (Continued)
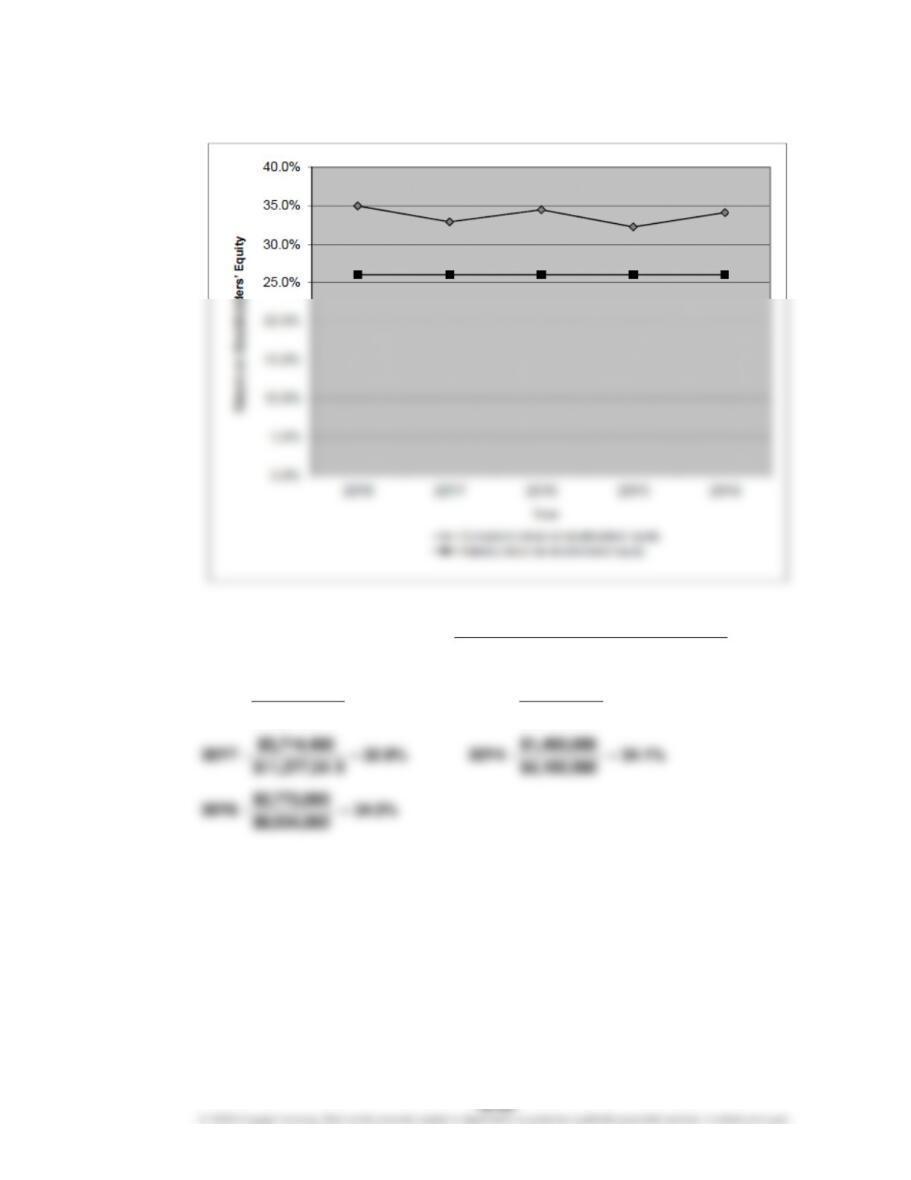
1.
b.
Equity rs’Stockholde Total Average
IncomeNet
Equity rs’Stockholde on Return =
32.3%
$5,724,000
$1,848,000
:20Y535.0%
0$15,920,34
$5,571,720
:20Y8
==
CHAPTER 16 Financial Statement Analysis
Prob. 16–5B (Continued)
1.
c.
ExpenseInterest
ExpenseInterest Expense Tax Income IncomeNet
EarnedInterest Times ++
=
4.8
$610,000
$2,899,600
:20Y57.5
$1,052,060
$7,849,352
:20Y8
==
CHAPTER 16 Financial Statement Analysis
Prob. 16–5B (Continued)
1.
d.
Equity rs’Stockholde Total
sLiabilitie Total
Equity rs’Stockholde
to sLiabilitie of Ratio =
0.9
$6,648,000
$5,940,480
:20Y50.6
0$18,706,20
1$10,672,29
:20Y8
==
CHAPTER 16 Financial Statement Analysis
Prob. 16–5B (Concluded)
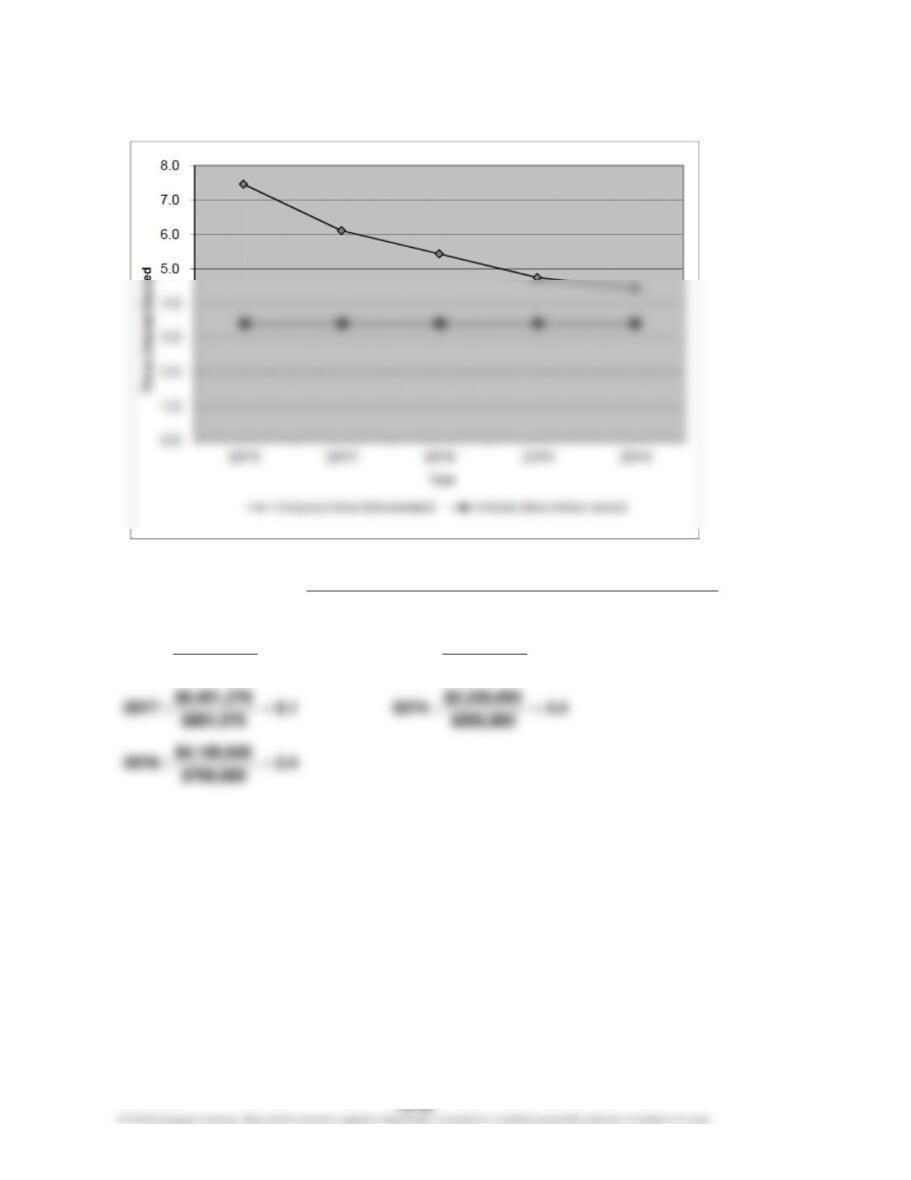
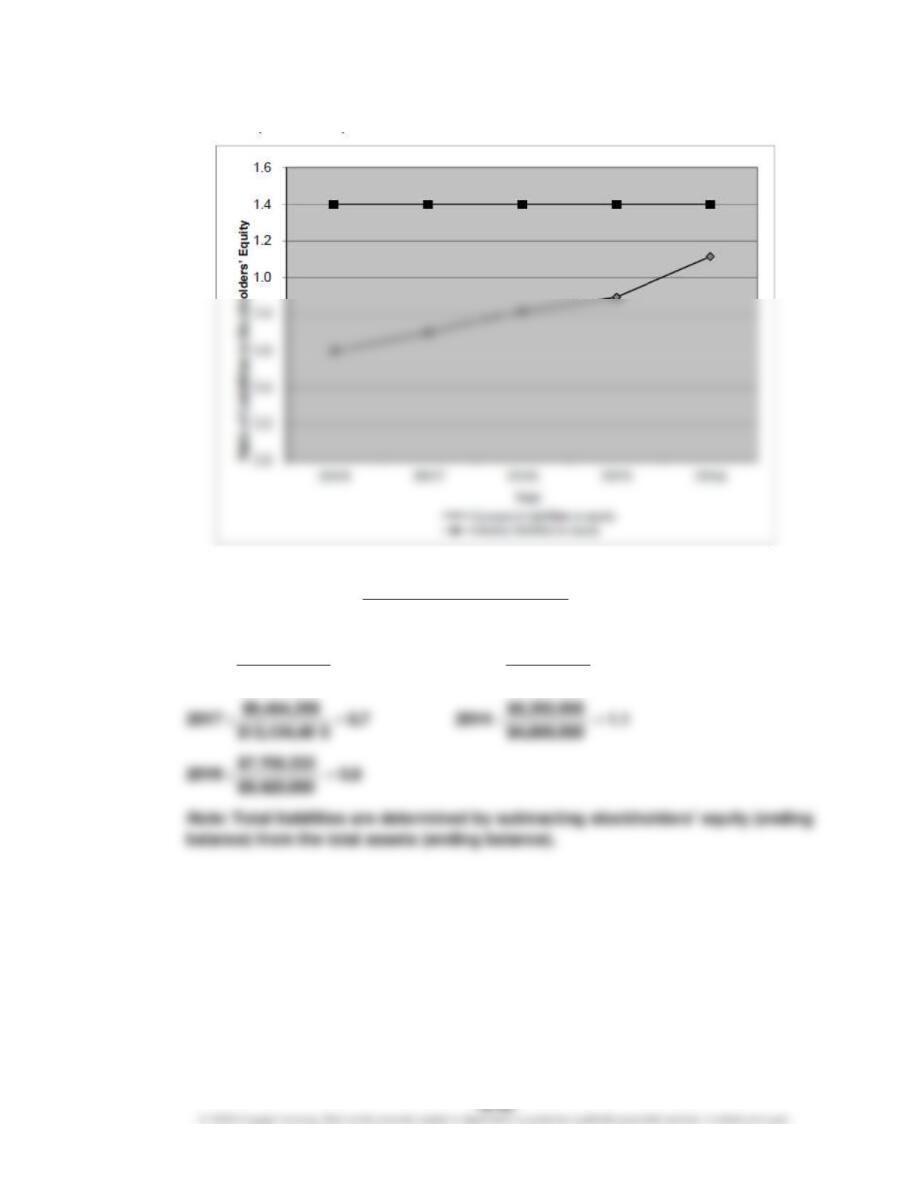
2. Both the return on total assets and the return on stockholders’ equity are above the
industry average for all five years. The return on total assets is actually improving
gradually. The return on stockholders’ equity exceeds the return earned on total assets,
CHAPTER 16 Financial Statement Analysis
MAKE A DECISION
MAD 16–1
1.
Amazon
Best Buy
Wal-Mart
Sales
100.0%
100.0%
100.0%
Cost of sales
(64.9)%
(76.0)%
(74.4)%
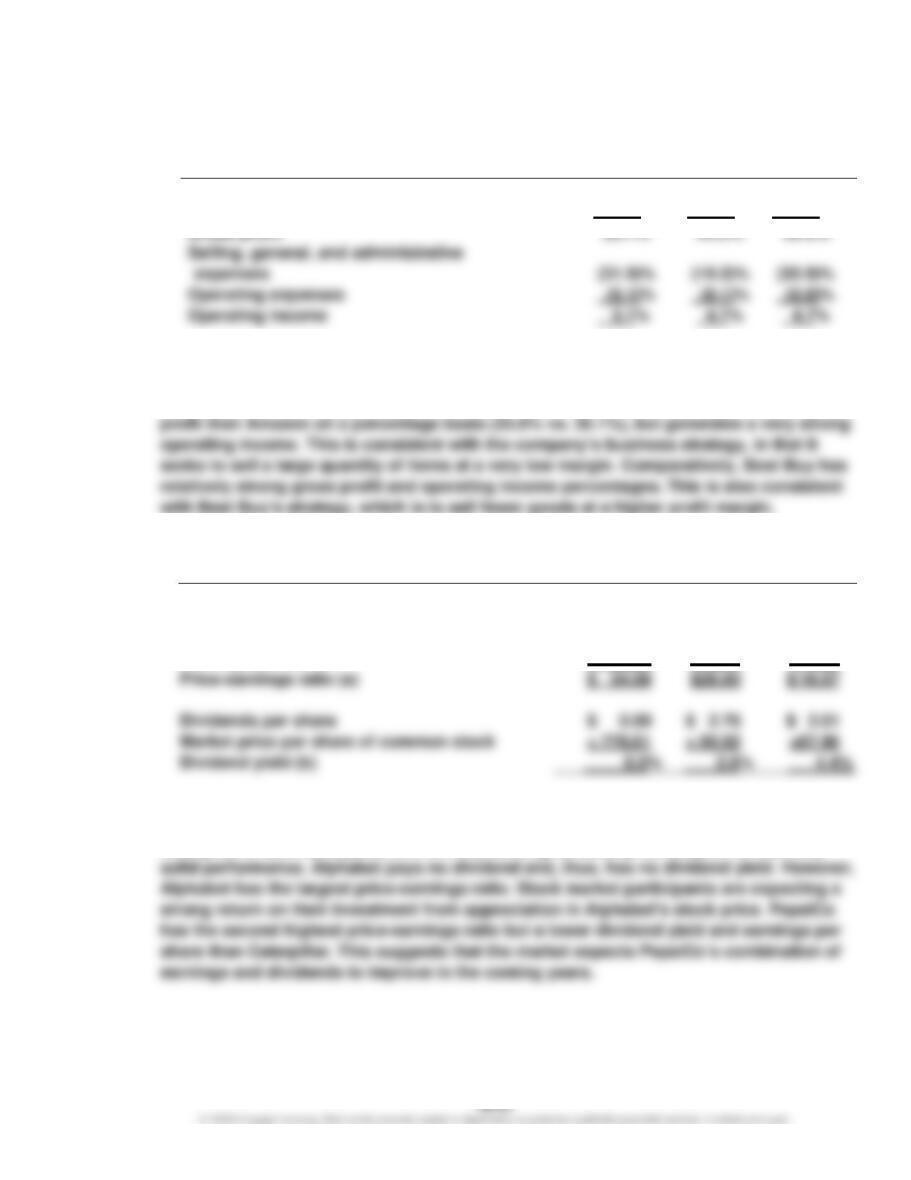
Selling, general, and administrative
Operating expenses
2. Amazon has the highest gross profit on a percentage basis, but has the lowest operating
income on a percentage basis. This is because of the relatively large percentage of sales
that is used for selling, general, and administrative activities. Wal-Mart has a lower gross
with Best Buy’s strategy, which is to sell fewer goods at a higher profit margin.
MAD 16–2
1.
Alphabet
PepsiCo
Caterpillar
Earnings per share
$ 22.84
$ 3.71
$ 4.23
Market price per share of common stock
Earnings per share
Price-earnings ratio (a)
$ 34.06
$ 16.07
Market price per share of common stock
Dividend yield (b)
÷ 778.01
$ 778.01
÷ 22.84
$99.92
÷ 3.71
$67.96
÷ 4.23
2. Caterpillar has the largest dividend yield and strong earnings per share but has the
lowest price-earnings ratio. Stock market participants seem to be skeptical about
Caterpillar’s future prospects and are discounting its stock price despite its relatively
CHAPTER 16 Financial Statement Analysis
MAD 16–3
1. a.
b.
c.
d.
AssetsTotal Average
ExpenseInterest IncomeNet
AssetsTotal on Return +
=
$60,429
3.9%
$57,965
$763.7 $1,523.9
:3 Year
=
+
Equity rs’Stockholde Average
IncomeNet
Equity rs’Stockholde
Total on Return =
22.9%
$6,644
$1,523.9
:3 Year
=
gOutstandin Stock Common of Shares
Dividends Preferred – IncomeNet
Share per Earnings =
$4.84
315
$0 – $1,523.9
:3 Year
=
Stock Common of Share per PriceMarket
Stock Common of Share per Dividend
Yield Dividend =
$85.58
2.6%
$92.03
$2.40
:3 Year
=
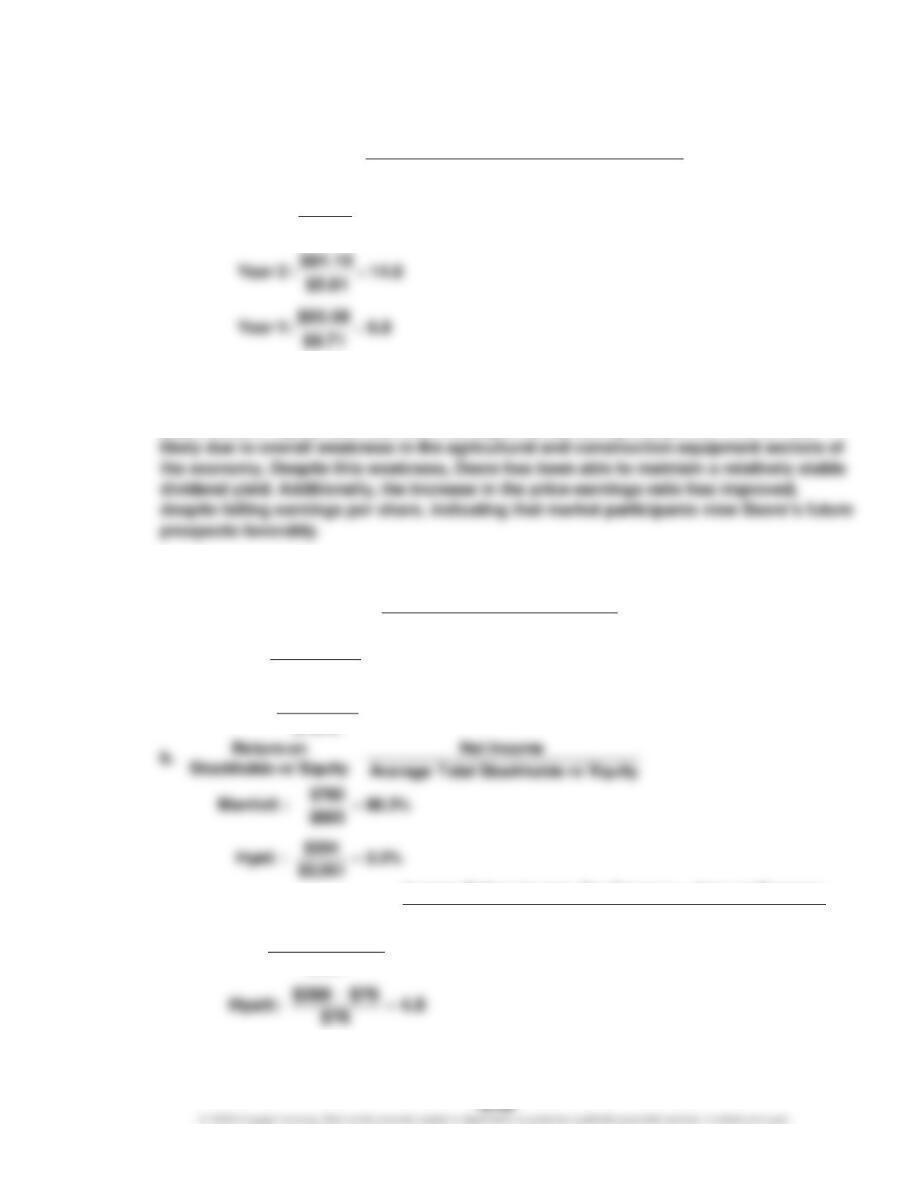
CHAPTER 16 Financial Statement Analysis
MAD 16–3 (Concluded)
e.
2. Deere’s profitability, as measured by earnings per share, has declined significantly
during the three-year period presented. The returns on total assets and total
stockholders’ equity have also declined significantly during this period. This is most
MAD 16–4
1. a.
c.
Share per Earnings
Stock Common of Share per PriceMarket
Ratio Earnings–Price =
19.0
$4.84
$92.03
:3 Year
=
AssetsTotal Average
ExpenseInterest IncomeNet
AssetsTotal on Return +
=
3.7%
$76 $204
:Hyatt
6.7%
$15,111
$234 $780
:Marriott
=
+
=
+
ExpenseInterest
ExpenseInterest Expense Tax Income Before Income
EarnedInterest Times +
=
6.1
$234
$234 $1,184
:Marriott
=
+
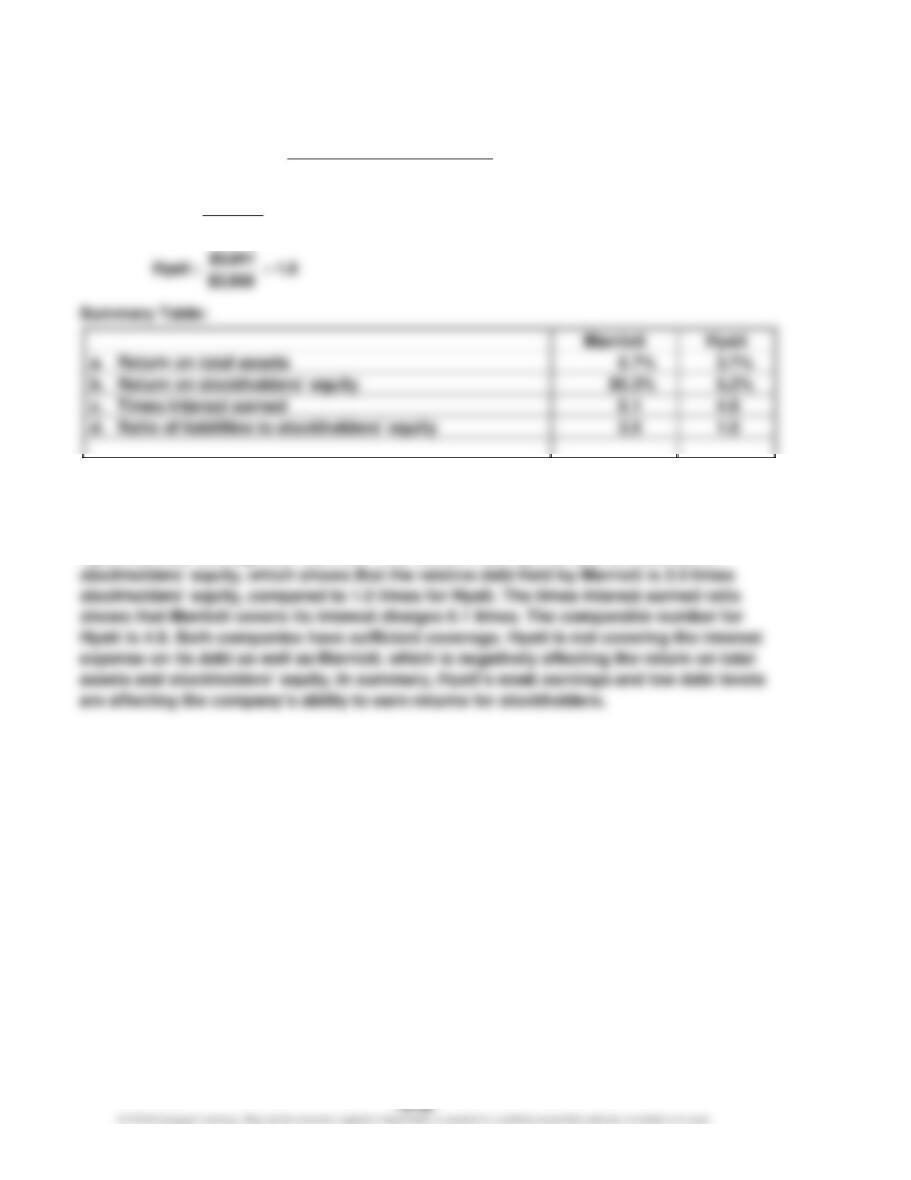
CHAPTER 16 Financial Statement Analysis
MAD 16–4 (Concluded)
d.
2. Marriott has a higher return on total assets (6.7% vs. 3.7%) and a higher return on
stockholders’ equity (88.3% vs. 5.2%) compared to Hyatt. Hyatt’s weaker performance
relative to Marriott’s appears to be due to its weak earnings relative to its debt level.
Hyatt has less leverage than Marriott. This is confirmed by the ratio of liabilities to
Equity rs’Stockholde Total
sLiabilitie Total
Equity rs’Stockholde
to sLiabilitie of Ratio =
3.5
$5,357
$18,783
:Marriott
=
CHAPTER 16 Financial Statement Analysis
TAKE IT FURTHER
TIF 16–1
No, Josh did not behave ethically. The Sarbanes-Oxley Act of 2002 requires a report on
internal control by management. This report acknowledges management’s responsibility for
CHAPTER 16 Financial Statement Analysis
TIF 16–2
Fiscal
2017
Fiscal
2016
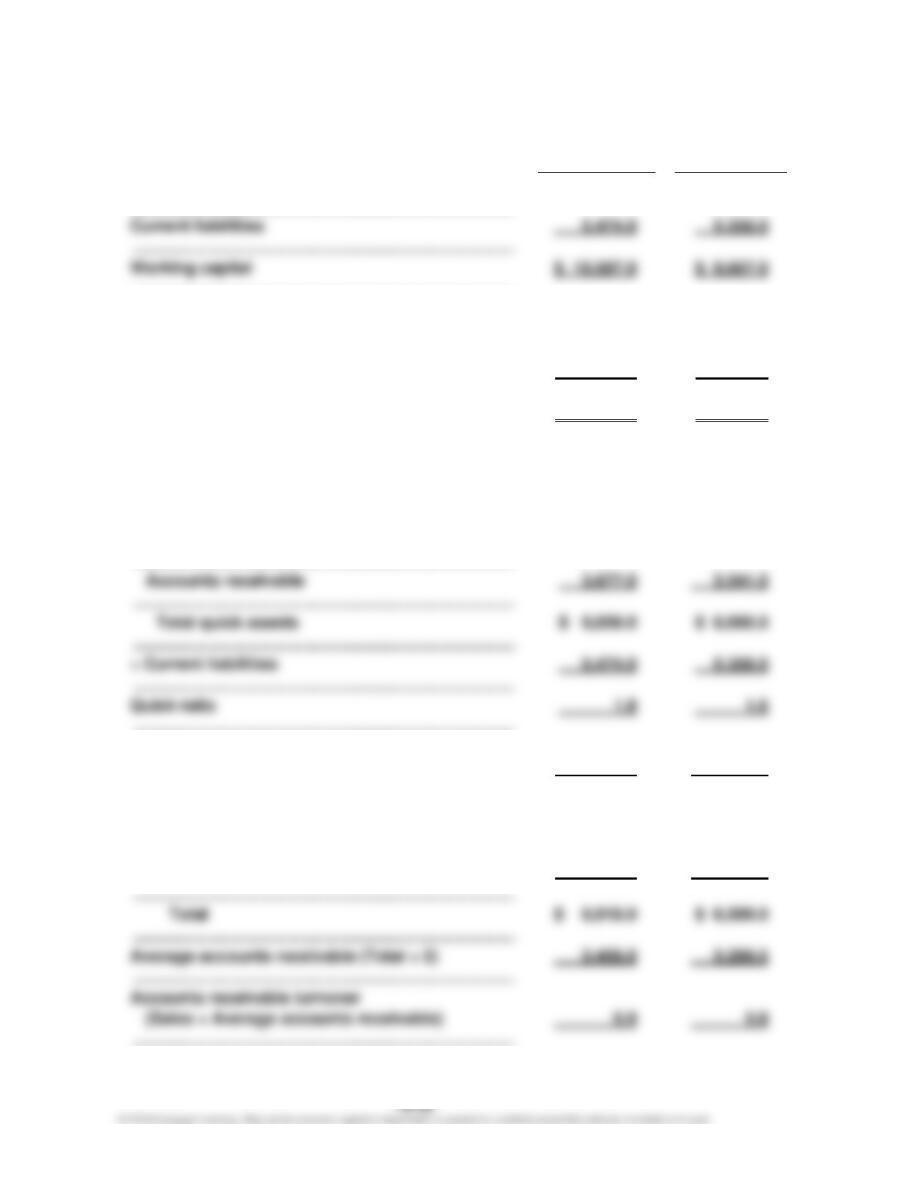
1.
a.
Current assets
…………………………..…………………………………………..
$ 16,061.0
$15,025.0
Current liabilities
…………………………..…………………………………………..
5,474.0
Working capital
$ 10,587.0
$ 9,667.0
…………………………..…………………………………………..
b.
Current assets
…………………………..…………………………………………..
$ 16,061.0
$15,025.0
÷ Current liabilities
…………………………..…………………………………………..
5,474.0
5,358.0
Current ratio
…………………………..…………………………………………..
2.9
2.8
c.
Quick assets:
Cash
…………………………..…………………………………………..
$ 3,808.0
$ 3,138.0
Short-term investments
…………………………..…………………………………………..
Accounts receivable
…………………………..…………………………………………..
3,241.0
…………………………..…………………………………………..
$ 8,698.0
÷ Current liabilities
…………………………..…………………………………………..
5,358.0
Quick ratio
1.6
2,371.0
2,319.0
…………………………..…………………………………………..
d.
Sales
…………………………..…………………………………………..
$ 34,350.0
$ 32,376.0
Accounts receivable (net):
Beginning of year
…………………………..…………………………………………..
$ 3,241.0
$ 3,358.0
End of year
…………………………..…………………………………………..
…………………………..…………………………………………..
$ 6,918.0
$ 6,599.0
Average accounts receivable (Total ÷ 2)
…………………………..…………………………………………..
3,459.0
3,299.5
Accounts receivable turnover
…………………………..…………………………………………..
3,677.0
3,241.0
CHAPTER 16 Financial Statement Analysis
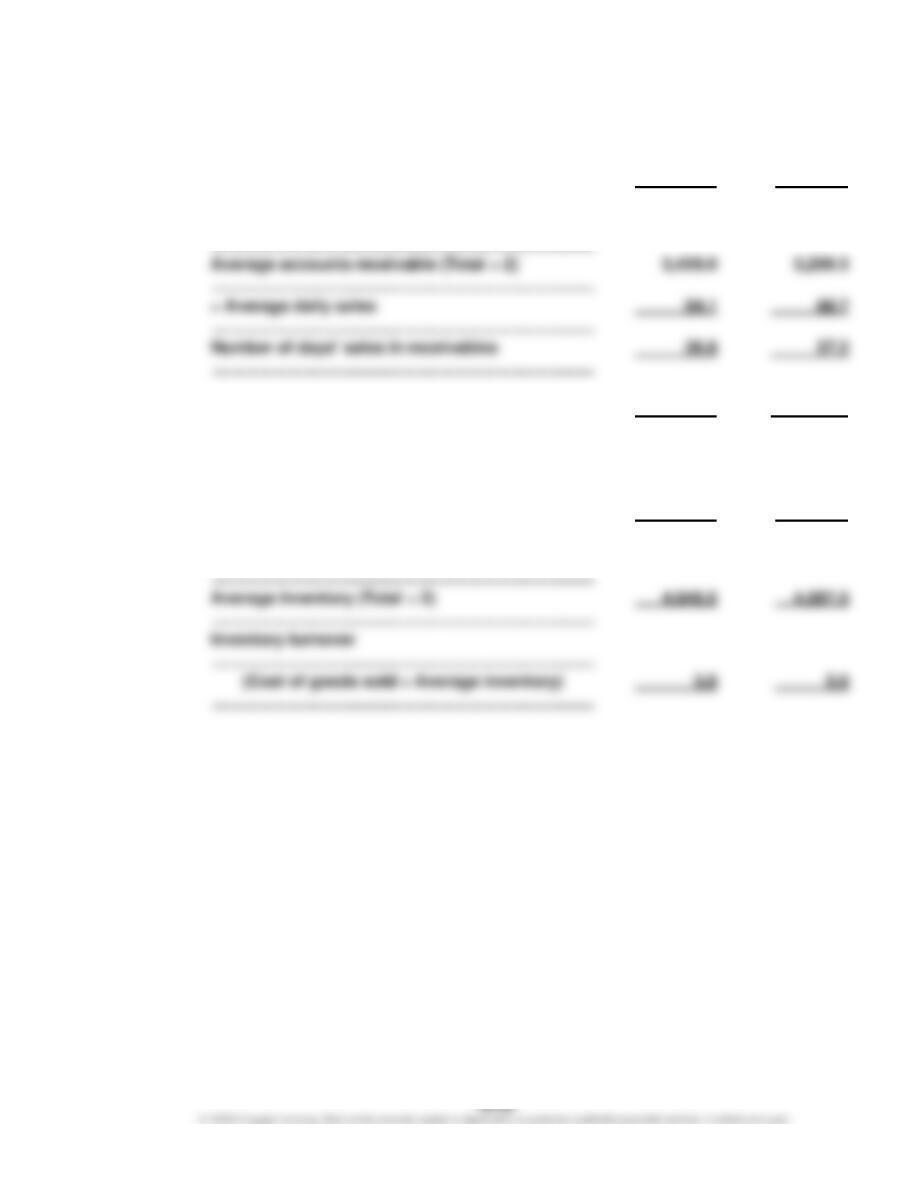
e.
Average daily sales:
Sales
……………………………………………………………………….
$ 34,350.0
$32,376.0
÷ 365
……………………………………………………………………….
365
365
Average daily sales (Sales ÷ 365)
……………………………………………………………………….
Average accounts receivable (Total ÷ 2)
……………………………………………………………………….
÷ Average daily sales
……………………………………………………………………….
94.1
……………………………………………………………………….
94.1
88.7
f.
Cost of goods sold
……………………………………………………………………….
$ 19,038.0
$17,405.0
Inventories:
Beginning of year
……………………………………………………………………….
$ 4,838.0
$ 4,337.0
End of year
……………………………………………………………………….
5,055.0
4,838.0
Total
……………………………………………………………………….
……………………………………………………………………….
Inventory turnover
……………………………………………………………………….
……………………………………………………………………….
3.8
$ 9,893.0
$ 9,175.0
CHAPTER 16 Financial Statement Analysis
TIF 16–2 (Continued)
Fiscal
2017
Fiscal
2016
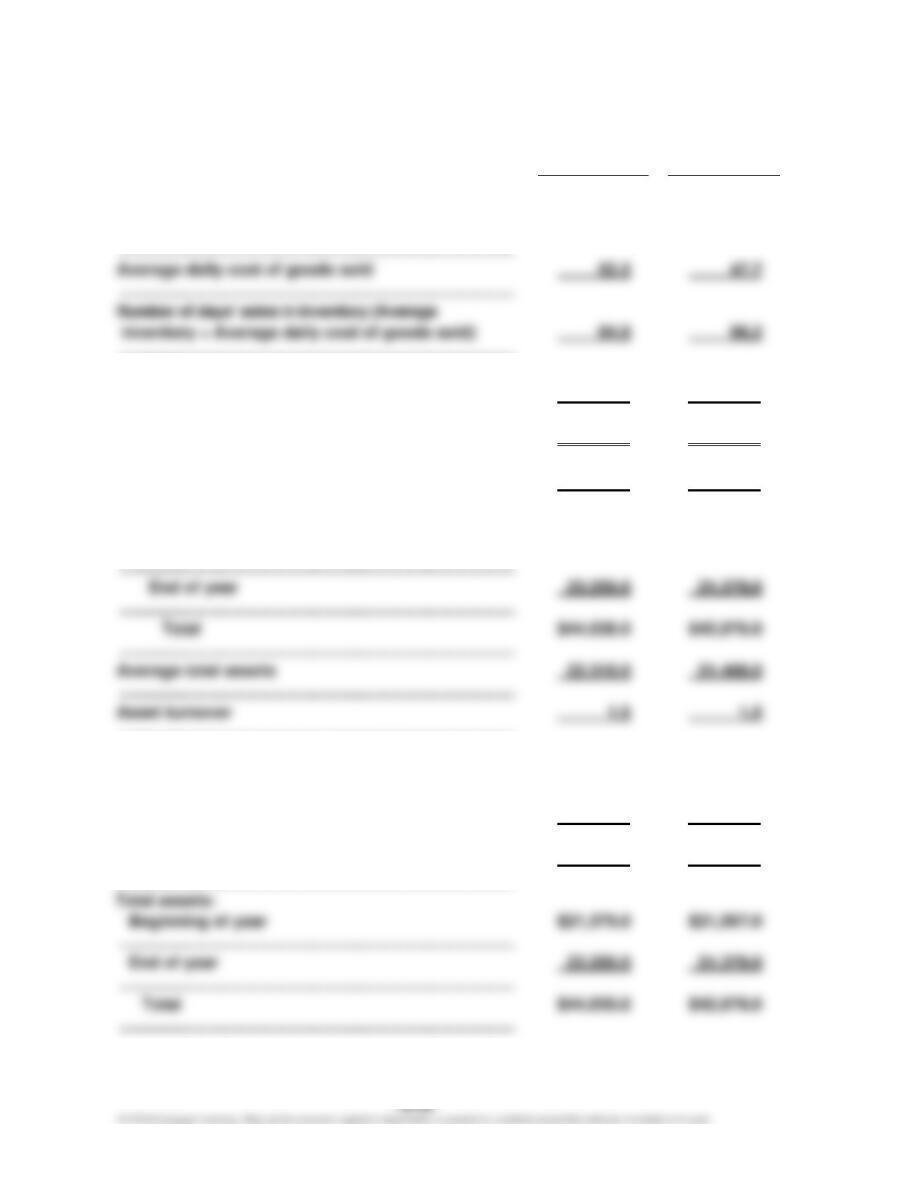
g.
Inventory (average)
………………………………………………………………………….
$ 4,946.5
$ 4,587.5
Cost of goods sold
………………………………………………………………………….
Average daily cost of goods sold
………………………………………………………………………….
52.2
Number of days’ sales in inventory (Average
94.8
19,038.0
17,405.0
………………………………………………………………………….
h.
Total liabilities
$10,852.0
$ 9,121.0
÷ Total stockholders’ equity
………………………………………………………………………….
12,407.0
12,258.0
Ratio of liabilities to stockholders’ equity
………………………………………………………………………….
0.9
0.7
i.
Sales
………………………………………………………………………….
$34,350.0
$32,376.0
Total assets (excluding long-term investments):
Beginning of year
………………………………………………………………………….
………………………………………………………………………….
$44,638.0
Average total assets
………………………………………………………………………….
22,319.0
21,488.0
Asset turnover
1.5
$21,379.0
$21,597.0
………………………………………………………………………….
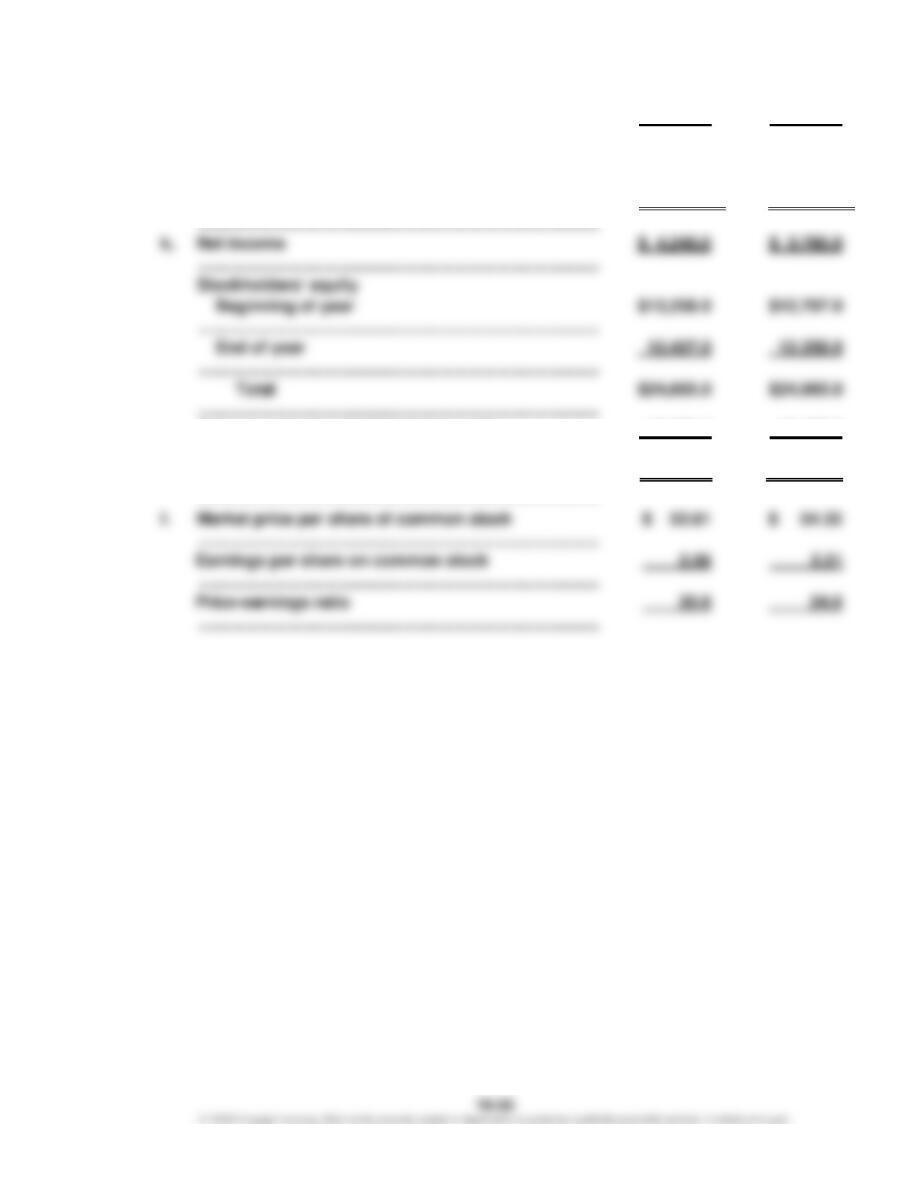
j.
Net income
………………………………………………………………………….
$ 4,240.0
$ 3,760.0
Interest expense
………………………………………………………………………….
82.0
33.0
Total
………………………………………………………………………….
$ 4,322.0
$ 3,793.0
Beginning of year
………………………………………………………………………….
$21,379.0
$21,597.0
………………………………………………………………………….
23,259.0
21,379.0
………………………………………………………………………….
CHAPTER 16 Financial Statement Analysis
Average total assets
…………………………………………………………………………..
22,319.0
21,488.0
Return on total assets
[(Net income + Interest expense) ÷
Average total assets]
Net income
…………………………………………………………………………..
…………………………………………………………………………..
…………………………………………………………………………..
$24,665.0
19.4%
17.7%
Average common stockholders’ equity
…………………………………………………………………………..
12,332.5
12,482.5
Return on common stockholders’ equity
Market price per share of common stock
$ 54.35
…………………………………………………………………………..
2.21
34.4%
30.1%
CHAPTER 16 Financial Statement Analysis
TIF 16–2 (Concluded)
Fiscal
2017
Fiscal
2016
m.
Net income
Net income to sales
$ 4,240.0
$ 3,760.0
2. Before reaching definitive conclusions, each measure should be compared with past
years, industry averages, and similar firms in the industry.
a. The working capital increased between 2016 and 2017.
b. and c. The current and quick ratios both increased during 2017.
h. The margin of protection to creditors declined slightly as liabilities increased relative
to stockholders’ equity. Overall, Nike still provides sound protection to its creditors.
i. These analyses indicate that the effectiveness in the use of assets to generate
revenues was very similar in both years.
j. The return on total assets increased during 2017. This increase was from Nike’s net
income increasing at a faster pace than total assets during 2017. Overall, returns on
CHAPTER 16 Financial Statement Analysis
TIF 16–3
To: Boss Freeman
From: A+ Student
Re: Debt vs. Equity Financing
I have reviewed your company history and appreciate the challenges your company has
faced during economic downturns. While your conservative approach to debt financing is
commendable, your unwillingness to issue debt could limit your potential for future success.
Financing future growth exclusively through retained earnings and additional stock sales
does not allow the shareholders to take advantage of leverage. As a result, the return on