Ch. 16: General Ledger and Reporting System
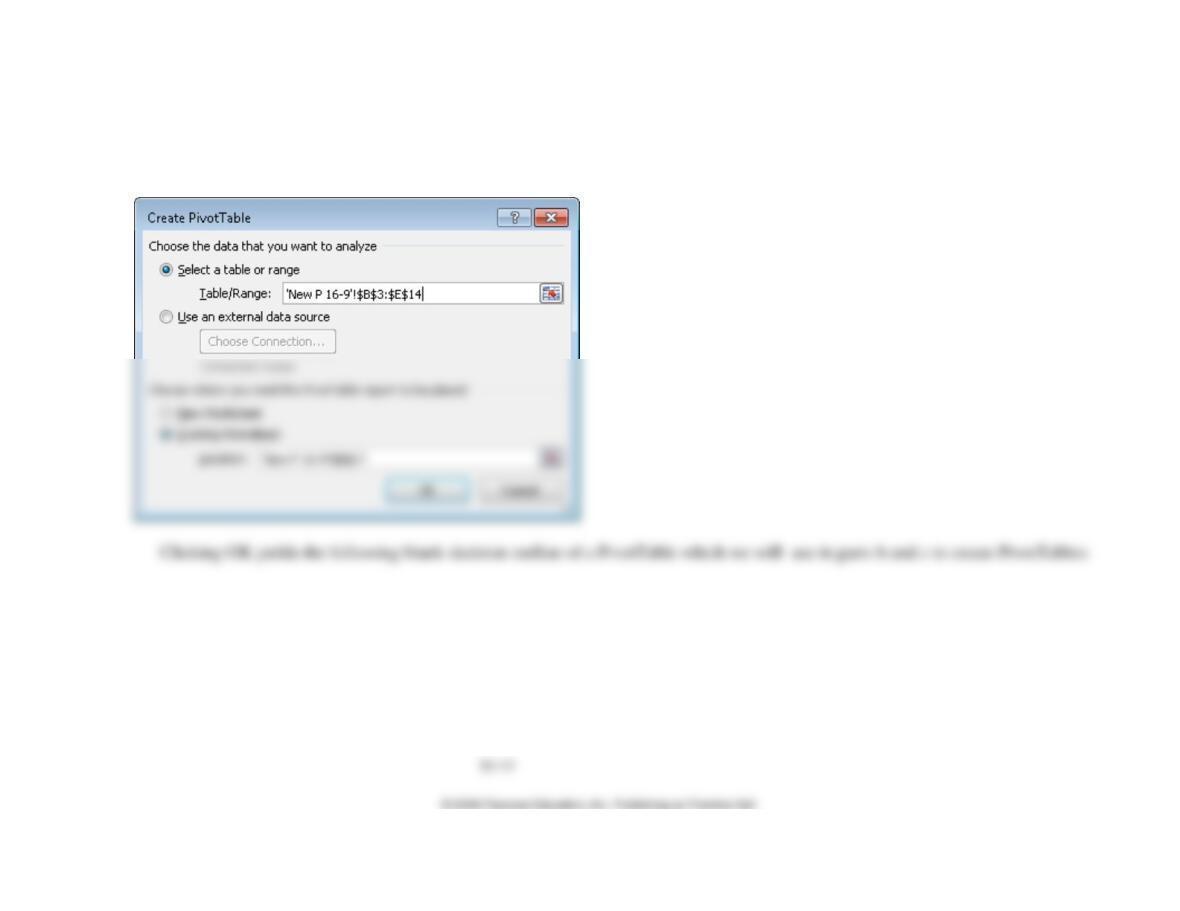
Next, highlight the cells containing the data as shown:
Accounting Information Systems
Ch. 16: General Ledger and Reporting System
16–16
b. Print out a report that shows sales by month for each salesperson.
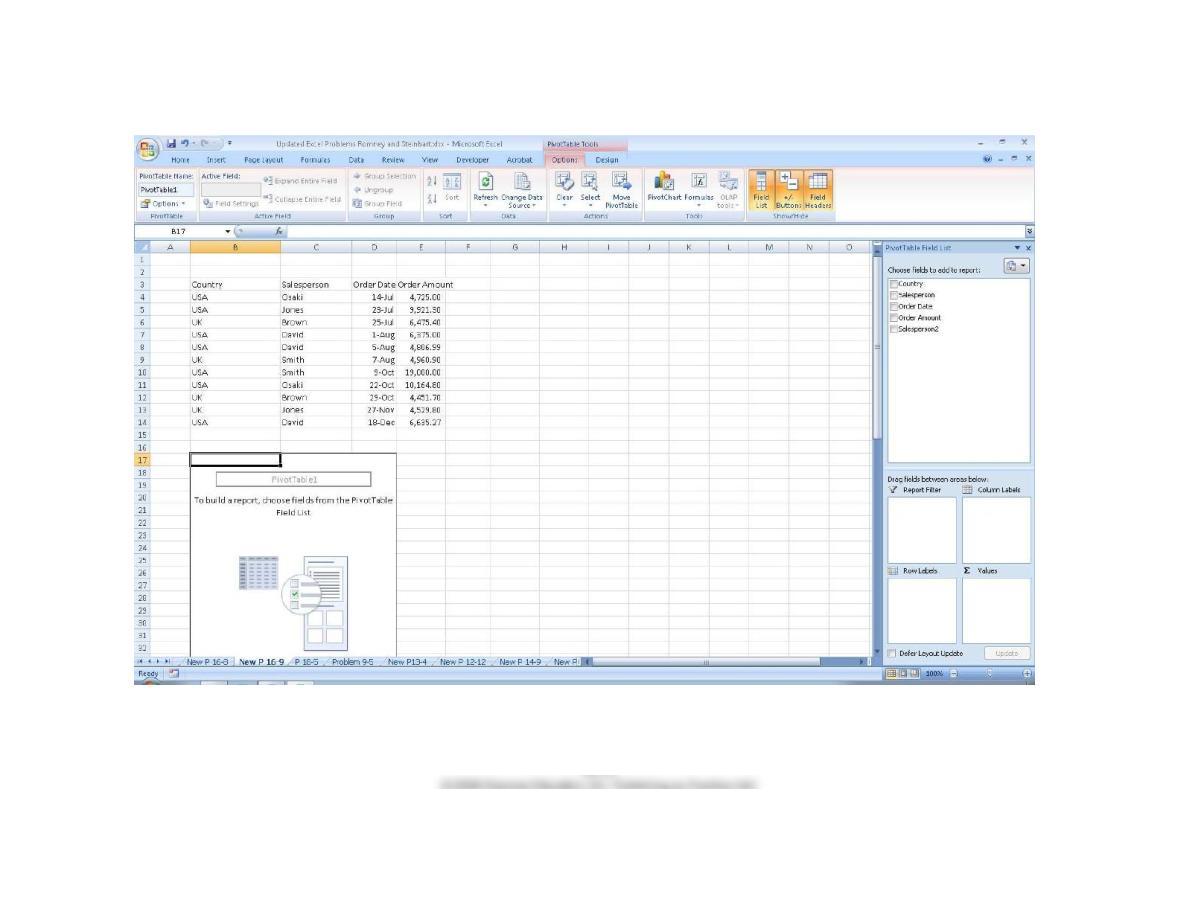
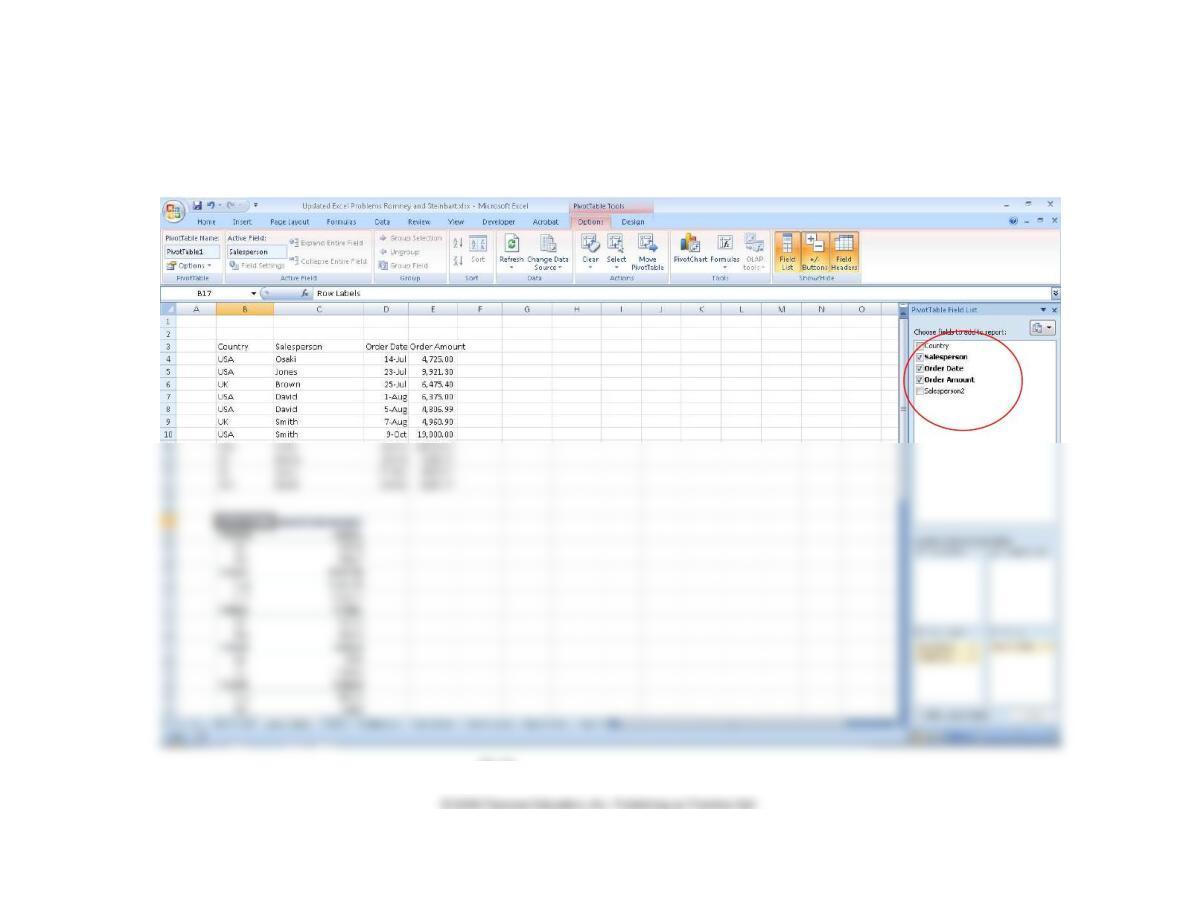
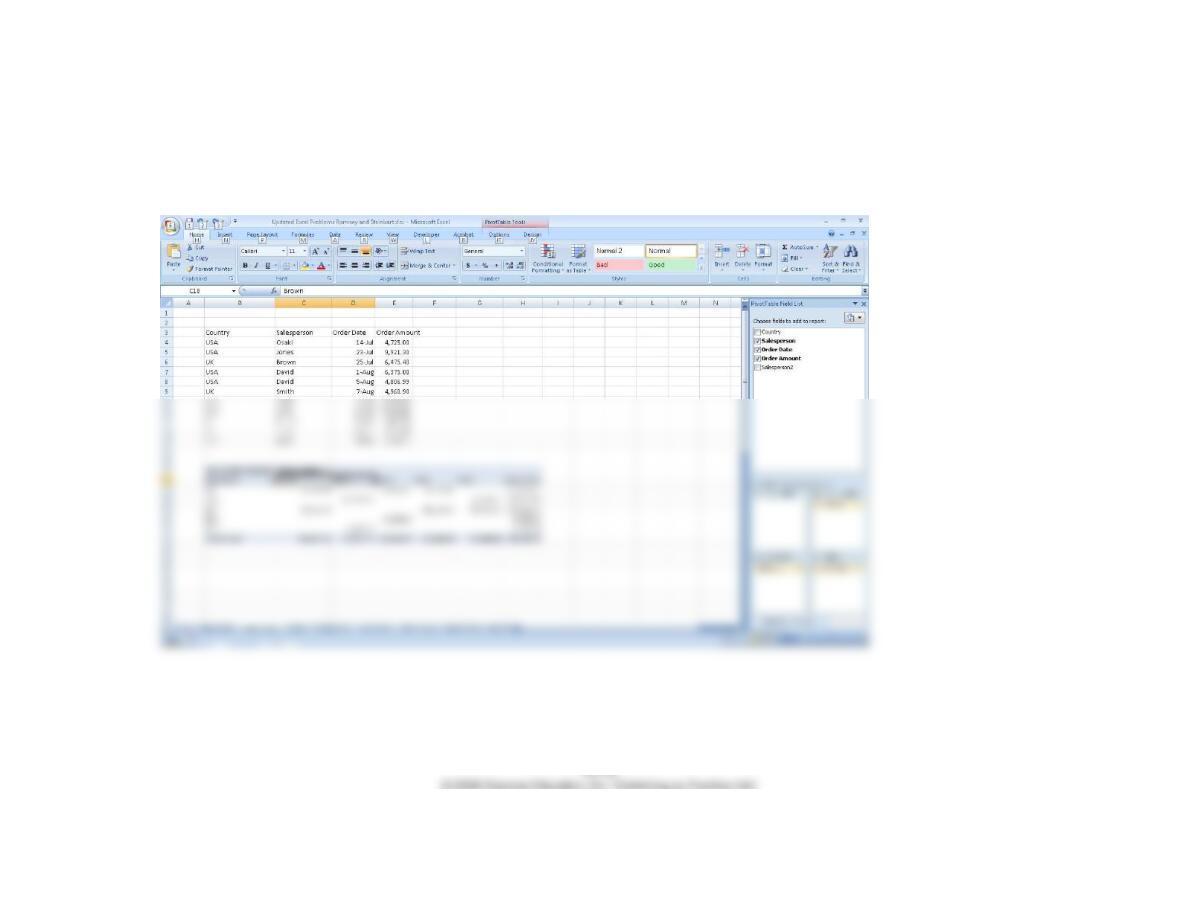
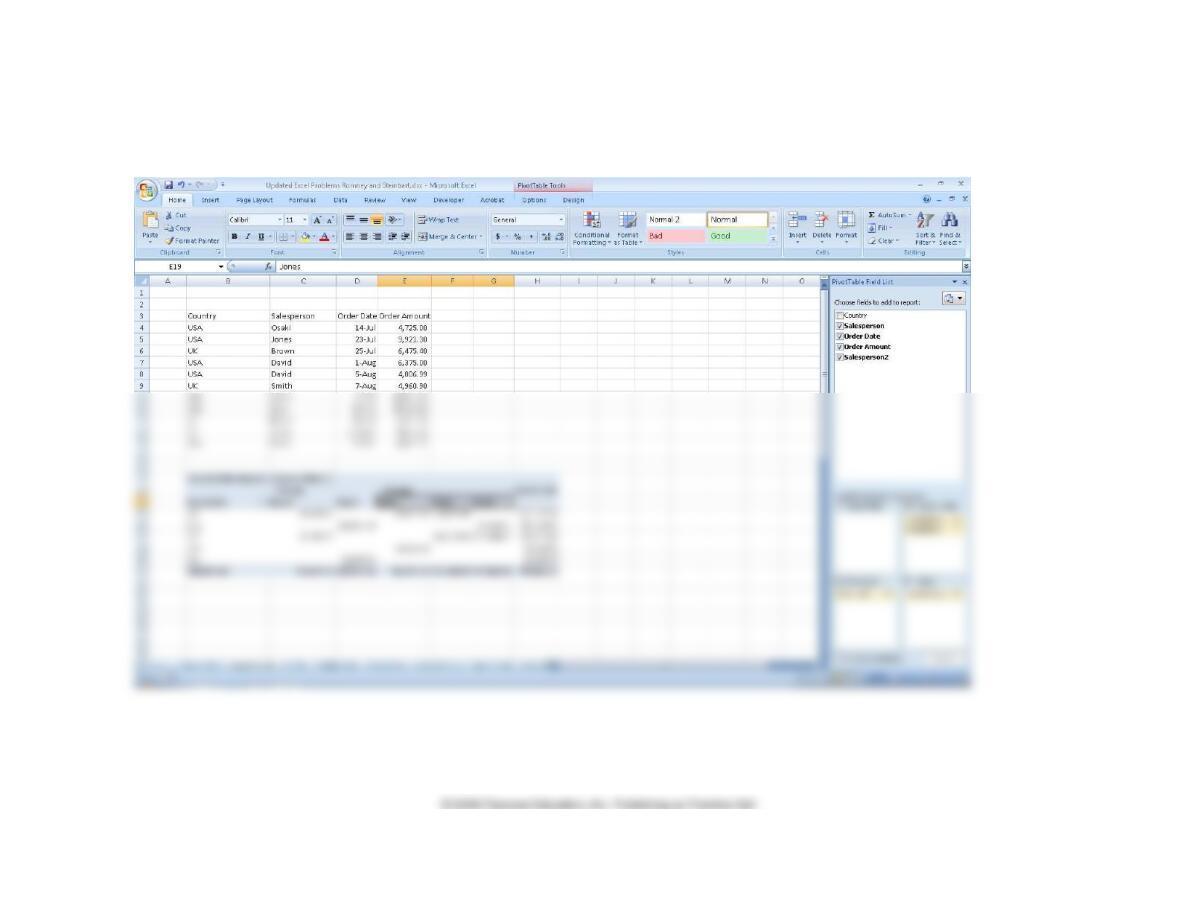
Step1: select the salesperson, order date, and order amount fields in the window in the upper right corner that says “Choose
Fields to add to Report.”
Accounting Information Systems
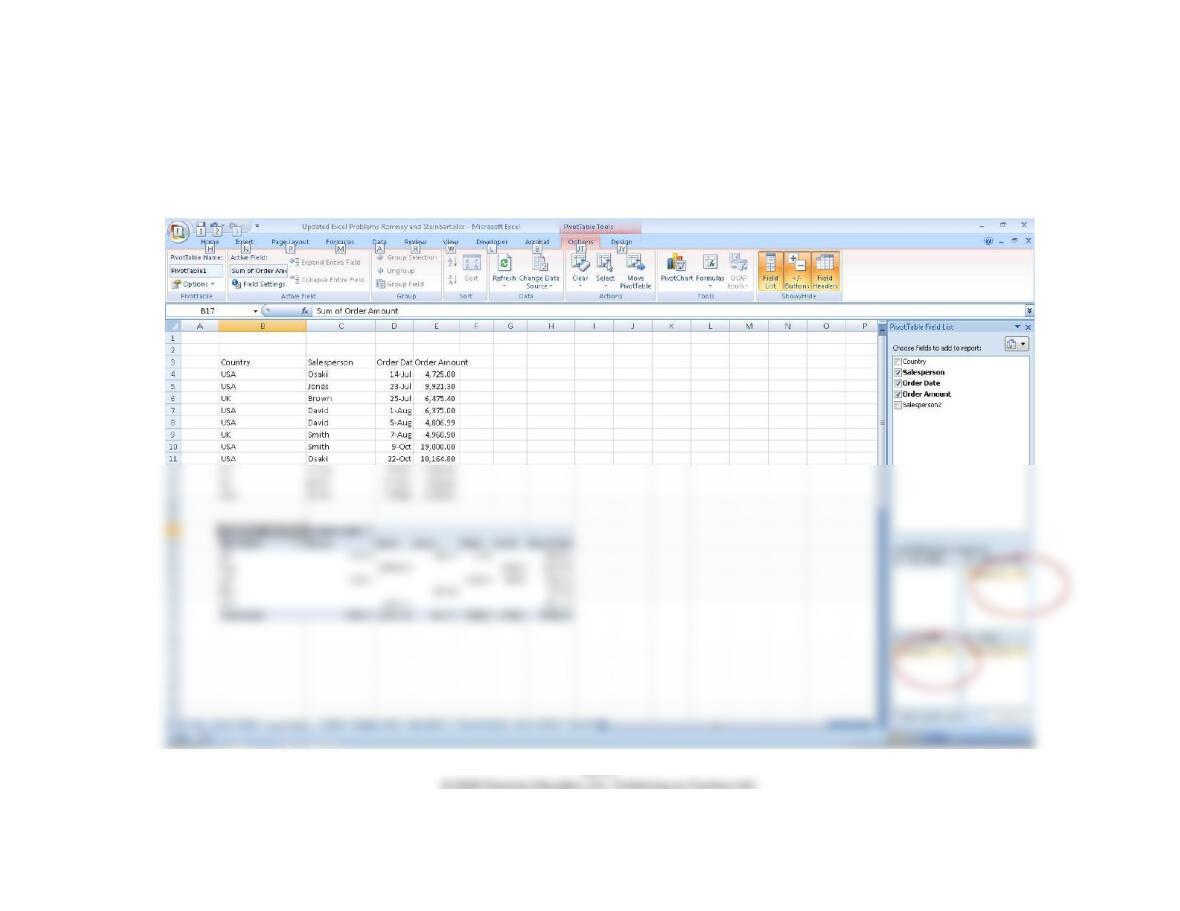
Step 2: Then click on the salesperson entry and move it from the “Row Labels” window to the “Column Labels” window.
Ch. 16: General Ledger and Reporting System
16–18
Step 3: Highlight all the cells in the PivotTable and format them to display currency with two decimals.
Accounting Information Systems
c. Assume that Brown and David are in sales group 1 and the other three salespeople are in sales group 2. Print out a
report that shows monthly sales for each group.
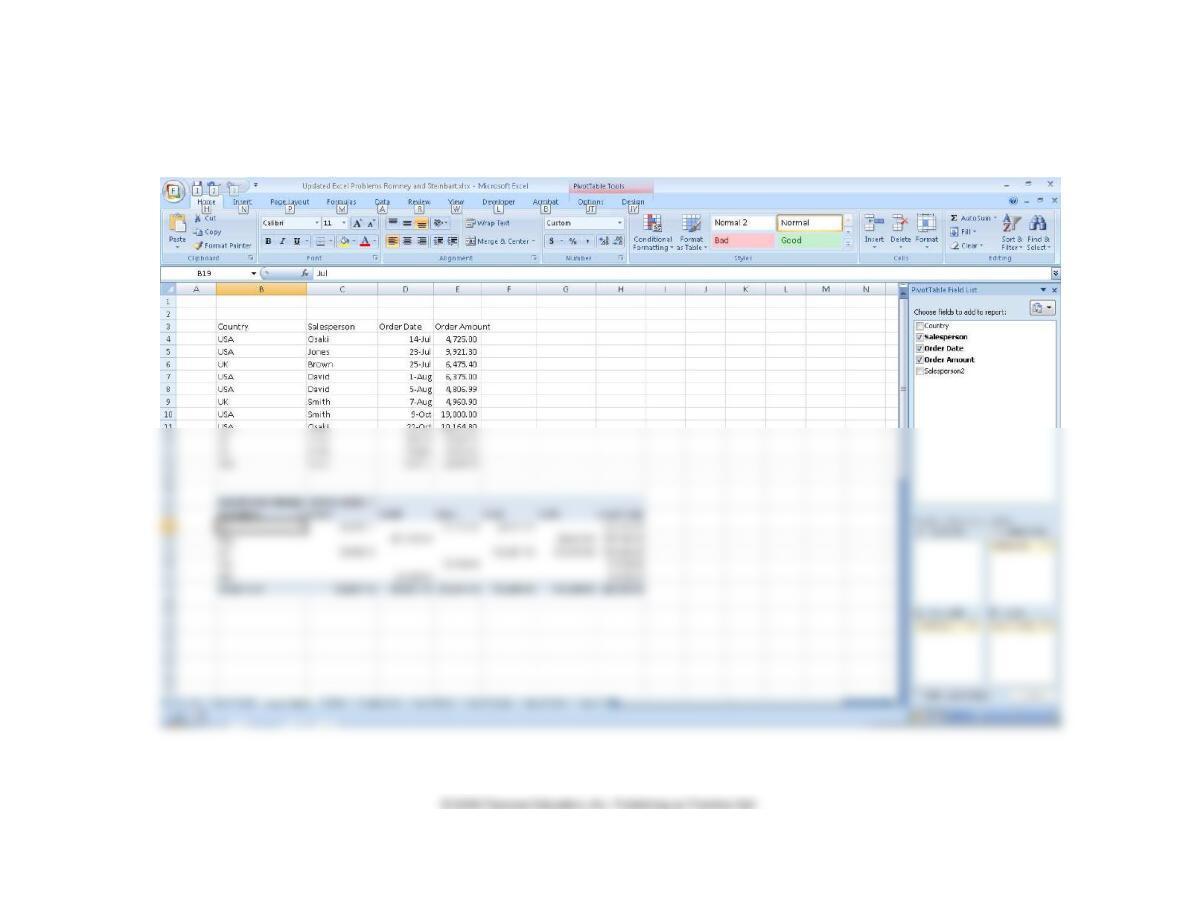
Step 1: To separate the sales people into groups, click on the sales person row in the Pivot Table and highlight Brown and David.
Ch. 16: General Ledger and Reporting System
16–20
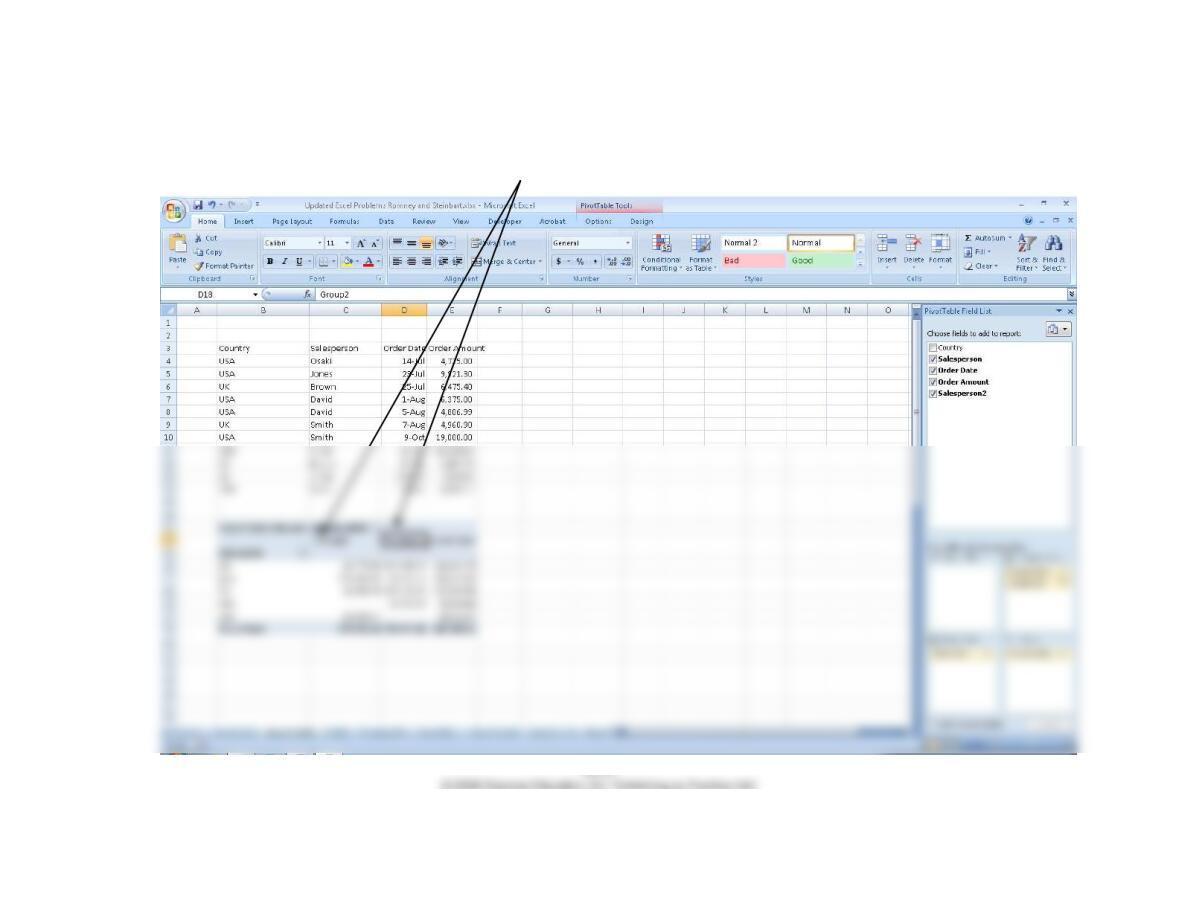
Step 2: Right click the two highlighted cells and select “Group”. They will now have a super–title called “Group 1”. Do the same
for the other three sales people to form group 2. The spreadsheet should look like this:
Accounting Information Systems
Step 3: You can collapse and display the groups by clicking on the button to the left of each group name. The preceding screen
shot showed all members of each group (note the minus signs to the left of the labels “Group1” and “Group2”). Clicking those to
change to a plus sign produces the following:
Ch. 16: General Ledger and Reporting System
16–22
16.10 Excel Problem Objective: How to do what-if analysis with graphs.
a. Read the article “Tweaking the Numbers,” by Theo Callahan in the June 2001 issue of the Journal of Accountancy
(either the print edition, likely available at your school’s library, or access the Journal of Accountancy archives at
www.aicpa.org). Follow the instructions in the article to create a spreadsheet with graphs that do what-if analysis.
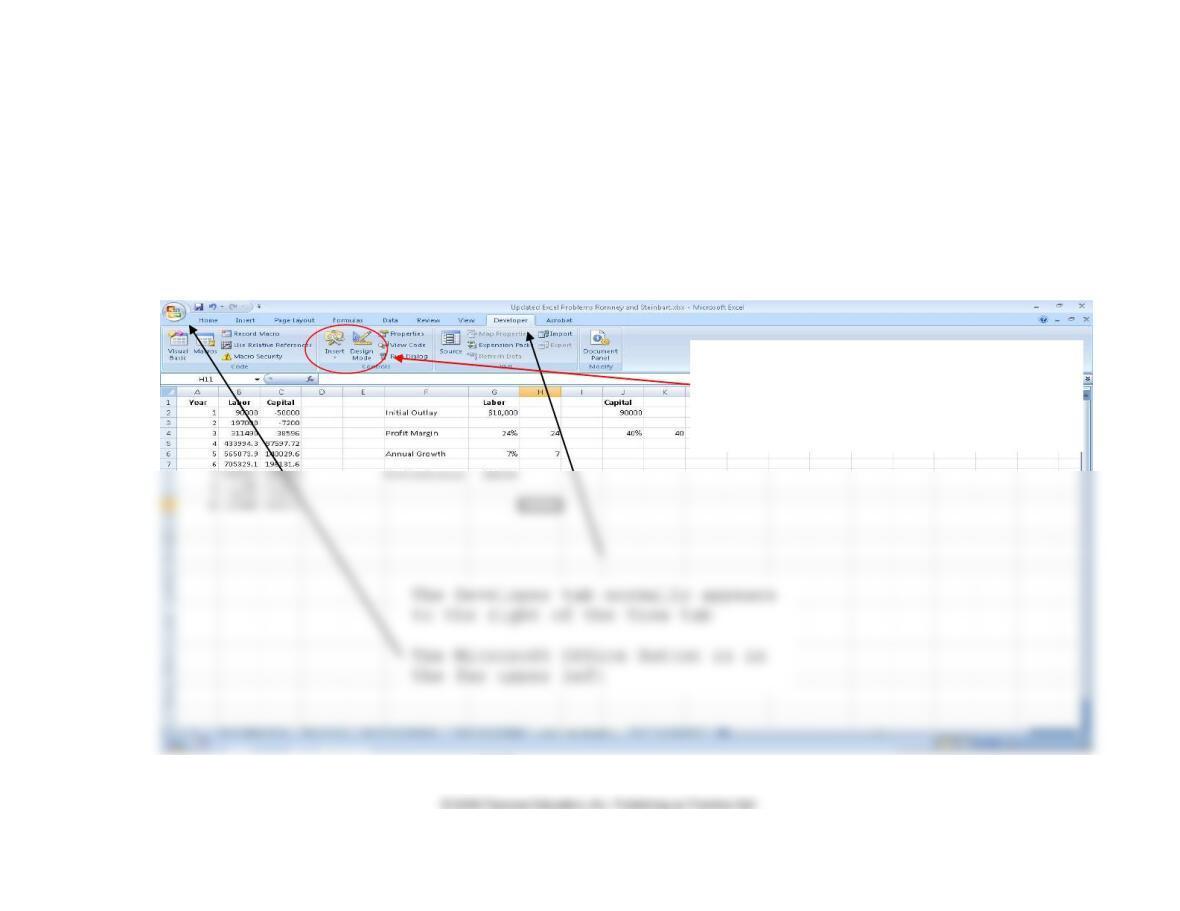
Most of the steps in the article can be done as indicated. One difference is finding the control toolbox to create a spin button. This
requires that the “Developer” tab is available as shown below.
Click on “Design Mode” to toggle
Click on Insert to add spin
buttons and other Active X
controls
Accounting Information Systems
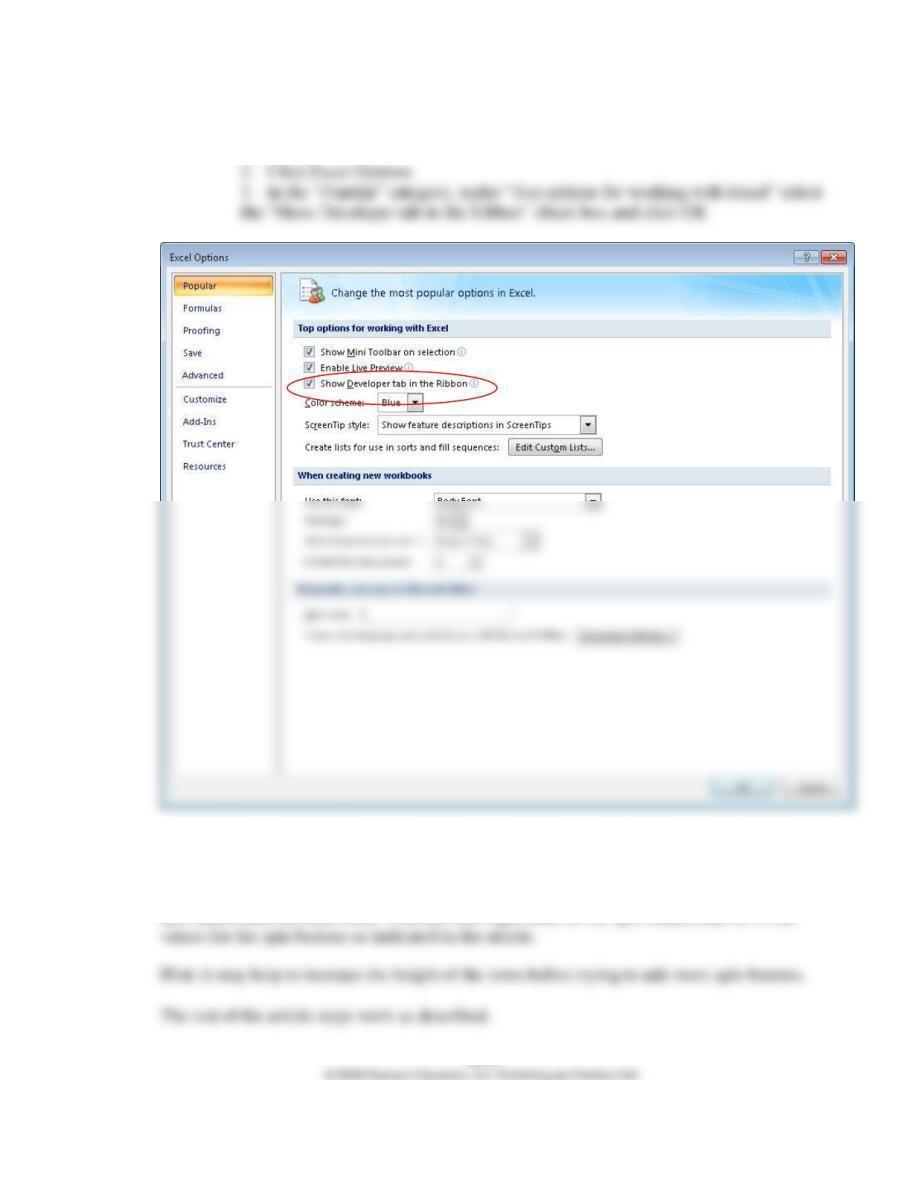
If the developer tab is not available, follow these steps (for Excel 2007):
1. Click the Microsoft Office Button (in far upper left corner – see prior
screenshot)
On the Developer tab you then click insert and select the “spin box” option from the list of
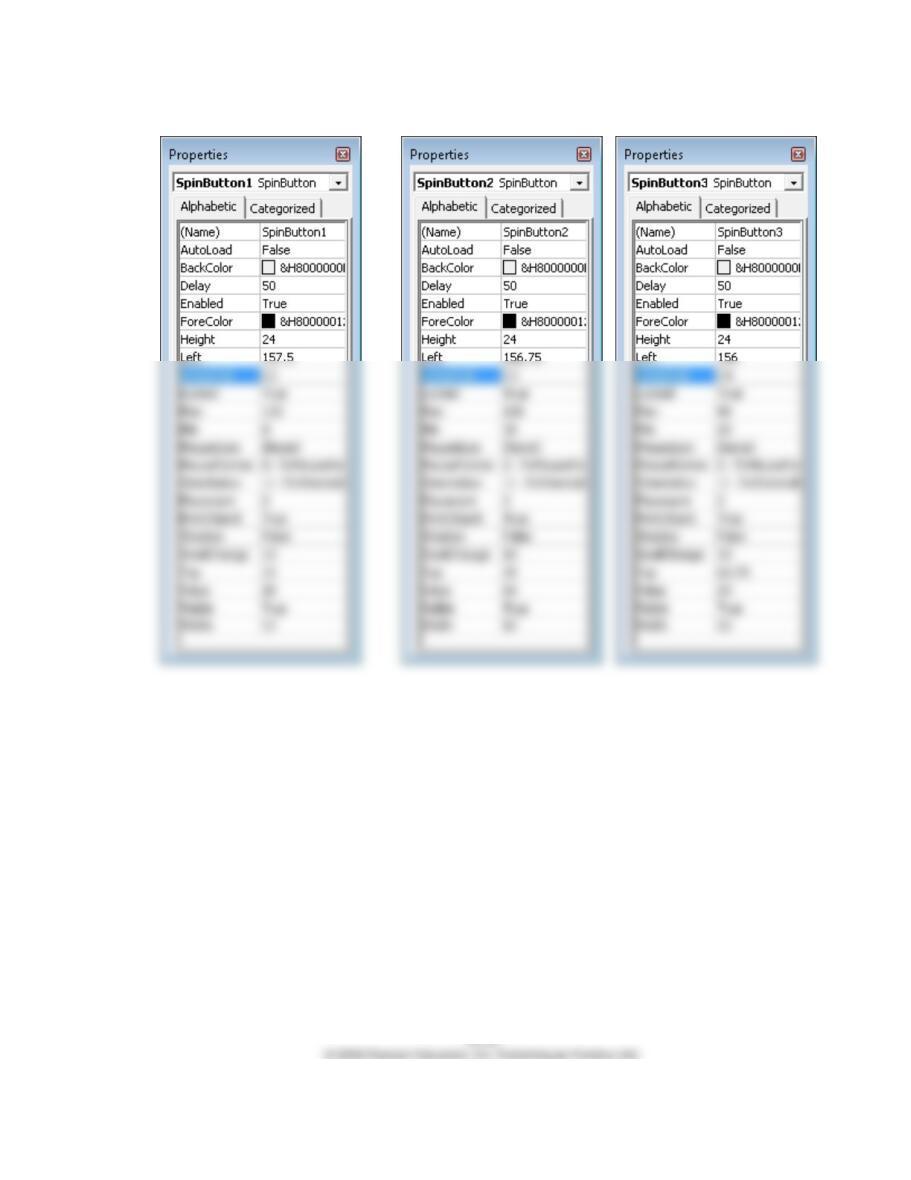
choices of Active X controls. Then position your cursor in the cell where you want to insert a
spin button and left-click once. You can now right-click on the spin-button and fill in the
Ch. 16: General Ledger and Reporting System
b. Now create a spreadsheet to do graphical what-if analysis for the “cash gap.”
Cash gap represents the number of days between when a company has to pay its
suppliers and when it gets paid by its customers. Thus, Cash gap = Inventory
days on hand + Receivables collection period – Accounts payable period.
The “cash gap” formula indicates how much of a cushion a company has, given a set
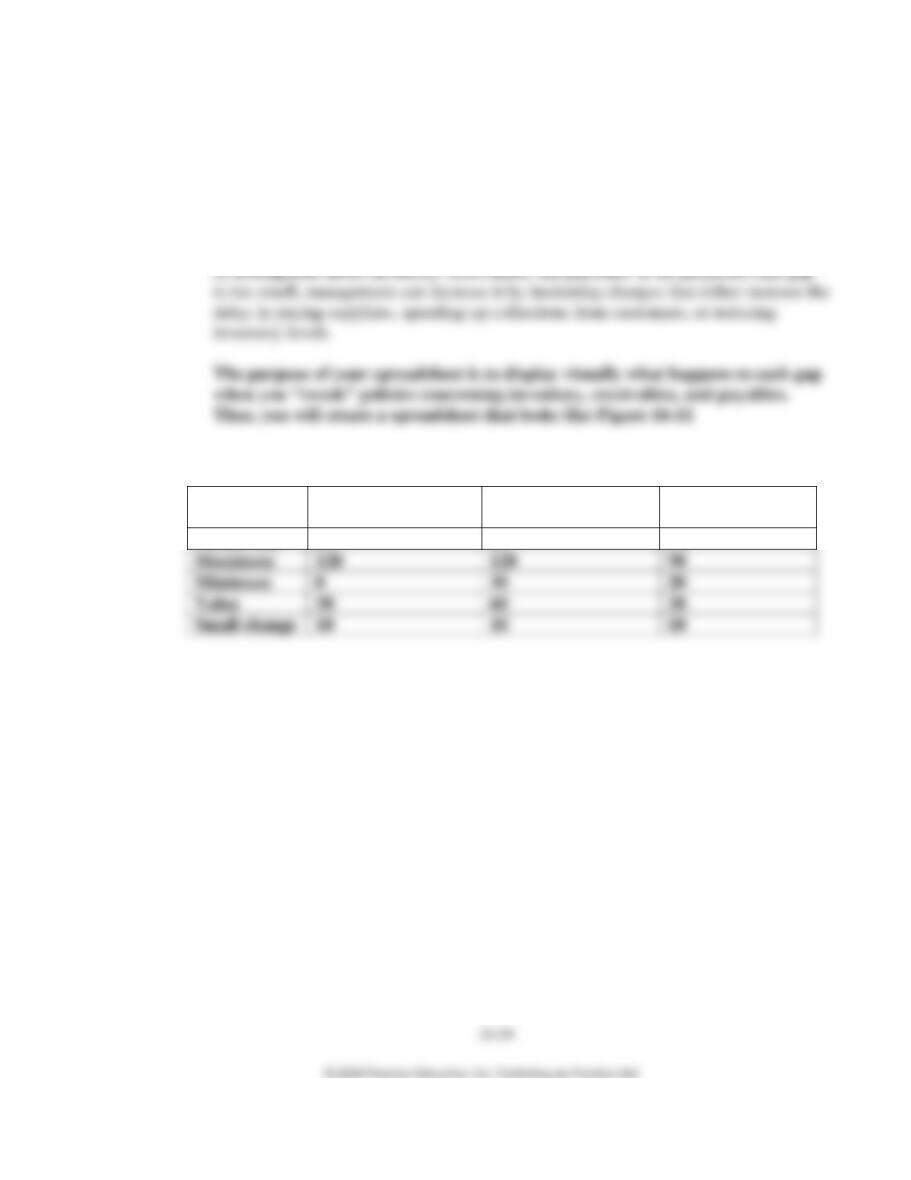
c. Set the three spin buttons to have the following values:
Spin button for
Inventory
Spin button for
Receivables
Spin button for
Payables
Linked cell
C2
C3
C4
Maximum
120
120
90
Minimum
0
30
20
Value
30
60
20
Small change
10
10
10
Accounting Information Systems
Ch. 16: General Ledger and Reporting System
16–26
SUGGESTED ANSWERS TO THE CASES
16.1 Student reports will vary depending on what they find and focus on in the website. The
website contains pages such as Latest News, Project News, Technical News, etc.
However, the useful page for students will likely be the XBRL IN ACTION page. This
16.2 Answers will vary depending upon the package selected and depth of research
undertaken. You may want to assign the package to be researched in order to reduce the
number of students studying the same package.