1. In a centralized operation, all major planning and operating decisions are made by top management
In a decentralized operation, managers of separate divisions or units are delegated operating
2. The department manager of a profit center has responsibility for and authority over costs and
3. Payroll: Number of checks issued. Accounts payable: Number of invoices paid. Accounts
4. The major shortcoming of using income from operations as a measure of investment center
p
5. A division of a decentralized company could be considered the least profitable, even though
7. A balanced scorecard can indicate the underlying causes of financial performance from
innovation and learning, customer, internal, and financial perspectives. In addition, a
b
8. The objective of transfer pricing is to encourage each division manager to work in the best
b
9. When unused capacity exists in the supplying division, the negotiated price approach is
p
referred over the market price approach.
CHAPTER 23 (FIN MAN); CHAPTER 8 (MAN)
PERFORMANCE EVALUATION
DISCUSSION QUESTIONS
FOR DECENTRALIZED OPERATIONS
23-1
CHAPTER 23 Performance Evaluation for Decentralized Operations
PE 23–1A (FIN MAN); PE 8–1A (MAN)
PE 23–1B (FIN MAN); PE 8–1B (MAN)
PE 23–2A (FIN MAN); PE 8–2A (MAN)
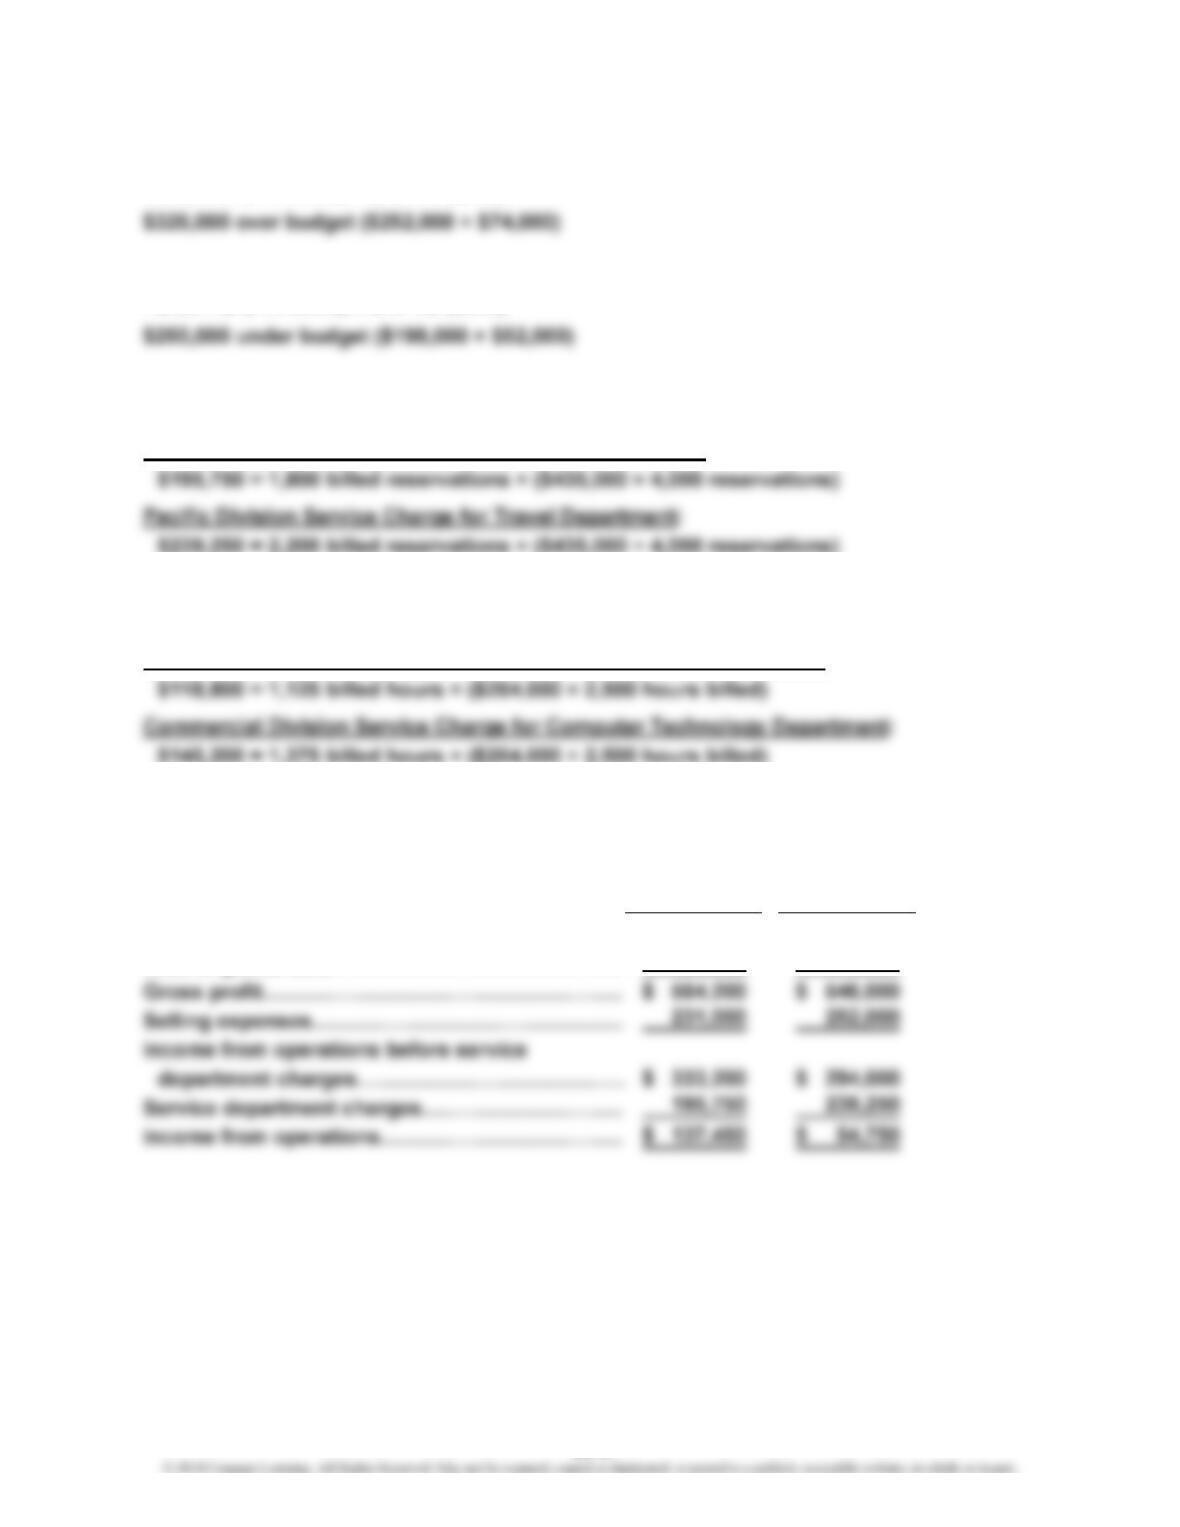
Northeast Division Service Charge for Travel Department:
PE 23–2B (FIN MAN); PE 8–2B (MAN)
Retail Division Service Charge for Computer Technology Department:
PE 23–3A (FIN MAN); PE 8–3A (MAN)
Northeast Pacific
Division Division
Sales……………………………………………………
…
$1,155,000 $1,204,000
Cost of goods sold…………………………………… 590,800 658,000
PRACTICE EXERCISES
23-2
CHAPTER 23 Performance Evaluation for Decentralized Operations
PE 23–3B (FIN MAN); PE 8–3B (MAN)
Retail Commercial
Division Division
Sales……………………………………………………
…
$945,000 $966,000
PE 23–4A (FIN MAN); PE 8–4A (MAN)
PE 23–4B (FIN MAN); PE 8–4B (MAN)
PE 23–5A (FIN MAN); PE 8–5A (MAN)
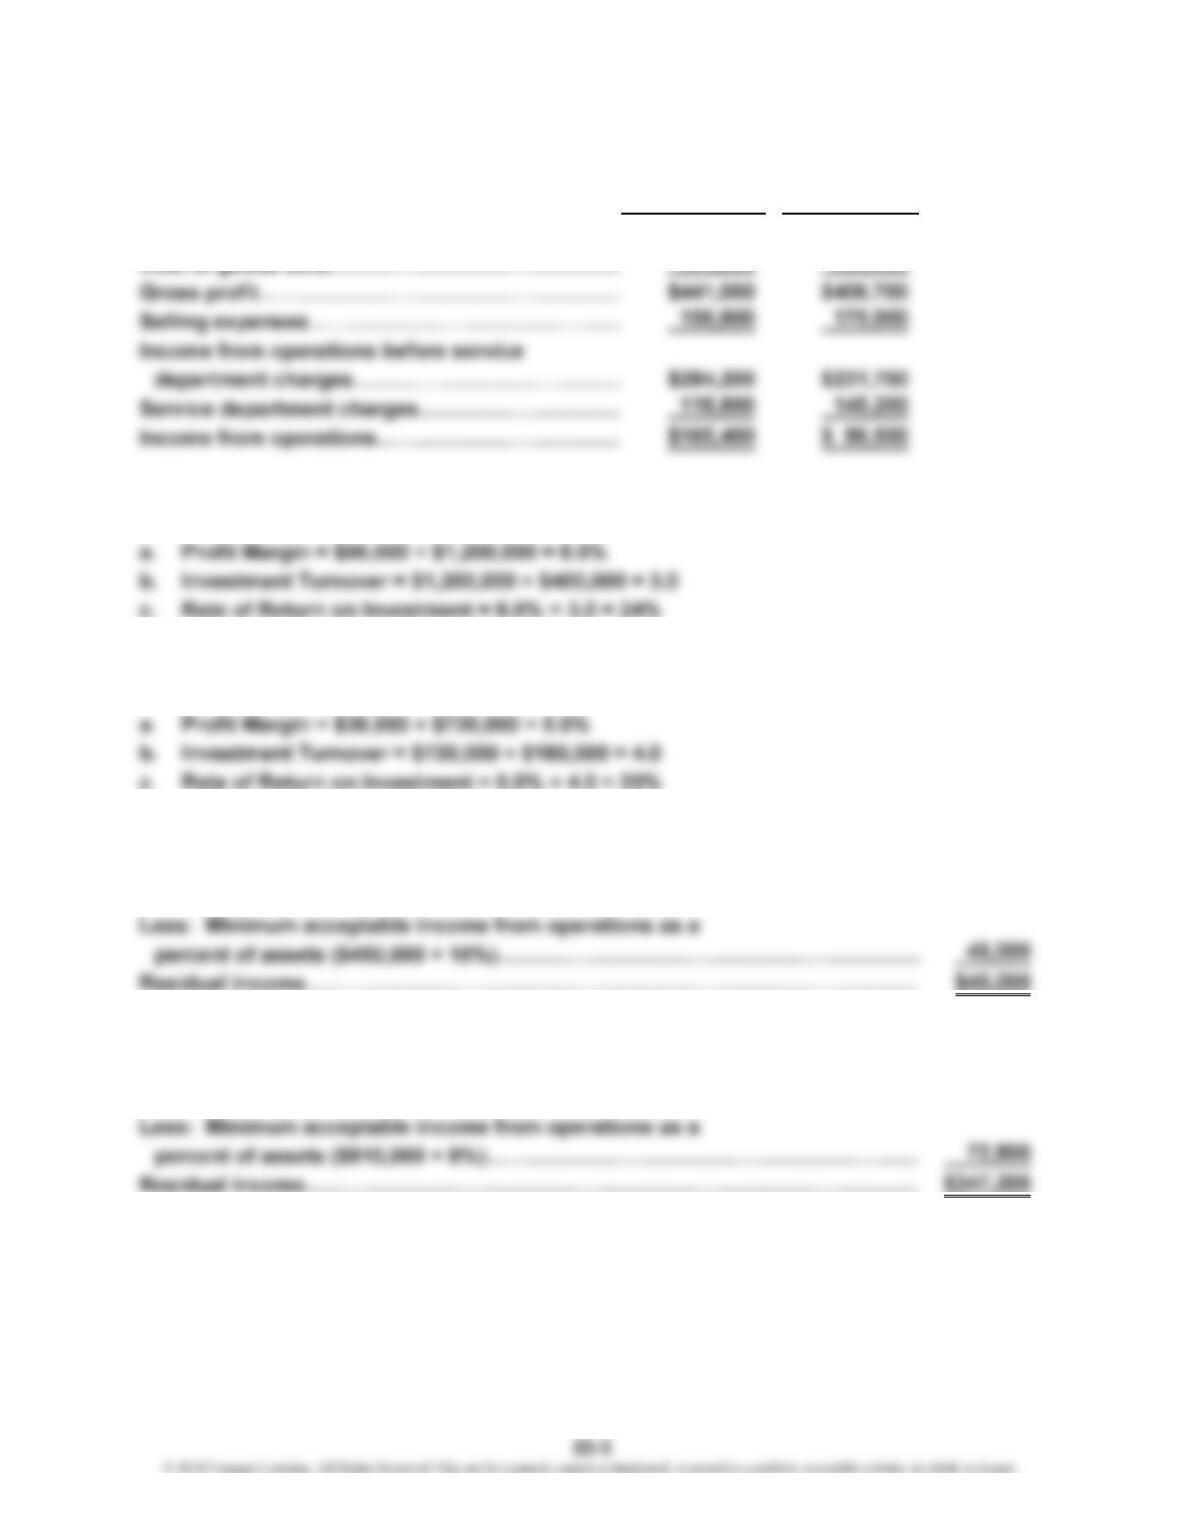
Income from operations…………………………………………………………………… $90,000
PE 23–5B (FIN MAN); PE 8–5B (MAN)
Income from operations…………………………………………………………………… $420,000
PE 23–6A (FIN MAN); PE 8–6A (MAN)
PE 23–6B (FIN MAN); PE 8–6B (MAN)
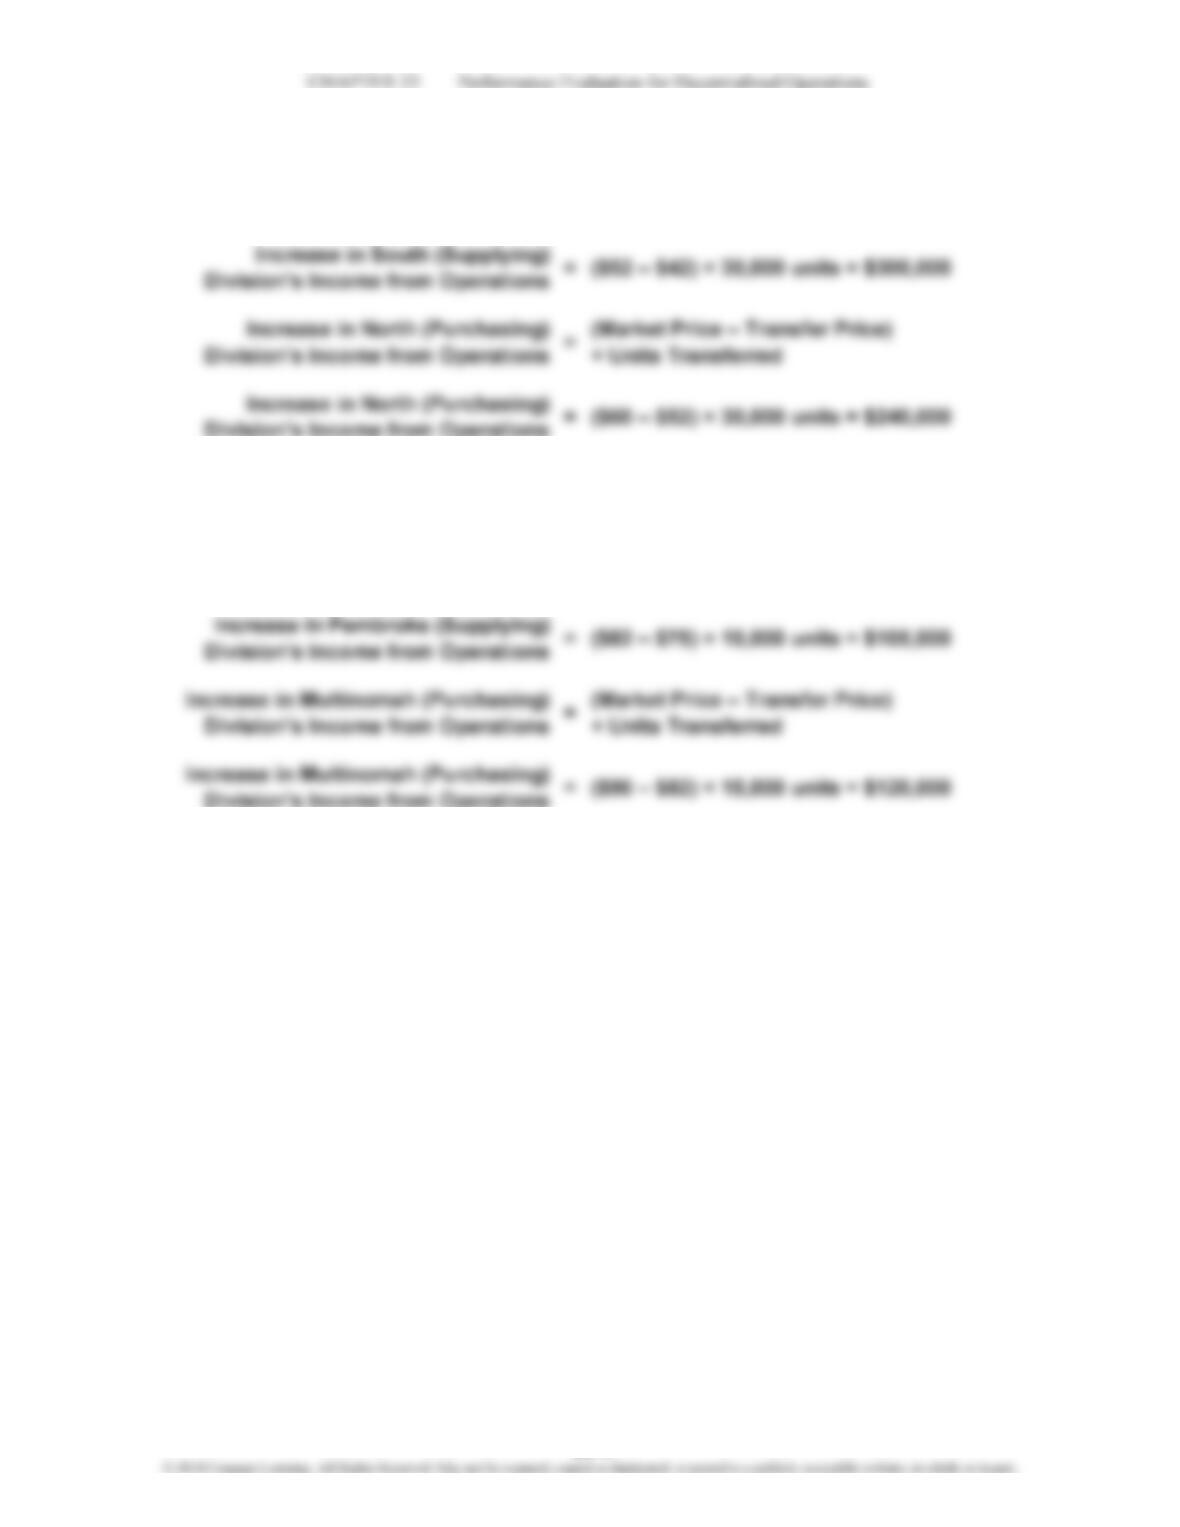
Increase in Pembroke (Supplying)
Division’s Income from Operations =(Transfer Price – Variable Cost per Unit)
× Units Transferred
Increase in South (Supplying)
Division’s Income from Operations =(Transfer Price – Variable Cost per Unit)
× Units Transferred
23-4
CHAPTER 23 Performance Evaluation for Decentralized Operations
Ex. 23–1 (FIN MAN); Ex. 8–1 (MAN)
a. (a) $192,240 (g)
Schedules of supporting calculations (answers in italics; the solution requires
working from the department level, up to the plant level, then to the vice president
of production level):
Under
Budget
Mid-Atlantic Region $ 747,000 $1,800
Under
Budget
Chip Fabrication (a) $195,072 (b) $2,832 (c)
BudgetPlant
$192,240
Department
Actual
Over
Over
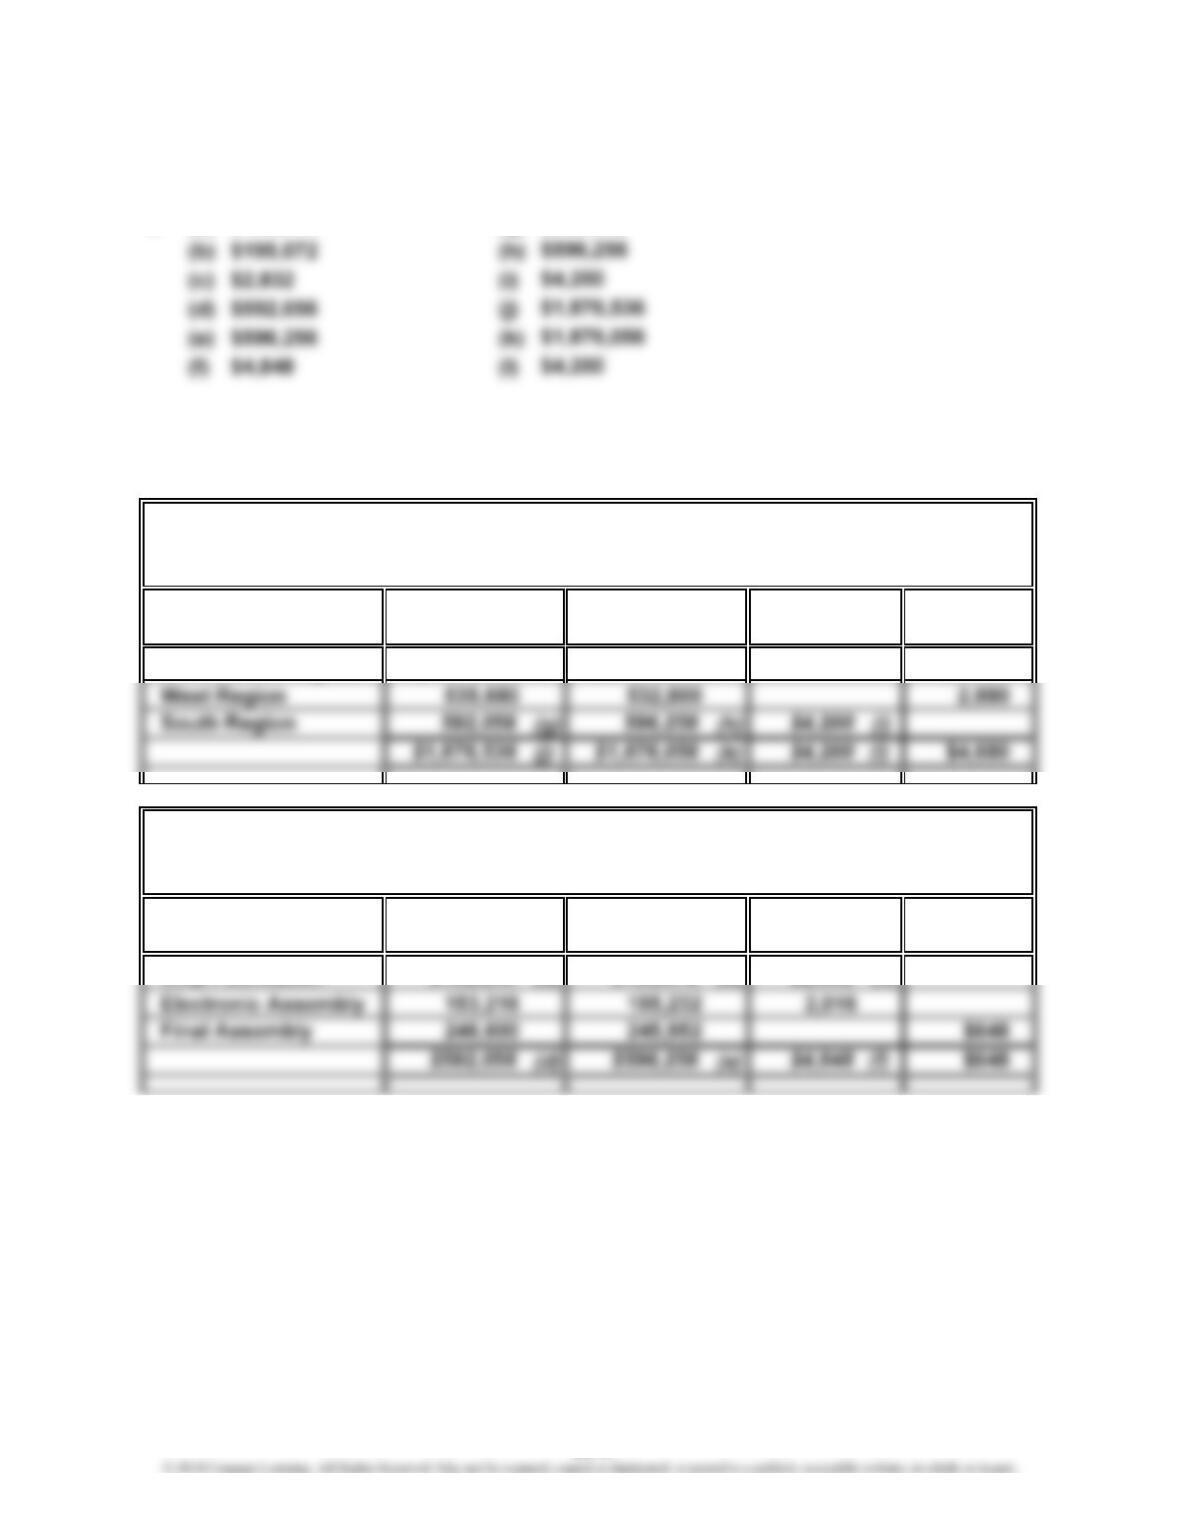
MAQUIRE COMPANY
Budget Performance Report—Manager, South Region Plant
For the Month Ended May 31, 2014
Budget
Budget Actual
Budget
$ 748,800
EXERCISES
MAQUIRE COMPANY
Budget Performance Report—Vice President, Production
For the Month Ended May 31, 2014
$592,056
23-5
CHAPTER 23 Performance Evaluation for Decentralized Operations
Ex. 23–1 (FIN MAN); Ex. 8–1 (MAN) (Concluded)
Under
Budget
Factory wages
b. MEMO
To: Holly Keller, Vice President of Production
The South Region plant has experienced a budget overrun, while the Mid-Atlantic and
West Region plants have experienced a budget surplus. The budget of the South
Ex. 23–2 (FIN MAN); Ex. 8–2 (MAN)
Residential
Division
Net sales $595,000
Cost of goods sold 338,940
$1,083,600
732,200
For the Year Ended June 30, 2014
Commercial
Division
ENDLESS RIVER CONSTRUCTION COMPANY
Divisional Income Statements
$ 47,952 $1,248
Over
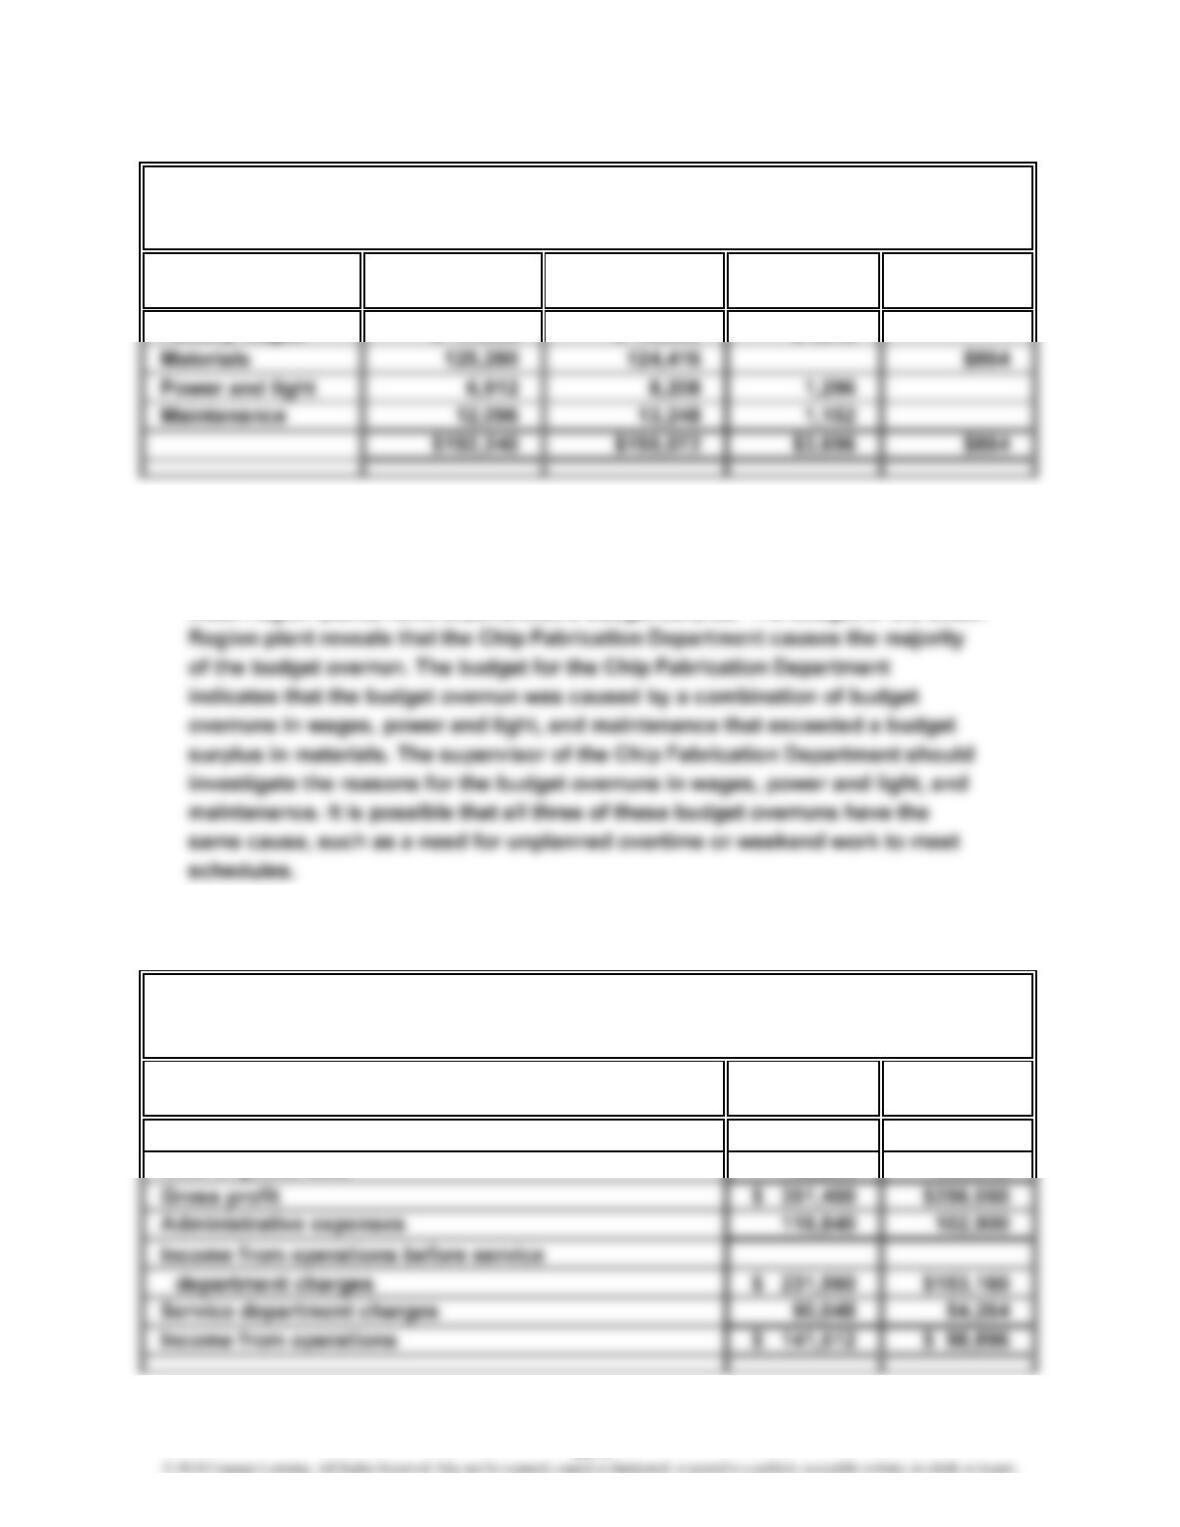
MAQUIRE COMPANY
Budget Performance Report—Supervisor, Chip Fabrication
For the Month Ended May 31, 2014
Cost BudgetBudget Actual
$ 49,200
23-6
CHAPTER 23 Performance Evaluation for Decentralized Operations
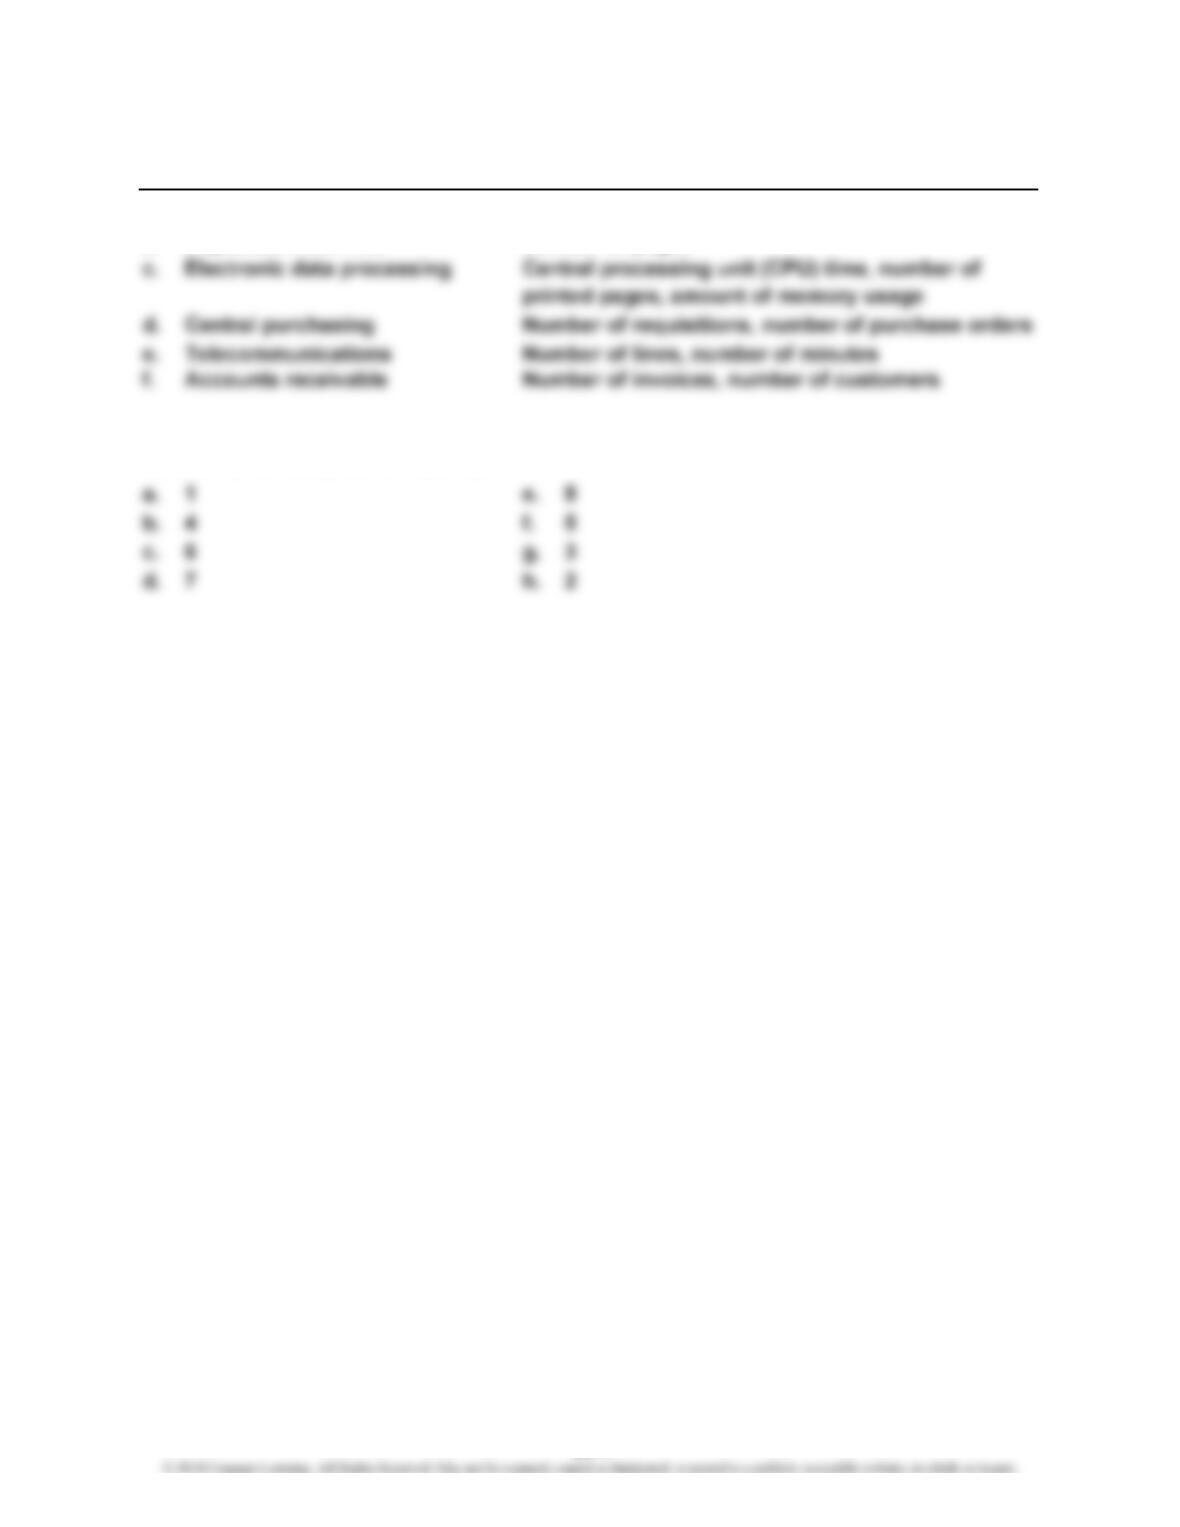
Ex. 23–3 (FIN MAN); Ex. 8–3 (MAN)
Expense Activity Bases
a. Legal Number of hours
b. Duplication services Number of pages
Ex. 23–4 (FIN MAN); Ex. 8–4 (MAN)
23-7
CHAPTER 23 Performance Evaluation for Decentralized Operations
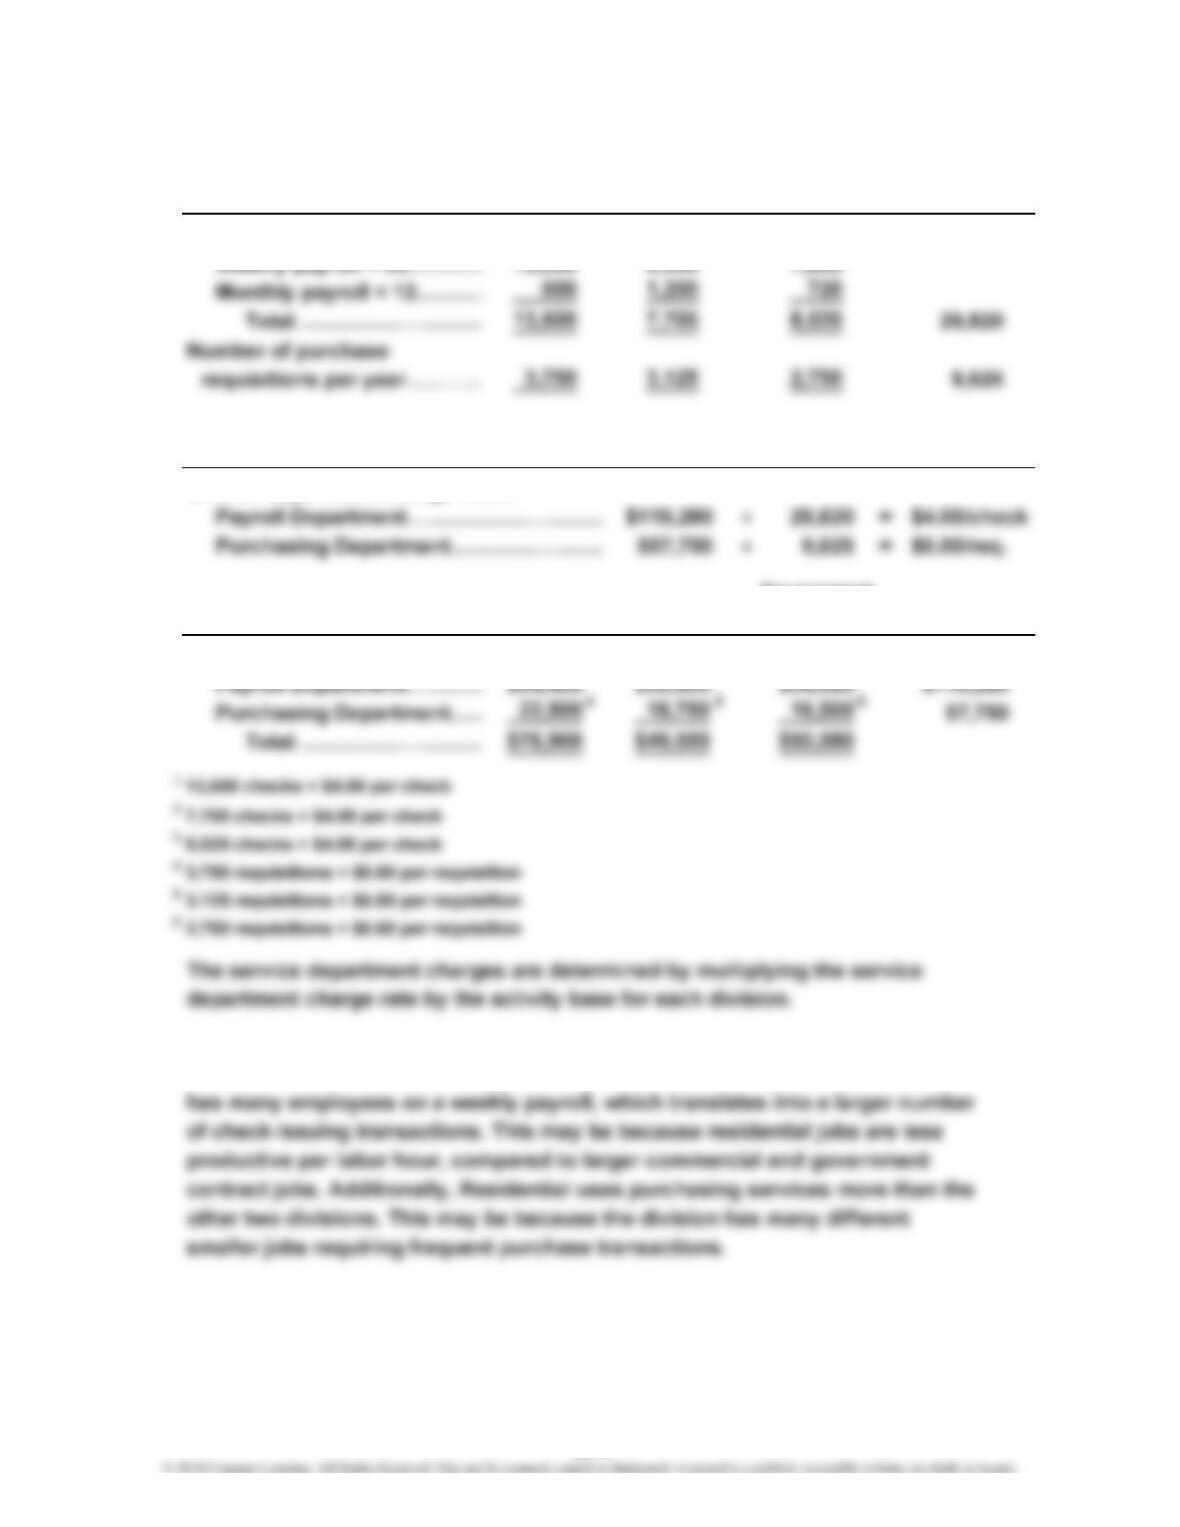
Ex. 23–5 (FIN MAN); Ex. 8–5 (MAN)
Government
a. Residential Commercial Contract Total
Number of payroll checks:
Service Activity Charge
b. Dept. Cost ÷ Base = Rate
Service department charge rates:
Government
Residential Commercial Contract Total
Service department charges:
c. Residential’s service department charge is higher than the other two divisions
because Residential is a heavy user of service department services. Residential
3
21
23-8
CHAPTER 23 Performance Evaluation for Decentralized Operations
Ex. 23–6 (FIN MAN); Ex. 8–6 (MAN)
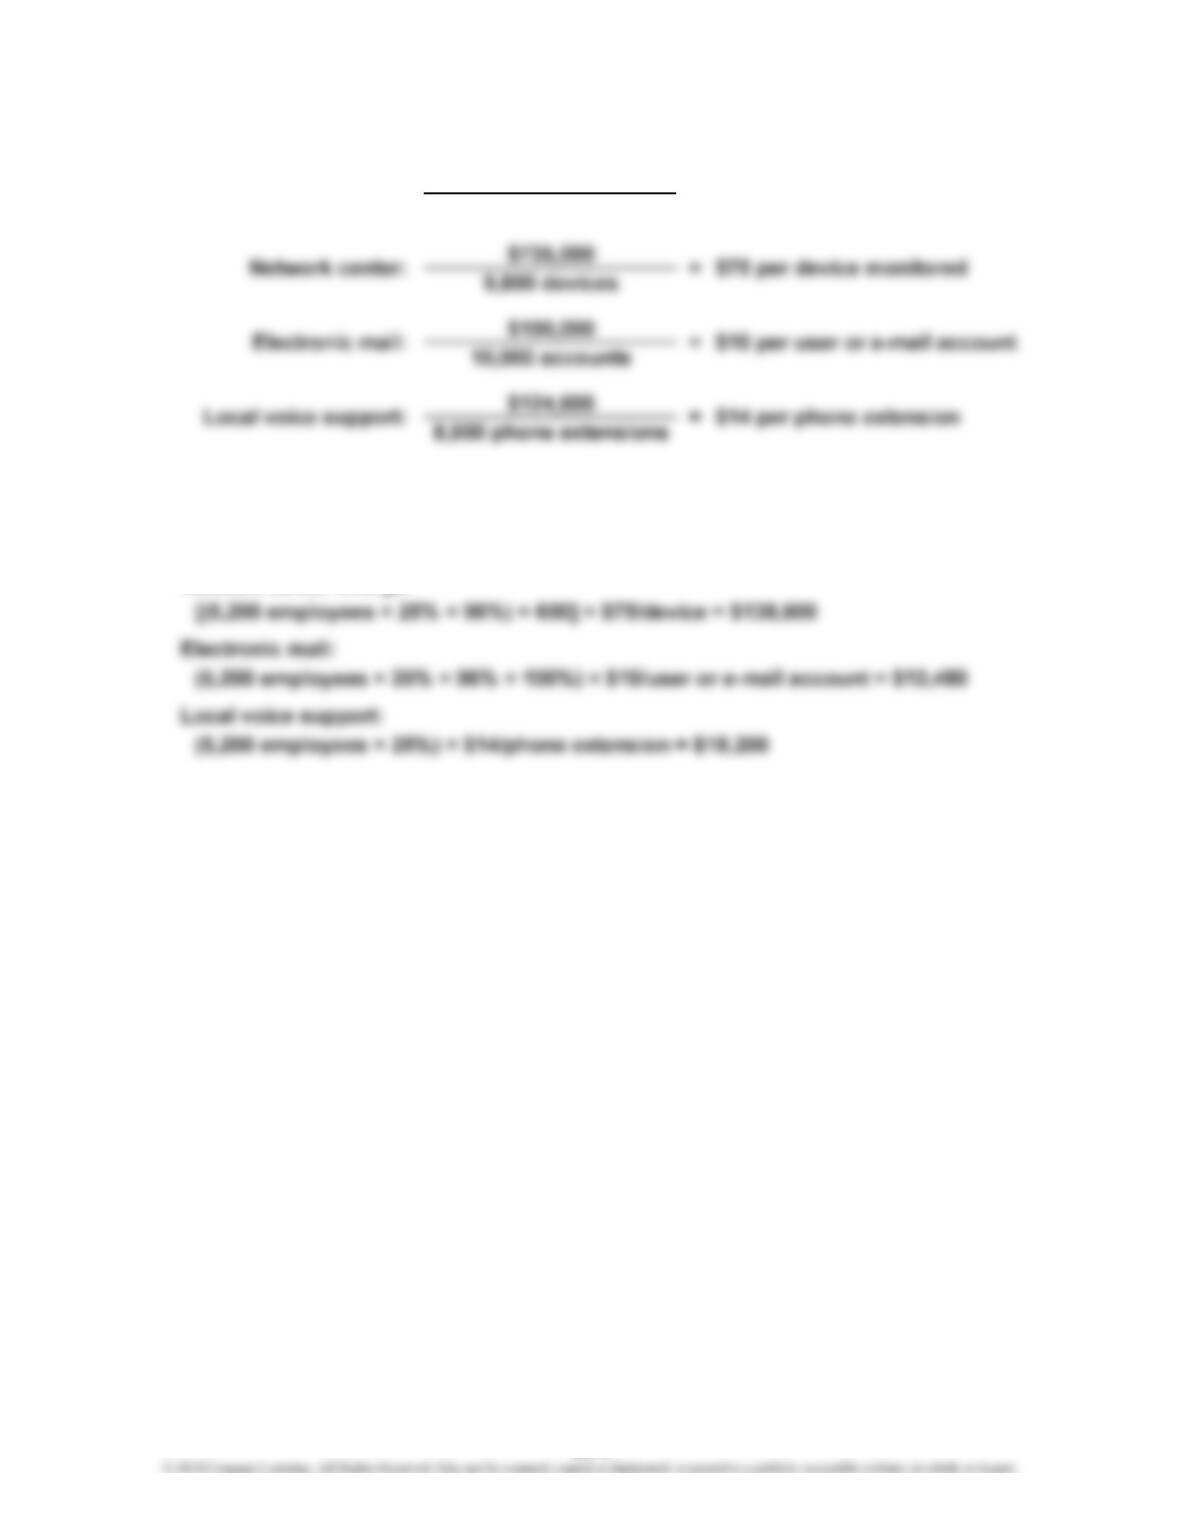
$160,000
3,200 calls
b. October charges to the COMM sector:
Help desk charge:
(5,200 employees × 25% × 96% × 1.5) × $50/call = $93,600
Network center charge:
= $50 per call
a. Help desk:
23-9
CHAPTER 23 Performance Evaluation for Decentralized Operations
Ex. 23–7 (FIN MAN); Ex. 8–7 (MAN)
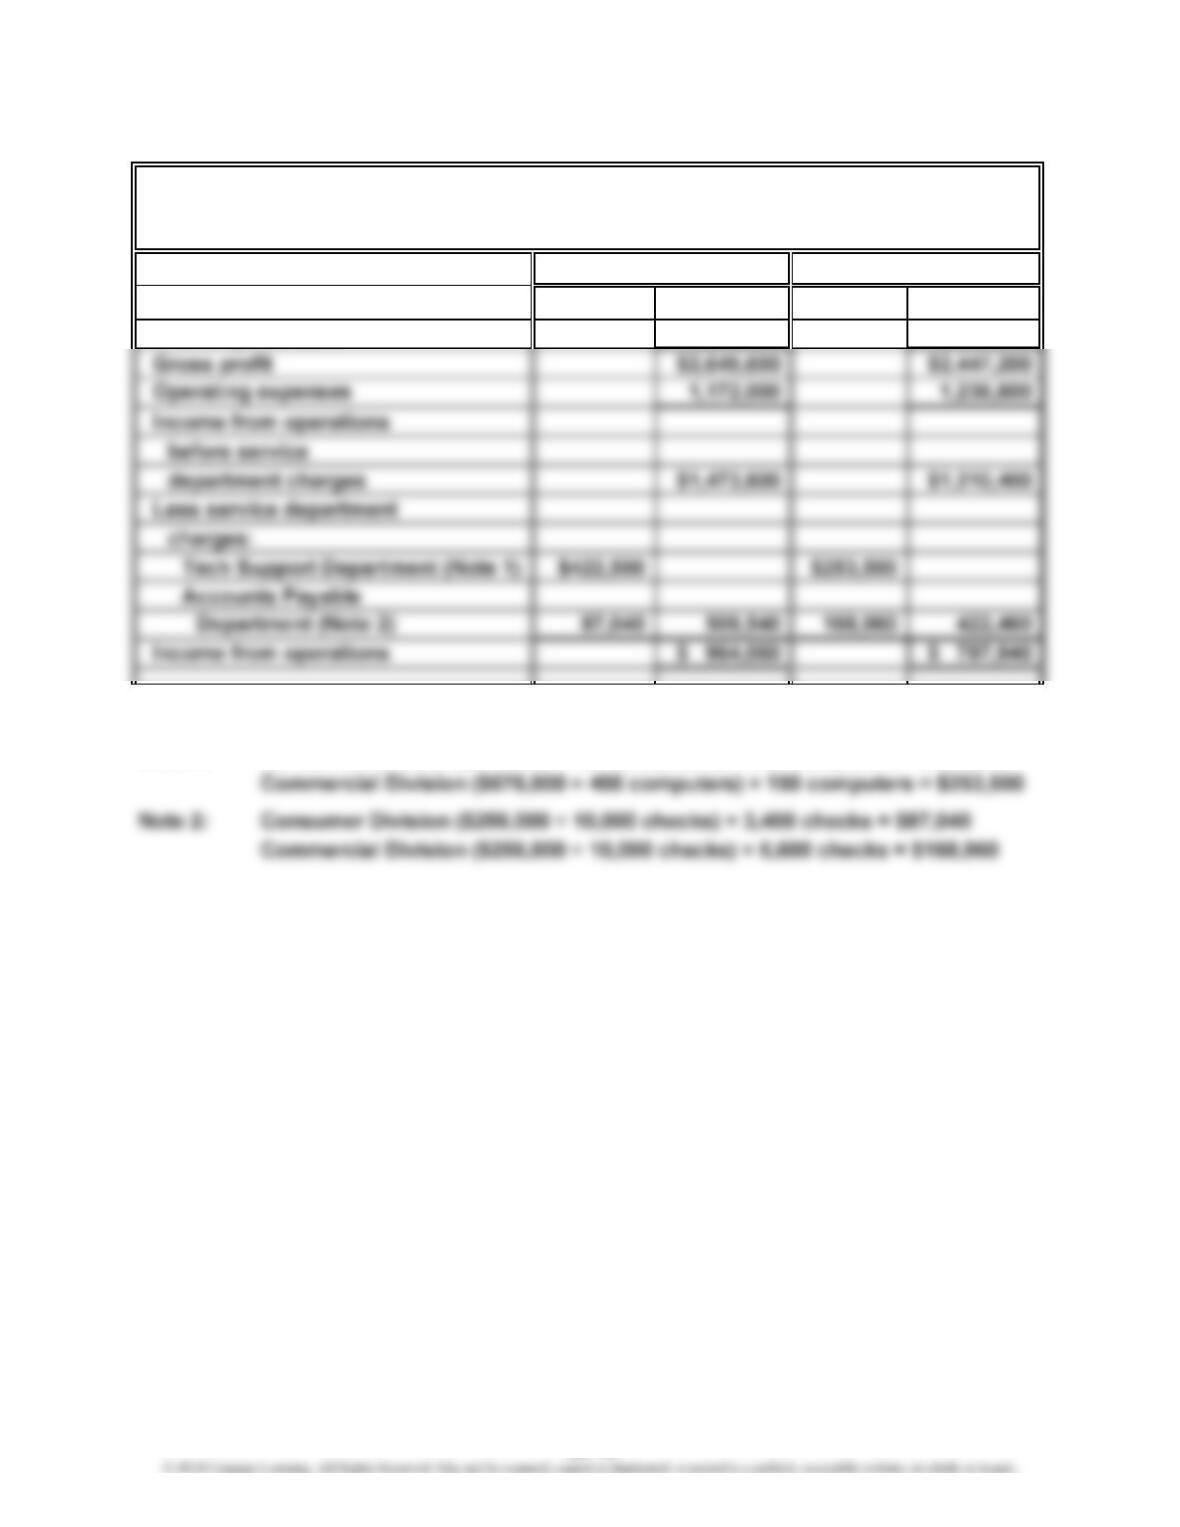
Revenues $5,944,000 $4,947,200
Cost of goods sold 3,298,400 2,500,000
Supporting calculations for controllable service department charges:
Note 1: Consumer Division ($676,000 ÷ 400 computers) × 250 computers = $422,500
VAN EMBURGH TECHNOLOGY
Divisional Income Statements
For the Year Ended December 31, 2014
Consumer Division Commercial Division
23-10
CHAPTER 23 Performance Evaluation for Decentralized Operations
Ex. 23–8 (FIN MAN); Ex. 8–8 (MAN)
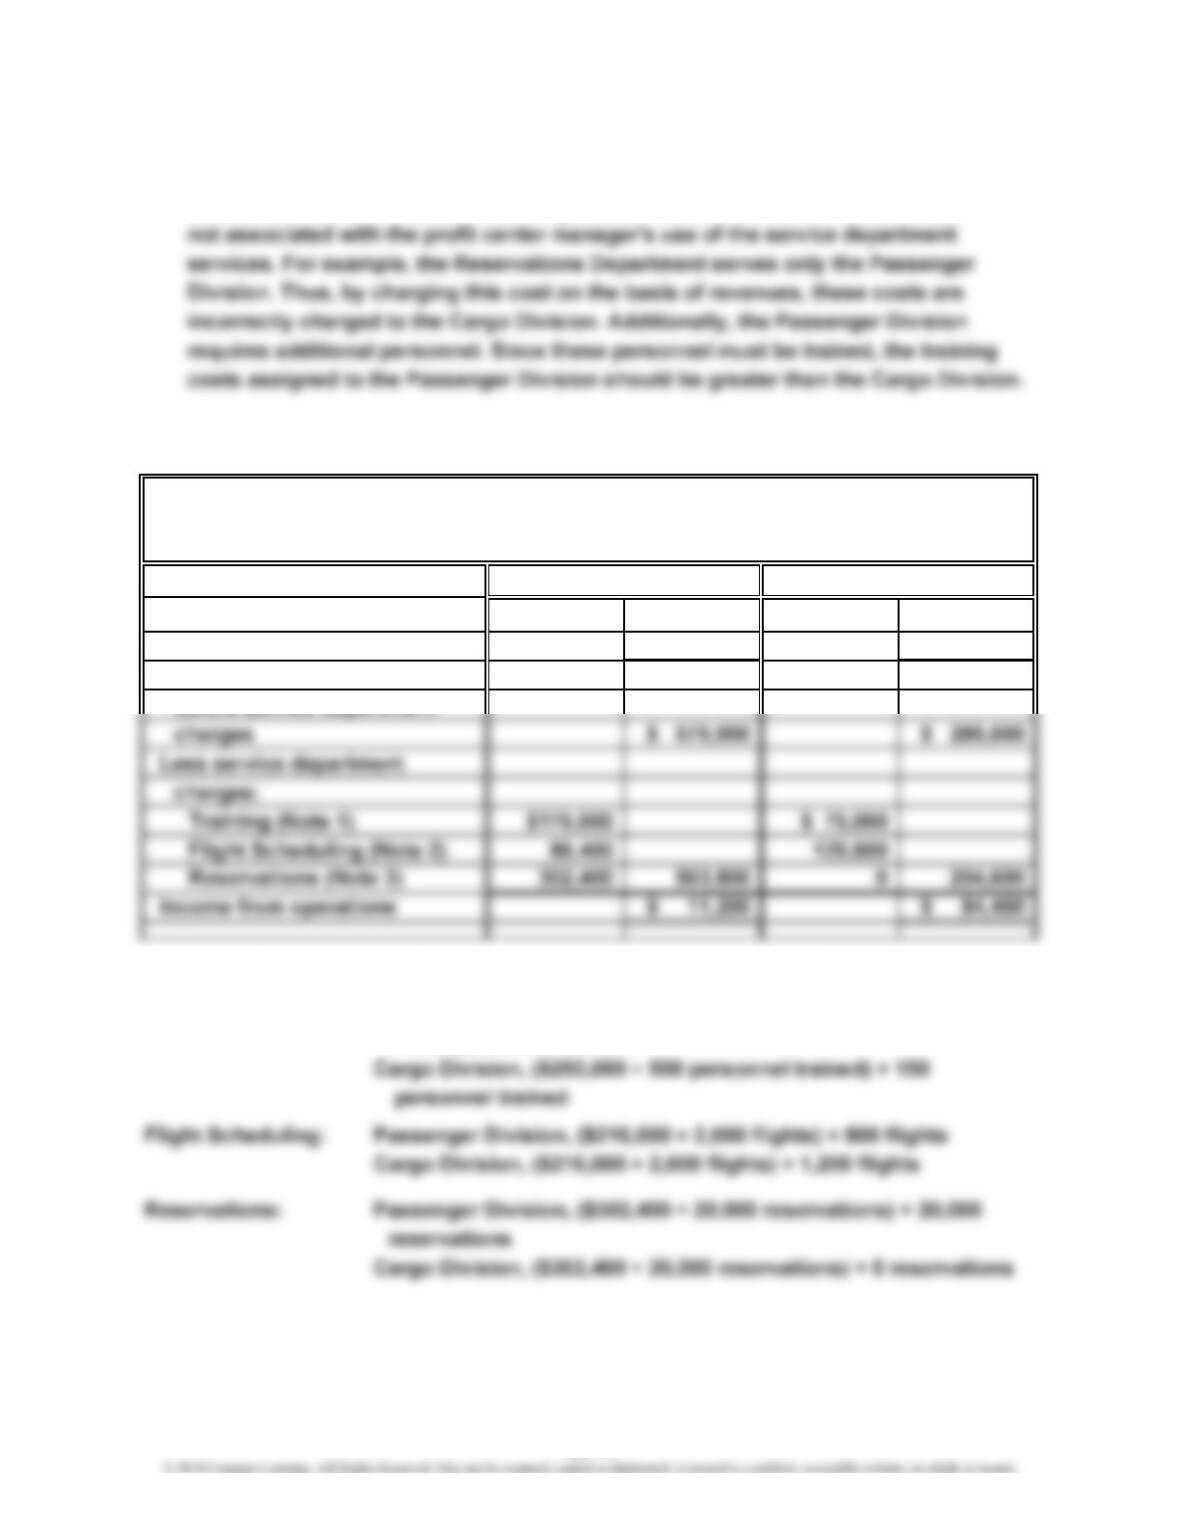
a. The reported income from operations does not accurately measure performance
because the service department charges are based on revenues. Revenues are
b.
Revenues $3,025,000 $3,025,000
Operating expenses 2,450,000 2,736,000
Income from operations
before service department
Supporting calculations for controllable service department charges:
Training: Passenger Division, ($250,000 ÷ 500 personnel trained)
× 350 personnel trained
WILD SUN AIRLINES INC.
Divisional Income Statements
For the Year Ended December 31, 2014
Passenger Division Cargo Division
23-11
CHAPTER 23 Performance Evaluation for Decentralized Operations
Ex. 23–9 (FIN MAN); Ex. 8–9 (MAN)
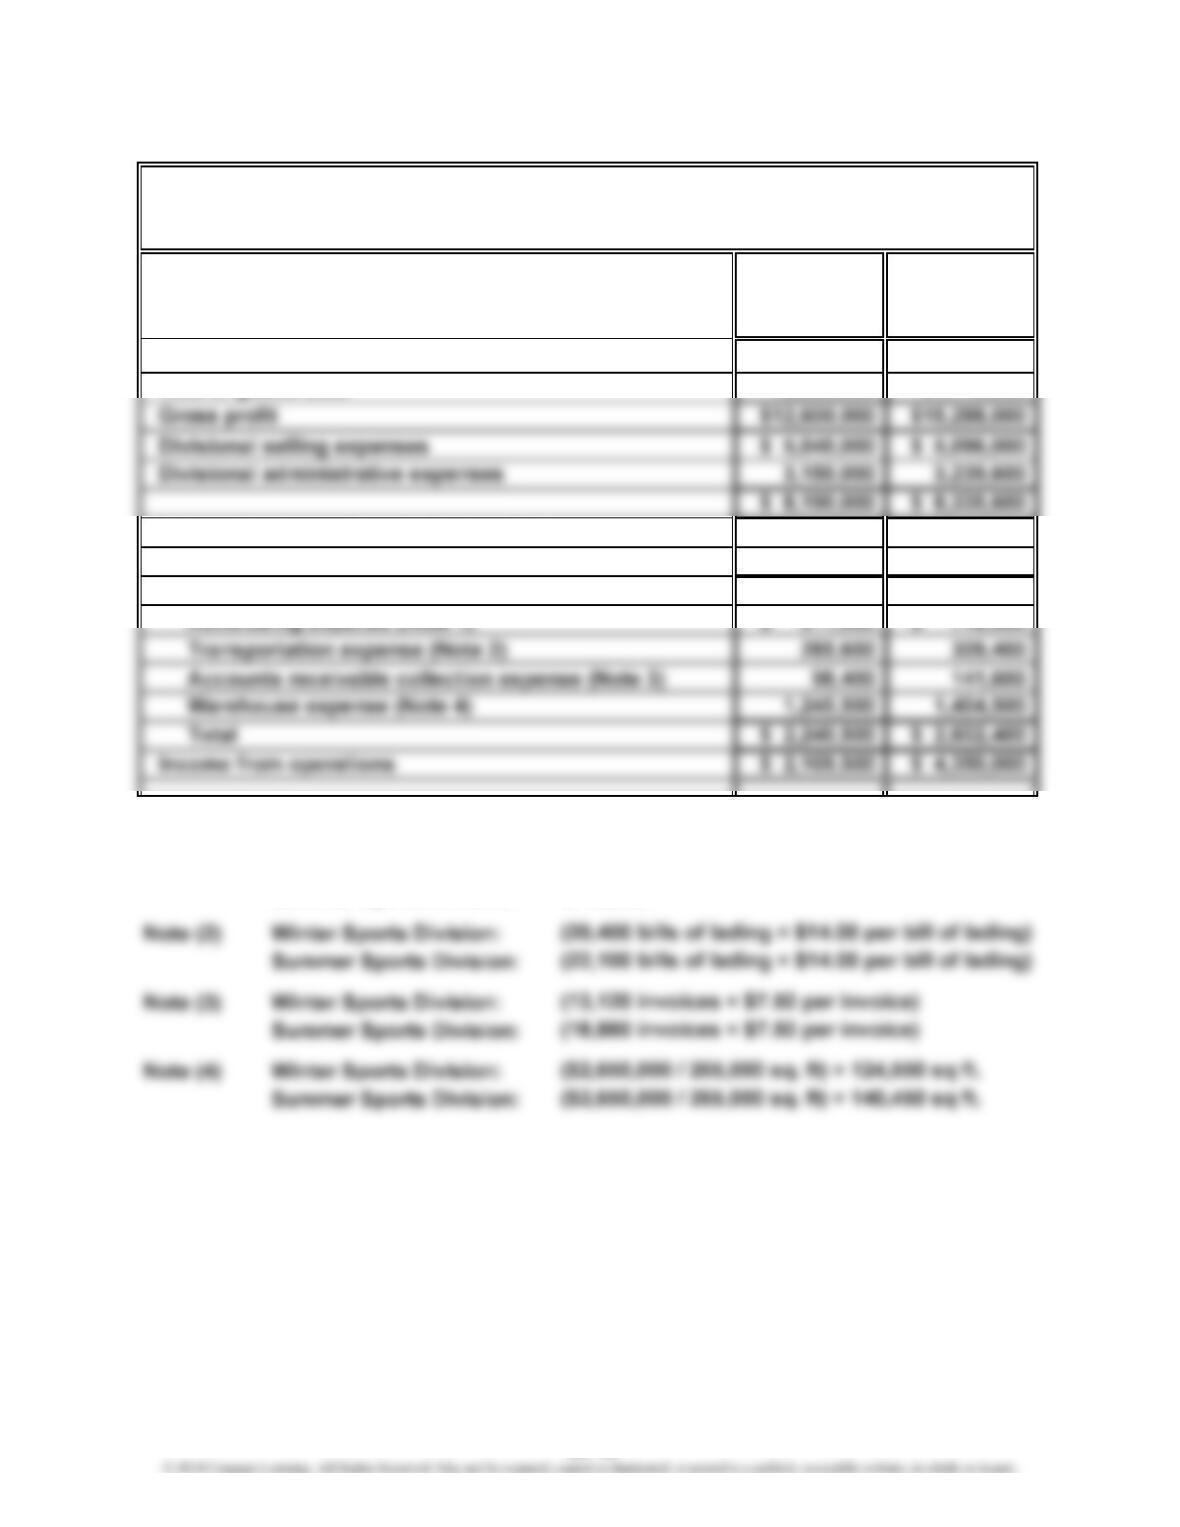
Winter Summer
Sports Sports
Division Division
Sales $31,500,000 $36,400,000
Cost of goods sold 18,900,000 21,112,000
Income from operations before service
department charges $ 4,410,000 $ 6,952,400
Less service department charges:
Supporting Schedule:
Note (1) Winter Sports Division: $611,000
Summer Sports Division: $746,900
FULL THROTTLE SPORTING GOODS CO.
Divisional Income Statements
For the Year Ended December 31, 2014
23-12
CHAPTER 23 Performance Evaluation for Decentralized Operations
Ex. 23–10 (FIN MAN); Ex. 8–10 (MAN)
a. Retail Division: 20% ($130,000 ÷ $650,000)
Ex. 23–11 (FIN MAN); Ex. 8–11 (MAN)
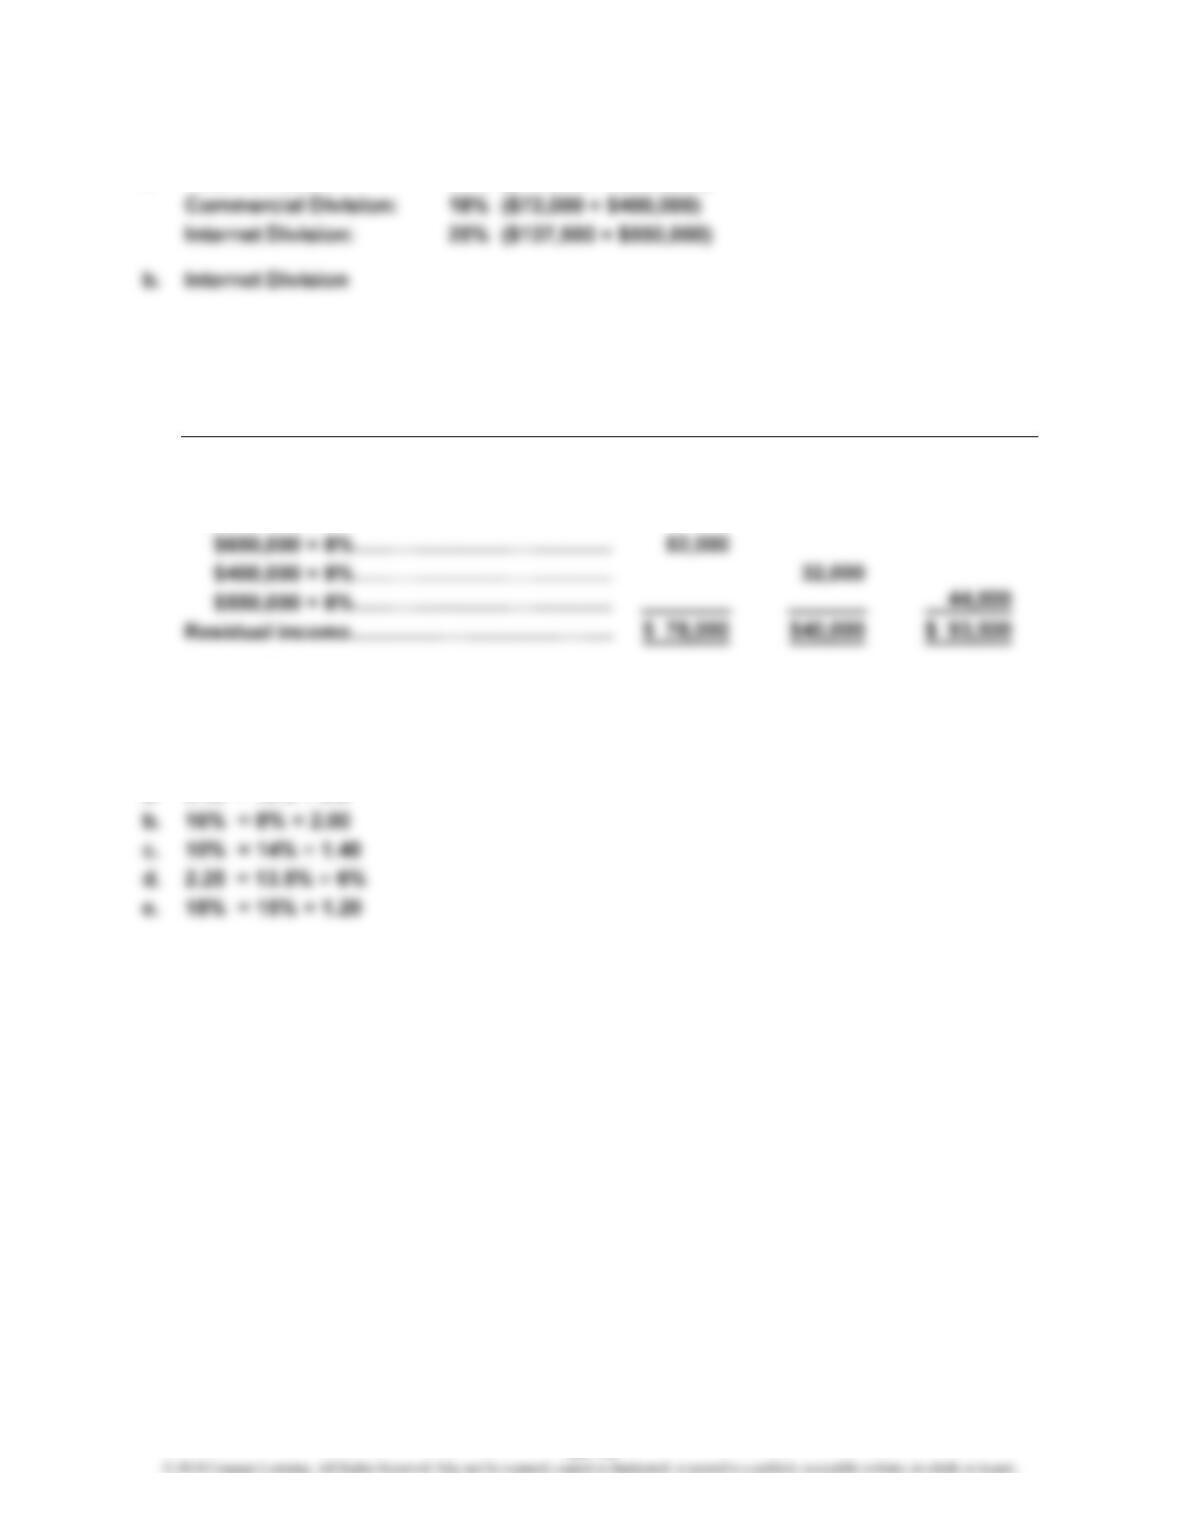
a. Retail Commercial Internet
Division Division Division
Income from operations………………………
…
$130,000 $72,000 $137,500
Minimum amount of income from
operations:
b. Internet Division
Ex. 23–12 (FIN MAN); Ex. 8–12 (MAN)
a. 2.40 = 12% ÷ 5%
23-13
CHAPTER 23 Performance Evaluation for Decentralized Operations
Ex. 23–13 (FIN MAN); Ex. 8–13 (MAN)
Sales
Invested Assets
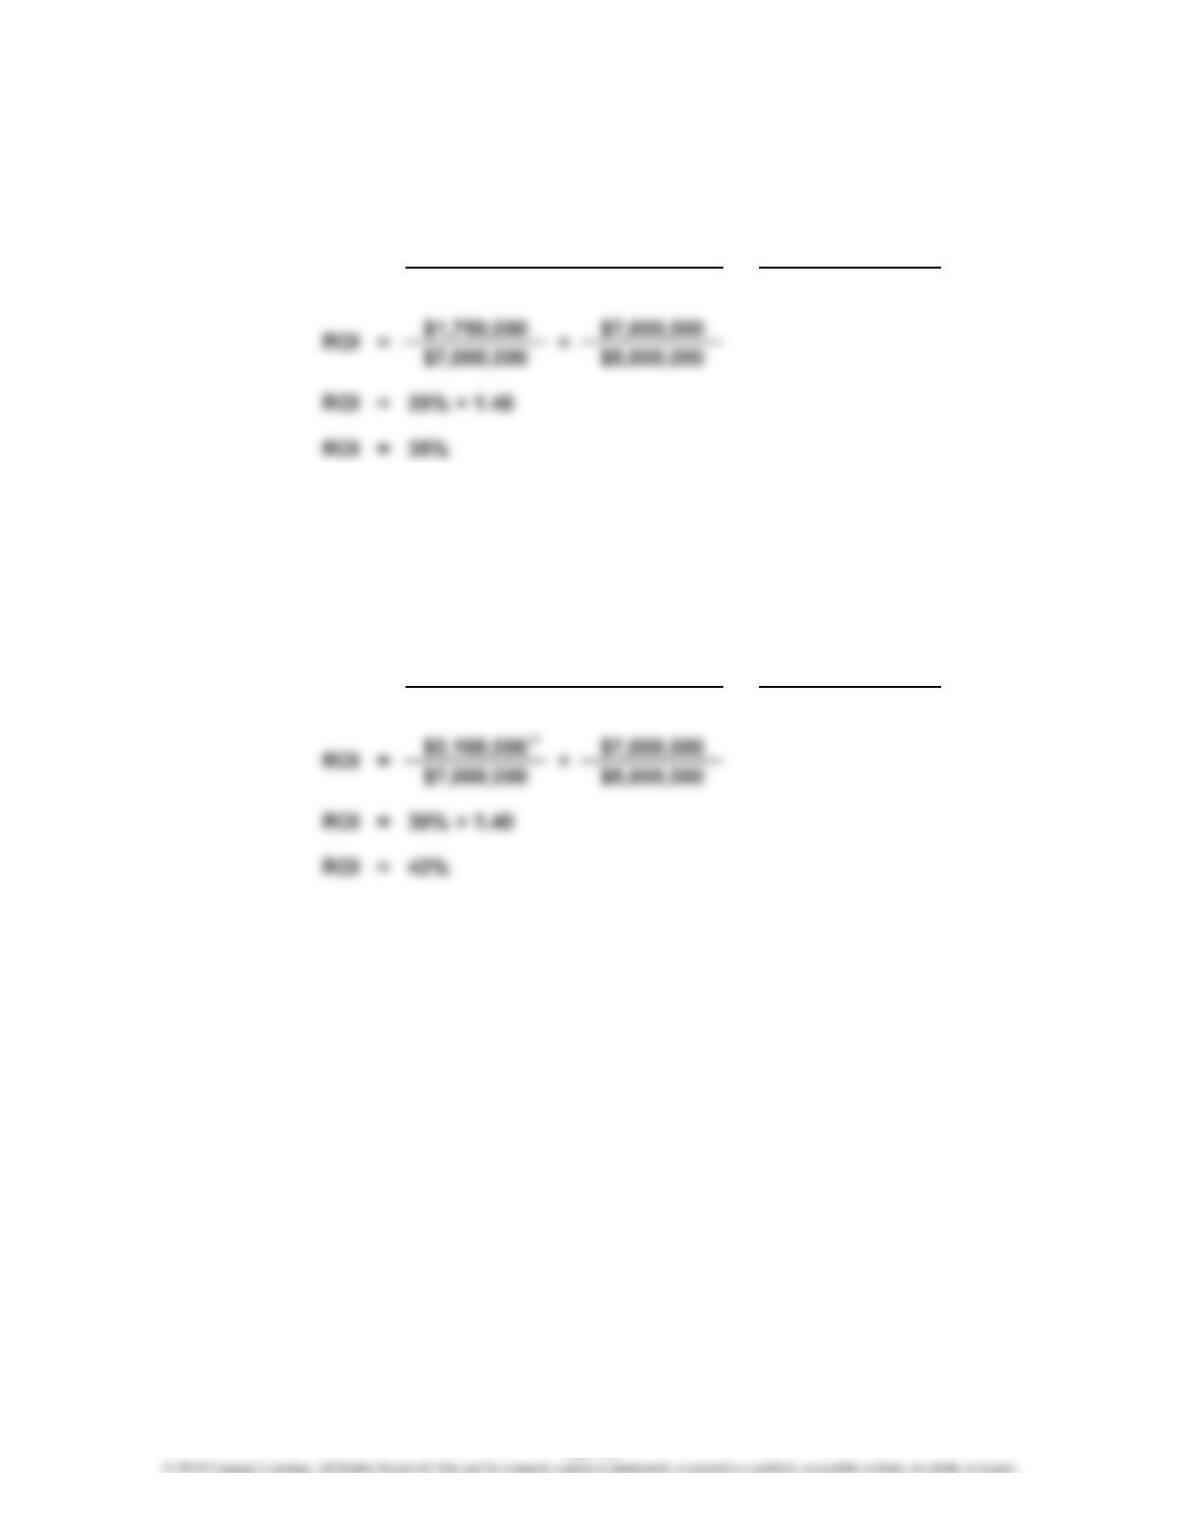
b. The profit margin would increase from 25% to 30%, the investment turnover
would remain unchanged, and the rate of return on investment would increase
from 35% to 42%, as shown below.
Sales
Invested Assets
a. Rate of Return
on Investment = Profit Margin × Investment Turnover
×
=
Rate of Return
on Investment Sales
Income from Operations
Rate of Return
on Investment = Profit Margin × Investment Turnover
Rate of Return
on Investment =Income from Operations ×
Sales
23-14
CHAPTER 23 Performance Evaluation for Decentralized Operations
Ex. 23–14 (FIN MAN); Ex. 8–14 (MAN)
Revenues
Invested Assets
$6,146 $18,714
$18,714 $27,244
$1,553 $11,797
$11,797 $19,530
$618 $6,351
$6,351 $12,221
$816 $3,049
$3,049 $4,992
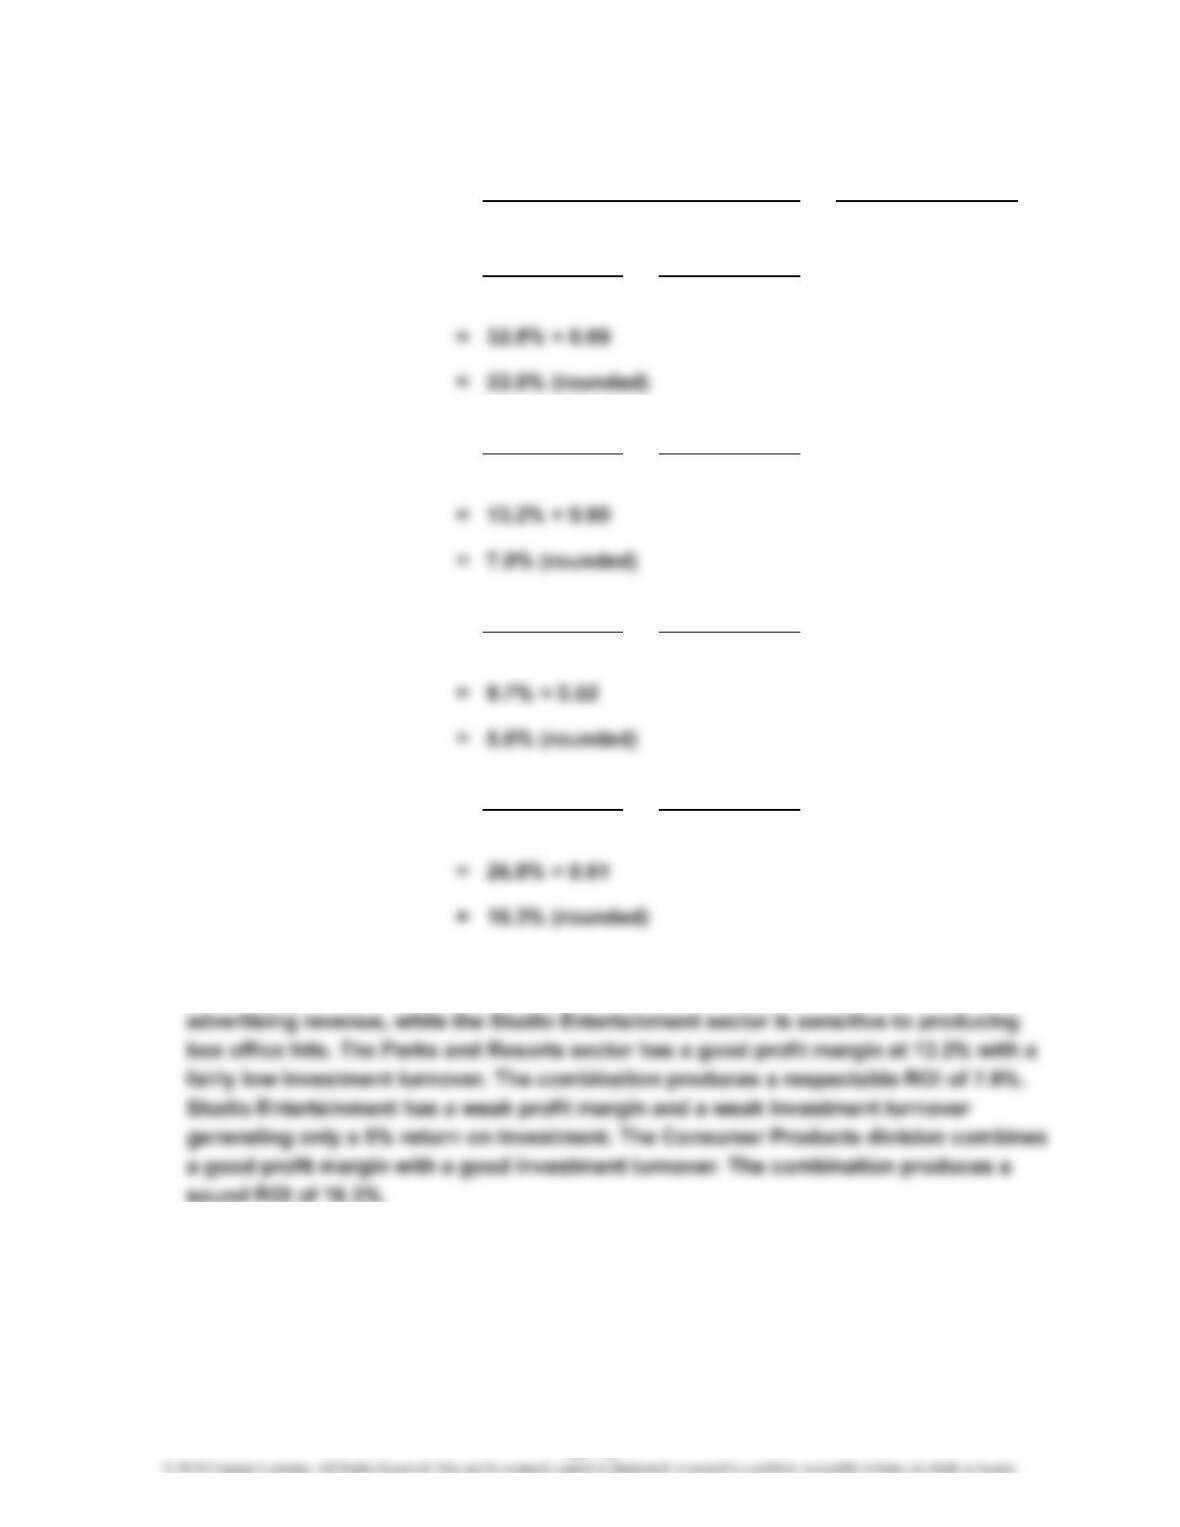
b. The four sectors are different from each other. Media Networks combines a good
profit margin with a very low investment turnover. Media Networks is sensitive to
Income from Operations
Consumer Products: ×
× Parks and Resorts:
Studio Entertainment: ×
=
Rate of Return
on Investment
a. ×
Media Networks: ×
Revenues
23-15
CHAPTER 23 Performance Evaluation for Decentralized Operations
Ex. 23–15 (FIN MAN); Ex. 8–15 (MAN)
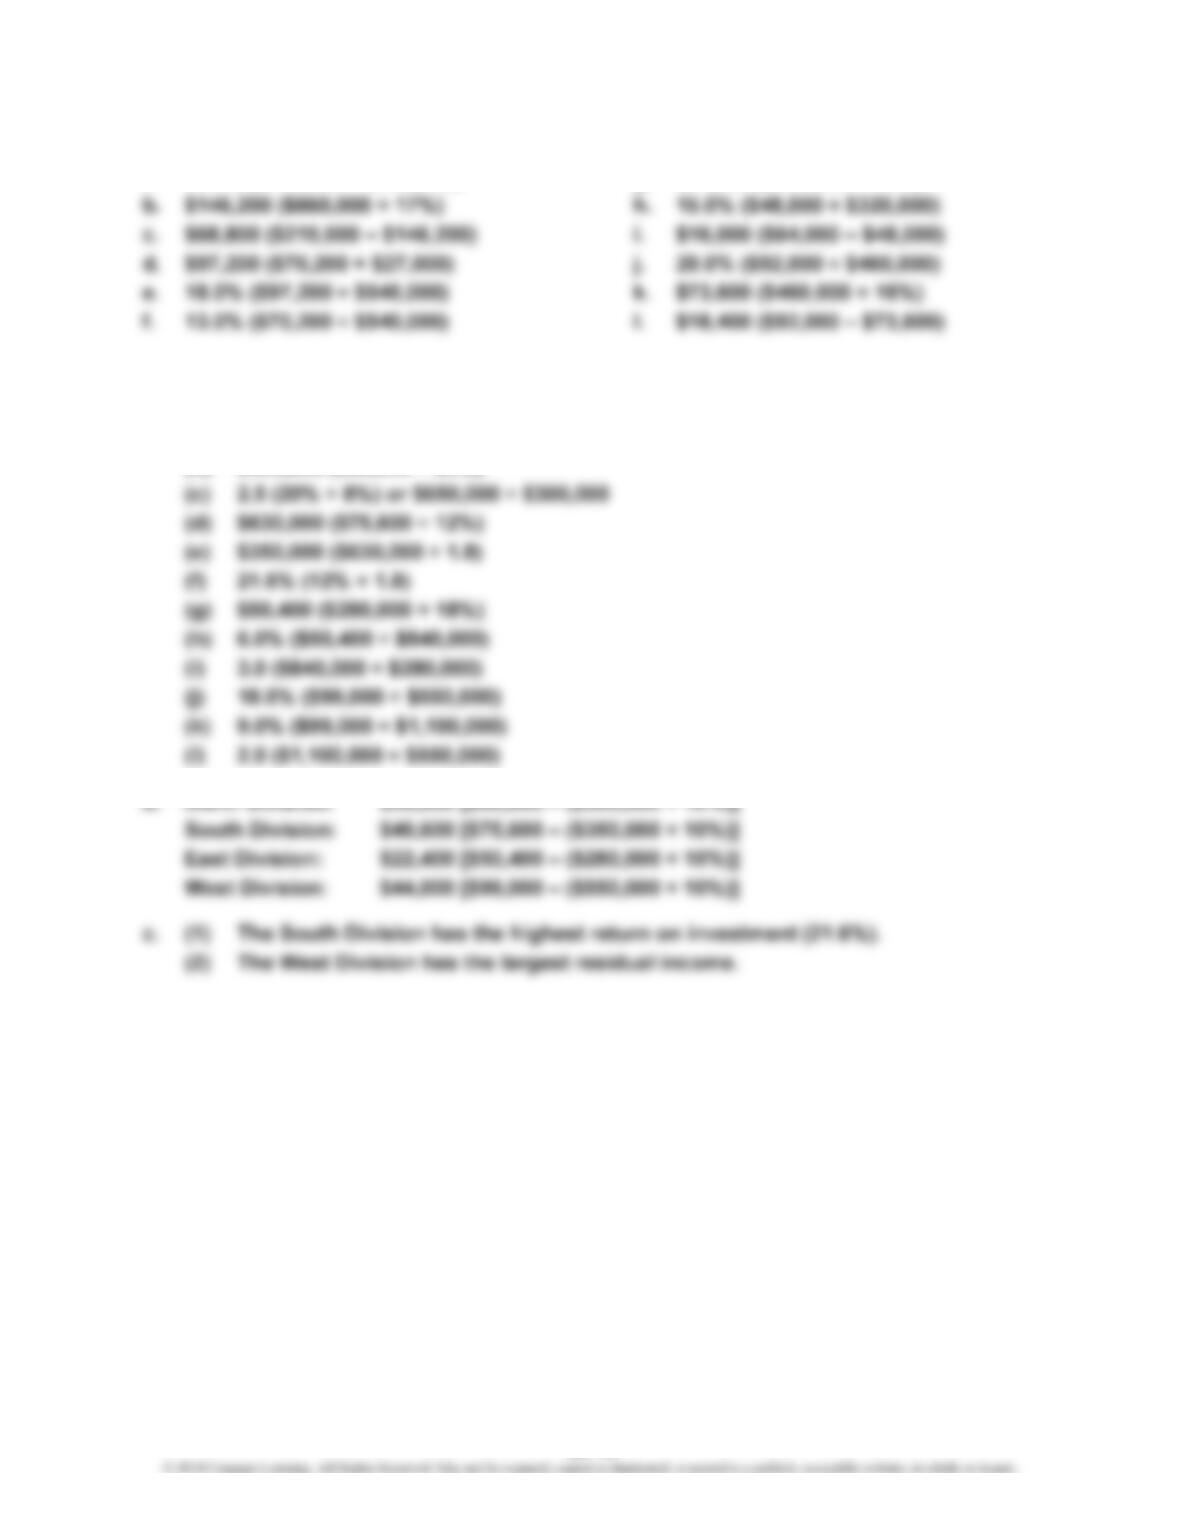
a. 25.0% ($215,000 ÷ $860,000) g. $64,000 ($320,000 × 20%)
Ex. 23–16 (FIN MAN); Ex. 8–16 (MAN)
a. (a) $60,000 ($750,000 × 8%)
(b) $300,000 ($60,000 ÷ 20%)
23-16
CHAPTER 23 Performance Evaluation for Decentralized Operations
Ex. 23–17 (FIN MAN); Ex. 8–17 (MAN)
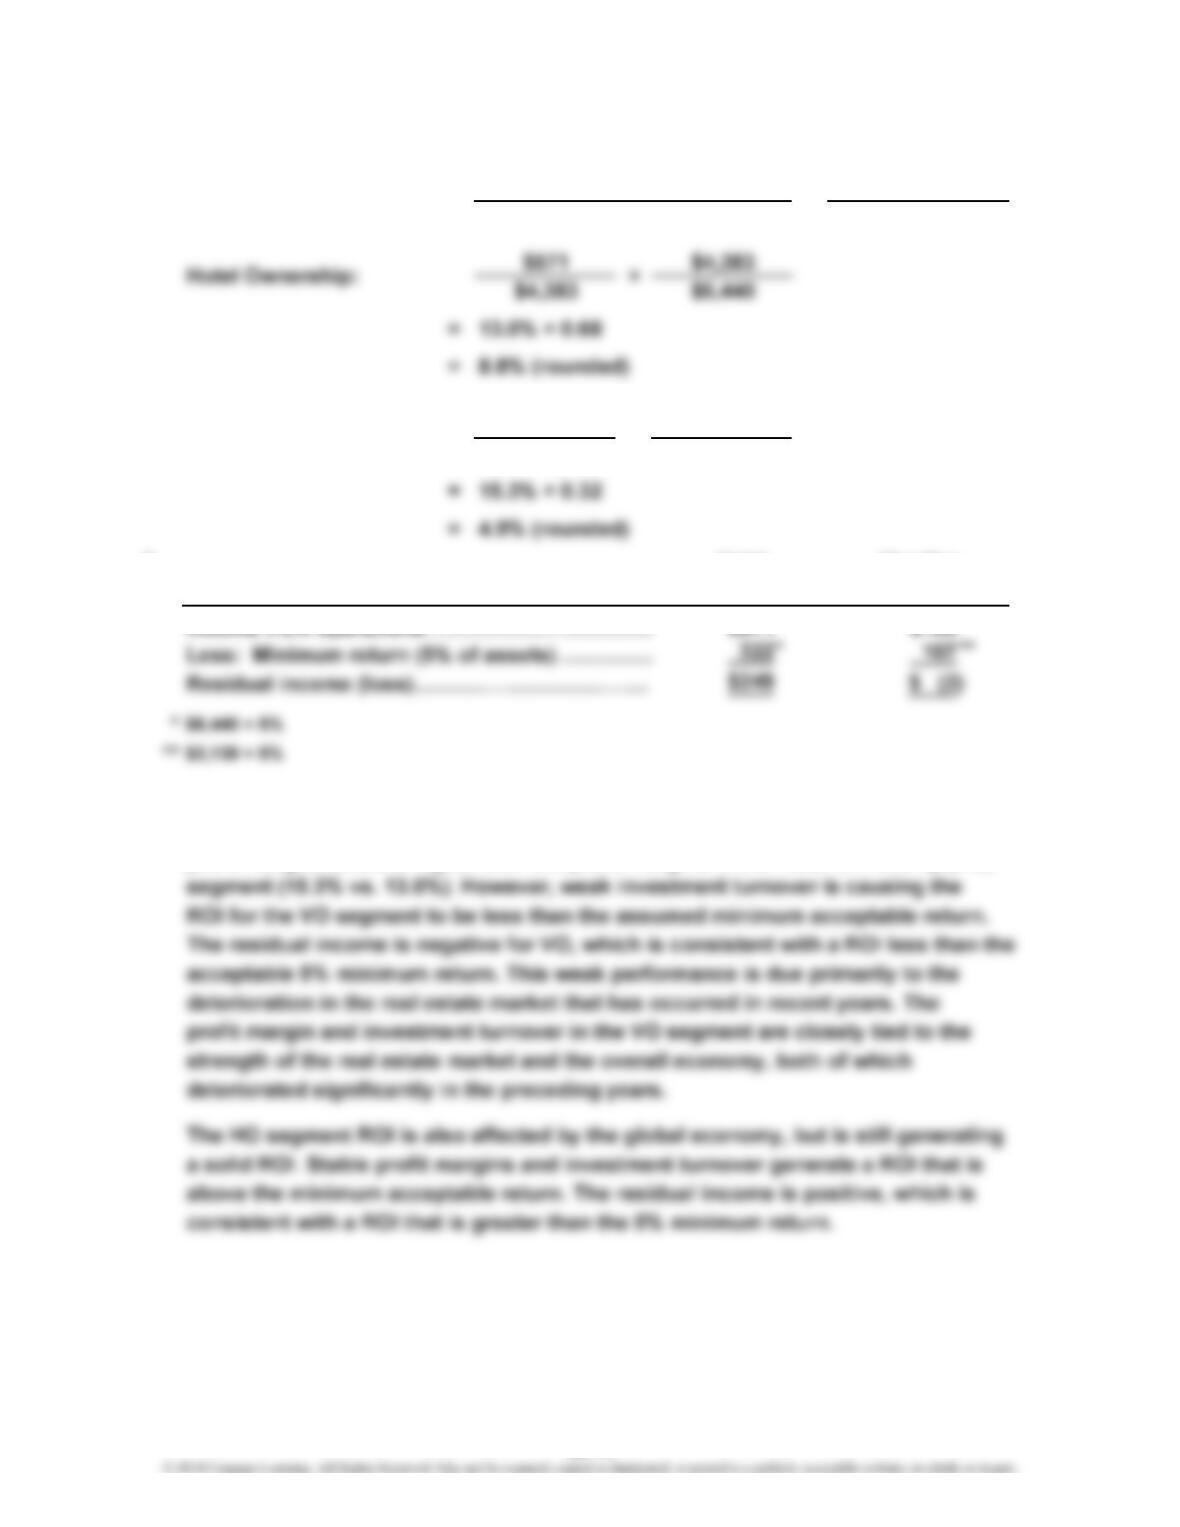
Revenues
Invested Assets
$105 $688
$688 $2,139
b. Vacation
Ownership
c. The Vacation Ownership (VO) segment has the weakest return on investment,
which is mainly the result of a weak investment turnover. The VO segment earns
profit margins that are higher than the profit margins in the Hotel Ownership (HO)
Revenues
Ownership
Hotel
Income from Operations
a.
Vacation Ownership: ×
× =
Rate of Return
on Investment
23-17
CHAPTER 23 Performance Evaluation for Decentralized Operations
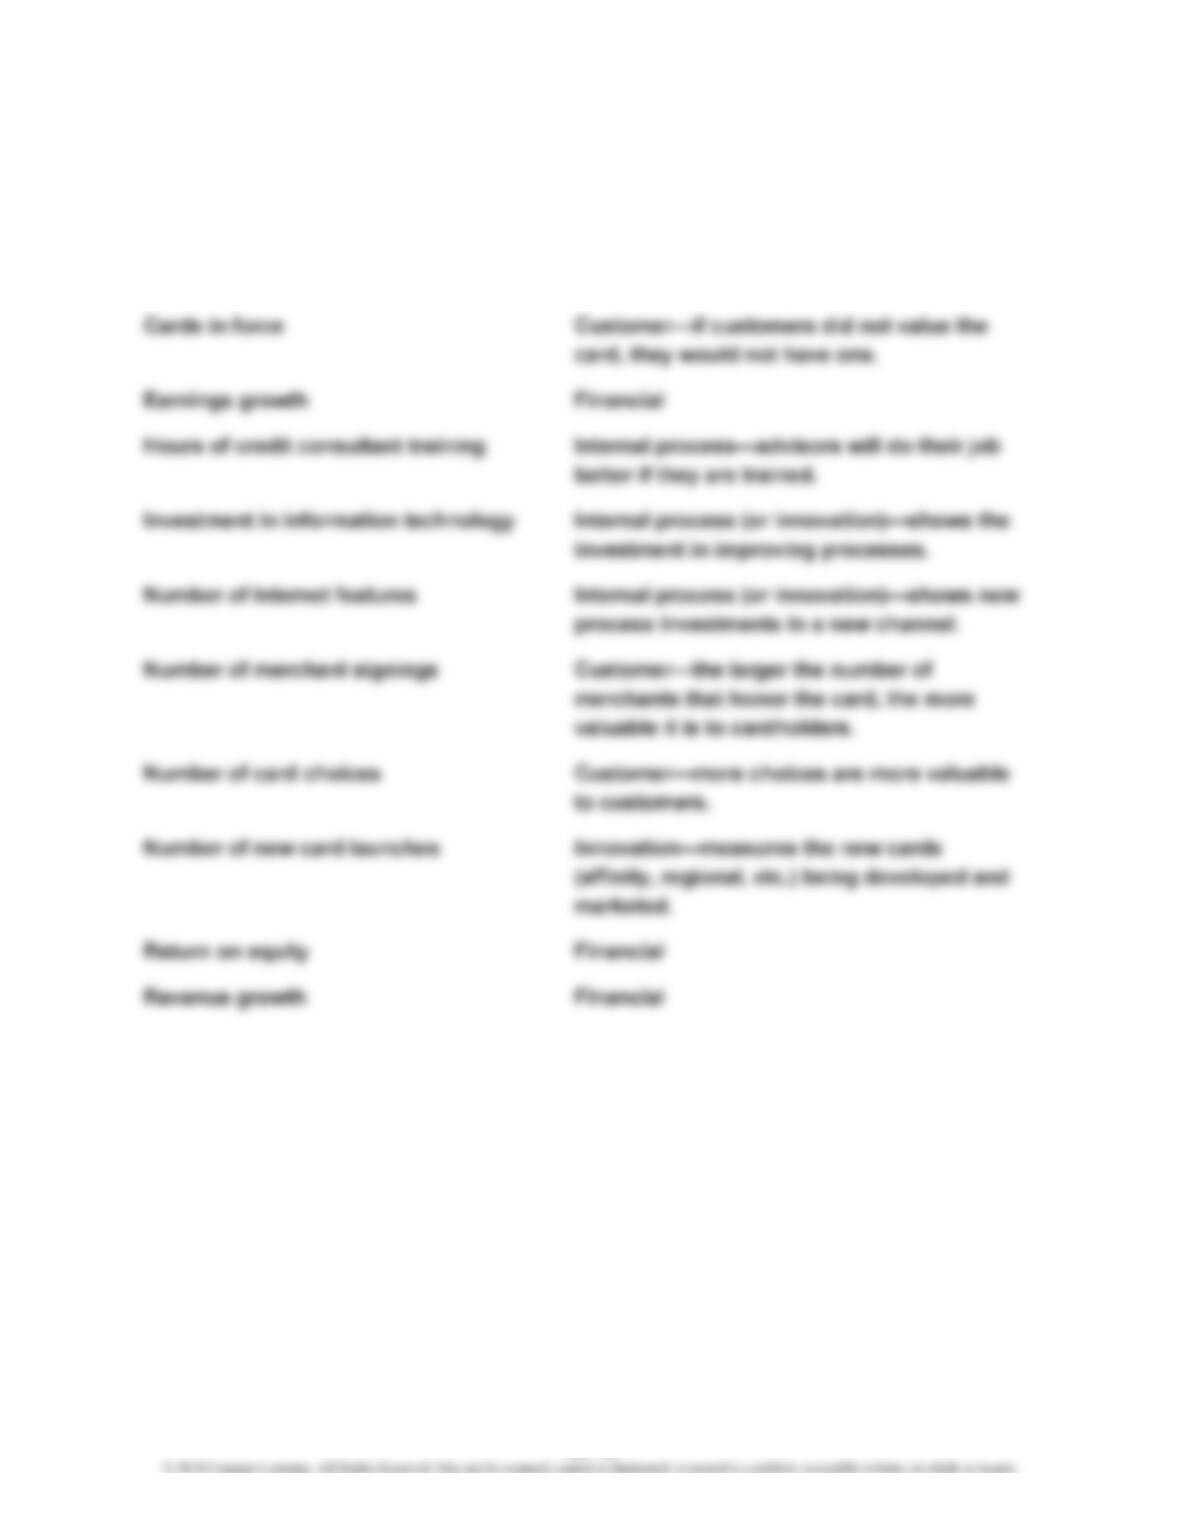
Ex. 23–18 (FIN MAN); Ex. 8–18 (MAN)
Although there is some judgment in classifying each of these measures, the following
represents the author’s assessment with explanations:
Average card member spending Customer—demonstrates the usefulness of
the card to the customer.
23-18
CHAPTER 23 Performance Evaluation for Decentralized Operations
Ex. 23–19 (FIN MAN); Ex. 8–19 (MAN)
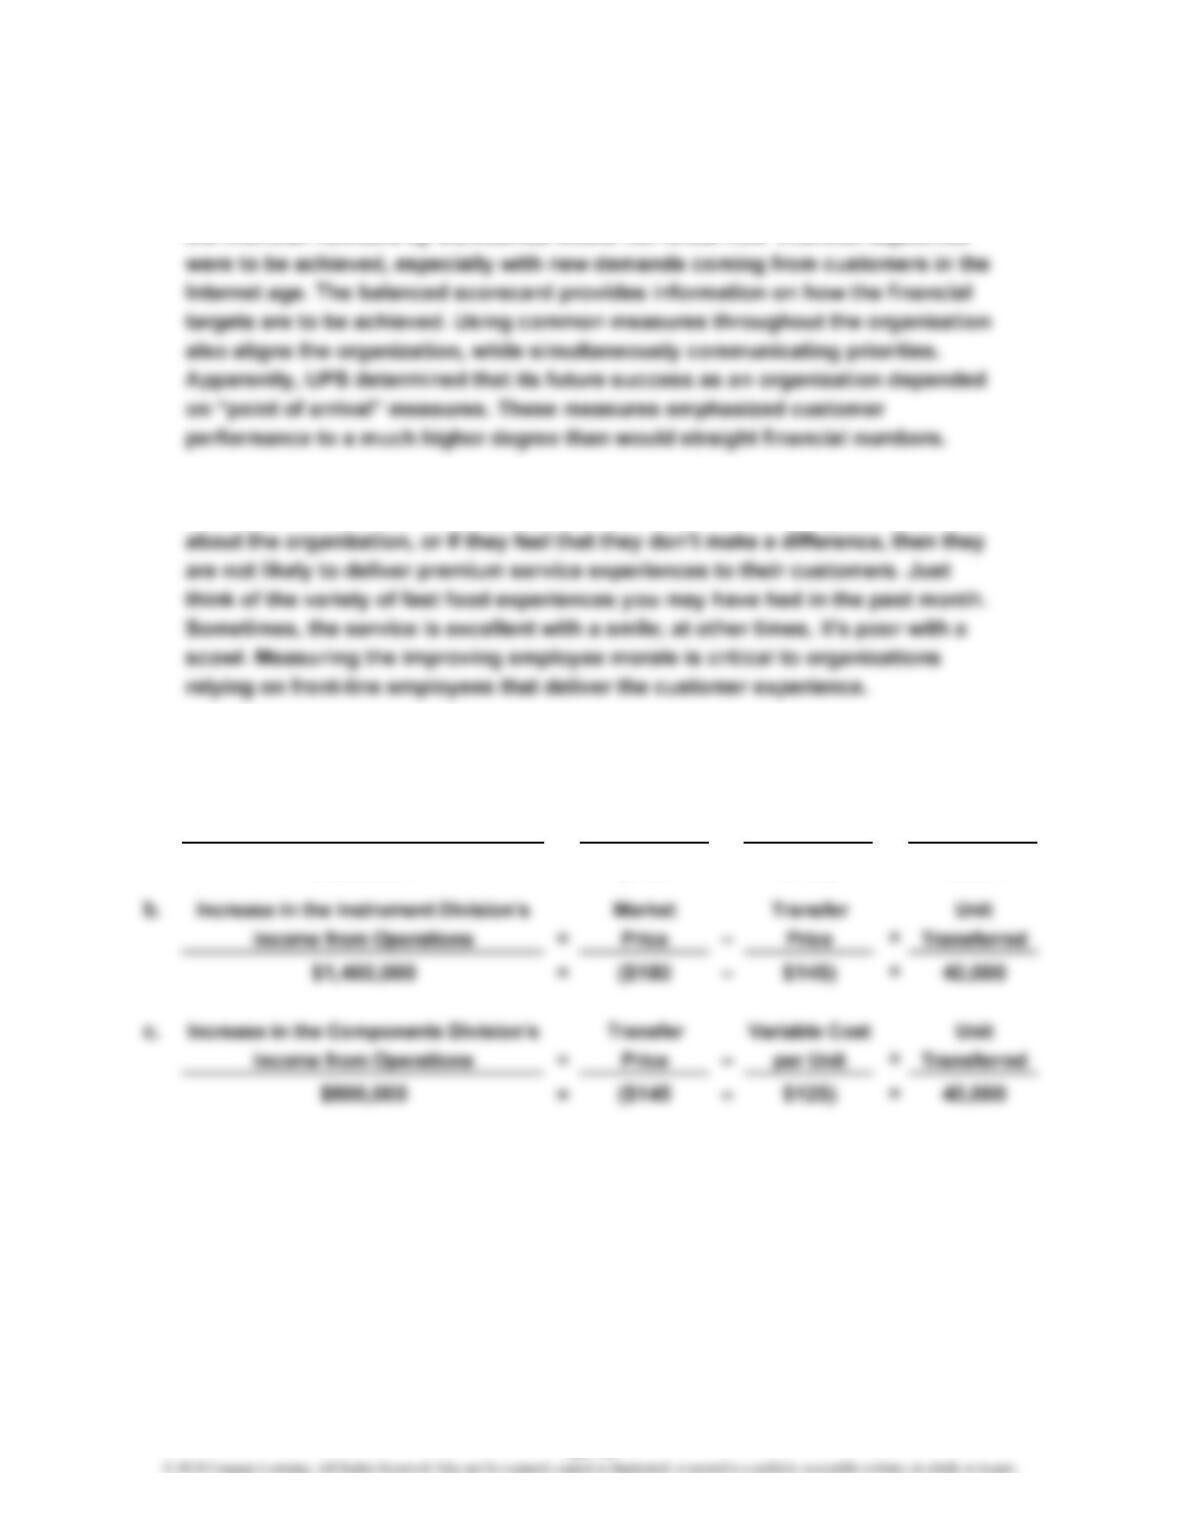
a. UPS wanted a performance measurement system that would focus more on
the underlying drivers, or levers, of financial success. It believed that focusing on
the financial numbers by themselves would not reveal how financial objectives
b. The employee sentiment number is common in service businesses. The
employees are the face of the company to the customer. If employees feel poorly
Ex. 23–20 (FIN MAN); Ex. 8–20 (MAN)
a. Increase in Dart Industries’ Market Variable Cost Unit
Income from Operations = Price – per Unit × Transferred
$2,200,000 =($180 –$125) × 40,000
23-19
CHAPTER 23 Performance Evaluation for Decentralized Operations
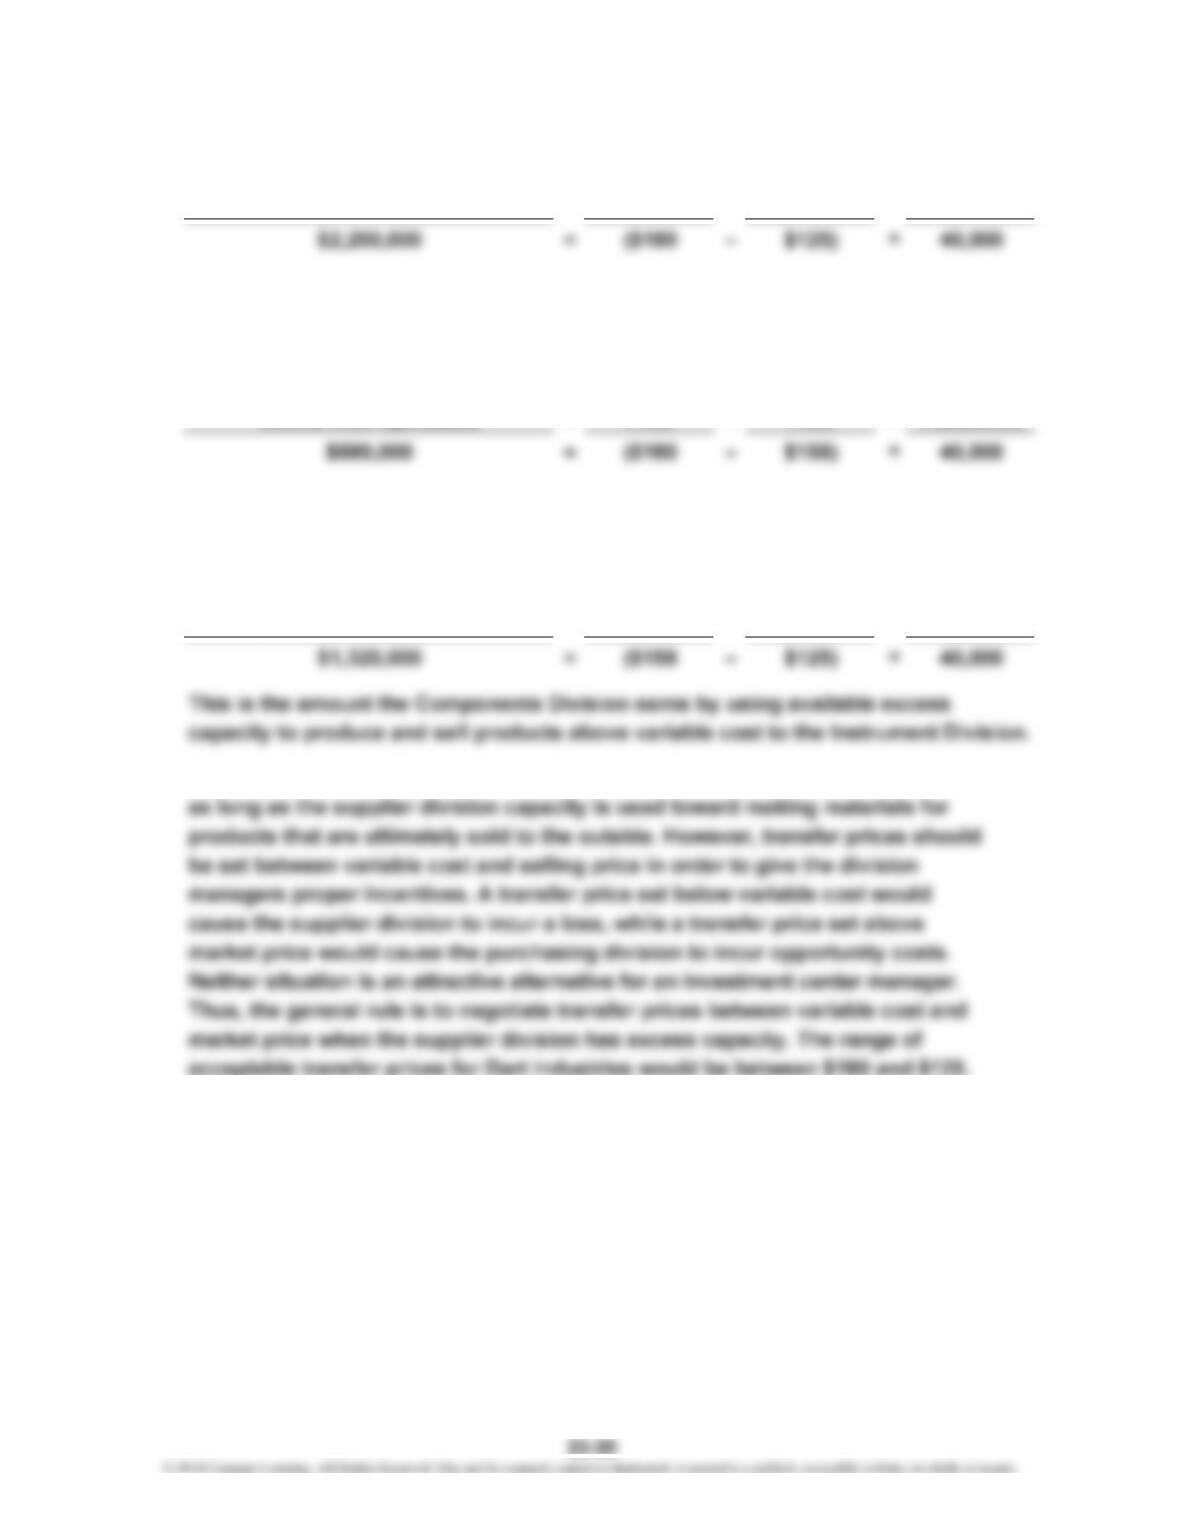
Ex. 23–21 (FIN MAN); Ex. 8–21 (MAN)
a. Increase in Dart Industries’ Market Variable Cost Units
Income from Operations = Price – per Unit × Transferred
This amount is the same amount by which Dart Industries’ income from operations
increased in Ex. 23–20 (FIN MAN); Ex 8–20 (MAN), when a transfer price of $145 was
used.
b. Increase in the Instrument Division’s Market Transfer Units
Income from Operations = Price – Price × Transferred
This is the amount the Instrument Division saves by purchasing from the
Components Division at an internal price that is lower than the market price.
c. Increase in the Components Division’s Transfer Variable Cost Units
Income from Operations = Price – per Unit × Transferred
d. Any transfer price will cause the total income of the company to increase,