CHAPTER 19 Cost Behavior and Cost-Volume-Profit Analysis
Prob. 19–2A (FIN MAN); Prob. 4–2A (MAN)
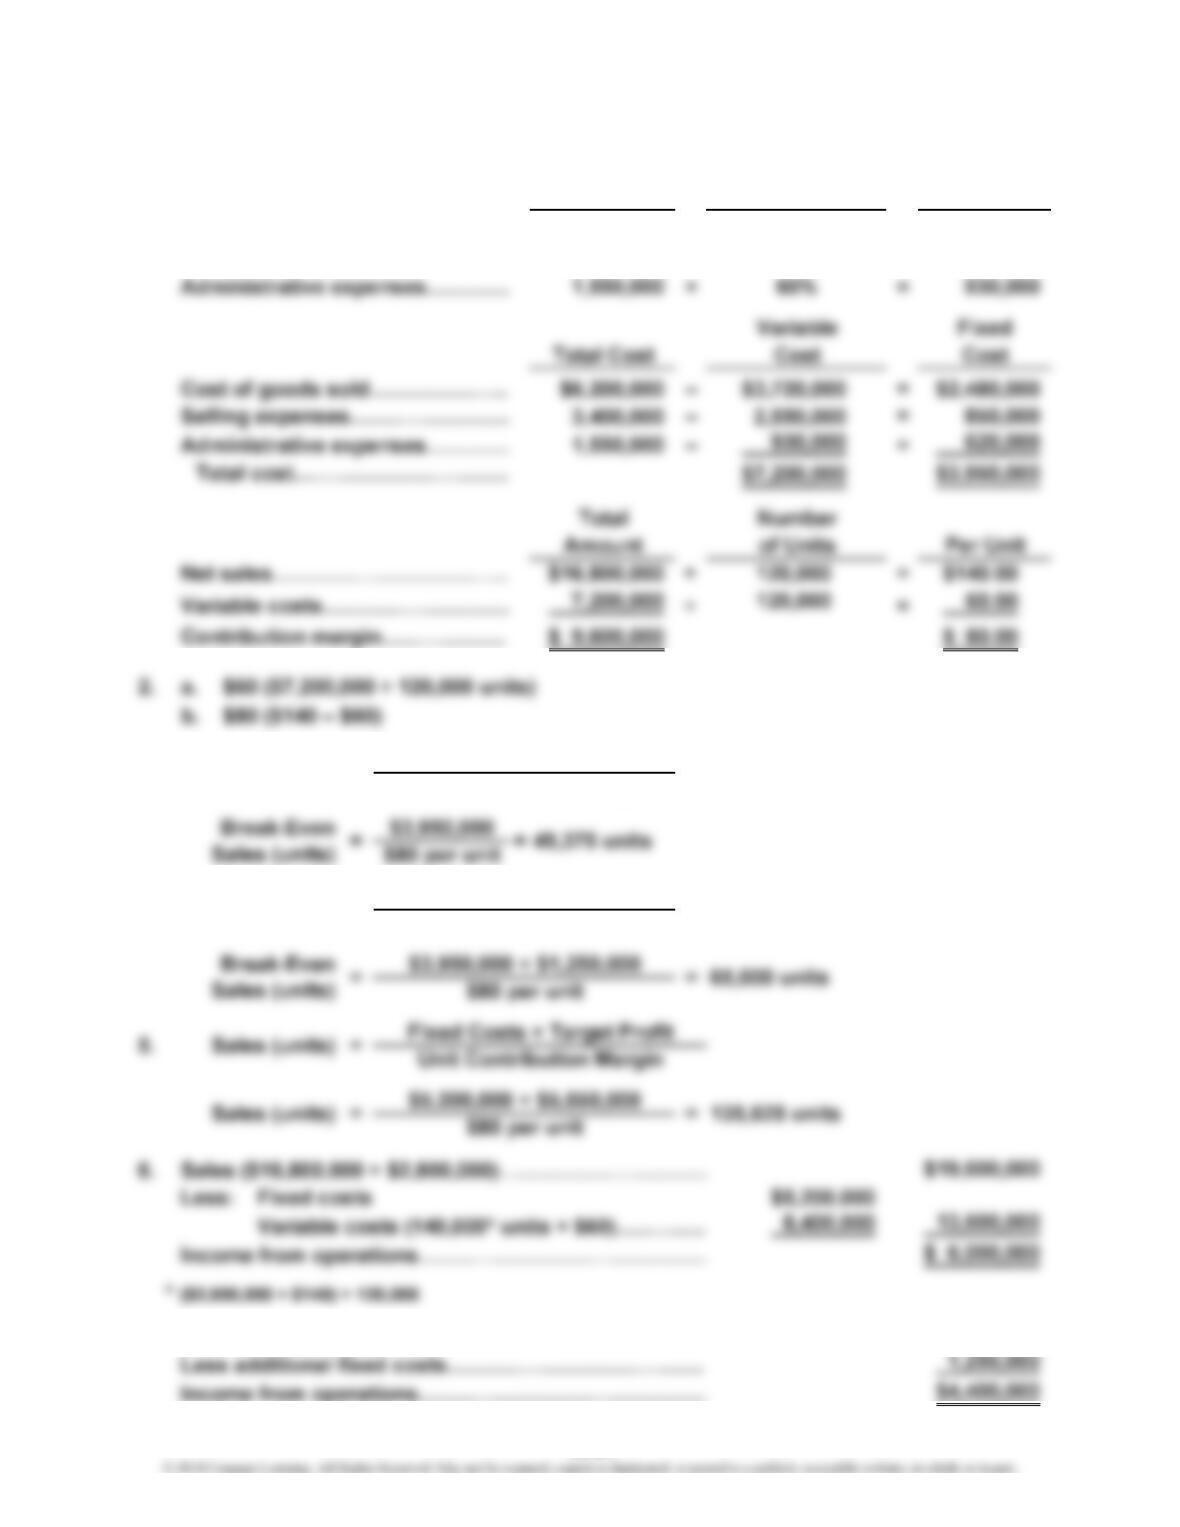
1. Variable Variable
Total Cost Cost Percentage Cost
Cost of goods sold………………
…
$6,200,000 × 60% = $3,720,000
Selling expenses…………………
…
3,400,000 ×75% = 2,550,000
7. Present operating income…………………………………
…
$5,650,000
4. Break-Even
Sales (units) =Fixed Costs
Unit Contribution Margin
3. Fixed Costs
Unit Contribution Margin
Break-Even
Sales (units) =
19-21
…
…
CHAPTER 19 Cost Behavior and Cost-Volume-Profit Analysis
Prob. 19–2A (FIN MAN); Prob. 4–2A (MAN) (Concluded)
8. In favor of the proposal is the possibility of increasing income from operations
from $5,650,000 to $6,000,000. However, there are many points against the
proposal, including:
19-22
CHAPTER 19 Cost Behavior and Cost-Volume-Profit Analysis
Prob. 19–3A (FIN MAN); Prob. 4–3A (MAN)
3.
4. Sales (16,000 × $100)…………………………
…
$1,600,000
Total fixed costs………………………………
…
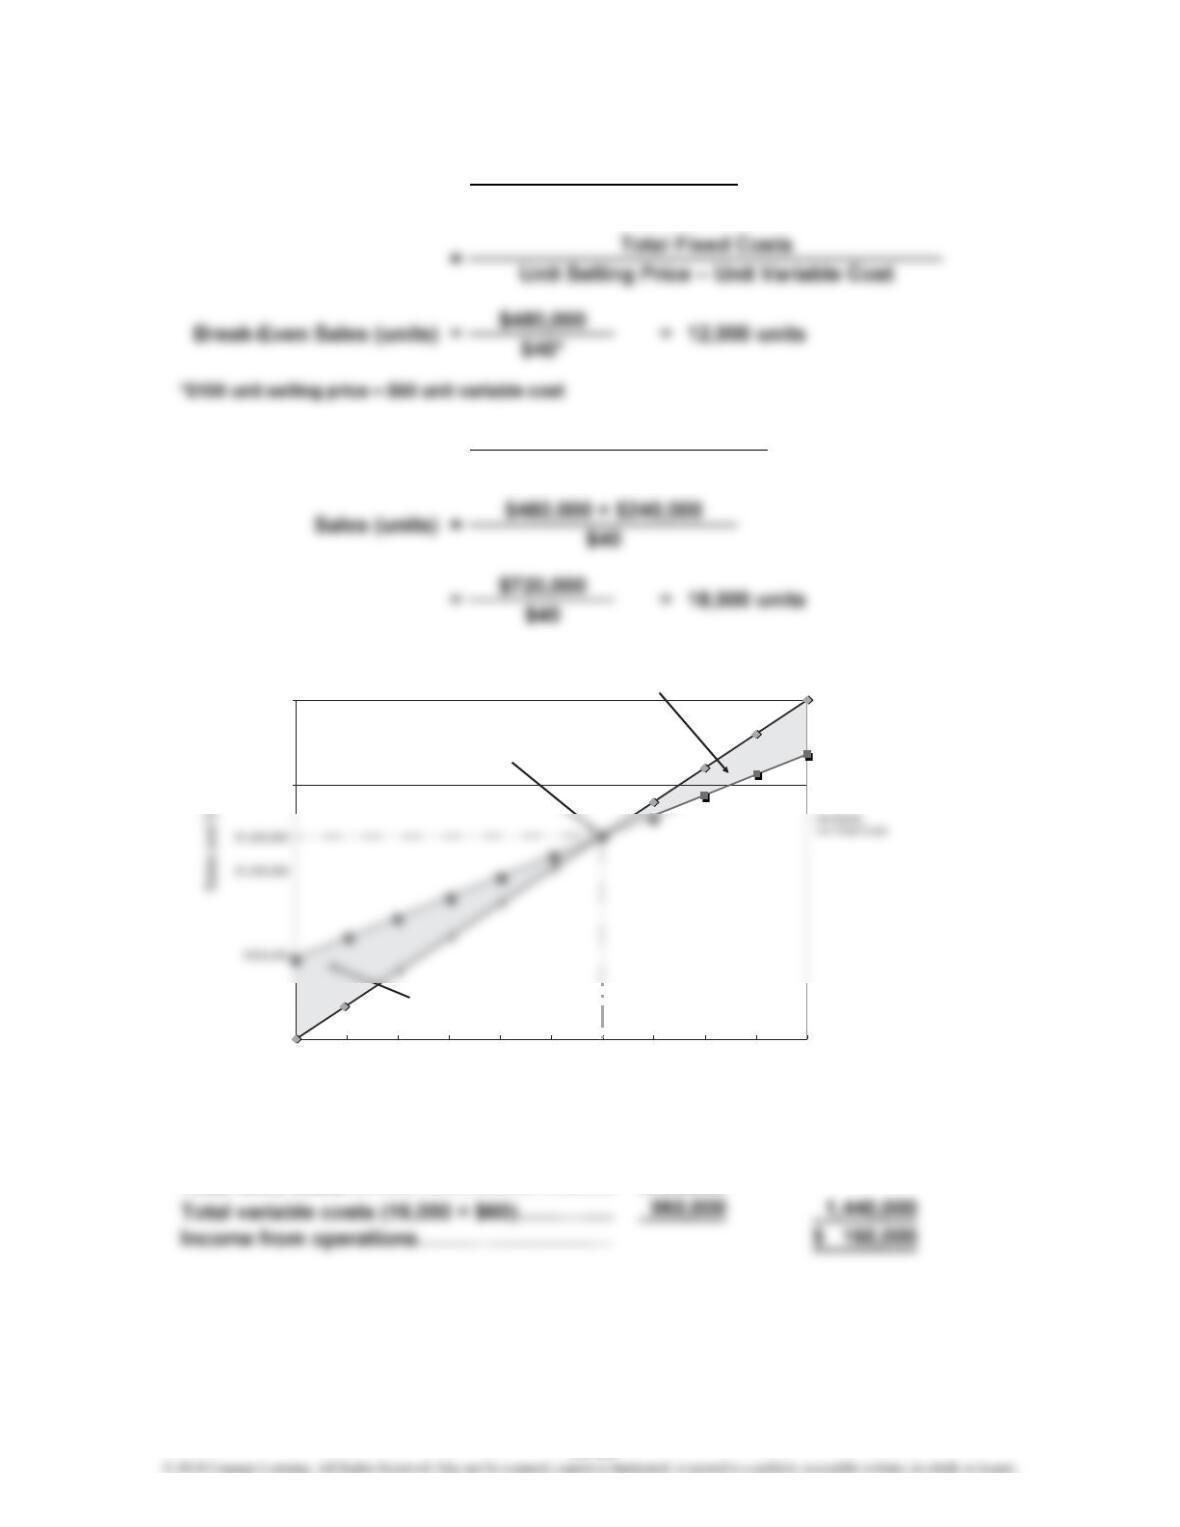
1. Break-Even Sales (units) = Total Fixed Costs
Unit Contribution Margin
2. Sales (units) = Fixed Costs + Target Profit
Unit Contribution Margin
$480,000
$0
$1,500,000
$2,000,000
0 2,000 4,000 6,000 8,000 10,000 12,000 14,000 16,000 18,000 20,000
Units of Sales
Operating Loss
Area
Operating Profit Area
Break-Even Point
19-23
CHAPTER 19 Cost Behavior and Cost-Volume-Profit Analysis
Prob. 19–4A (FIN MAN); Prob. 4–4A (MAN)
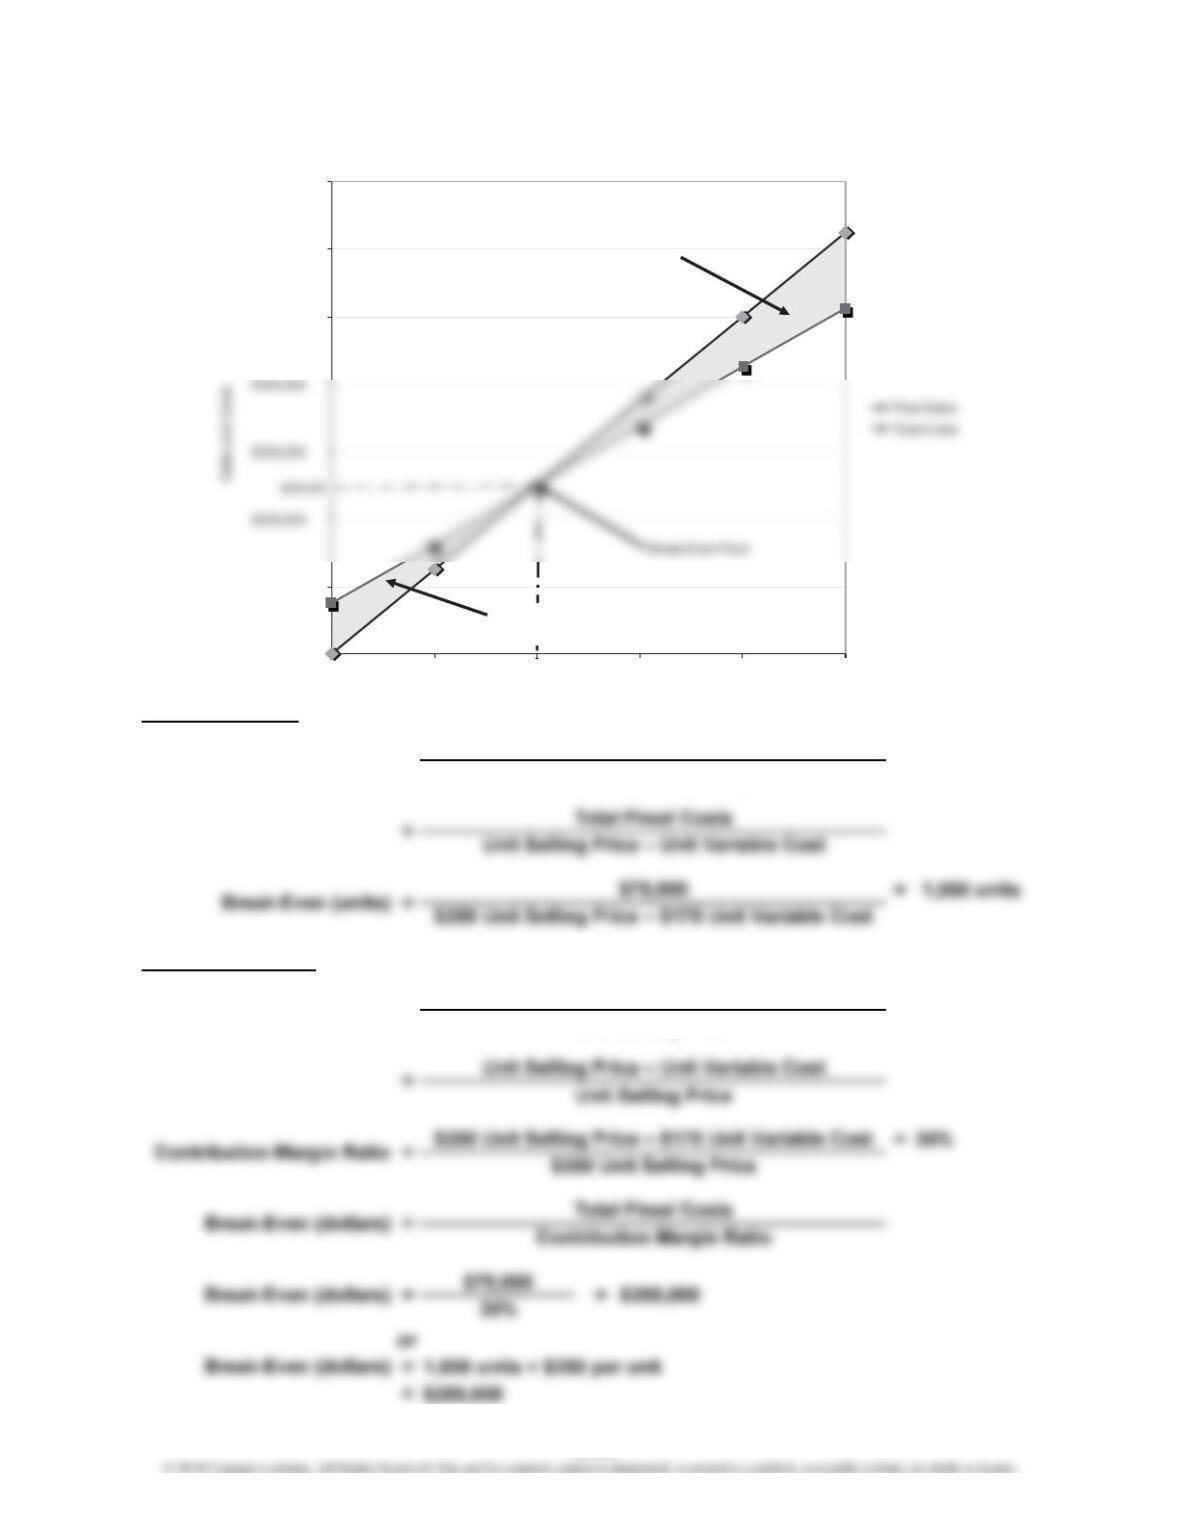
1.
Contribution Margin Ratio
Unit Selling Price
Total Fixed Costs
Unit Contribution Margin
=Unit Contribution Margin
=
Break-Even Units:
Break-Even Dollars:
Break-Even Sales (units)
$0
$100,000
$500,000
$600,000
$700,000
0 500 1,000 1,500 2,000 2,500
Units of Sales
Operating
Profit Area
Operating
Loss Area
$75,000
19-24
CHAPTER 19 Cost Behavior and Cost-Volume-Profit Analysis
Prob. 19–4A (FIN MAN); Prob. 4–4A (MAN) (Continued)
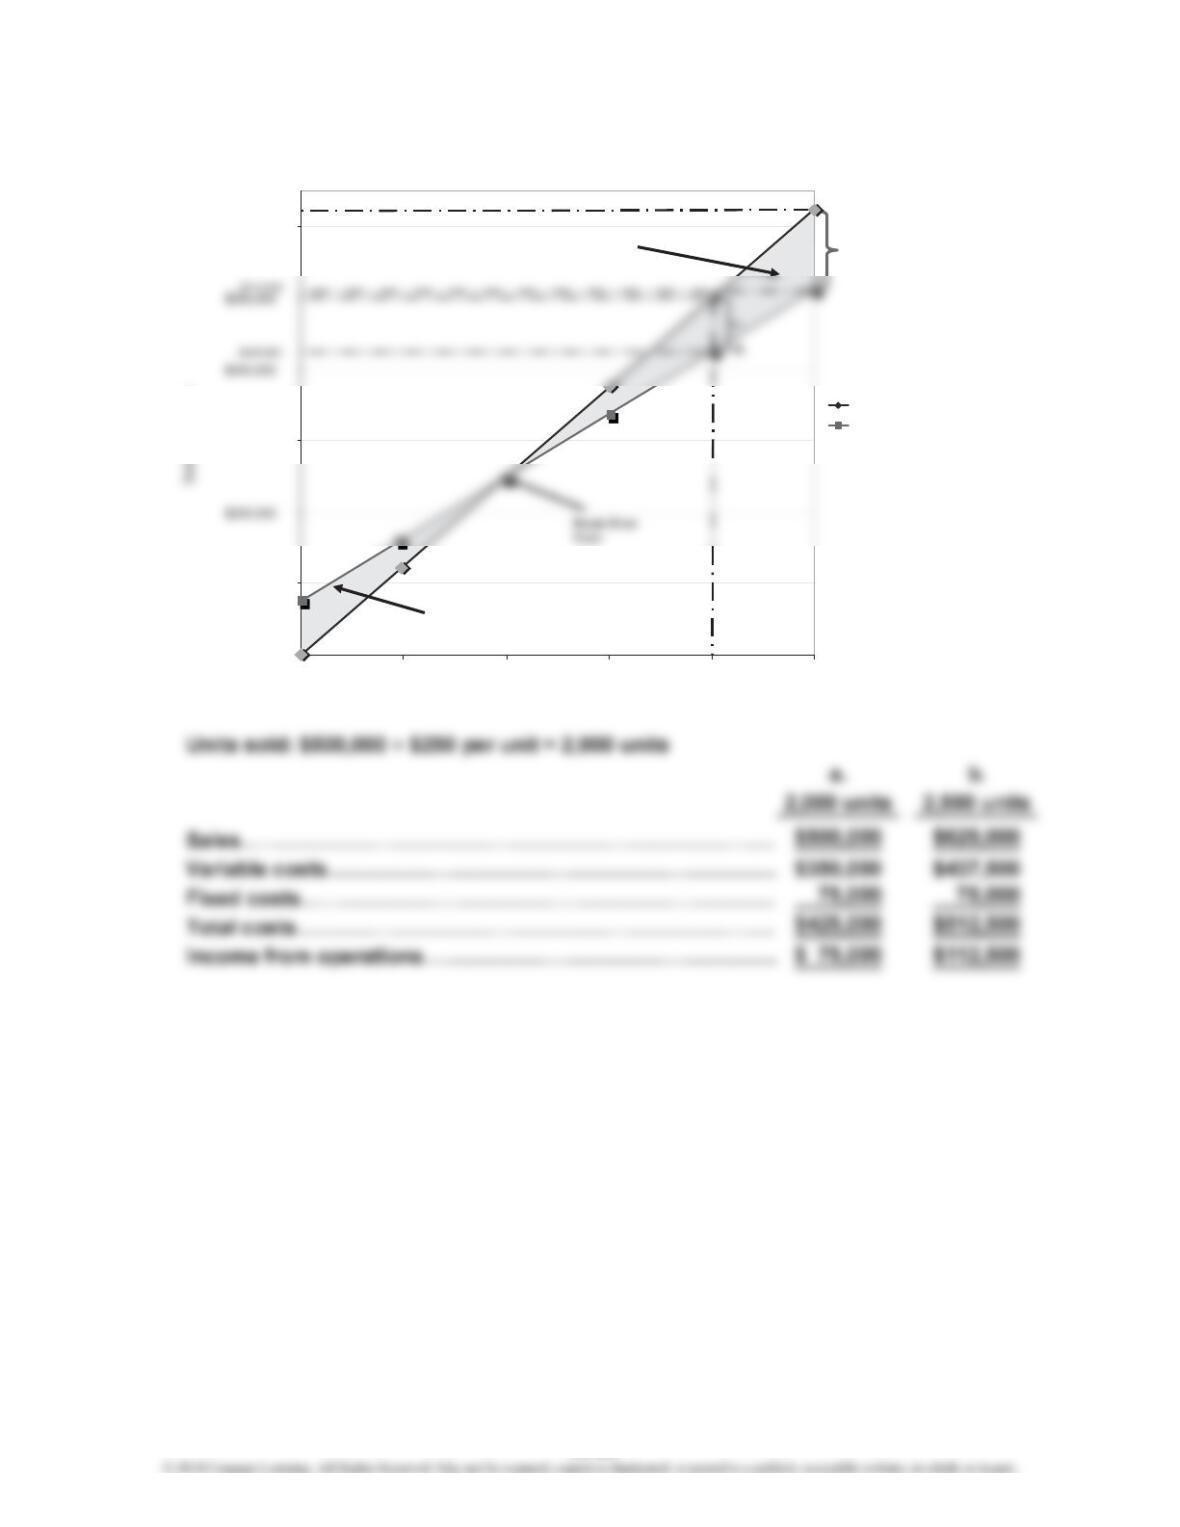
2.
$0
$100,000
$300,000
$600,000
0 500 1,000 1,500 2,000 2,500
Units of Sales
Tot a l Sale s
Total Costs
Operating
Profit Area
Operating Loss
Area
$625,000
$75,000
19-25
CHAPTER 19 Cost Behavior and Cost-Volume-Profit Analysis
Prob. 19–4A (FIN MAN); Prob. 4–4A (MAN) (Continued)
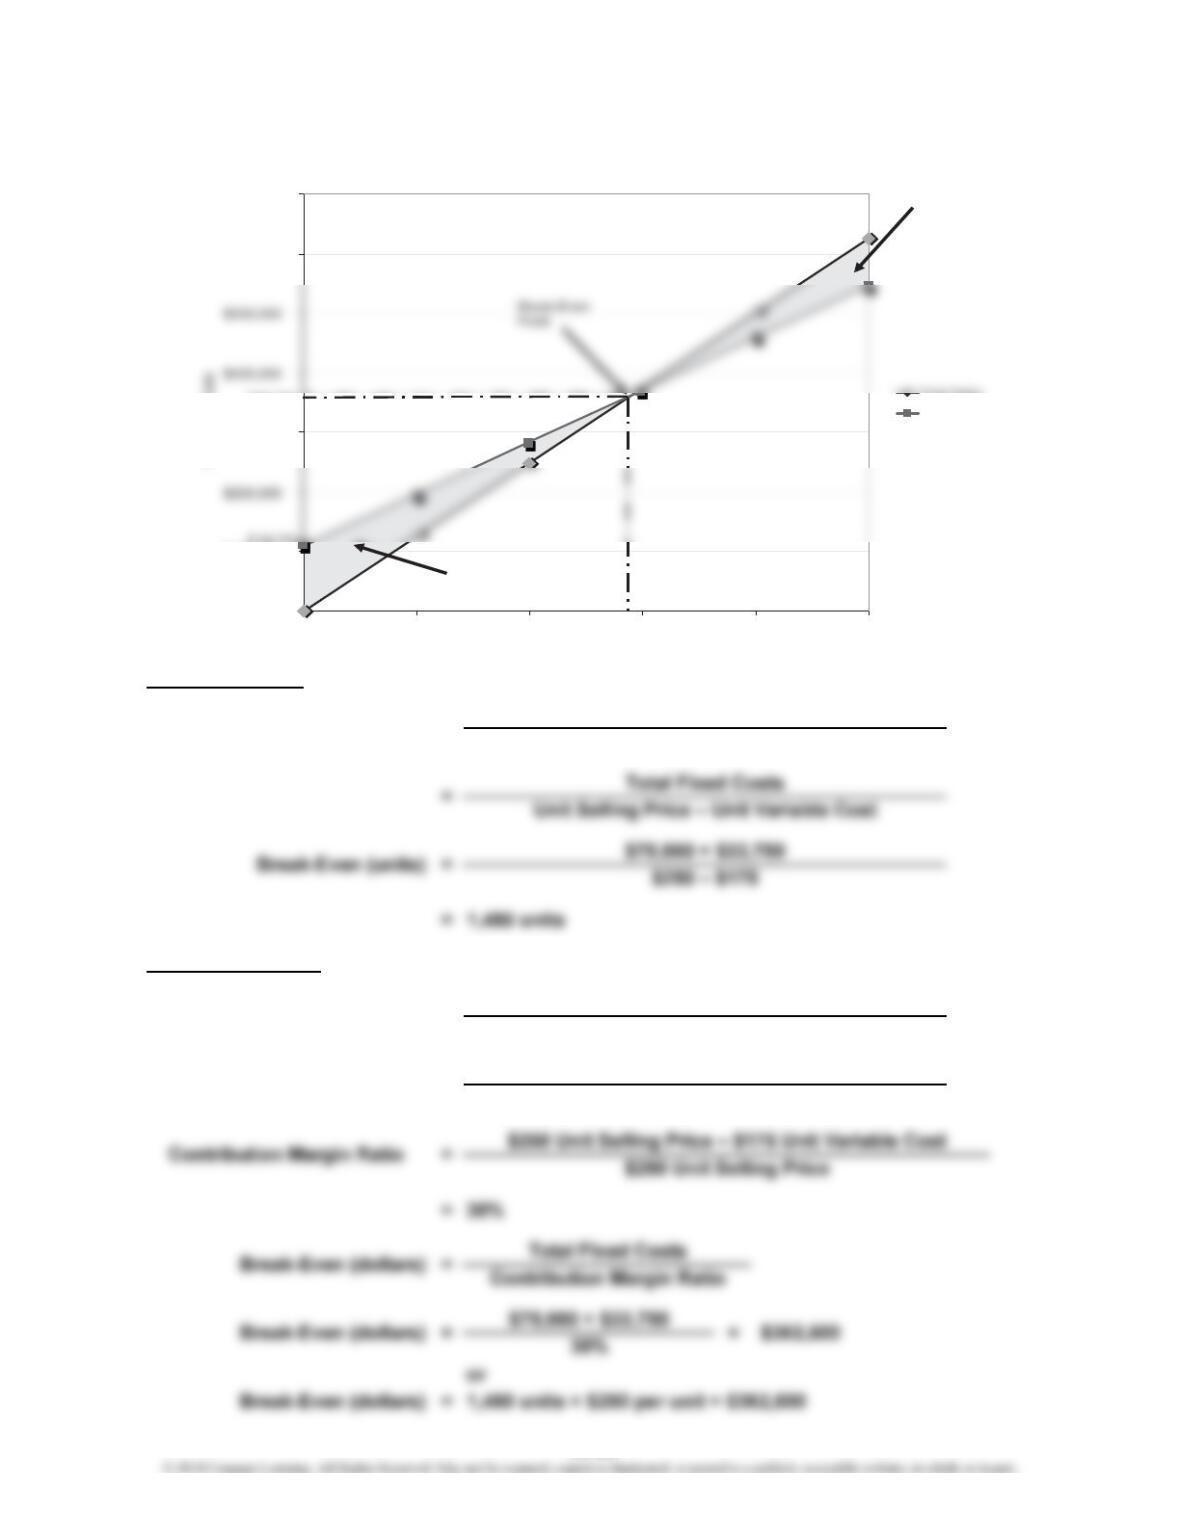
3.
Break-Even Units:
Break-Even Dollars:
Unit Contribution Margin
Break-Even Sales (units) = Total Fixed Costs
=
=
Contribution Margin Ratio Unit Contribution Margin
Unit Selling Price
Unit Selling Price – Unit Variable Cost
Unit Selling Price
$0
$100,000
$300,000
$600,000
$700,000
0 500 1,000 1,500 2,000 2,500
Sales and Costs
Units of Sales
Total Sales
Total Costs
Operating
Profit Area
Operating Loss
Area
$362,500
1,450
$108,750
19-26
CHAPTER 19 Cost Behavior and Cost-Volume-Profit Analysis
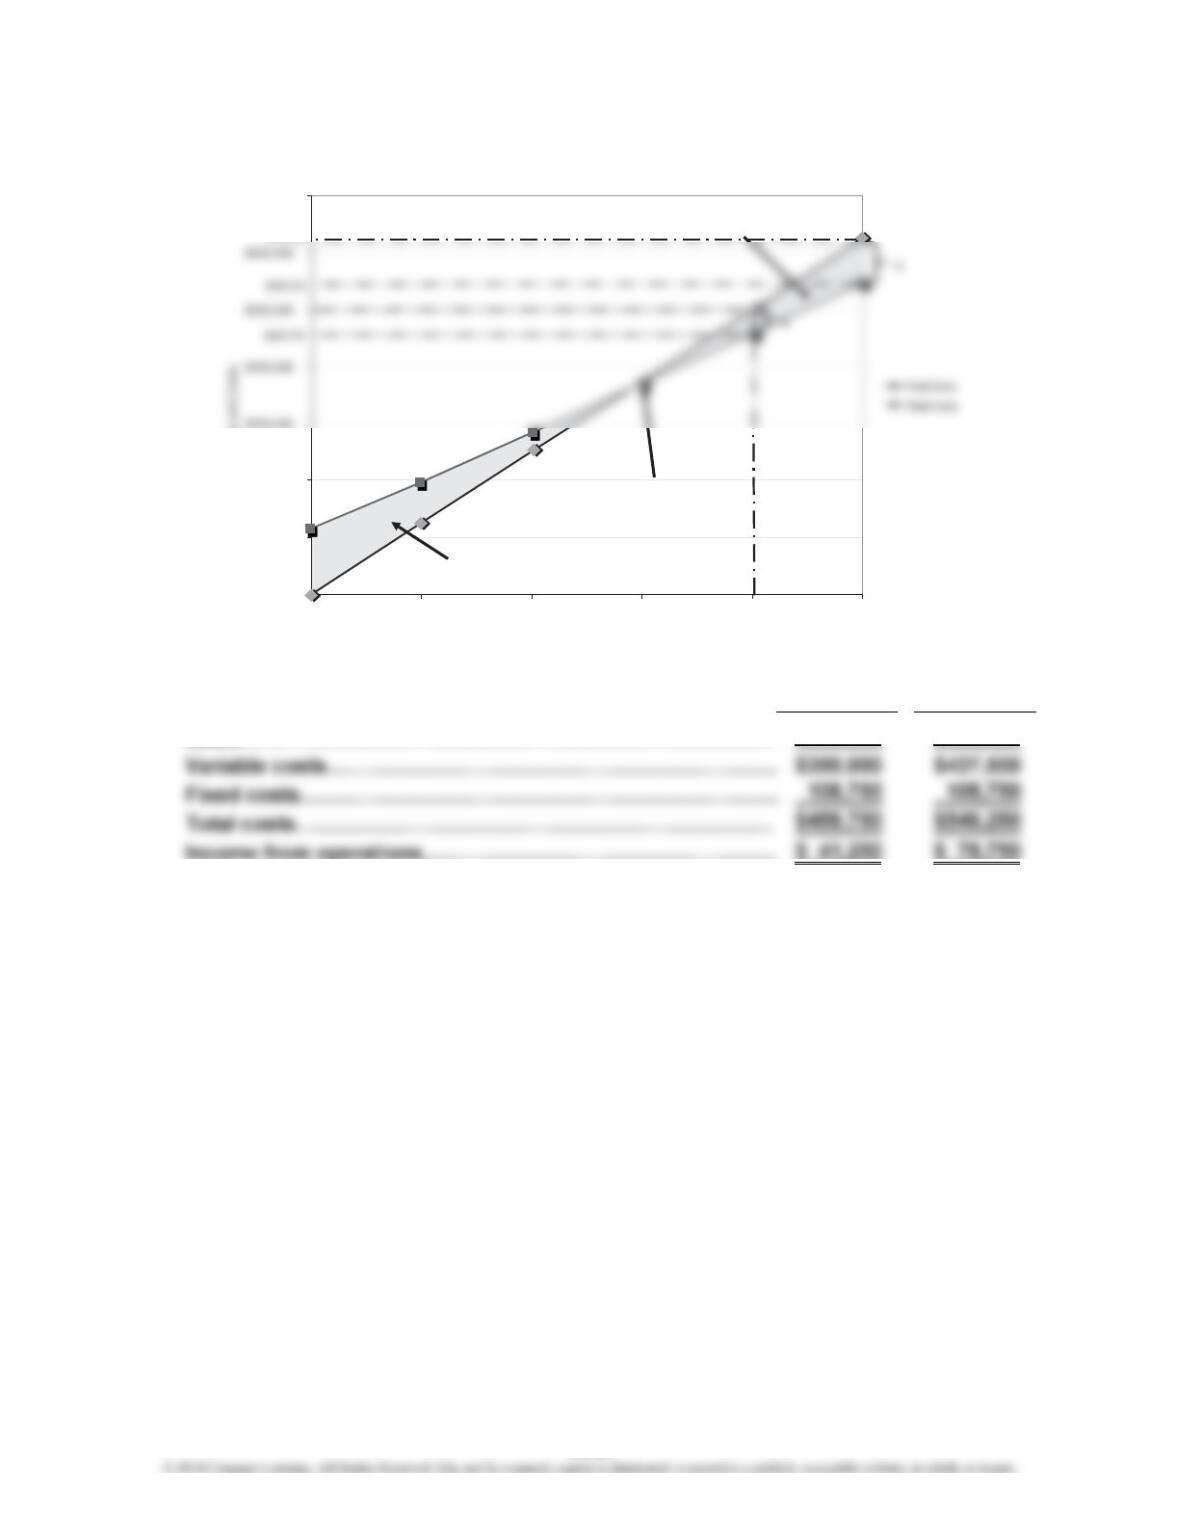
Prob. 19–4A (FIN MAN); Prob. 4–4A (MAN) (Concluded)
4.
a. b.
2,000 units 2,500 units
Sales…………………………………………………………………
…
$500,000 $625,000
Income from operations…………………………………………… $ 41,250 $ 78,750
$0
$100,000
$200,000
$700,000
0 500 1,000 1,500 2,000 2,500
Sales and Costs
Units of Sales
Operating
Profit Area
Break-Even
Point
Operating
Loss Area
$625,000
$108,750
19-27
CHAPTER 19 Cost Behavior and Cost-Volume-Profit Analysis
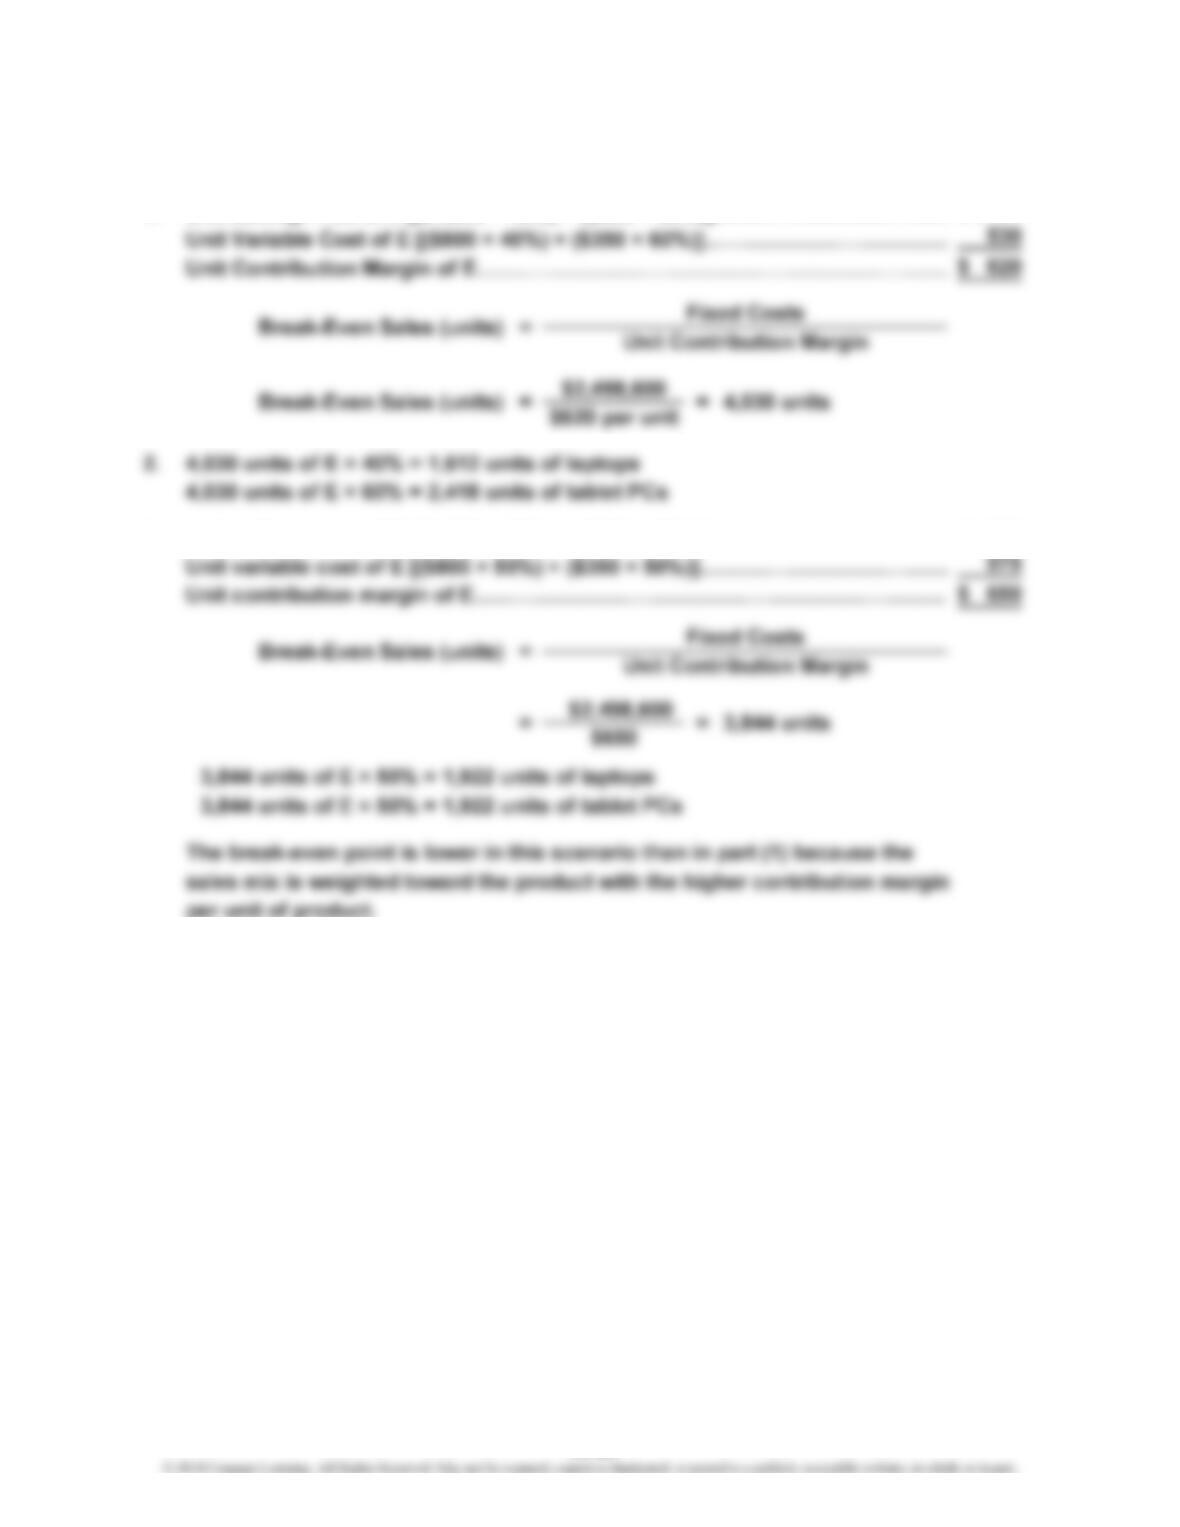
Prob. 19–5A (FIN MAN); Prob. 4–5A (MAN)
(Overall product is labeled E.)
1. Unit Selling Price of E [($1,600 × 40%) + ($850 × 60%)]……………………………
…
$1,150
3. Unit selling price of E [($1,600 × 50%) + ($850 × 50%)]……………………………
…
$1,225
19-28
CHAPTER 19 Cost Behavior and Cost-Volume-Profit Analysis
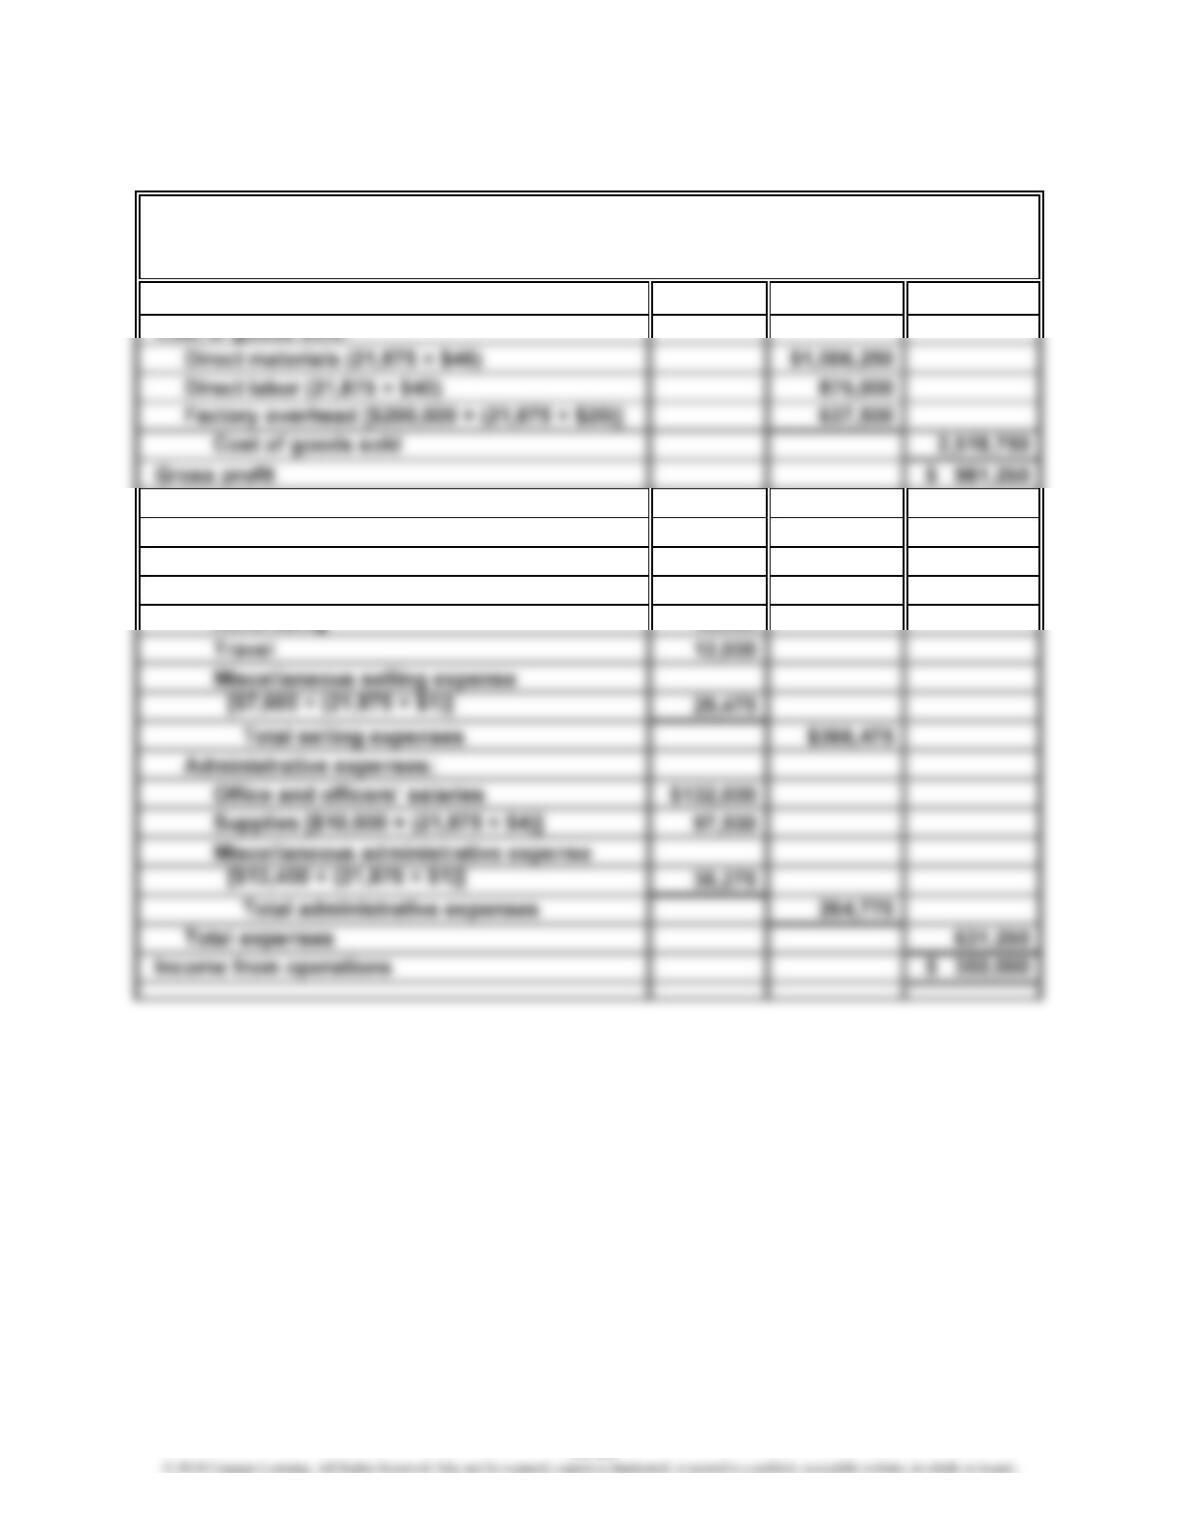
Prob. 19–6A (FIN MAN); Prob. 4–6A (MAN)
1.
Sales (21,875 × $160) $3,500,000
Cost of goods sold:
Expenses:
Selling expenses:
Sales salaries and commissions
[$110,000 + (21,875 × $8)] $285,000
Advertising 40,000
WOLSEY INDUSTRIES INC.
Estimated Income Statement
For the Year Ended December 31, 2014
19-29
CHAPTER 19 Cost Behavior and Cost-Volume-Profit Analysis
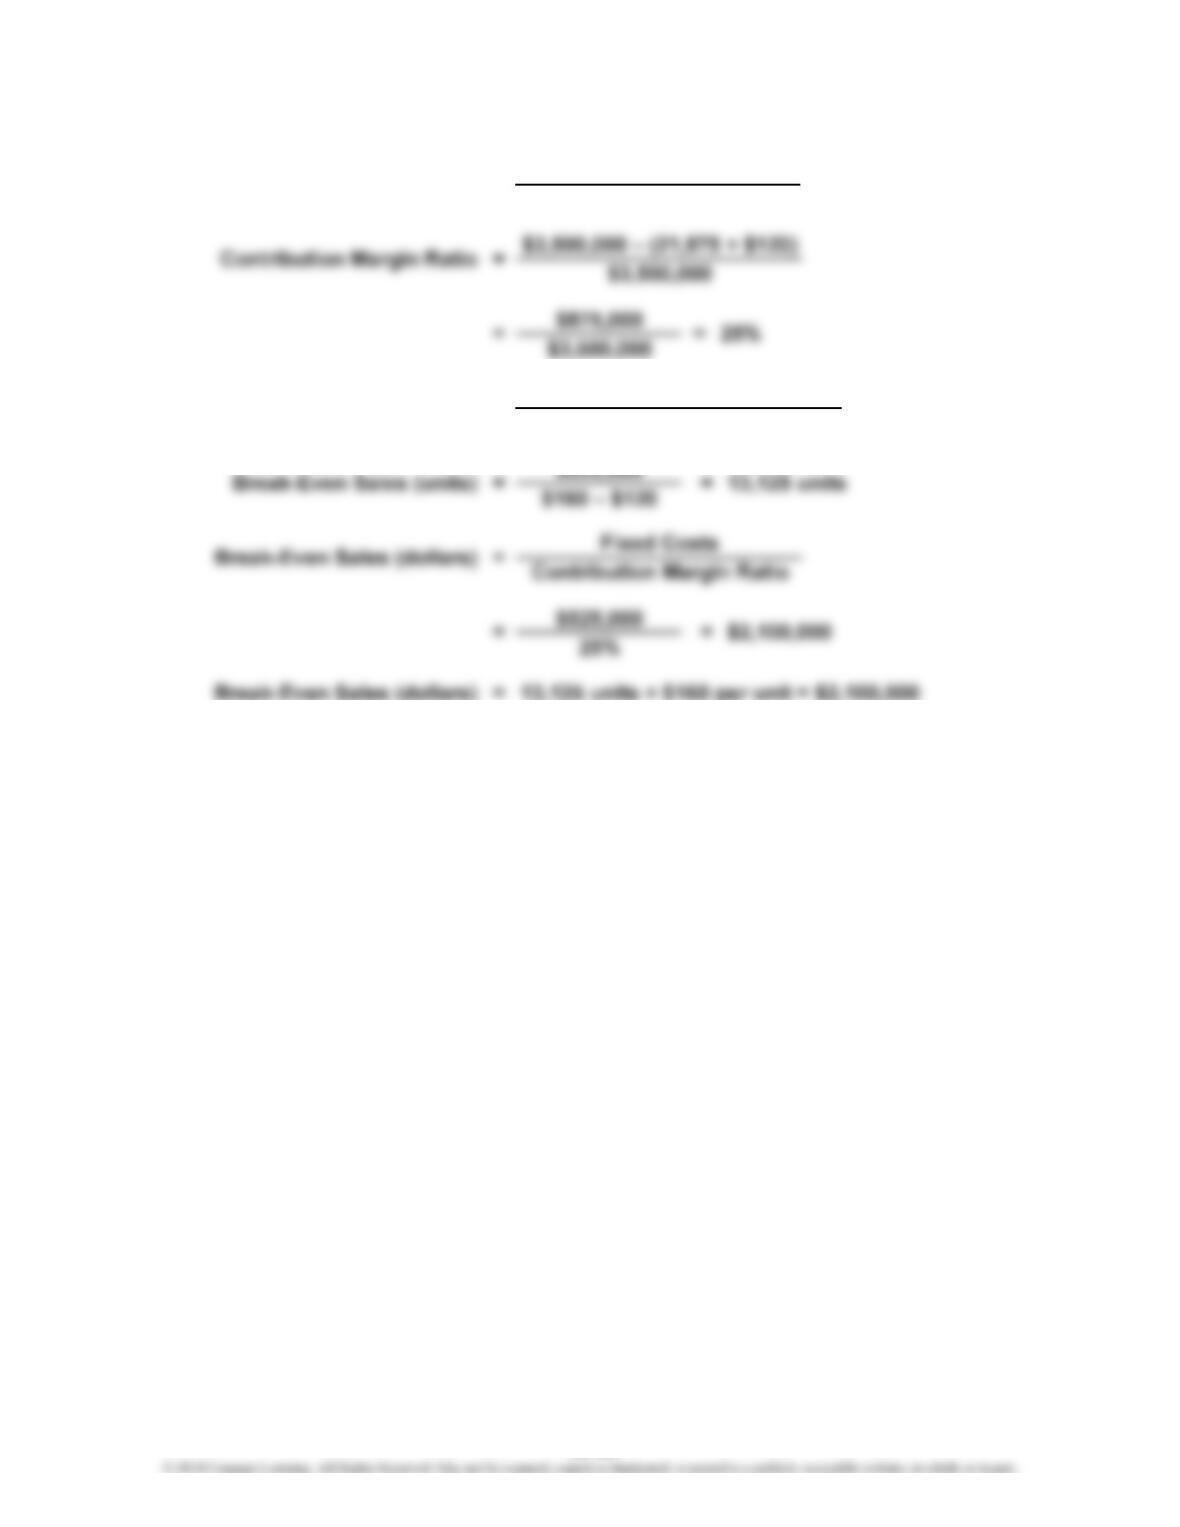
Prob. 19–6A (FIN MAN); Prob. 4–6A (MAN) (Continued)
2. Contribution Margin Ratio = Sales – Variable Costs
Sales
3. Break-Even Sales (units) = Fixed Costs
Unit Contribution Margin
19-30
CHAPTER 19 Cost Behavior and Cost-Volume-Profit Analysis
Prob. 19–6A (FIN MAN); Prob. 4–6A (MAN) (Concluded)
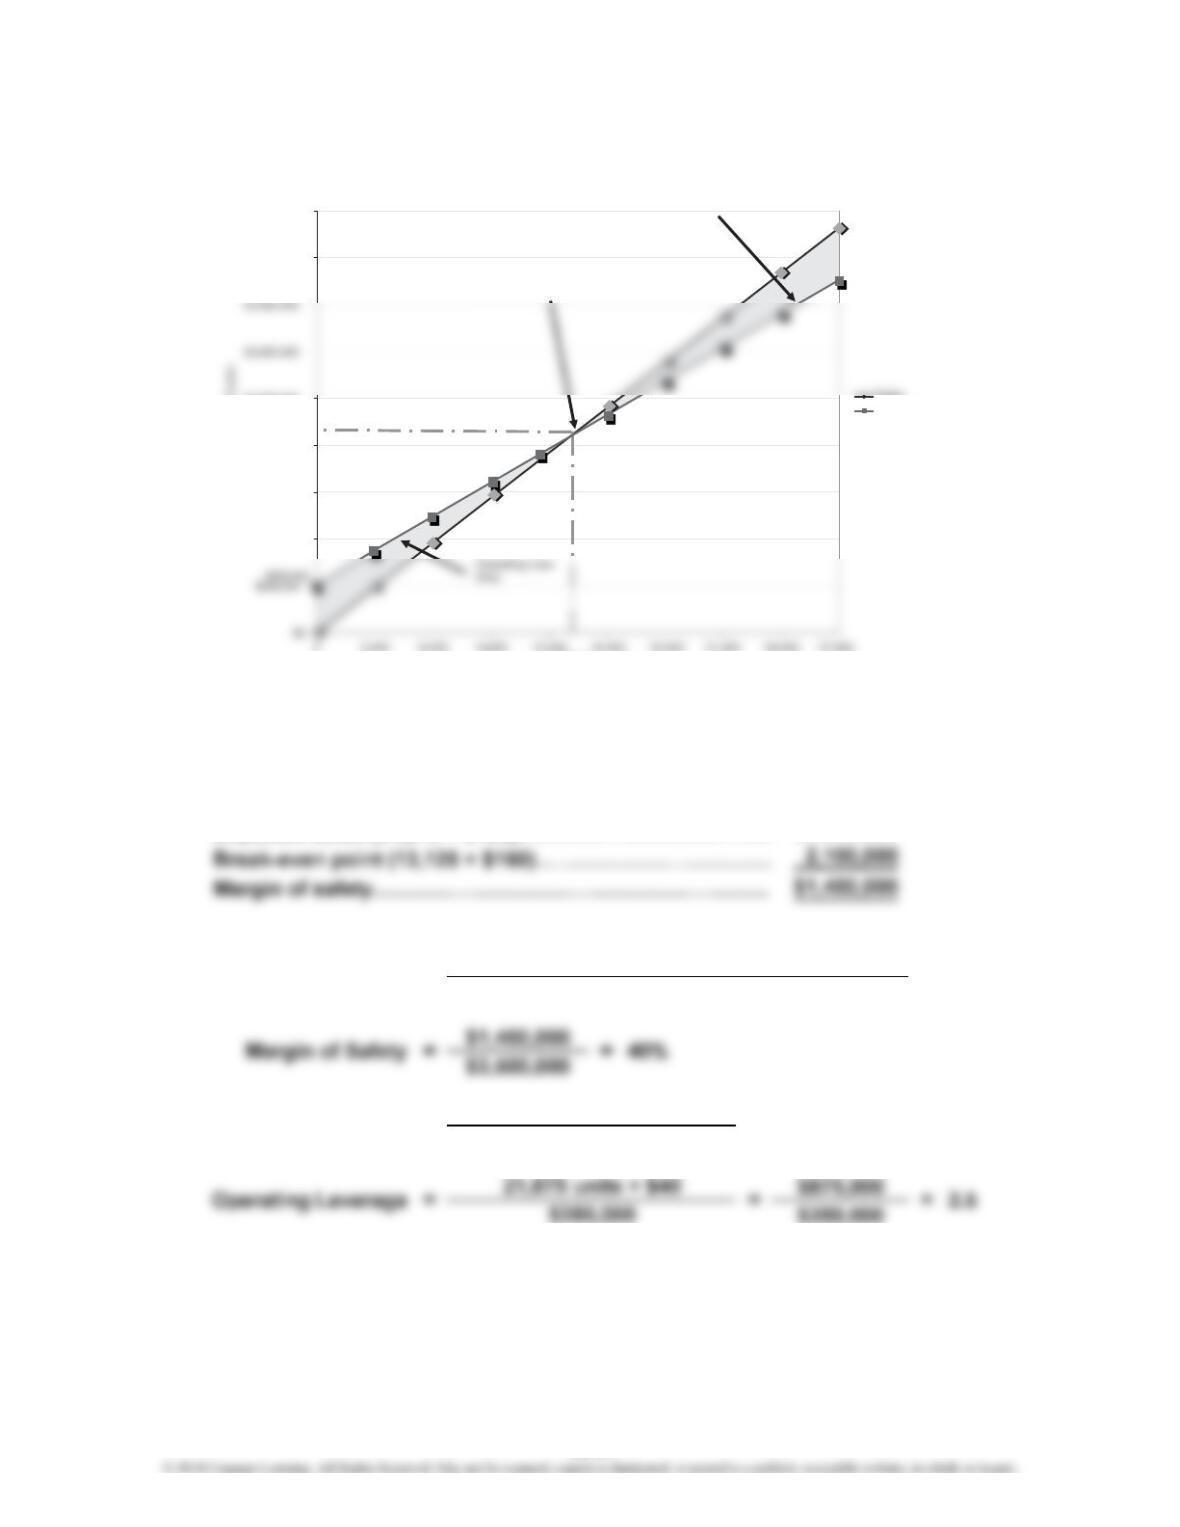
4.
5. Margin of safety:
In dollars:
Expected sales (21,875 × $160)………………………………
…
$3,500,000
As a percentage of sales:
Contribution Margin
=Margin of Safety Sales – Sales at Break-Even Point
Sales
Income from Operations
6. Operating Leverage =
$1,000,000
$1,500,000
$2,000,000
$2,500,000
$4,000,000
$4,500,000
0 3,000 6,000 9,000 12,000 15,000 18,000 21,000 24,000 27,000
Sales and Costs
Units
Sales
Total Costs
Operating Profit
Area
Break-Even Point
$2,100,000
13,125
19-31
CHAPTER 19 Cost Behavior and Cost-Volume-Profit Analysis
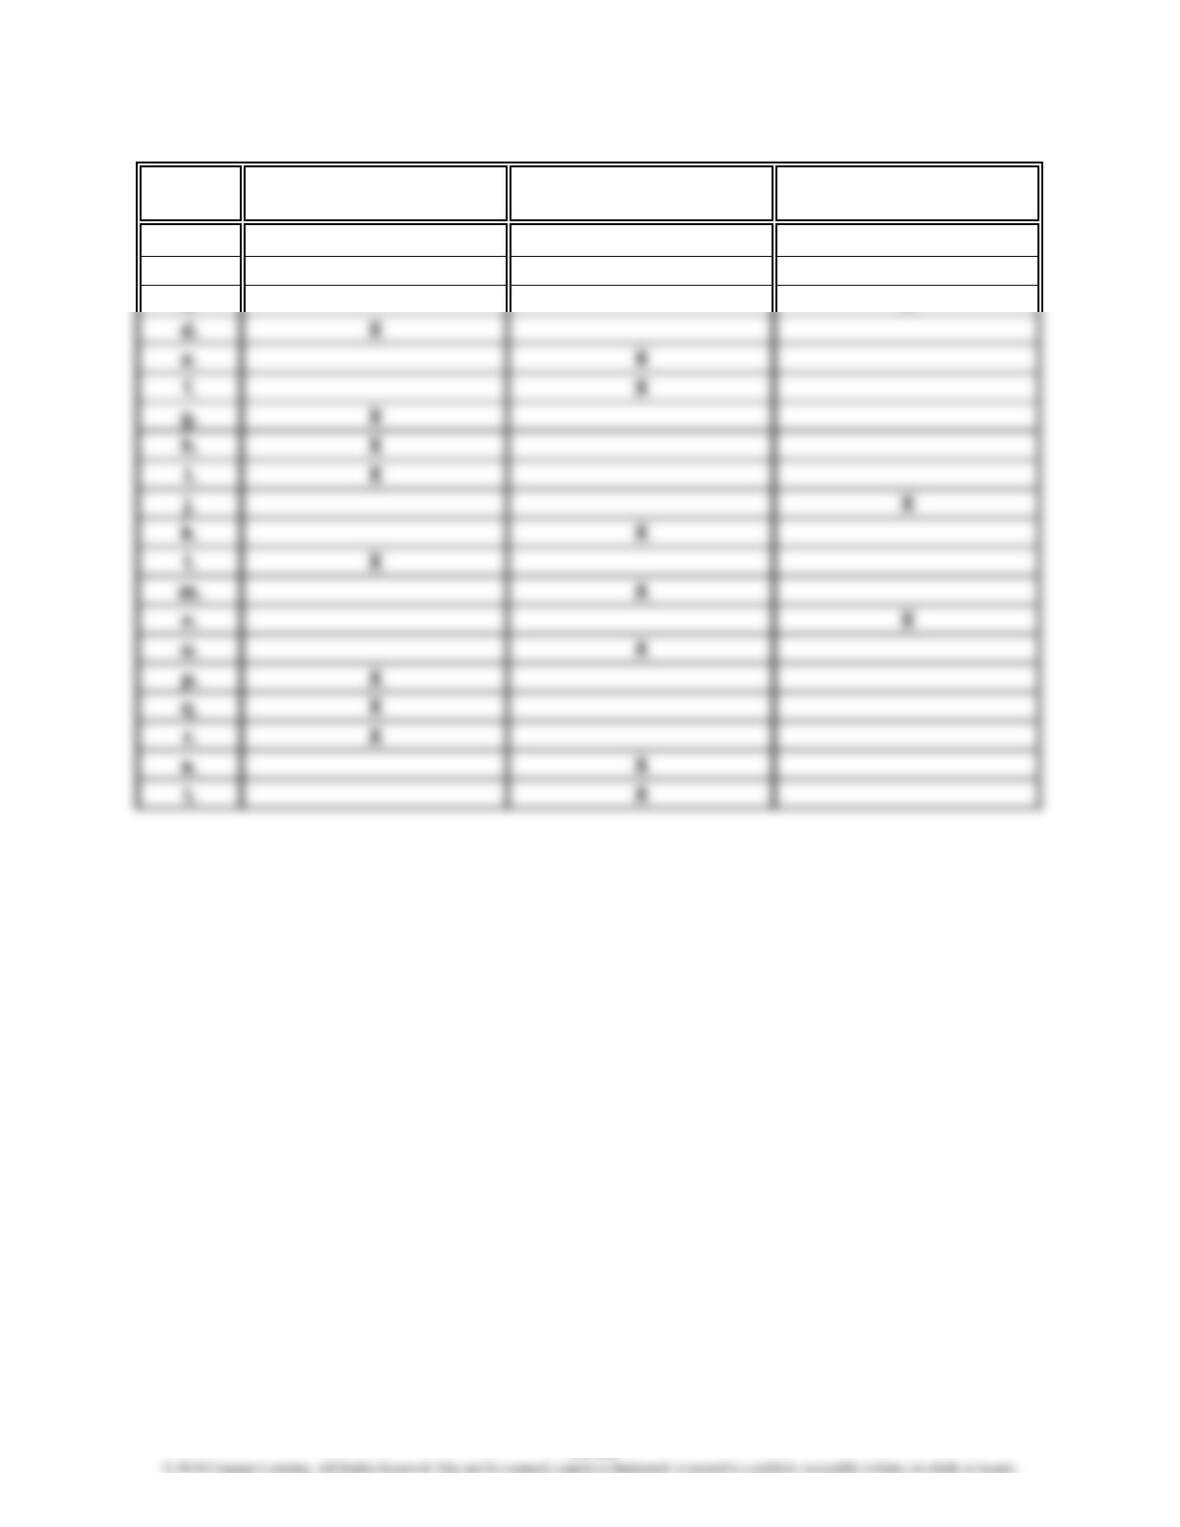
Prob. 19–1B (FIN MAN); Prob. 4–1B (MAN)
Fixed Variable Mixed
Cost Cost Cost Cost
a. X
b. X
c. X
19-32
CHAPTER 19 Cost Behavior and Cost-Volume-Profit Analysis
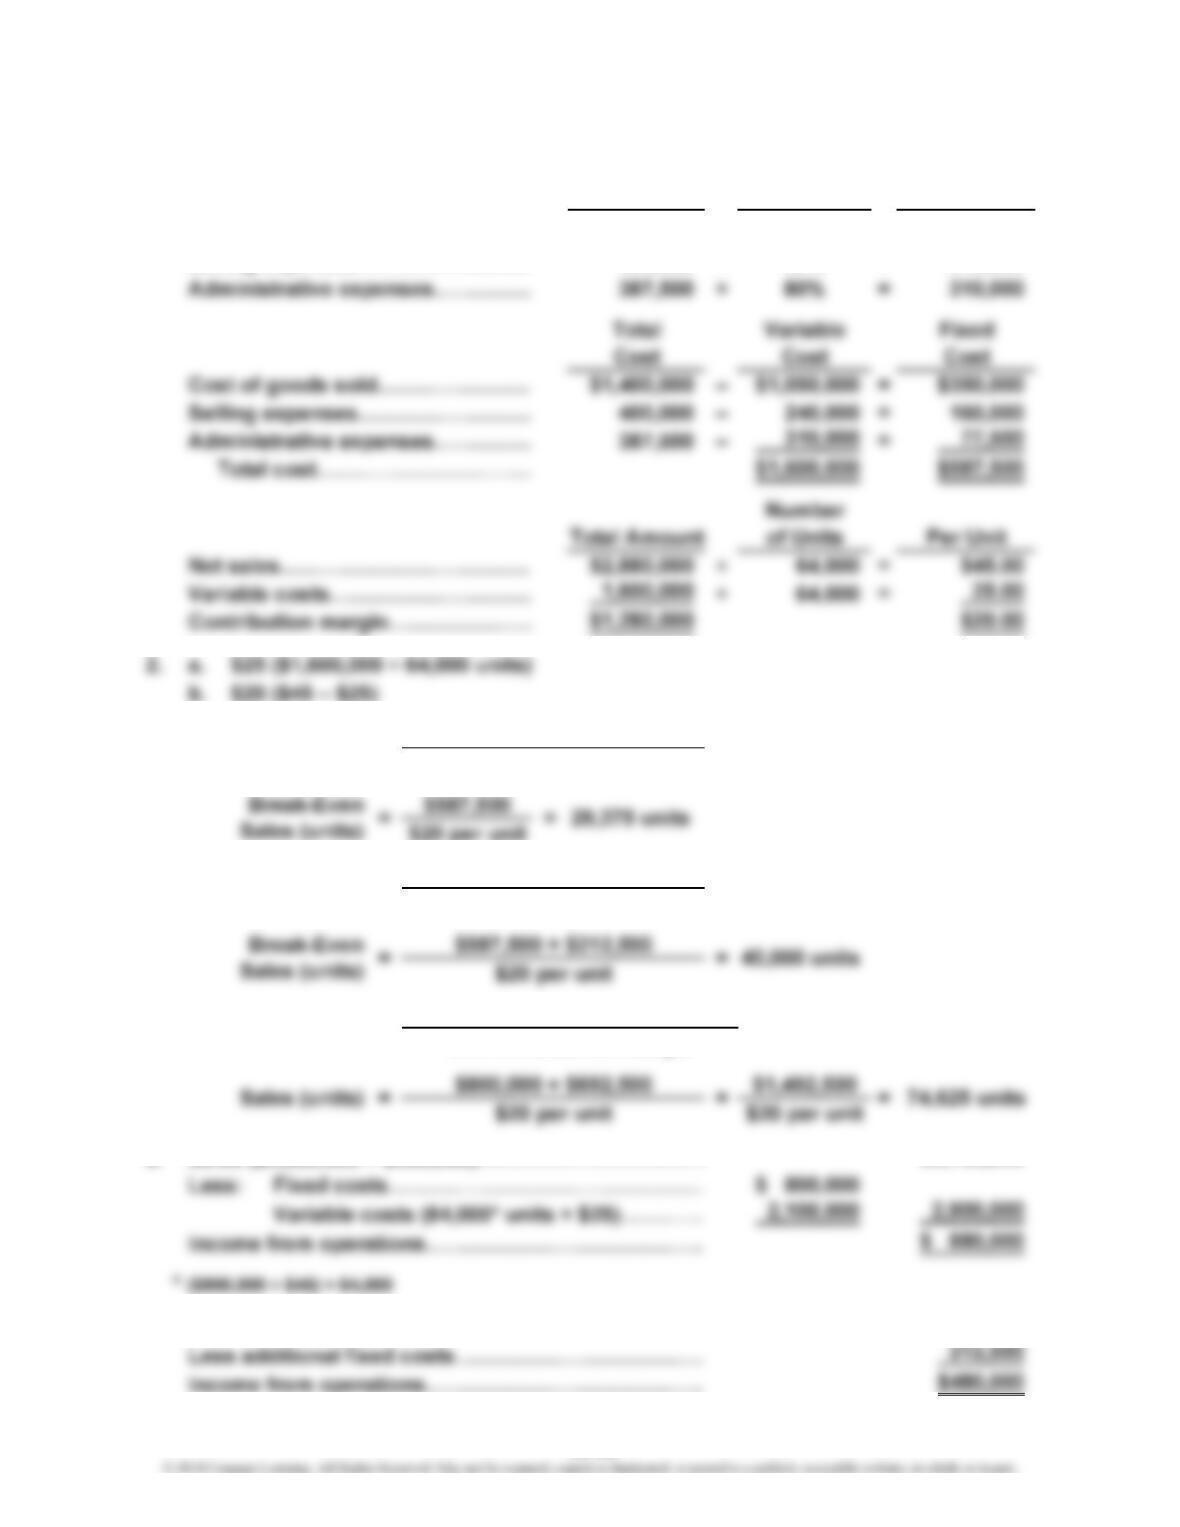
Prob. 19–2B (FIN MAN); Prob. 4–2B (MAN)
1. Total Variable Cost Variable
Cost Percentage Cost
Cost of goods sold…………………
…
$1,400,000 × 75% = $1,050,000
Selling expenses……………………
…
400,000 × 60% = 240,000
6. Sales ($2,880,000 + $900,000)…………………………
…
7. Present operating income………………………………
…
…
$692,500
5.
Break-Even
Sales (units)
Unit Contribution Margin
4. Break-Even
Sales (units) =
3. Fixed Costs
Unit Contribution Margin
$3,780,000
Fixed Costs + Target Profit
Sales (units)
=
=
Fixed Costs
Unit Contribution Margin
19-33
…
…
CHAPTER 19 Cost Behavior and Cost-Volume-Profit Analysis
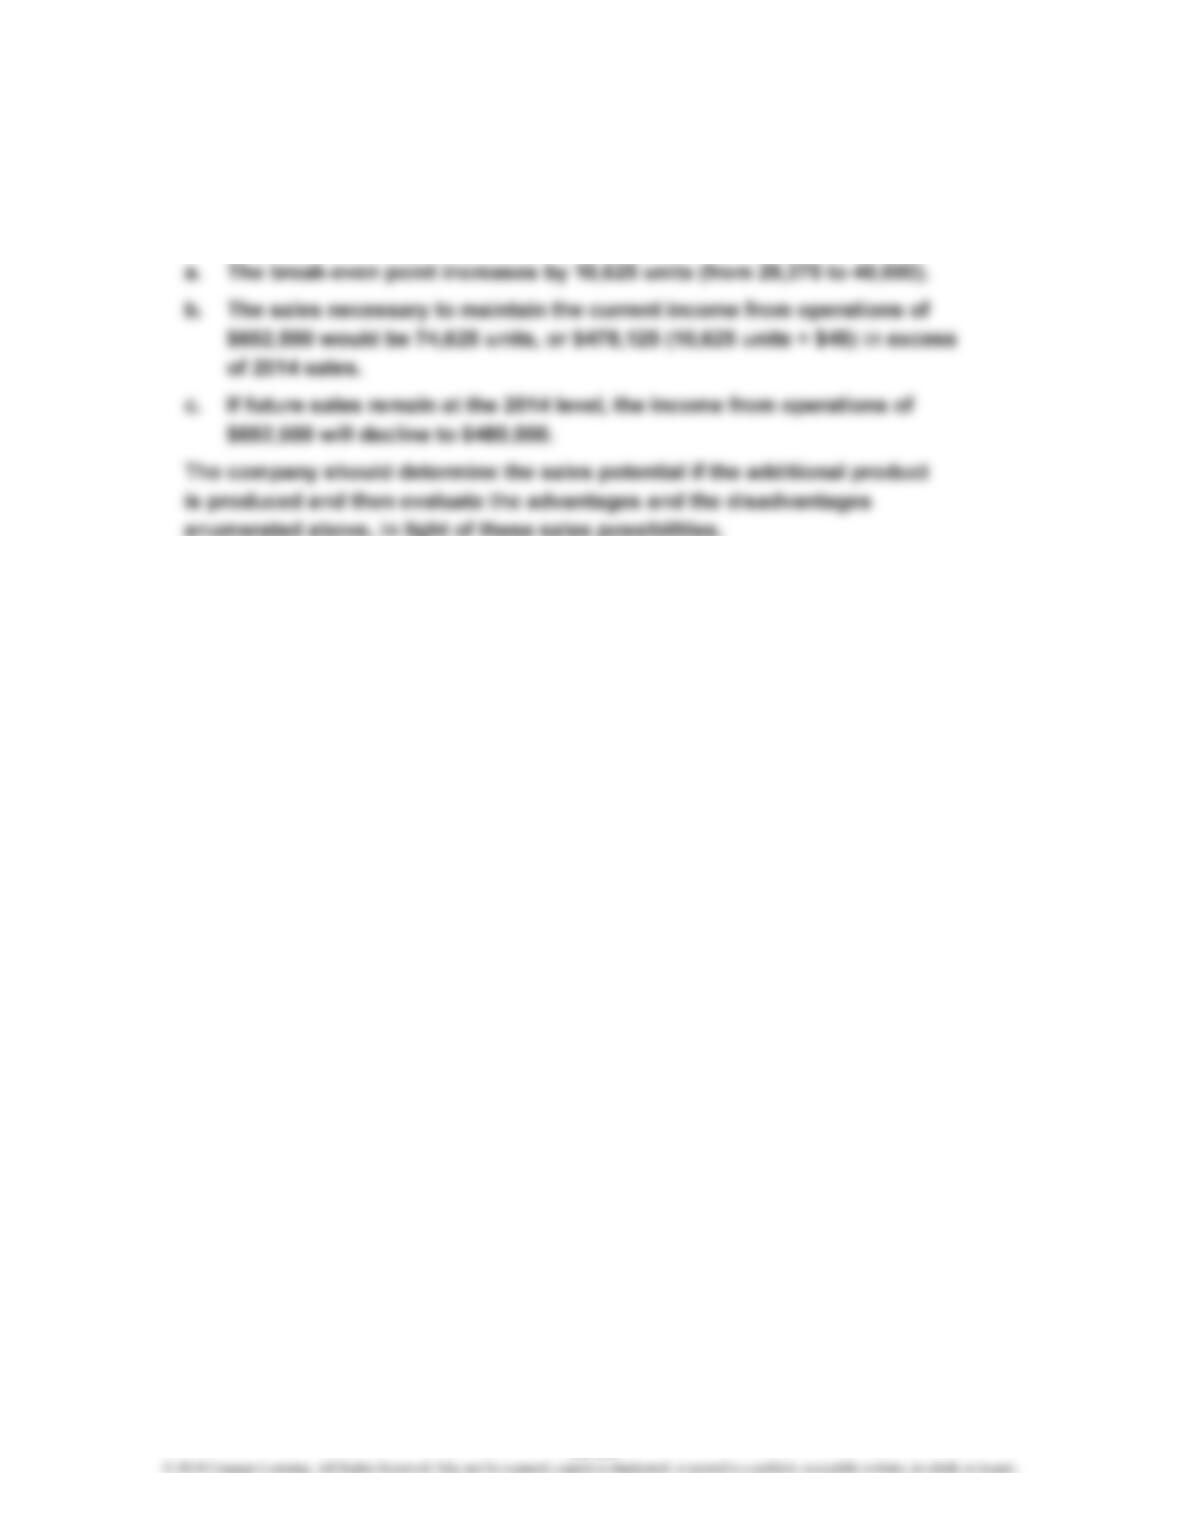
Prob. 19–2B (FIN MAN); Prob. 4–2B (MAN) (Concluded)
8. In favor of the proposal is the possibility of increasing income from operations
from $692,500 to $880,000. However, there are many points against the
proposal, including:
19-34