CHAPTER 26 Cost Allocation and Activity-Based Costing
Prob. 26–6A (FIN MAN); Prob. 11–6A (MAN) (Concluded)
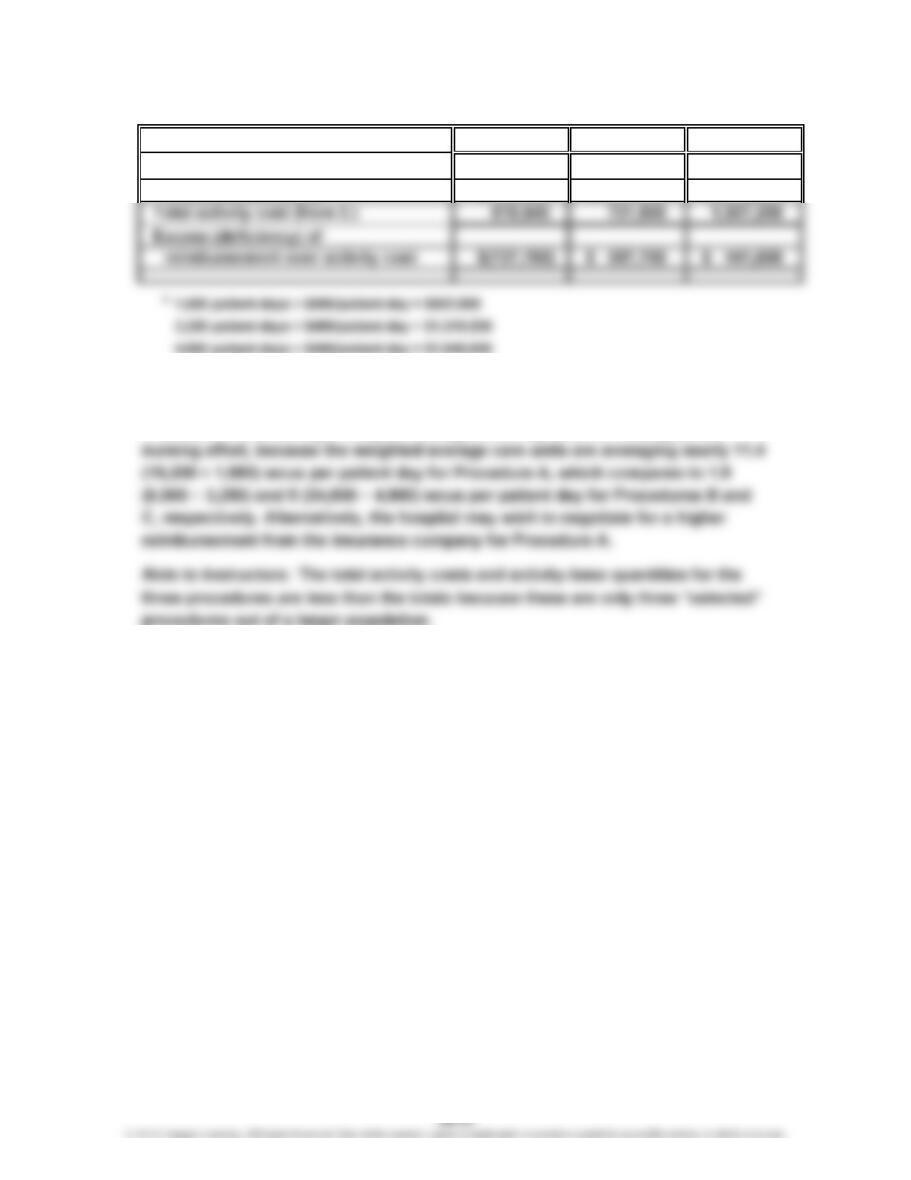
3. Procedure A Procedure B Procedure C
Reimbursement (patient days ×
reimbursement rate)* $ 682,080 $1,319,500 $1,948,800
4. Procedure A requires more activity cost than is being reimbursed by the insurance
company. As a result, the hospital may wish to determine if the costs of providing
Procedure A are too high. Hospital management may wish to investigate the
CHAPTER 26 Cost Allocation and Activity-Based Costing
Prob. 26–1B (FIN MAN); Prob. 11–1B (MAN)
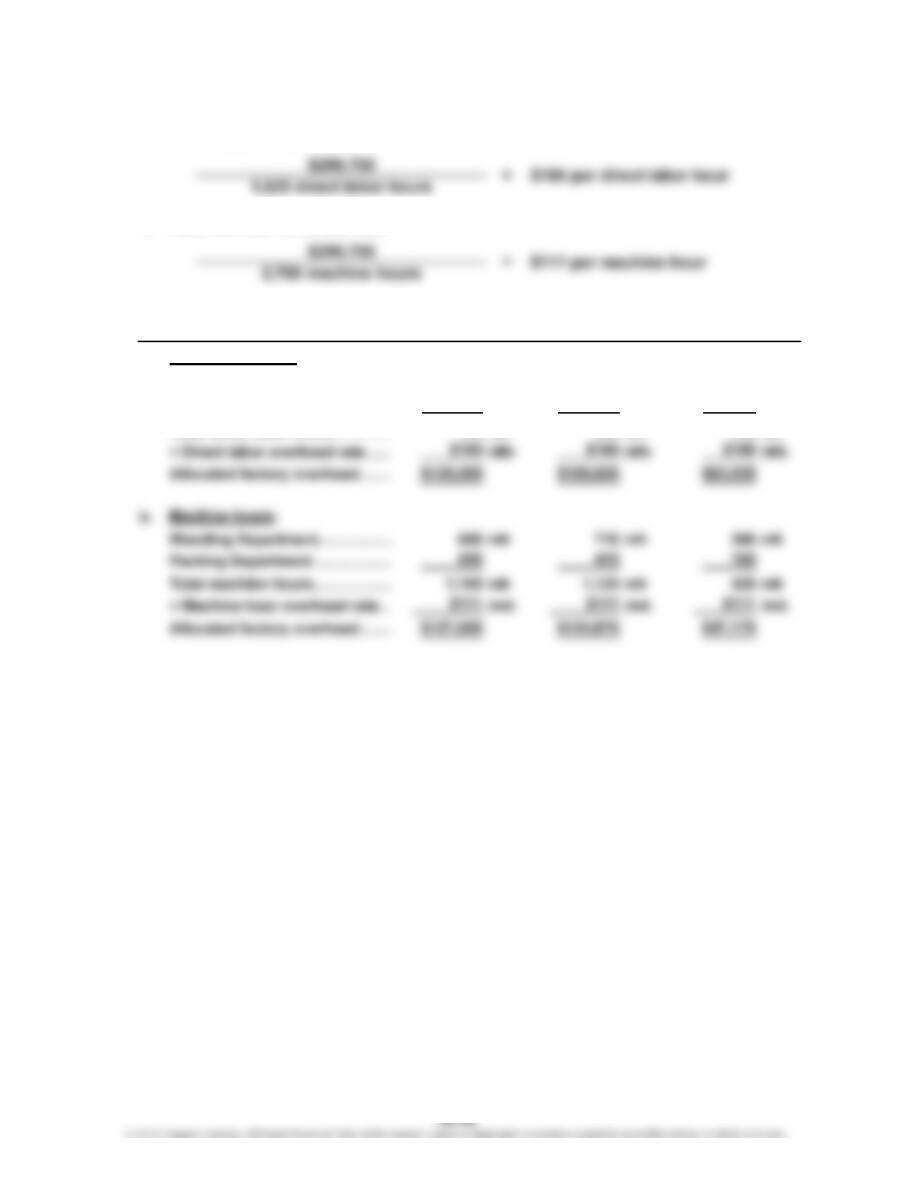
1. a. Direct labor overhead rate:
b. Machine hour overhead rate:
2.
a. Direct labor hours:
Blending Department…………
…
260 dlh 245 dlh 215 dlh
Packing Department……………
…
470 300 130
Total direct labor hours………
…
730 dlh 545 dlh 345 dlh
Skim Milk Cream
Whole Milk
…
…
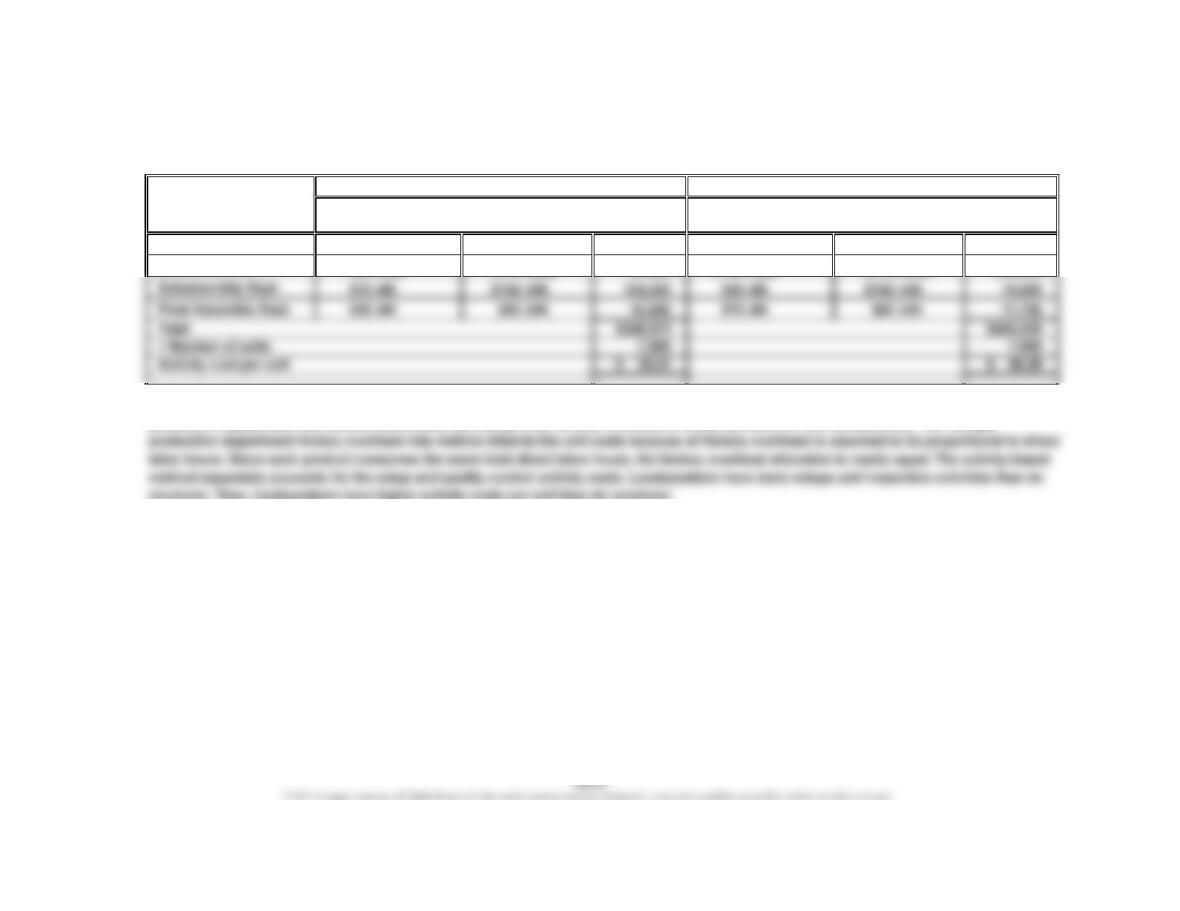
CHAPTER 26 Cost Allocation and Activity-Based Costing
Prob. 26–2B (FIN MAN); Prob. 11–2B (MAN)
1.
Production department factory
overhead totals…………………………………………………
…
$178,200 $121,500
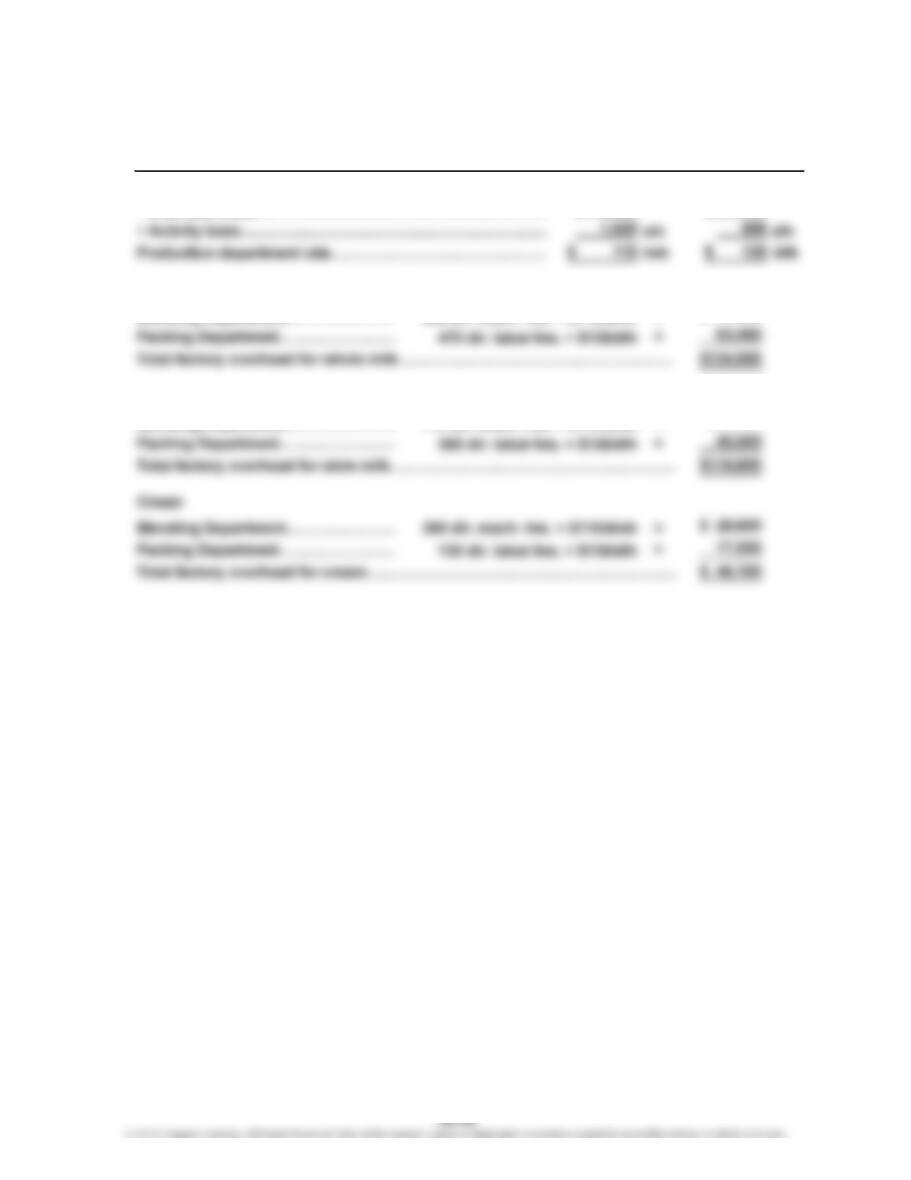
2. Whole milk
Blending Department…………………
…
=$ 71,500
Skim milk
Blending Department…………………
…
=$78,100
…
650 dir. mach. hrs. × $110/dmh
Dept. Dept.
Blending Packing
710 dir. mach. hrs. × $110/dmh
CHAPTER 26 Cost Allocation and Activity-Based Costing
Prob. 26–3B (FIN MAN); Prob. 11–3B (MAN)
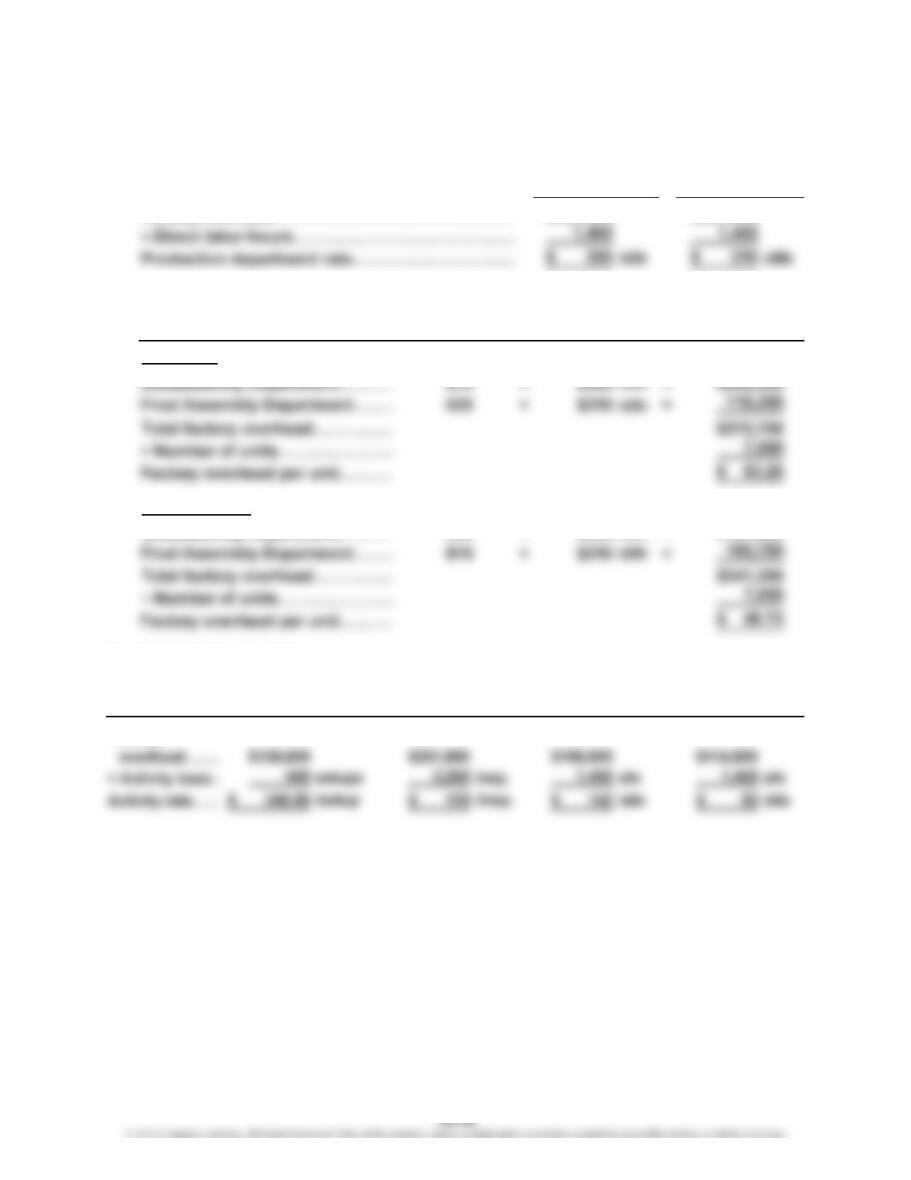
1. Production department rates:
Factory overhead……………………………………
…
2.
× =
Receivers:
…
…
Loudspeakers:
Subassembly Department………
…
× $300 /dlh =
…
3. Activity-based rates:
Factory
$294,000
Production
Overhead
Factory
Rate
Department
Subassembly Final Assembly
Department
$420,000
Final Assembly
Department
Department
Department
$157,500
Subassembly
Direct
Labor Hours
525
Setup
Quality
Control
CHAPTER 26 Cost Allocation and Activity-Based Costing
Prob. 26–3B (FIN MAN); Prob. 11–3B (MAN) (Concluded)
4.
Activity Activity
Activity Cost Cost
Setup 80 setups /setup 320 setups /setup
Quality control 450 insp. /insp. 1,750 insp. /insp.
5. The activity-based overhead allocation reveals that loudspeakers are more costly on a per-unit basis than are the receivers. The multiple
production department rate method determines that the per-unit factory overhead is nearly the same for the two products. The multiple
Usage
$119
$346.50 $110,880
53,550 $119 208,250
Loudspeakers
×= ×=Rate
Activity
Rate
Receivers
Activity
Activity
Usage
Activity
$346.50 $ 27,720
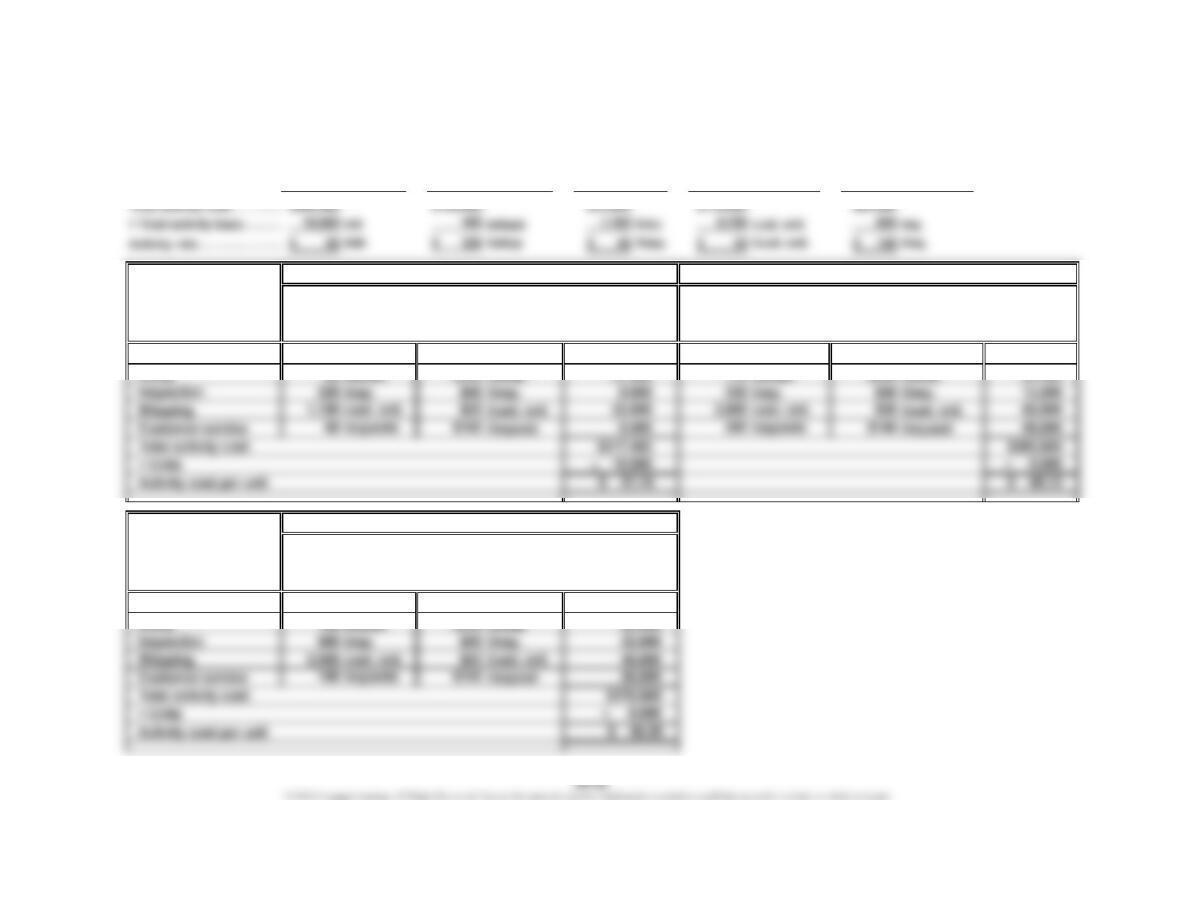
CHAPTER 26 Cost Allocation and Activity-Based Costing
Prob. 26–4B (FIN MAN); Prob. 11–4B (MAN)
1.
2.
Activity
Production 5,000 mh /mh 2,500 mh /mh
Setup 85 setups /setup 170 setups /setup
Activity
Production 2,500 mh /mh
Setup 195 setups /setup
Powdered Sugar
Activity-
White Sugar
Activity-
$125,000
$320 62,400
Base Activity Activity
Usage × Rate = Cost
Cost
Activity
Brown Sugar
Usage × Rate =
Activity-
Base Activity
Customer ServiceProduction Setup ShippingInspection
Activity
54,400
$50 $250,000 $50 $125,000
$320
Usage × Rate =
Base Activity
Cost
$320 27,200
$50
CHAPTER 26 Cost Allocation and Activity-Based Costing
Prob. 26–4B (FIN MAN); Prob. 11–4B (MAN) (Concluded)
3. The unit costs are different even though each product requires 0.5 machine
hour because the products consume many activities in ratios different from the
CHAPTER 26 Cost Allocation and Activity-Based Costing
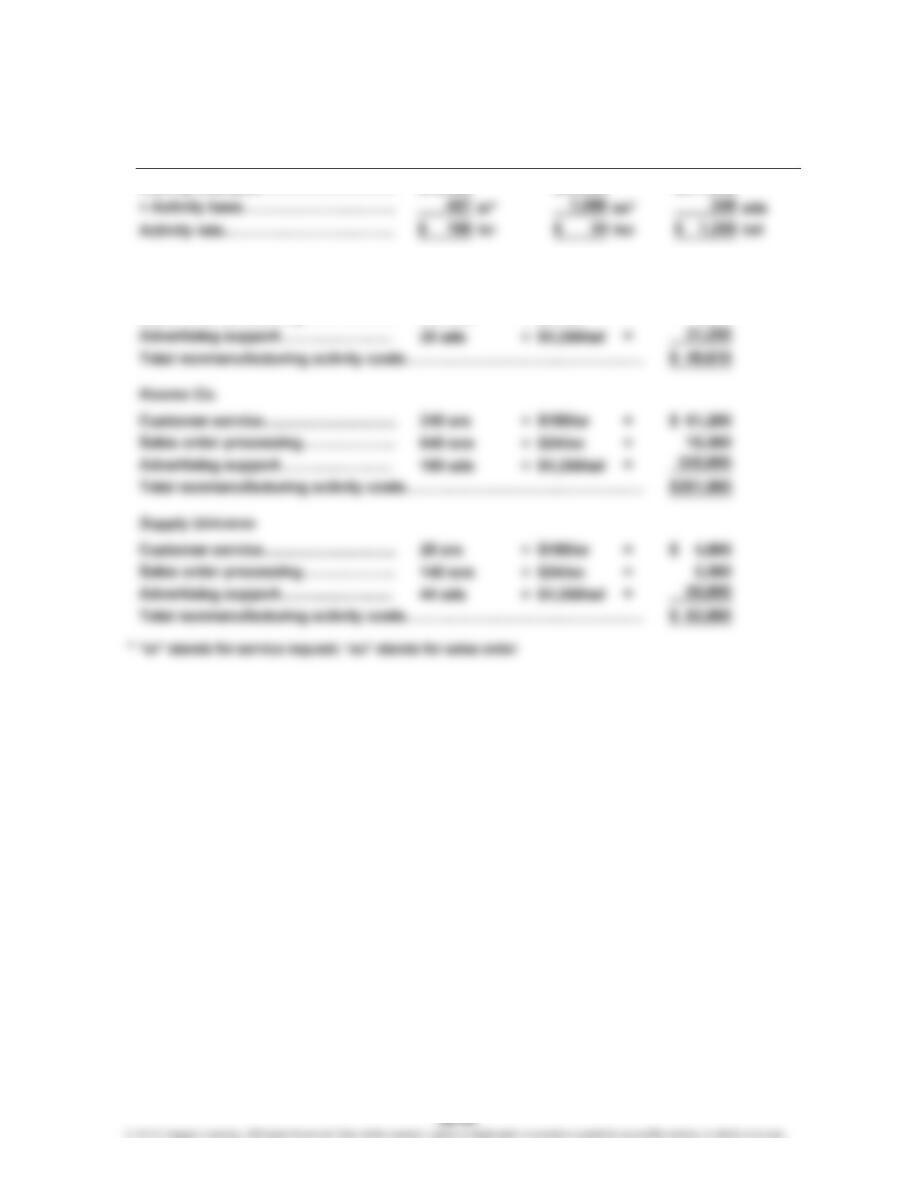
Prob. 26–5B (FIN MAN); Prob. 11–5B (MAN)
1.
Activity cost pool……………………… $76,860 $25,920 $311,250
2. The Warehouse
Customer service……………………… × $180/sr = $ 11,160
Sales order processing………………
…
× $24/so = 7,200
…
…
Processing Support
Sales Order Advertising
Customer
Service
300 sos
62 srs
…
CHAPTER 26 Cost Allocation and Activity-Based Costing
Prob. 26–5B (FIN MAN); Prob. 11–5B (MAN) (Concluded)
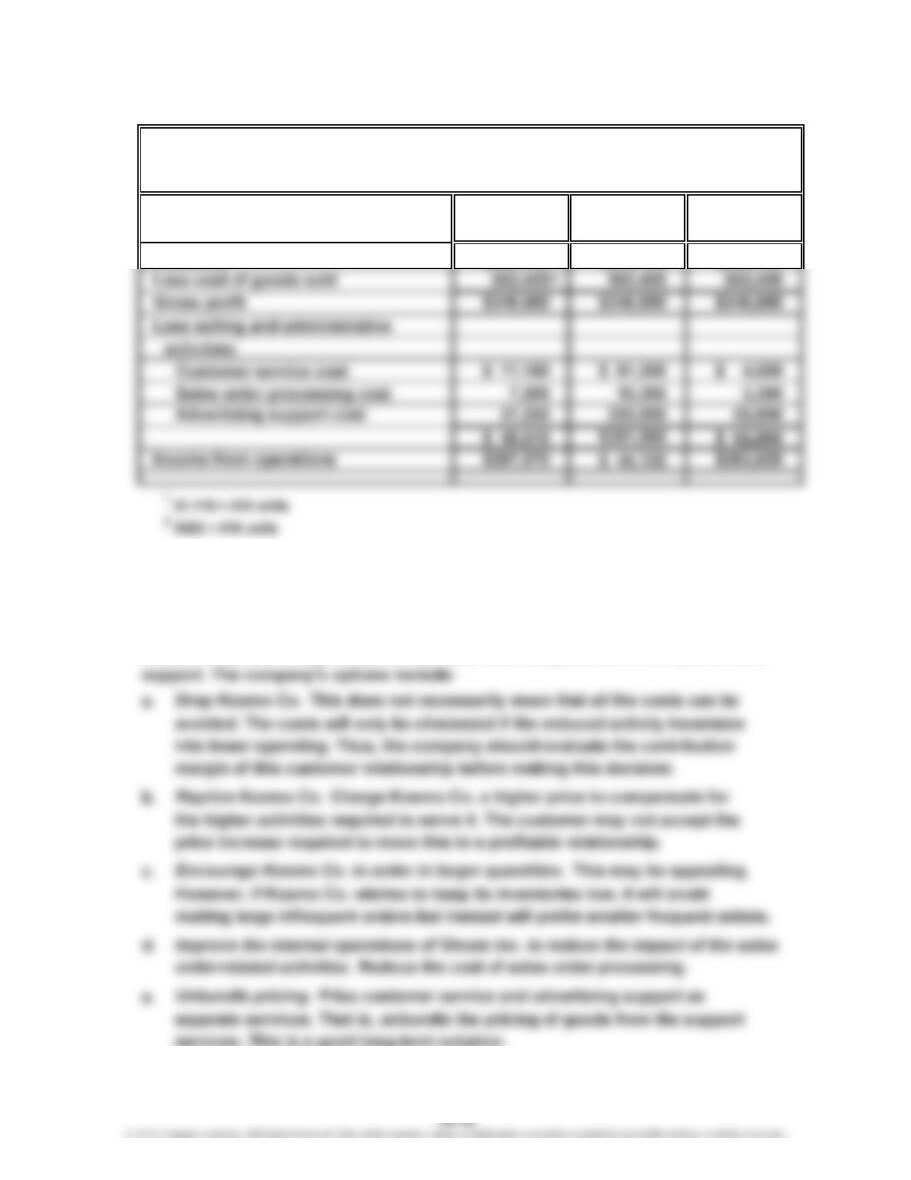
3.
The Supply
Warehouse Kosmo Co. Universe
Revenues $899,100 $899,100 $899,100
4. Kosmo Co. has low profitability, while the other two customers have acceptable
margins. This is because Kosmo Co. requires many customer services, sales
order processing, and advertising support activities. For example, Kosmo Co.
orders frequently in small order sizes, which increases the sales order processing
costs; it requests a large amount of service; and it requires extensive promotional
SHRUTE INC.
Customer Profitability Report
For the Year Ended December 31, 2014
1
CHAPTER 26 Cost Allocation and Activity-Based Costing
Prob. 26–6B (FIN MAN); Prob. 11–6B (MAN)
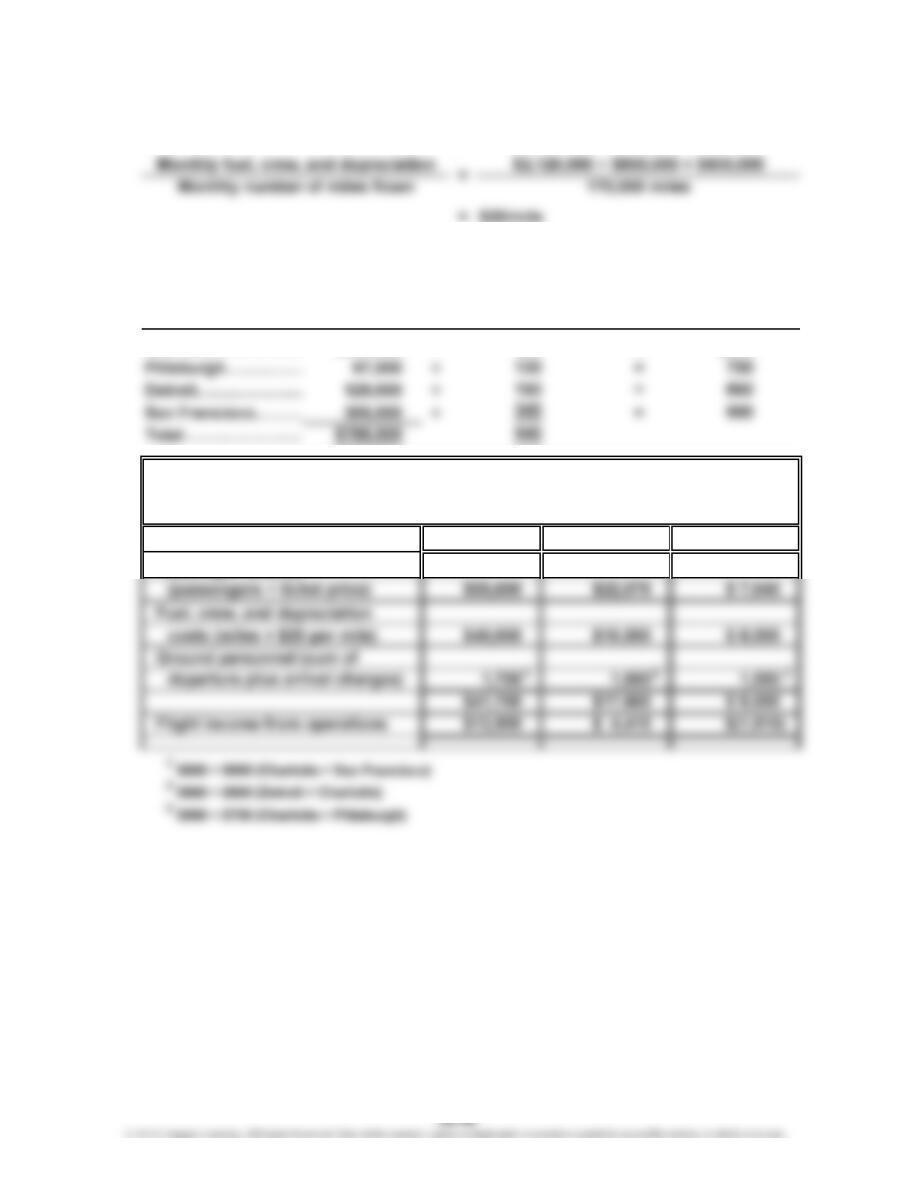
1. The depreciation and maintenance cost per mile is calculated as follows:
2. Monthly
Ground
Personnel
Terminal City Cost per City ÷ =
Charlotte……………
…
$256,000 ÷ =
…
3.
Passenger revenue
Flight Profitability Report
Arrivals/Departures
Number of
320
Arrival/Departure
$800
Rate per City
BLUE STAR AIRLINE
For Three Representative Flights
Flight 103Flight 102Flight 101
CHAPTER 26 Cost Allocation and Activity-Based Costing
Prob. 26–6B (FIN MAN); Prob. 11–6B (MAN) (Concluded)
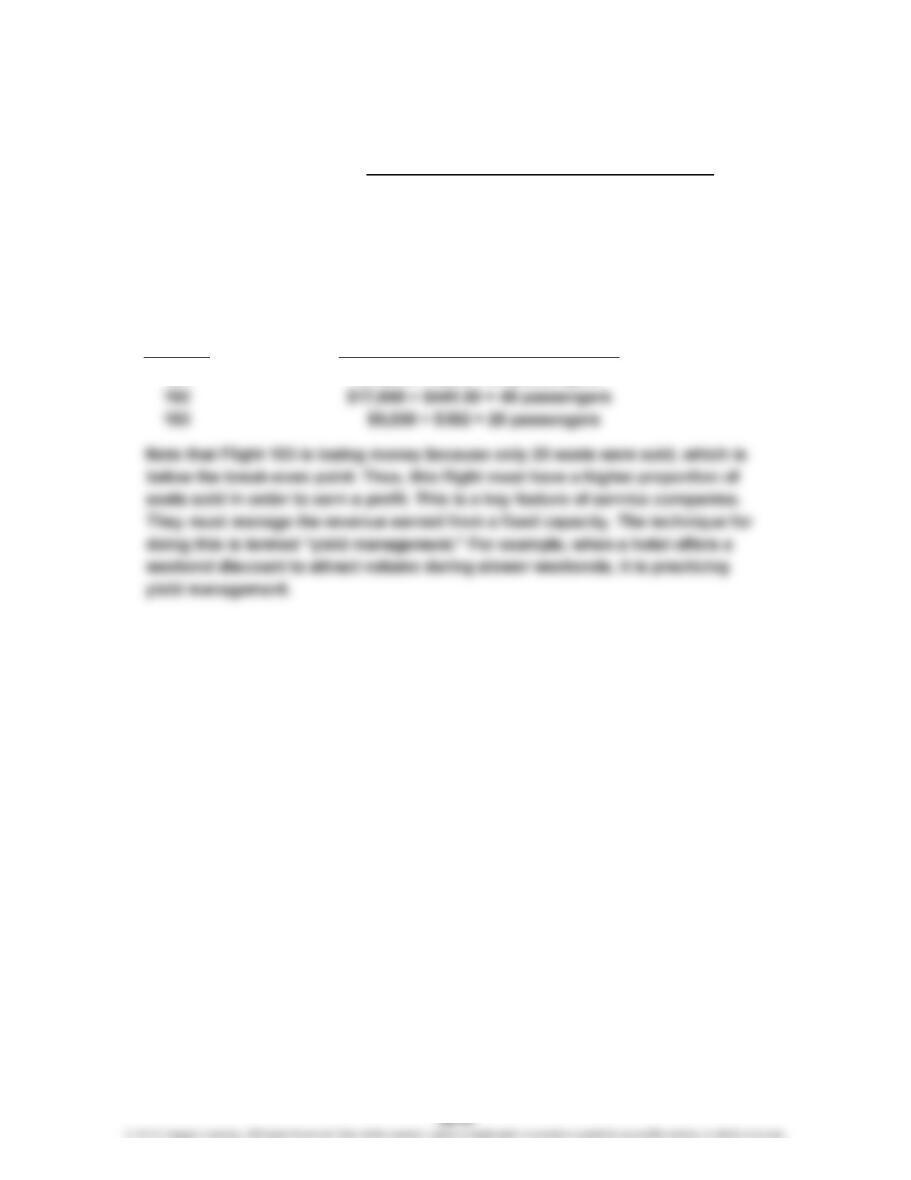
4. The break-even formula is:
None of the costs in a flight are variable to the number of seats. Essentially, the
costs will be incurred regardless of the number of passengers on the flight.
Thus, the costs of the flight are all fixed. Given this assumption, the break-even
number of passengers is a straightforward division of the costs by the fare. The
results are (rounded to the nearest whole number):
Break-Even Number of
Passengers per Flight
Fixed Costs of a Flight
Ticket Price – Variable Cost per Seat
=
Flight
101
Approximate Break-Even
$41,700 ÷ $695 = 60 passengers
CHAPTER 26 Cost Allocation and Activity-Based Costing
CP 26–1 (FIN MAN); CP 11–1 (MAN)
The net income is larger because the controller took period costs and treated them
as product costs for financial reporting purposes. All of the post-manufacturing
costs should be treated as an expense in the period incurred according to generally
accepted accounting principles (GAAP). If treated as product costs for financial
CP 26–2 (FIN MAN); CP 11–2 (MAN)
The product profitability report indicates that the two products are equal in terms of
profitability (on a per-case basis). However, the additional information indicates that
CASES & PROJECTS
CHAPTER 26 Cost Allocation and Activity-Based Costing
CP 26–3 (FIN MAN); CP 11–3 (MAN)
Wells Fargo Insurance Service’s (WFIS) activity-based costing model provides more
accurate product costs than does the revenue-based allocation scheme. This is
because WFIS has a large amount of processing and service expenses that are
CHAPTER 26 Cost Allocation and Activity-Based Costing
CP 26–4 (FIN MAN); CP 11–4 (MAN)
1. Floor Bookshelf Ribbon
Loudspeakers Loudspeakers Loudspeakers
2. To: Management of Boom Box Sounds Inc.
From: Controller
The enclosed product profitability report indicates that our product lines provide
varying degrees of profitability. By far, our most profitable product line is the
bookshelf loudspeakers. The floor loudspeakers provide a healthy gross profit.
However, our marketing costs associated with this product line exceed our
gross profit. As a result, the product line is unprofitable as a whole. The ribbon
loudspeakers, on the other hand, have a very weak gross profit. As a result, the
product line is just barely profitable. As a result of this analysis, I offer the
following recommendations:
Bookshelf Loudspeakers
Floor Loudspeakers
We should retain the floor loudspeakers in our product portfolio. The product
provides us a healthy gross profit. Unfortunately, we spend too much on
Ribbon Loudspeakers
Ribbon loudspeakers are one of our “up and comers.” No other competitor has
a similar product. Thus, we have the market to ourselves. Yet, this product does
not meet our profitability objectives. We are unable to spend much on marketing
CHAPTER 26 Cost Allocation and Activity-Based Costing
CP 26–5 (FIN MAN); CP 11–5 (MAN)
Adlin’s concern appears valid. Teldar Tech Inc. is presently using direct labor as an
allocation base. This method, either as a single plantwide factory overhead rate or
as multiple production department factory overhead rates, will distort the product
costs when activities are consumed by products in different proportions than their
CP 26–6 (FIN MAN); CP 11–6 (MAN)
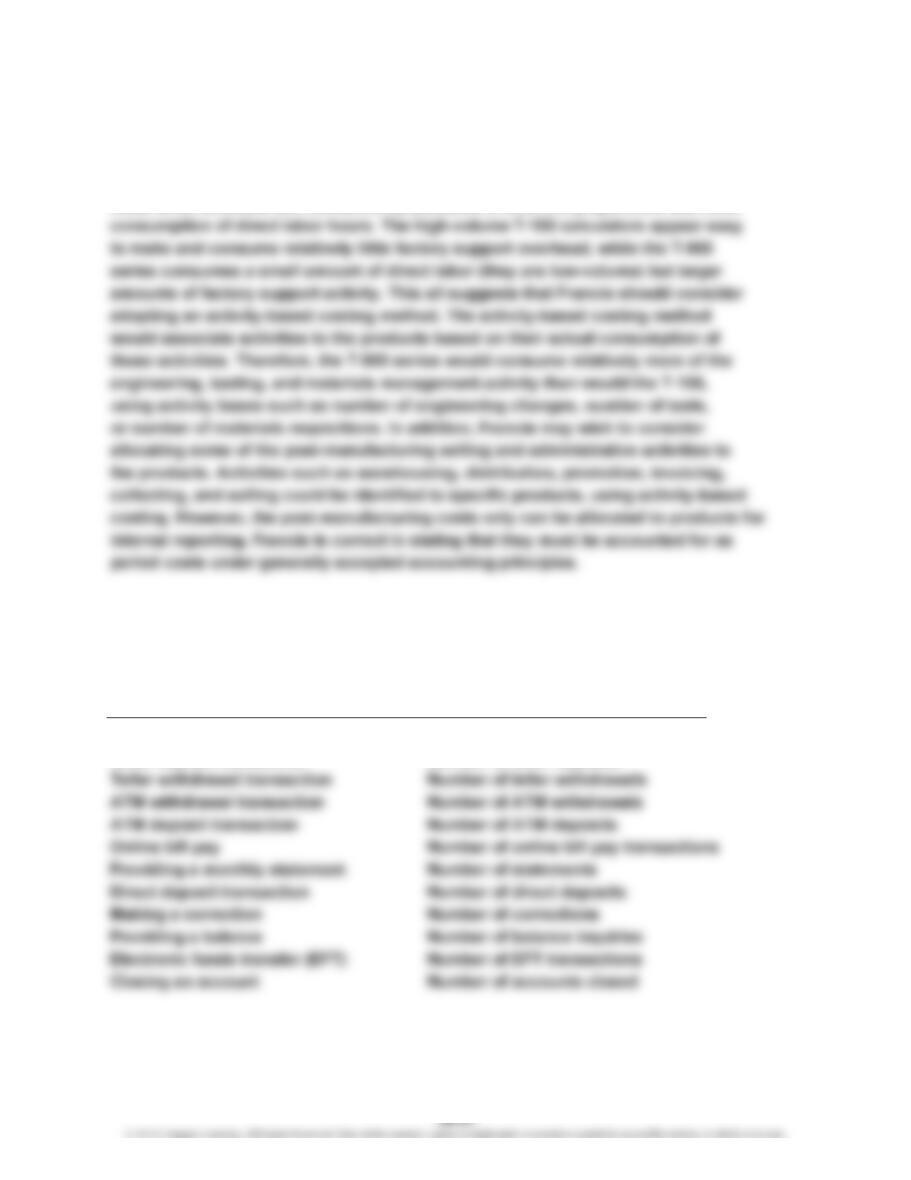
Students may arrive at a variety of possible activities and activity bases. Below is a
representative list.
Activity Activity Base
Opening an account Number of accounts opened
Teller deposit transaction Number of teller deposits