CHAPTER 16 Financial Statement Analysis
Ex. 16–18
a.
b.
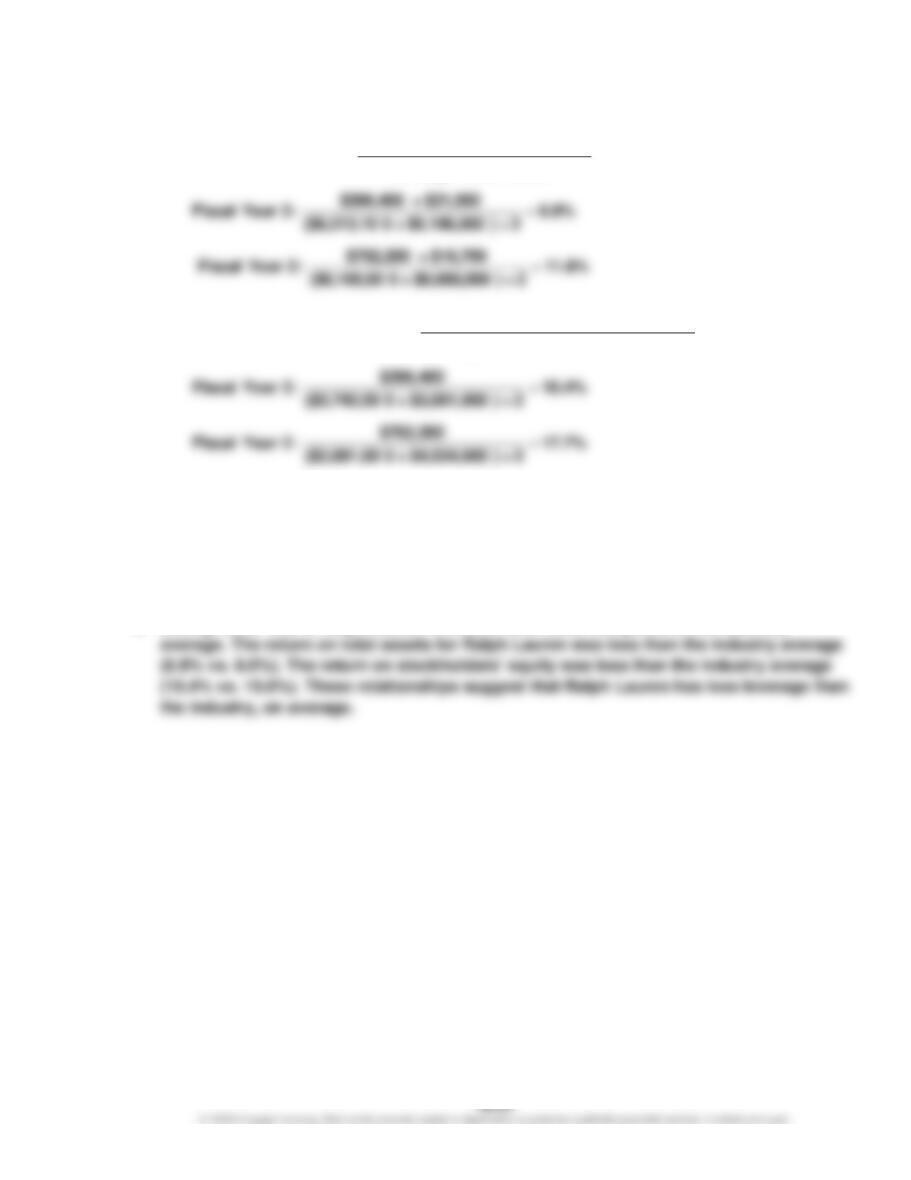
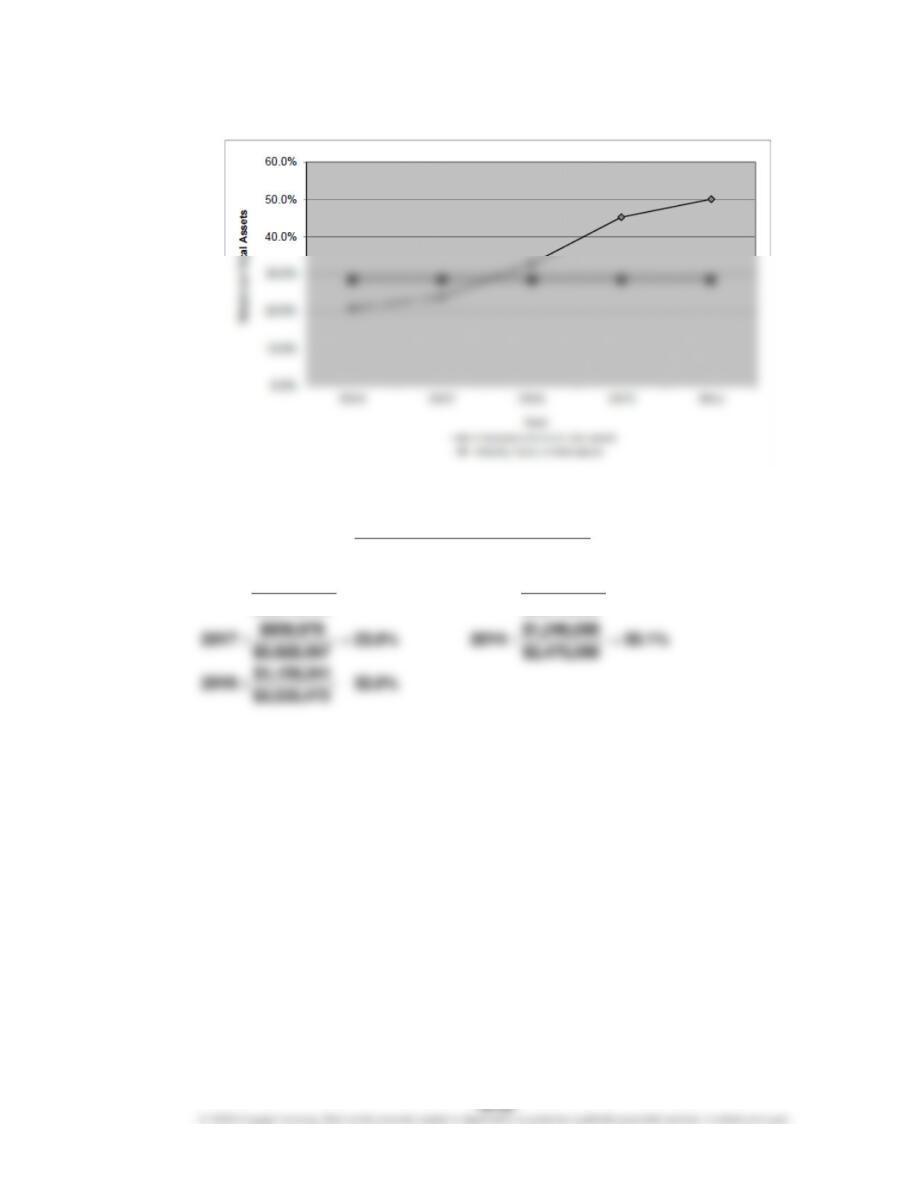
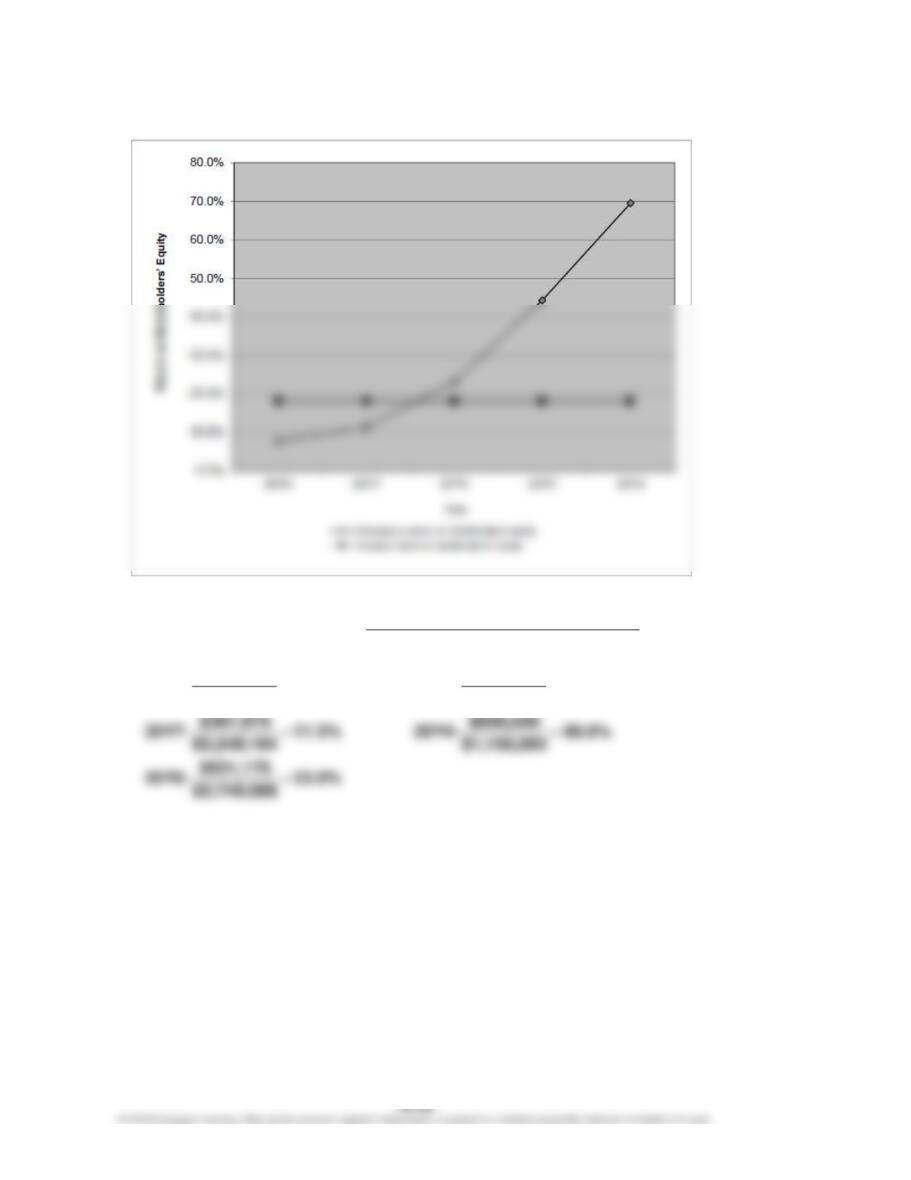
c. Both the return on total assets and the return on stockholders’ equity have decreased
over the two-year period. The return on total assets decreased from 11.8% to 6.8%, and
the return on stockholders’ equity decreased from 17.7% to 10.4%. The return on
stockholders’ equity exceeds the return on total assets due to the positive use of
leverage.
d. During fiscal Year 3, Ralph Lauren’s results were weak compared to the industry
AssetsTotal Average
ExpenseInterest + IncomeNet
AssetsTotal on Return
=
Equity rs’Stockholde Total Average
IncomeNet
Equity rs’Stockholde on Return
=
CHAPTER 16 Financial Statement Analysis
Ex. 16–19
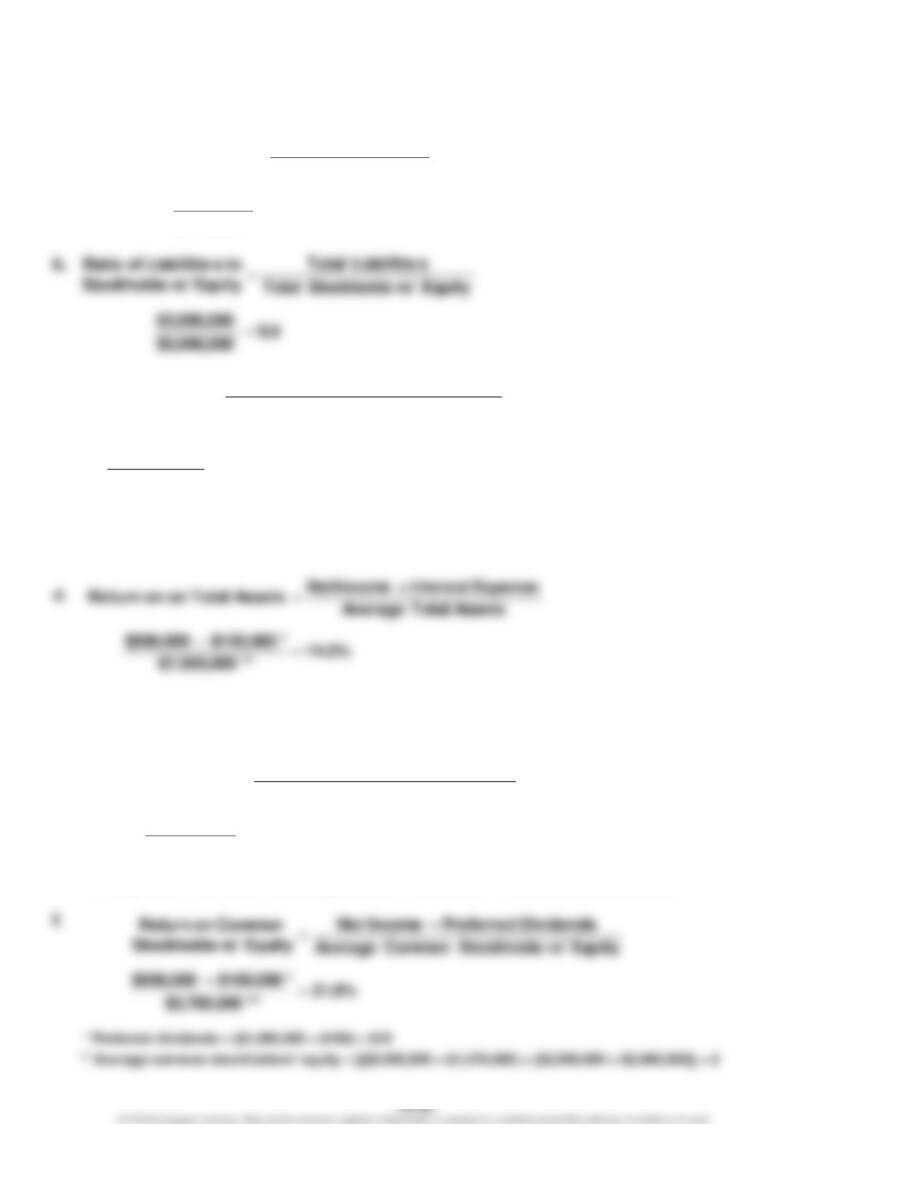
a.
c.
* Average total assets = [($7,000,000 + $8,000,000) ÷ 2] – $3,000,000. The end-of-period total assets are equal
to the sum of total liabilities ($3,000,000) and stockholders’ equity ($5,000,000).
* Interest expense = $2,000,000 6%
** Average total assets = ($7,000,000 + $8,000,000) ÷ 2
e.
* Average total stockholders’ equity = [($1,570,000 + $2,000,000 + $1,000,000) + $5,000,000] ÷ 2
1.6
$2,000,000
$3,200,000
sLiabilitie Term–Long
(net) AssetsFixed
sLiabilitie Term–Long
to AssetsFixed of Ratio
=
=
4.2
*$4,500,000
0$18,900,00
s)investmentterm–long (excluding
AssetsTotalAverage
Sales
TurnoverAsset
=
=
19.4%
*$4,785,000
$930,000
Equity rs’Stockholde Total Average
IncomeNet
Equity rs’Stockholde
on Return
=
=
CHAPTER 16 Financial Statement Analysis
Ex. 16–20
*Interest expense = $5,000,000 bonds payable 8%
ExpenseInterest
ExpenseInterest Expense Tax Income Before Income
EarnedInterest Times a. +
=
times 8.5
$400,000
*$400,000 $3,000,000 =
+
10.0
$3.20
$32.00
Share per Earnings
Stock Common of Share per PriceMarket
Ratio Earnings–Price c.
=
=
CHAPTER 16 Financial Statement Analysis
Ex. 16–21
* Preferred dividends = ($2,500,000 ÷ $40) × $4
** Shares of common stock outstanding = $10,000,000 ÷ $20
$3.00
**shares 500,000
*$250,000 – $1,750,000
gOutstandin Stock Common of Shares
Dividends Preferred – IncomeNet
Share per Earnings a.
=
=
$2.25
shares 500,000
$1,125,000
gOutstandin Stock Common of Shares
Dividends Common
Share per Dividends c.
=
=
CHAPTER 16 Financial Statement Analysis
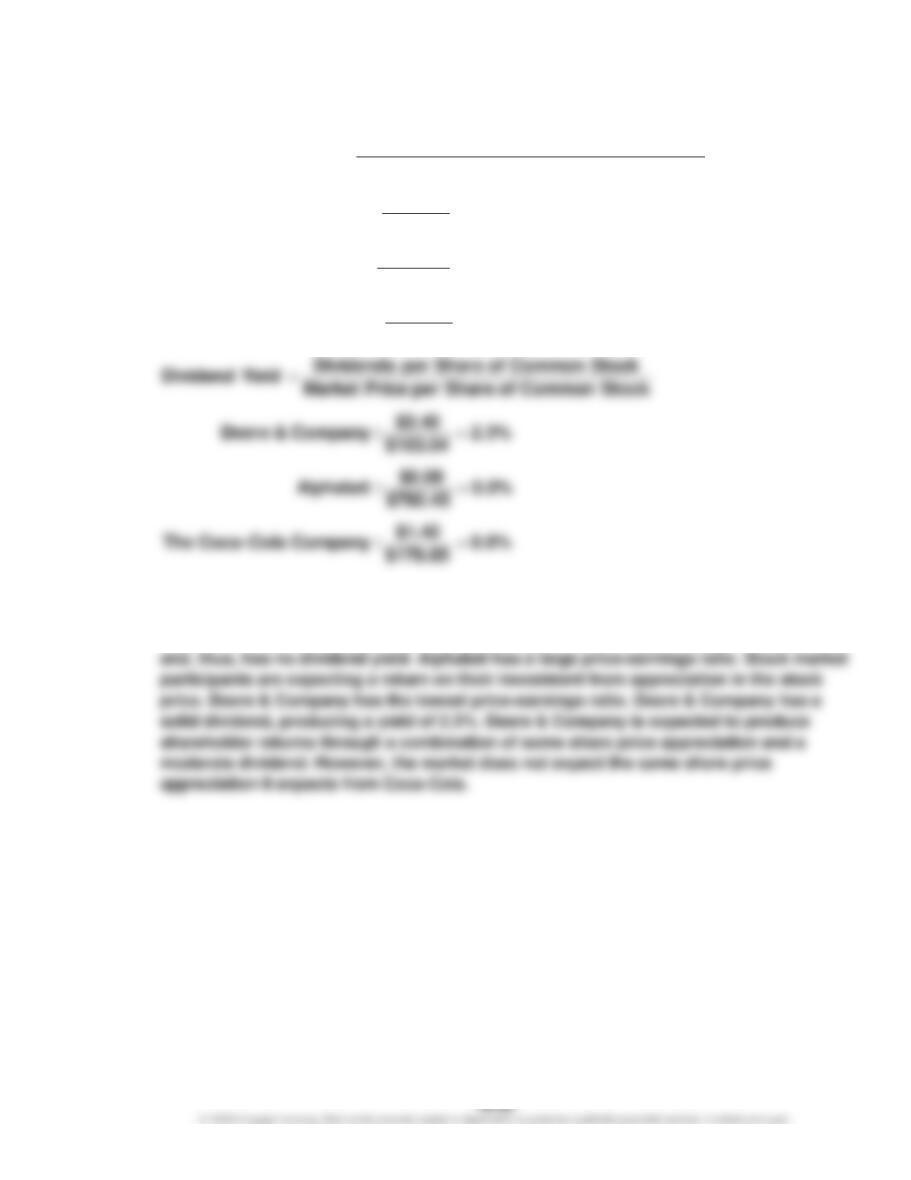
Ex. 16–22
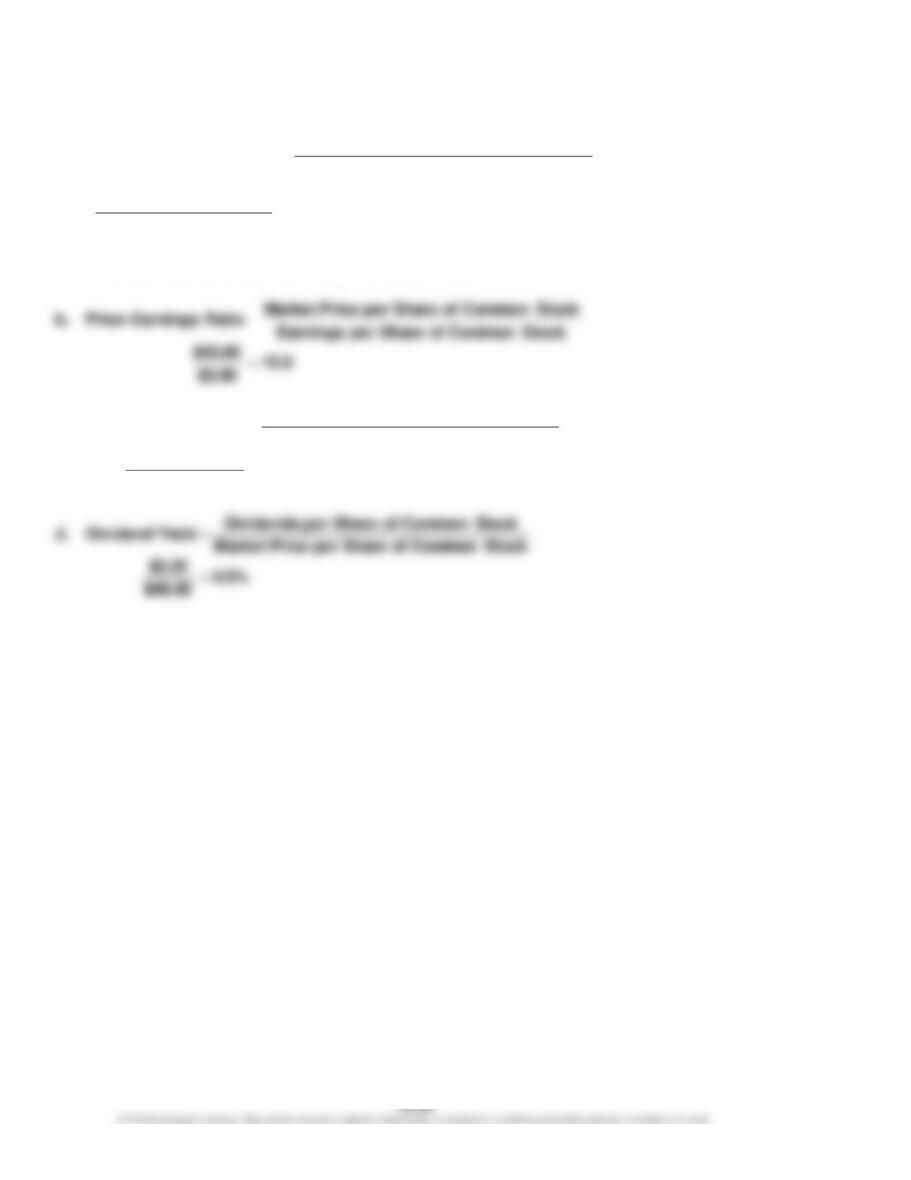
a.
b. Coca-Cola has a small dividend yield and the highest price-earnings ratio of the three
companies. Stock market participants value Coca-Cola common stock on the basis of
both its dividend and its potential share price appreciation. Alphabet pays no dividend
118.4
$1.51
$178.85
:Company Cola–Coca The
37.9
$20.91
$792.45
:Alphabet
21.3
$4.83
$103.04
:Company & Deere
Share per Earnings
Stock Common of Share per PriceMarket
Ratio Earnings–Price
=
=
=
=
CHAPTER 16 Financial Statement Analysis
Appendix 1 Ex. 16–23
a. Earnings per share on income before discontinued operations:
Net income …………………………………………………………………………… $4,000,000
Gain on discontinued operations …………………………………………… (400,000)
Income before discontinued operations …………………………………. $3,600,000
gOutstandin
Stock Common of Shares
Dividends Preferred–
Operations edDiscontinu Before Income
Stock Common on Share per
Operations Disc. Before Earnings
=
CHAPTER 16 Financial Statement Analysis
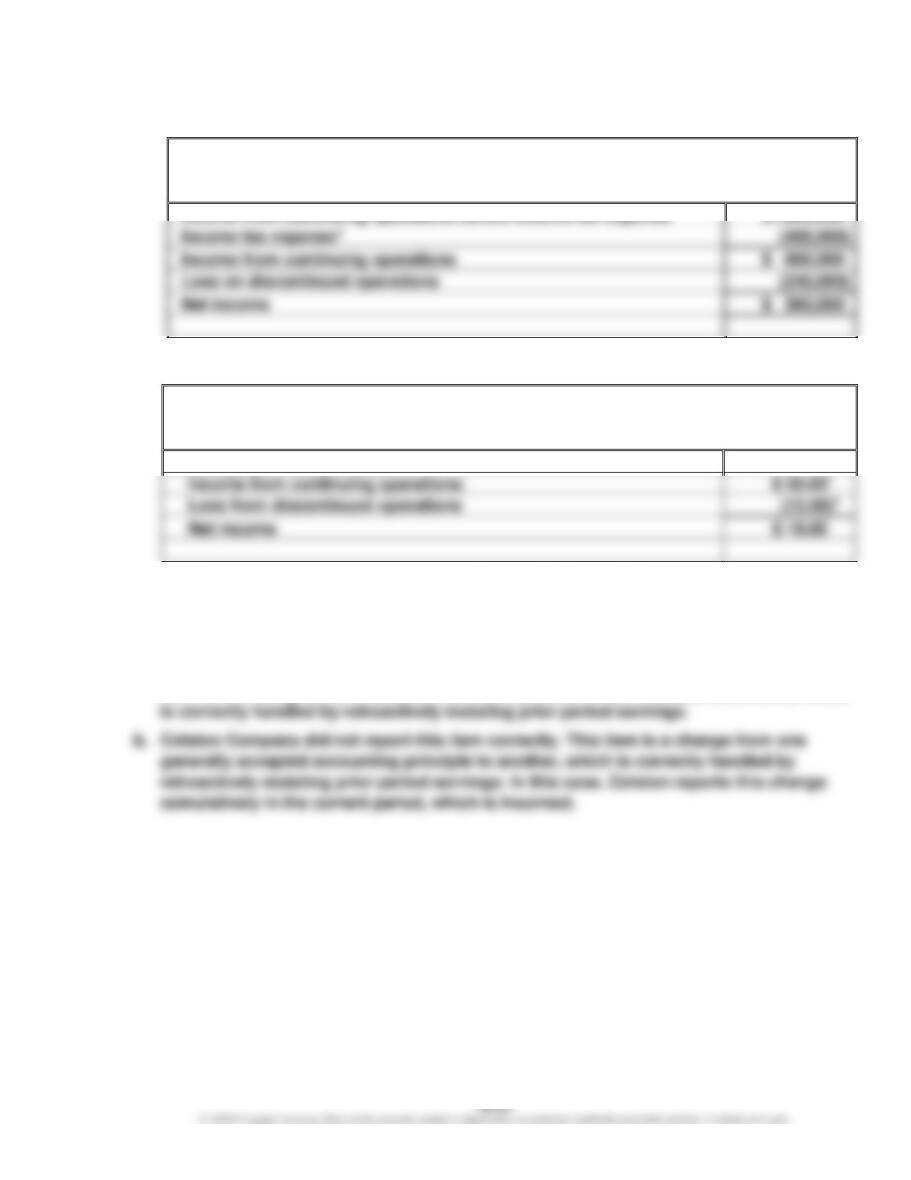
Appendix 1 Ex. 16–24
a.
Apex Inc.
Partial Income Statement
For the Year Ended December 31
* Income tax expense = $1,000,000 40%
b.
Apex Inc.
Partial Income Statement
For the Year Ended December 31
Earnings per common share:
1EPS on Income from continuing operations = $30.00 = $600,000 ÷ 20,000
2EPS on Loss from discontinued operations = –$12.00 = –$240,000 ÷ 20,000
Appendix 1 Ex. 16–25
a. Colston Company reported this item correctly in the financial statements. This item is an
error in the recognition, measurement, or presentation in the financial statements, which
CHAPTER 16 Financial Statement Analysis
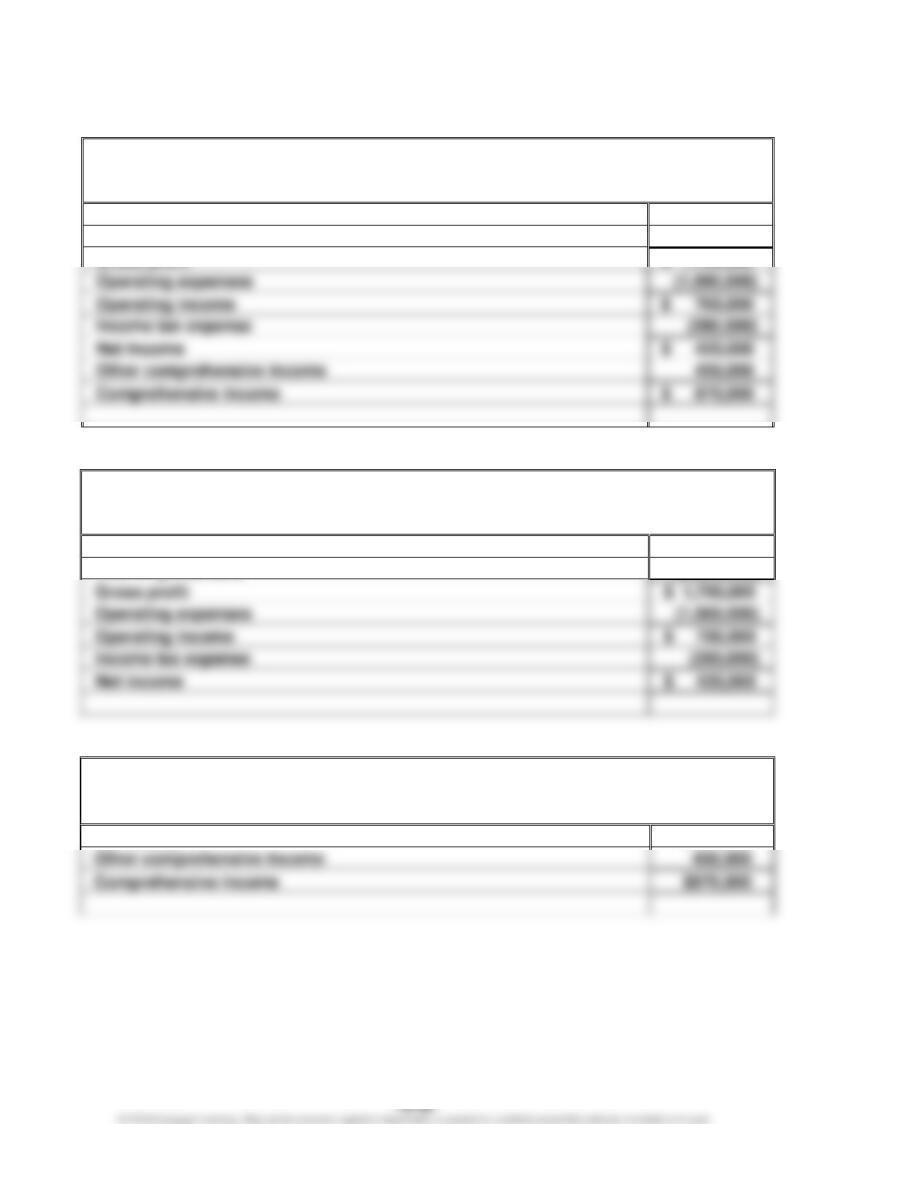
Appendix 2 Ex. 16–26
a.
Anson Industries, Inc.
Income Statement
For the Year Ended December 31, 20Y1
Sales
$ 4,000,000
Cost of goods sold
(2,300,000)
Gross profit
Operating expenses
Operating income
Income tax expense
Net income
Other comprehensive income
Comprehensive income
b.
Anson Industries, Inc.
Income Statement
For the Year Ended December 31, 20Y1
Sales
$ 4,000,000
Cost of goods sold
(2,300,000)
Gross profit
Operating expenses
Operating income
$ 700,000
Income tax expense
Net income
Anson Industries, Inc.
Statement of Comprehensive Income
For the Year Ended December 31, 20Y1
Net income
$420,000
Comprehensive income
$870,000
CHAPTER 16 Financial Statement Analysis
PROBLEMS
Prob. 16–1A
1.
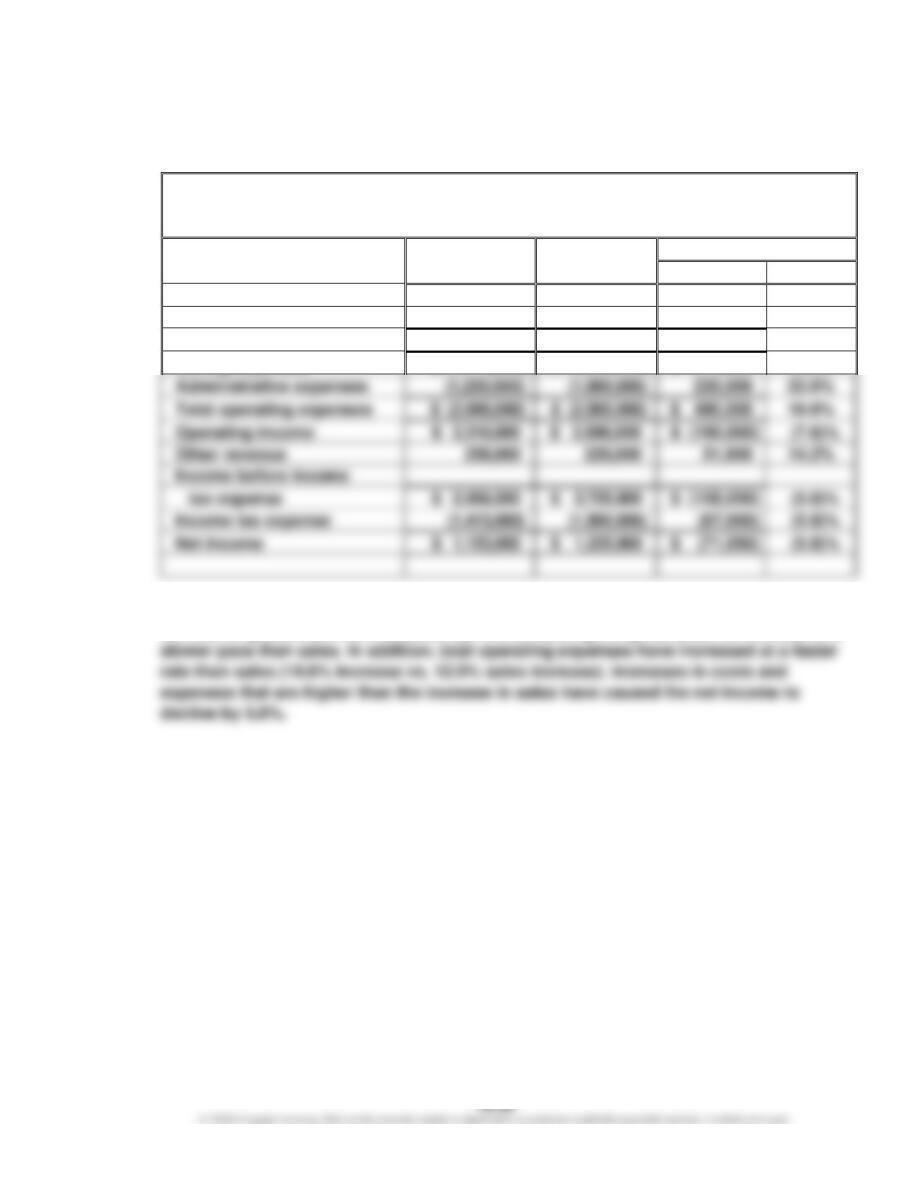
McDade Company
Comparative Income Statement
For the Years Ended December 31, 20Y2 and 20Y1
20Y2
20Y1
Increase/(Decrease)
Amount
Percent
Sales
$ 16,800,000
$ 15,000,000
$1,800,000
12.0%
Cost of goods sold
(11,500,000)
(10,000,000)
1,500,000
15.0%
Gross profit
$ 5,300,000
$ 5,000,000
$ 300,000
6.0%
Selling expenses
$ (1,770,000)
$ (1,500,000)
$ 270,000
18.0%
Administrative expenses
(1,000,000)
22.0%
Total operating expenses
$ (2,500,000)
$ 490,000
19.6%
Operating income
$ 2,310,000
$ 2,500,000
$ (190,000)
Other revenue
31,950
14.2%
Income before income
tax expense
$ 2,566,950
$ (158,050)
Income tax expense
(1,500,000)
(87,000)
Net income
$ 1,153,950
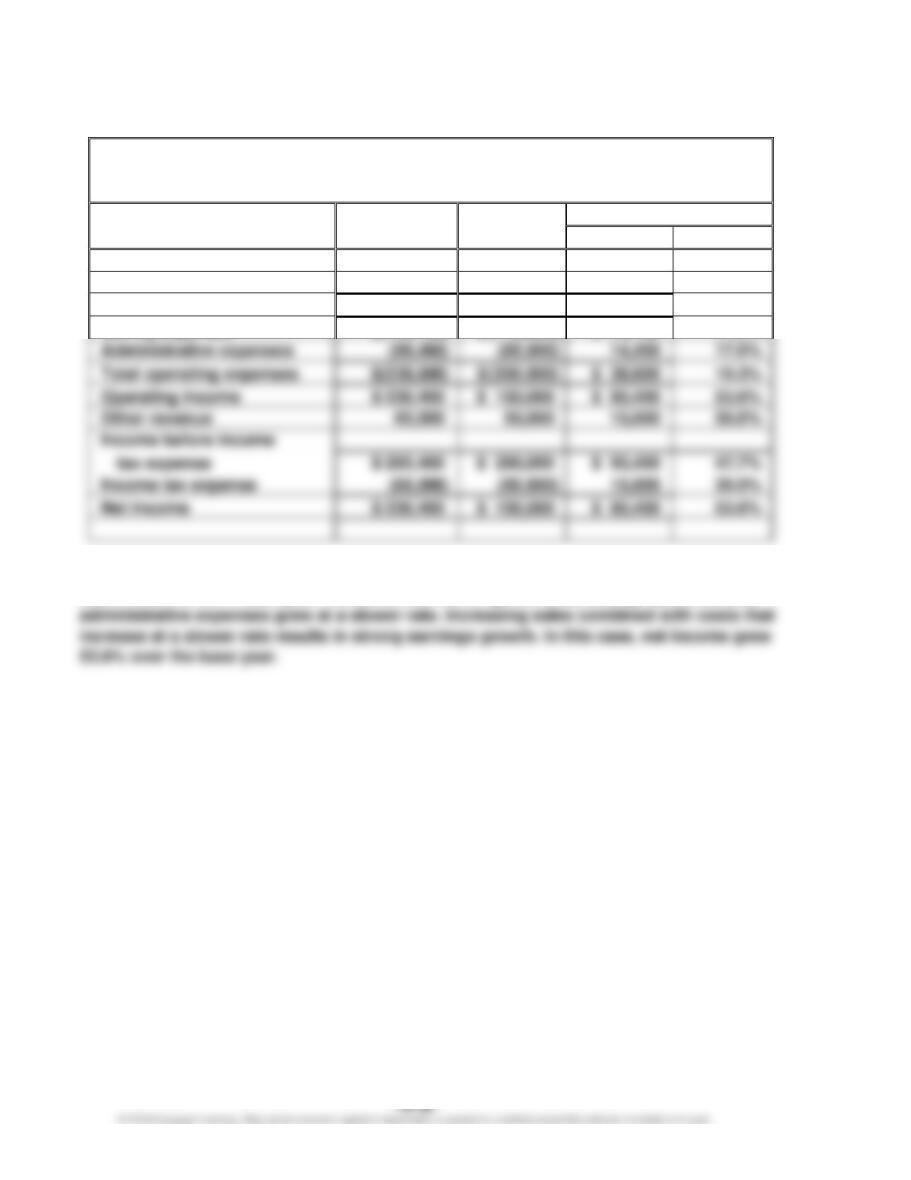
2. Net income has declined from 20Y1 to 20Y2. Sales have increased by 12.0%; however,
the cost of goods sold has increased by 15.0%, causing the gross profit to increase at a
CHAPTER 16 Financial Statement Analysis
Prob. 16–2A
1.
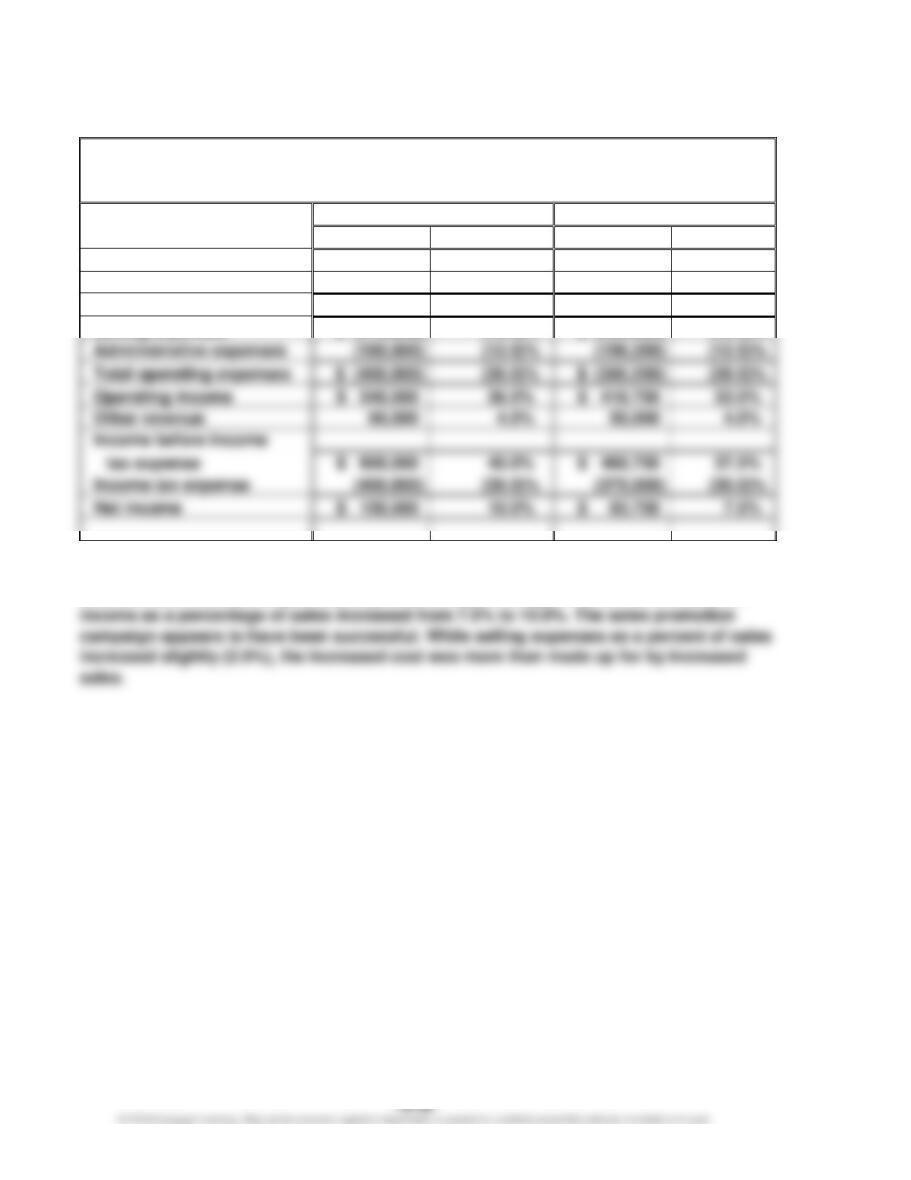
Tri-Comic Company
Comparative Income Statement
For the Years Ended December 31, 20Y2 and 20Y1
20Y2
20Y1
Amount
Percent
Amount
Percent
Sales
$1,500,000
100.0%
$1,250,000
100.0%
Cost of goods sold
(510,000)
(34.0)%
(475,000)
(38.0)%
Gross profit
$ 990,000
66.0%
$ 775,000
62.0%
Selling expenses
$ (270,000)
(18.0)%
$ (200,000)
(16.0)%
Administrative expenses
(180,000)
(156,250)
(12.5)%
Total operating expenses
$ (450,000)
(30.0)%
$ (356,250)
(28.5)%
Operating income
$ 540,000
$ 418,750
33.5%
Other revenue
4.0%
Income before income
$ 600,000
$ 468,750
37.5%
Income tax expense
(450,000)
(30.0)%
(375,000)
(30.0)%
Net income
10.0%
$ 93,750
7.5%
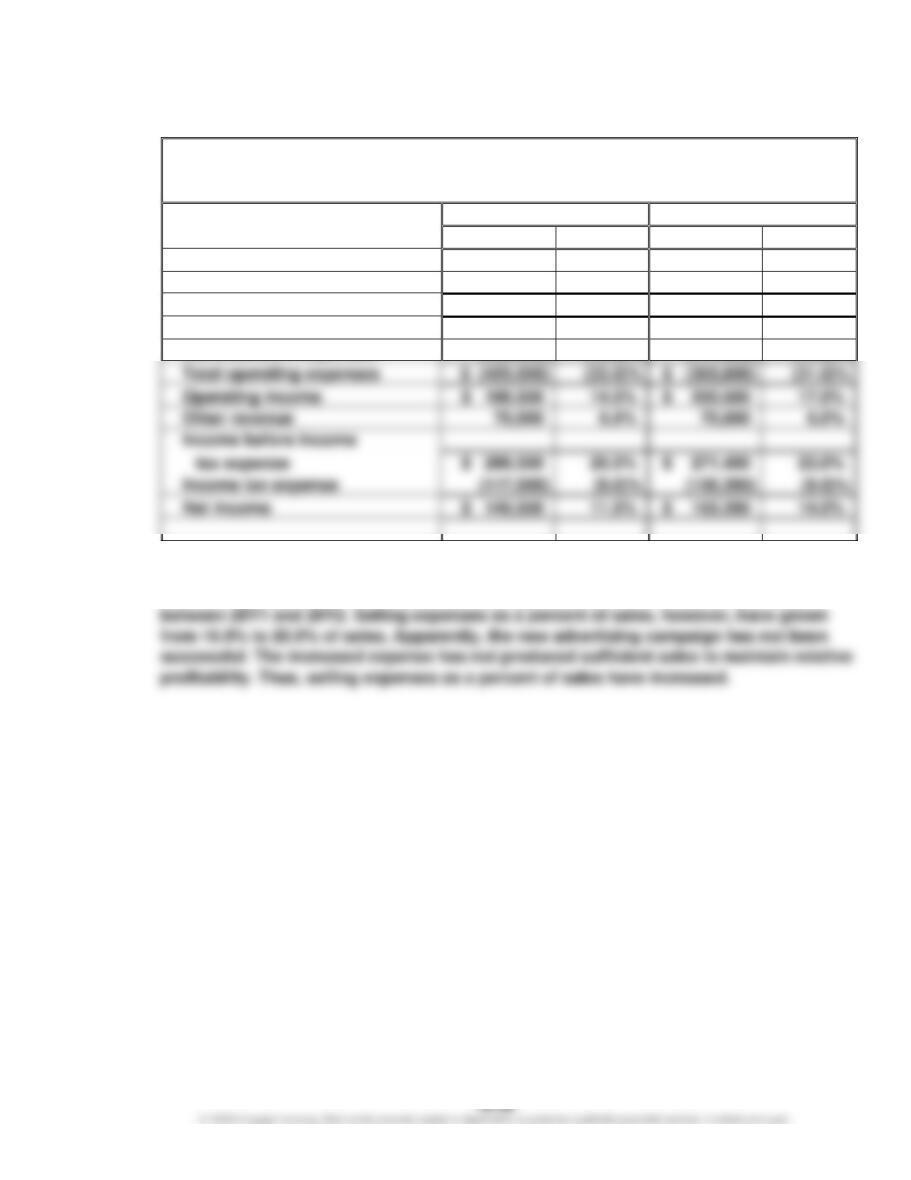
2. The vertical analysis indicates that the costs other than selling expenses (cost of goods
sold and administrative expenses) improved as a percentage of sales. As a result, net
CHAPTER 16 Financial Statement Analysis
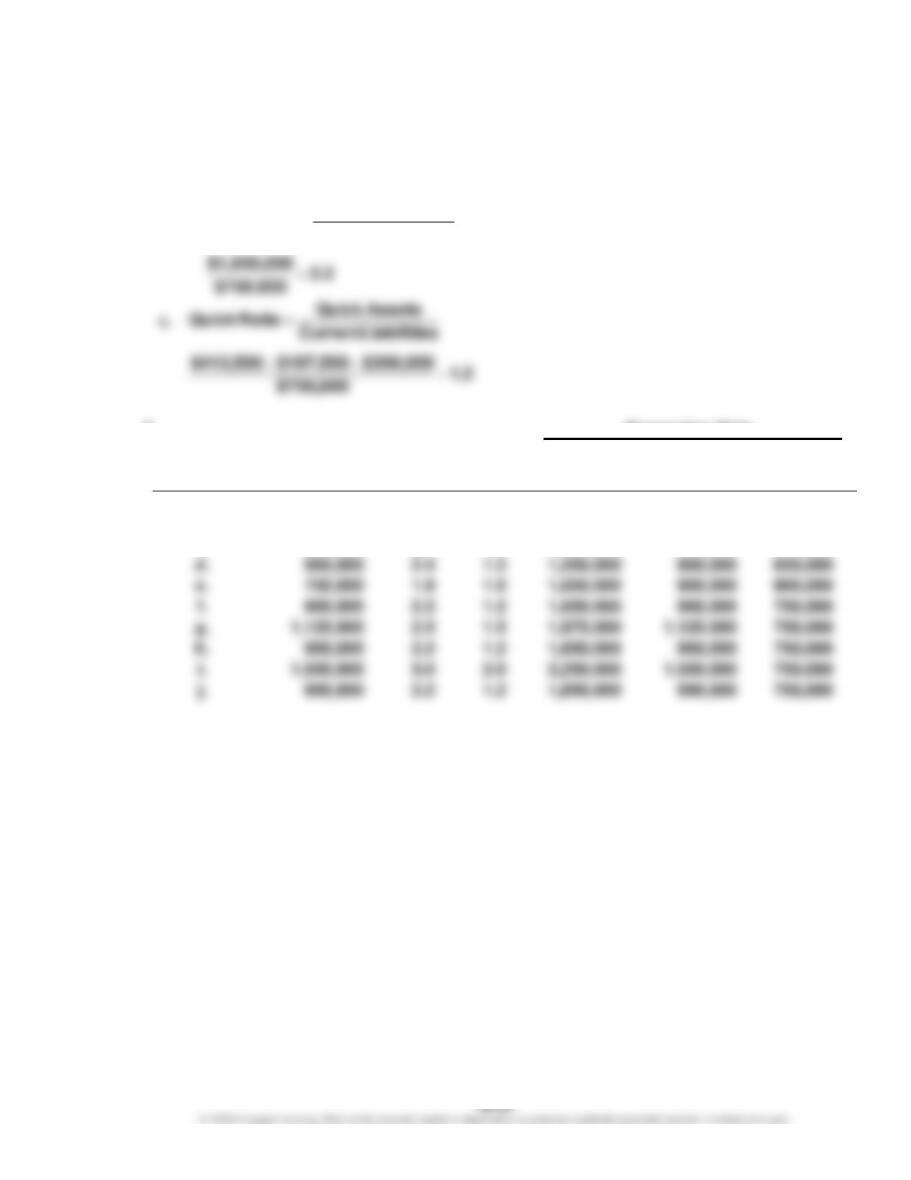
Prob. 16–3A
1. a. Working Capital = Current Assets – Current Liabilities
$1,650,000 – $750,000 = $900,000
b.
2. Supporting Data
Transaction
Working
Capital
Current
Ratio
Quick
Ratio
Current
Assets
Quick
Assets
Current
Liabilities
a.
$ 900,000
2.2
1.2
$1,650,000
$ 900,000
$750,000
b.
900,000
2.4
1.2
1,525,000
775,000
625,000
c.
900,000
2.0
1.0
1,760,000
900,000
860,000
d.
900,000
2.4
1.2
1,550,000
800,000
650,000
e.
750,000
1.8
1.0
1,650,000
900,000
900,000
g.
1,125,000
2.5
1.5
1,875,000
750,000
h.
900,000
2.2
1.2
1,650,000
900,000
750,000
1,500,000
3.0
2.0
2,250,000
750,000
900,000
2.2
1.2
1,650,000
890,000
750,000
sLiabilitieCurrent
setsCurrent As
RatioCurrent
=
CHAPTER 16 Financial Statement Analysis
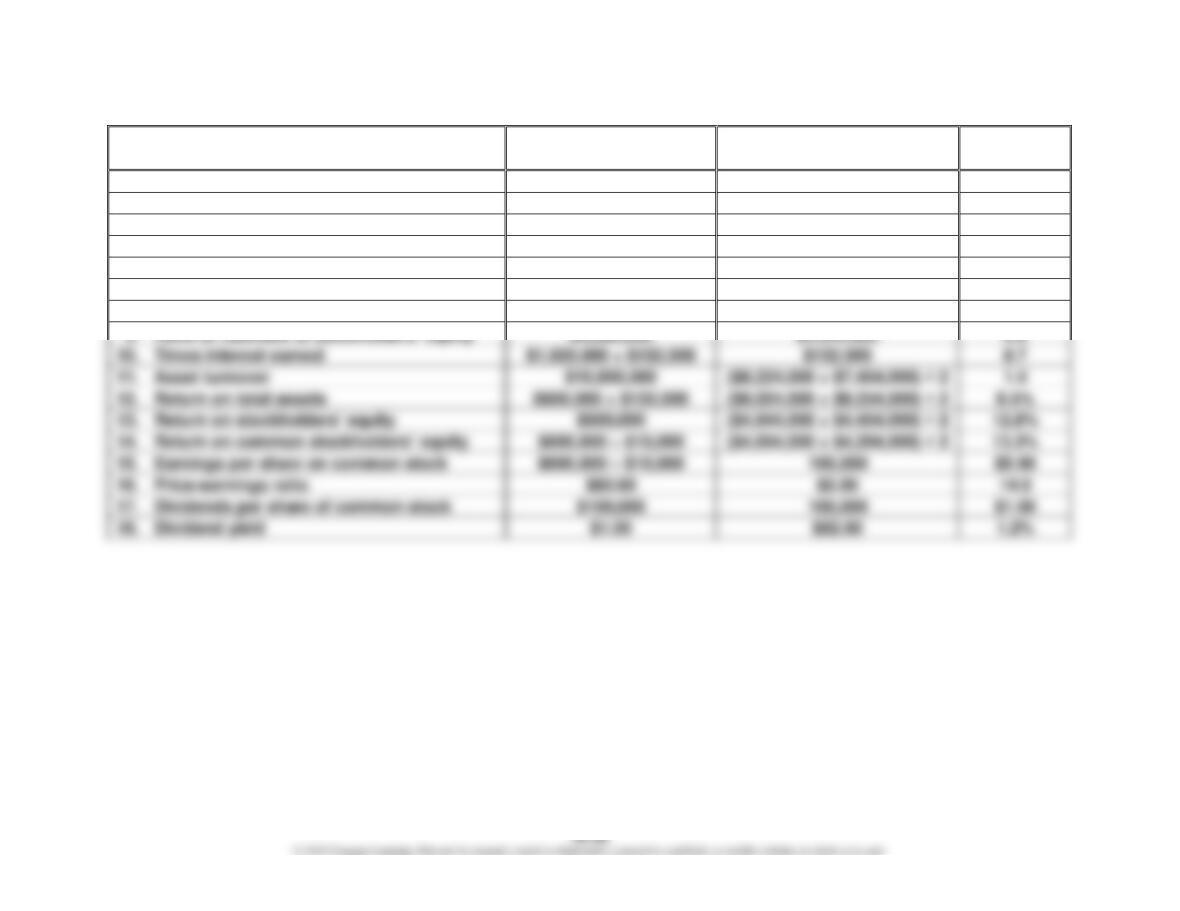
Prob.16–4A
1. Working Capital: $2,464,000 – $880,000 = $1,584,000
Ratio
Numerator
Denominator
Calculated
Value
2.
Current ratio
$2,464,000
$880,000
2.8
3.
Quick ratio
$1,936,000
$880,000
2.2
4.
Accounts receivable turnover
$10,850,000
($585,000 + $500,000) ÷ 2
20.0
5.
Number of days’ sales in receivables
($585,000 + $500,000) ÷ 2
$10,850,000 ÷ 365
18.3
6.
Inventory turnover
$6,000,000
($420,000 + $380,000) ÷ 2
15.0
7.
Number of days’ sales in inventory
($420,000 + $380,000) ÷ 2
$6,000,000 ÷ 365
24.3
8.
Ratio of fixed assets to long-term liabilities
$5,760,000
$3,200,000
1.8
9.
Ratio of liabilities to stockholders’ equity
$4,080,000
$4,944,000
0.8
Times interest earned
$132,000
8.7
Asset turnover
$10,850,000
1.4
Return on total assets
Return on stockholders’ equity
$600,000
Return on common stockholders’ equity
Earnings per share on common stock
$82.60
14.0
Dividends per share of common stock
$100,000
Dividend yield
CHAPTER 16 Financial Statement Analysis
Prob. 16–5A
1.
a.
AssetsTotal Average
ExpenseInterest IncomeNet
AssetsTotal on Return +
=
45.3%
$1,379,000
:20Y520.8%
$889,453
:20Y8
==
CHAPTER 16 Financial Statement Analysis
Prob. 16–5A (Continued)
1.
b.
Equity rs’Stockholde Total Average
IncomeNet
Equity rs’Stockholde on Return =
44.4%
$1,992,000
$884,000
:20Y57.7%
$3,569,855
$273,406
:20Y8
==
CHAPTER 16 Financial Statement Analysis
Prob. 16–5A (Continued)
1.
c.
ExpenseInterest
ExpenseInterest Expense Tax Income IncomeNet
EarnedInterest Times ++
=
3.1
$1,539,000
:20Y51.5
$921,202
:20Y8
==
CHAPTER 16 Financial Statement Analysis
Prob. 16–5A (Continued)
1.
d.
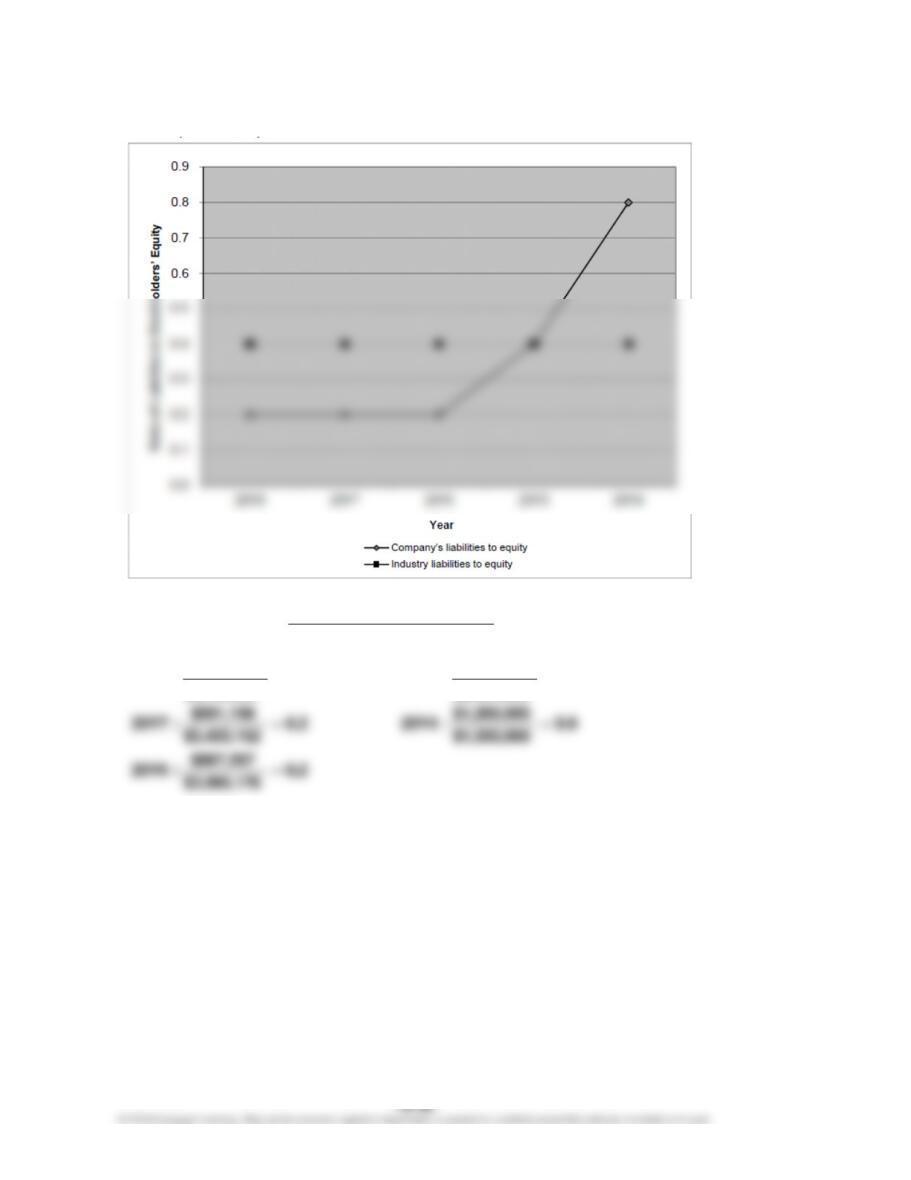
Note: The total liabilities are the difference between the total assets and total
stockholders’ equity ending balances.
Equity rs’Stockholde Total
sLiabilitie Total
Equity rs’Stockholde
to sLiabilitie of Ratio =
0.4
$904,500
:20Y50.2
$710,621
:20Y8
==
CHAPTER 16 Financial Statement Analysis
Prob. 16–5A (Concluded)
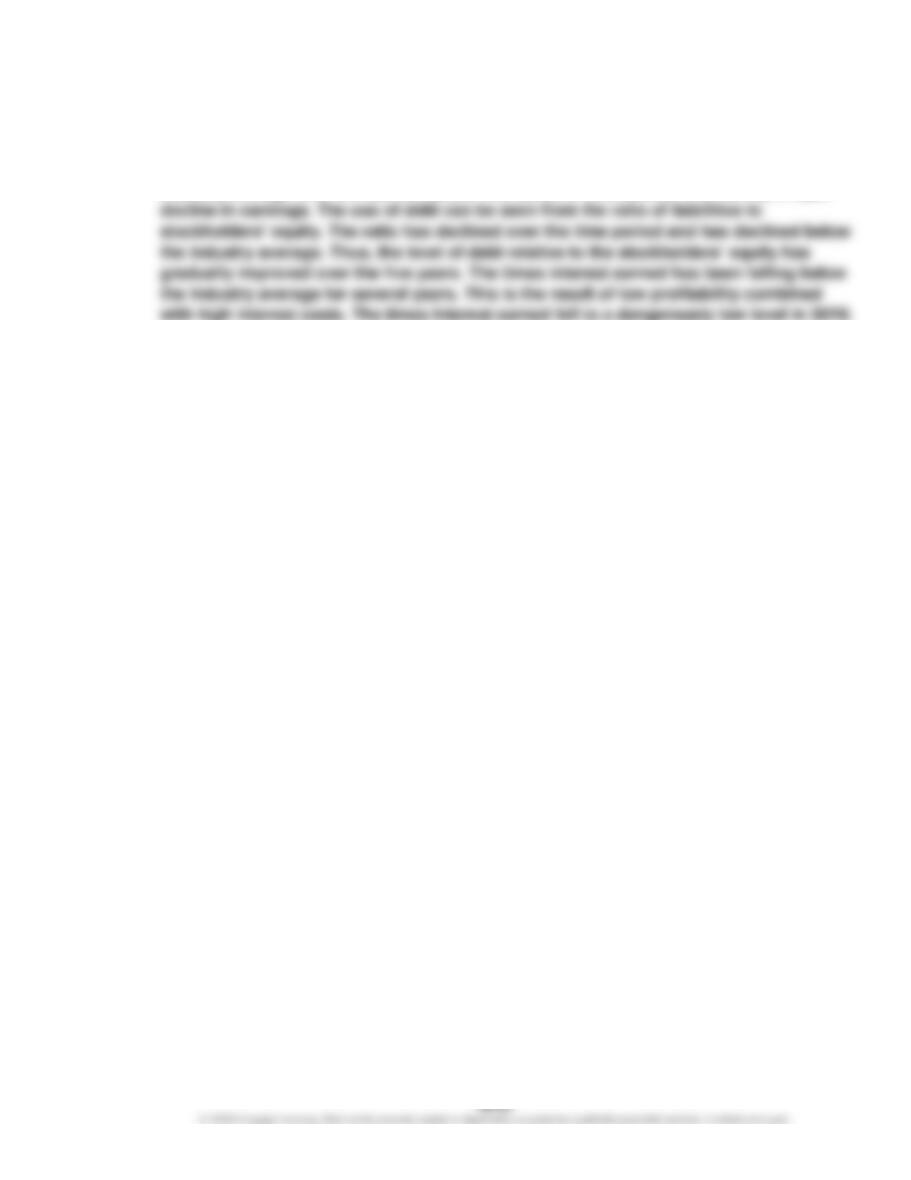
2. Both the return on total assets and the return on stockholders’ equity have been moving
in a negative direction in the last five years. Both measures have moved below the
industry average over the last two years. The cause of this decline is driven by a rapid
CHAPTER 16 Financial Statement Analysis
Prob. 16–1B
1.
Macklin Inc.
Comparative Income Statement
For the Years Ended December 31, 20Y2 and 20Y1
Increase/(Decrease)
20Y2
20Y1
Amount
Percent
Sales
$ 910,000
$ 700,000
$210,000
30.0%
Cost of goods sold
(441,000)
(350,000)
91,000
26.0%
Gross profit
$ 469,000
$ 350,000
$119,000
34.0%
Selling expenses
$(139,150)
$ 24,150
Administrative expenses
14,450
17.0%
Total operating expenses
$(238,600)
19.3%
Operating income
$ 230,400
$ 150,000
53.6%
Other revenue
15,000
30.0%
Income before income
$ 295,400
$ 200,000
47.7%
Income tax expense
15,000
30.0%
Net income
$ 230,400
$ 80,400
53.6%
2. The profitability has significantly improved from 20Y1 to 20Y2. Sales have increased by
30.0% over the 20Y1 base year. However, the cost of goods sold, selling expenses, and
CHAPTER 16 Financial Statement Analysis
Prob. 16–2B
1.
Fielder Industries Inc.
Comparative Income Statement
For the Years Ended December 31, 20Y2 and 20Y1
20Y2
20Y1
Amount
Percent
Amount
Percent
Sales
$1,300,000
100.0%
$ 1,180,000
100.0%
Cost of goods sold
(682,500)
(52.5)%
(613,600)
(52.0)%
Gross profit
$ 617,500
47.5%
$ 566,400
48.0%
Selling expenses
$ (260,000)
(20.0)%
$ (188,800)
(16.0)%
Administrative expenses
(169,000)
(13.0)%
(177,000)
(15.0)%
Total operating expenses
$ (429,000)
(33.0)%
(31.0)%
Operating income
$ 188,500
17.0%
Other revenue
Income before income
$ 266,500
23.0%
Income tax expense
(117,000)
(106,200)
Net income
$ 149,500
14.0%
2. The net income as a percent of sales has declined. All the costs and expenses, other
than selling expenses, have maintained their approximate cost as a percent of sales