Unlock document.
This document is partially blurred.
Unlock all pages and 1 million more documents.
Get Access
CHAPTER 25 Capital Investment Analysis
Prob. 25–3A (FIN MAN); Prob. 10–3A (MAN) (Concluded)
$9,257,000
$7,000,000
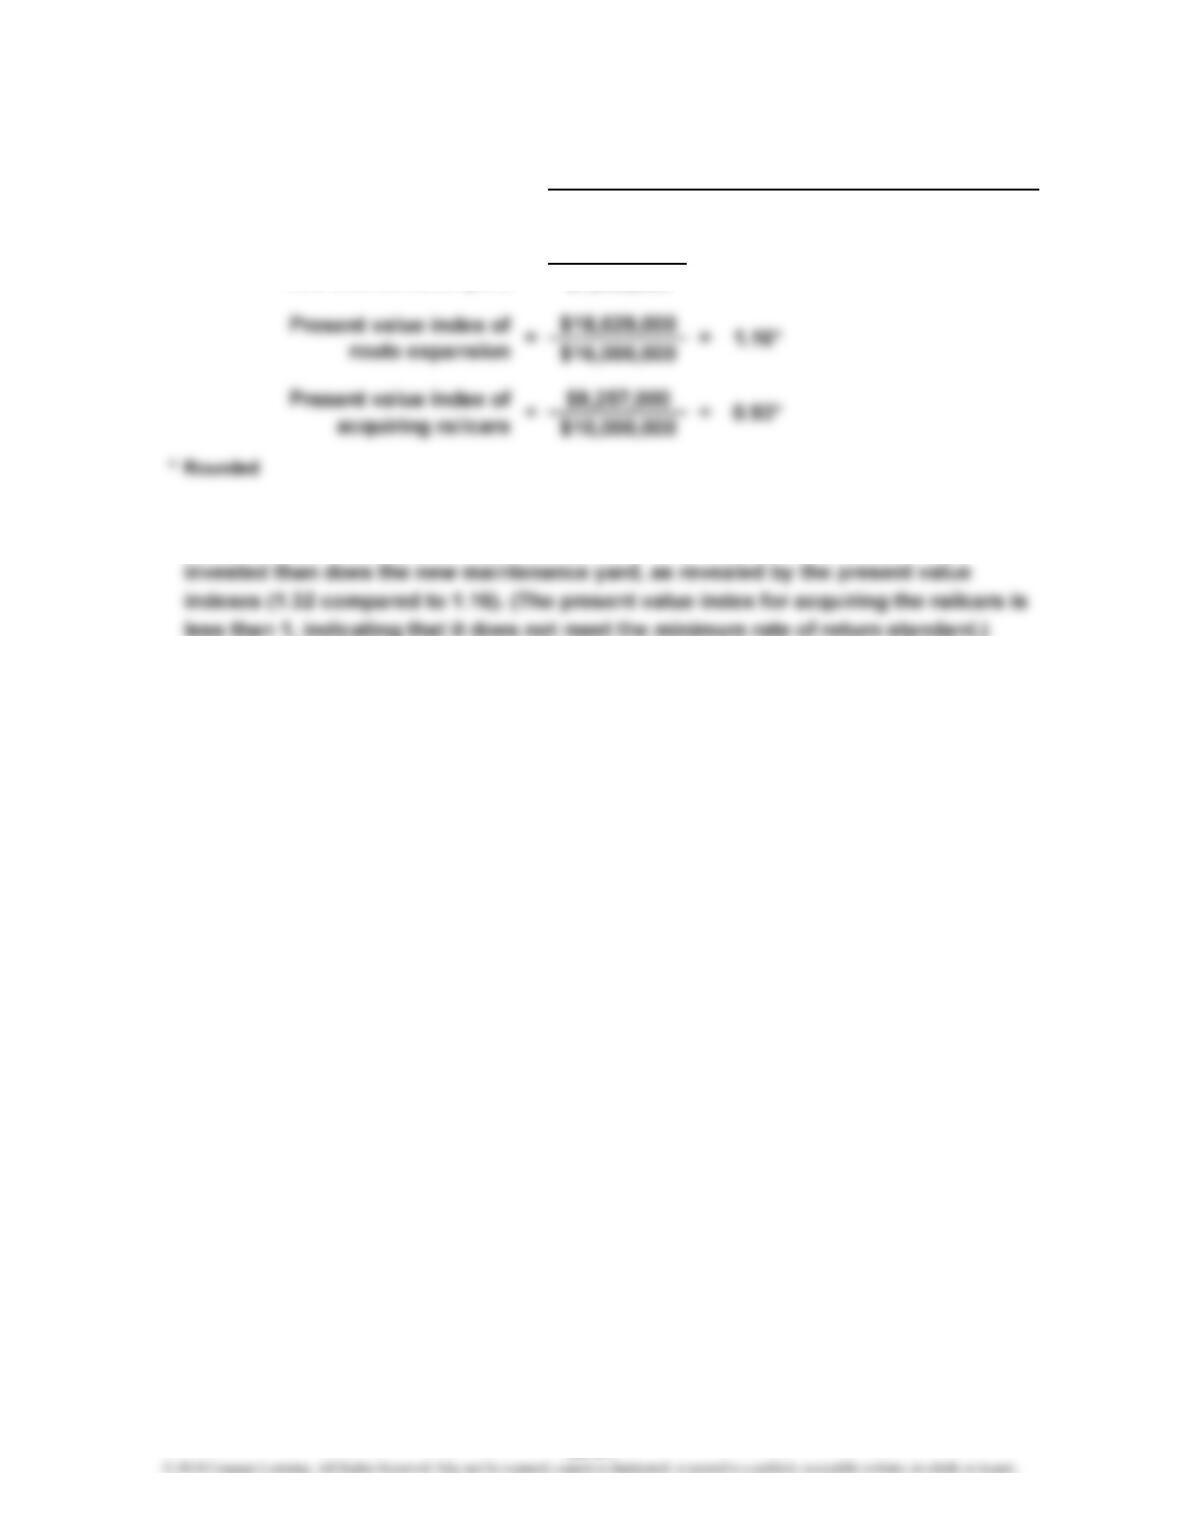
3. The new maintenance yard has the largest present value index. Although route
expansion has the largest net present value, it returns less present value per dollar
=
Present Value Index = Total Present Value of Net Cash Flow
Amount to Be Invested
2.
Present value index of
new maintenance yard = 1.32*
25-21
CHAPTER 25 Capital Investment Analysis
Prob. 25–4A (FIN MAN); Prob. 10–4A (MAN)
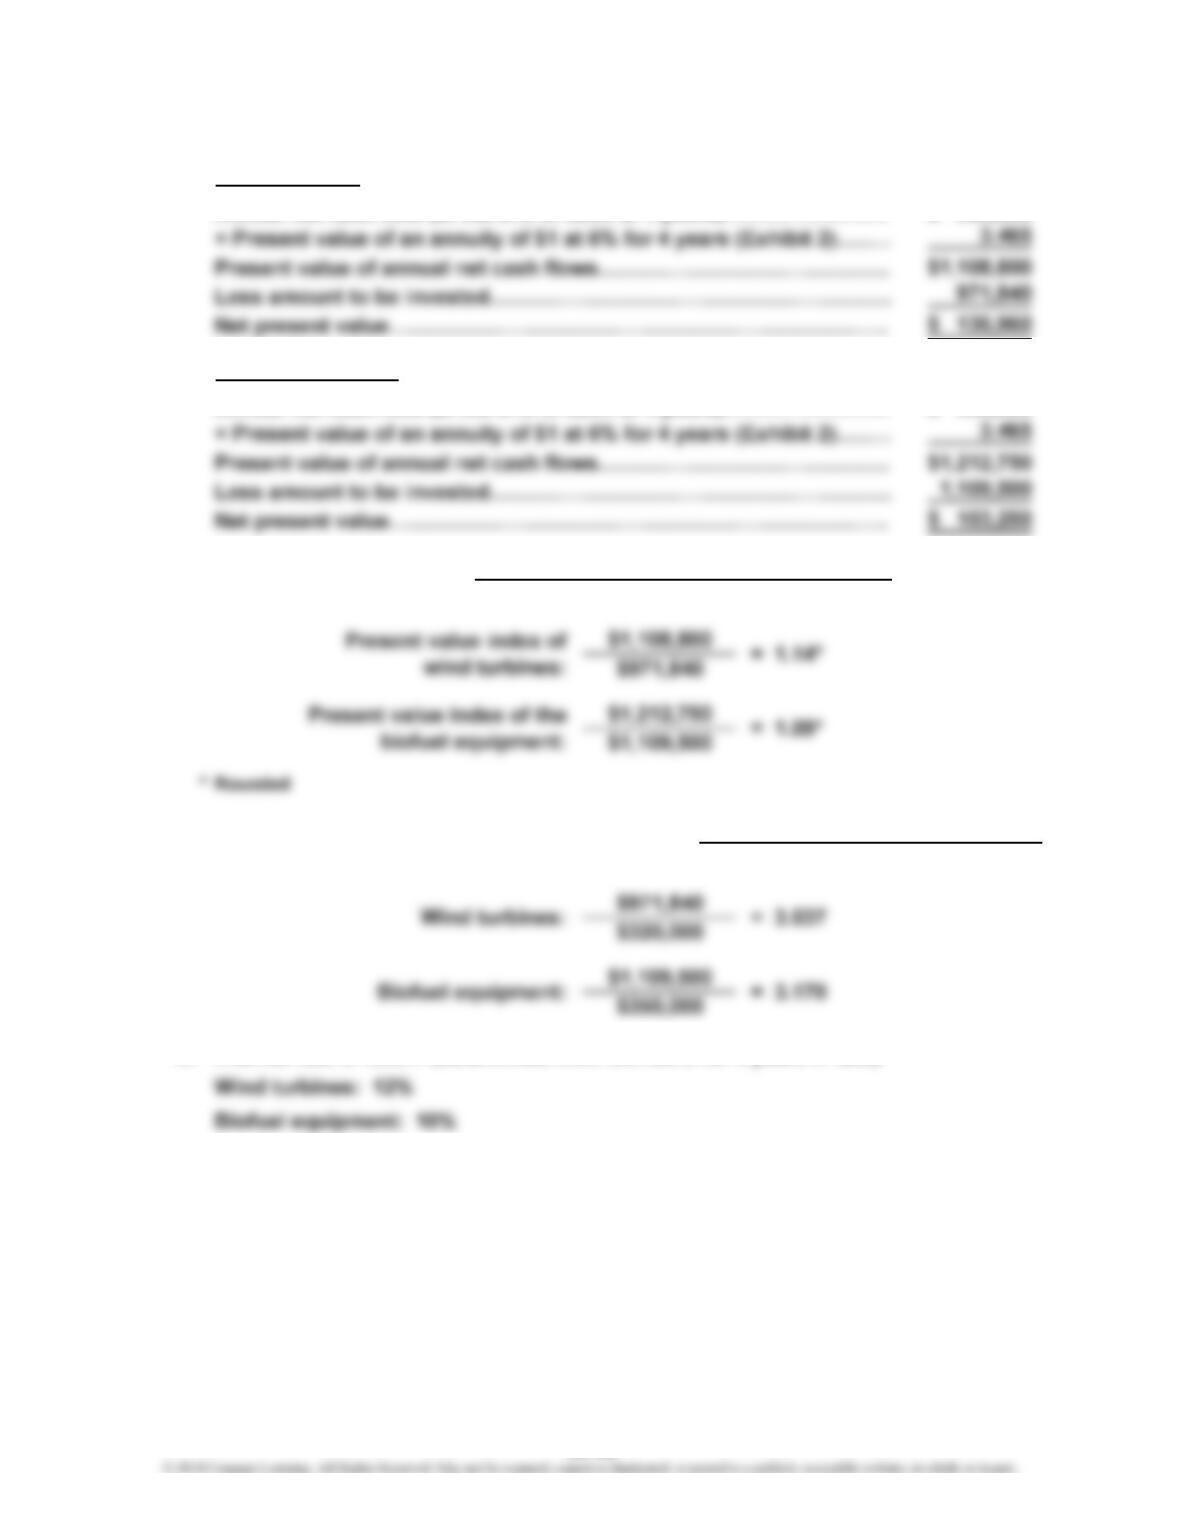
1. a. Wind Turbines:
Annual net cash flow (at the end of each of 4 years)…………………… $ 320,000
Biofuel Equipment:
Annual net cash flow (at the end of each of 4 years)…………………… $ 350,000
b. Internal rate of return (determined from Exhibit 2 for 4 years in text)
2. Present Value Factor for an Annuity of $1 Amount to Be Invested
Annual Net Cash Flow
a. =
b.
Present Value Index =
Total Present Value of Net Cash Flow
Amount to Be Invested
25-22
CHAPTER 25 Capital Investment Analysis
Prob. 25–4A (FIN MAN); Prob. 10–4A (MAN) (Concluded)
3. The net present value, present value index, and internal rate of return all indicate
that the wind turbines are a better financial opportunity compared to the biofuel
equipment, although both investments meet the minimum return criterion of 6%. The
25-23
CHAPTER 25 Capital Investment Analysis
Prob. 25–5A (FIN MAN); Prob. 10–5A (MAN)
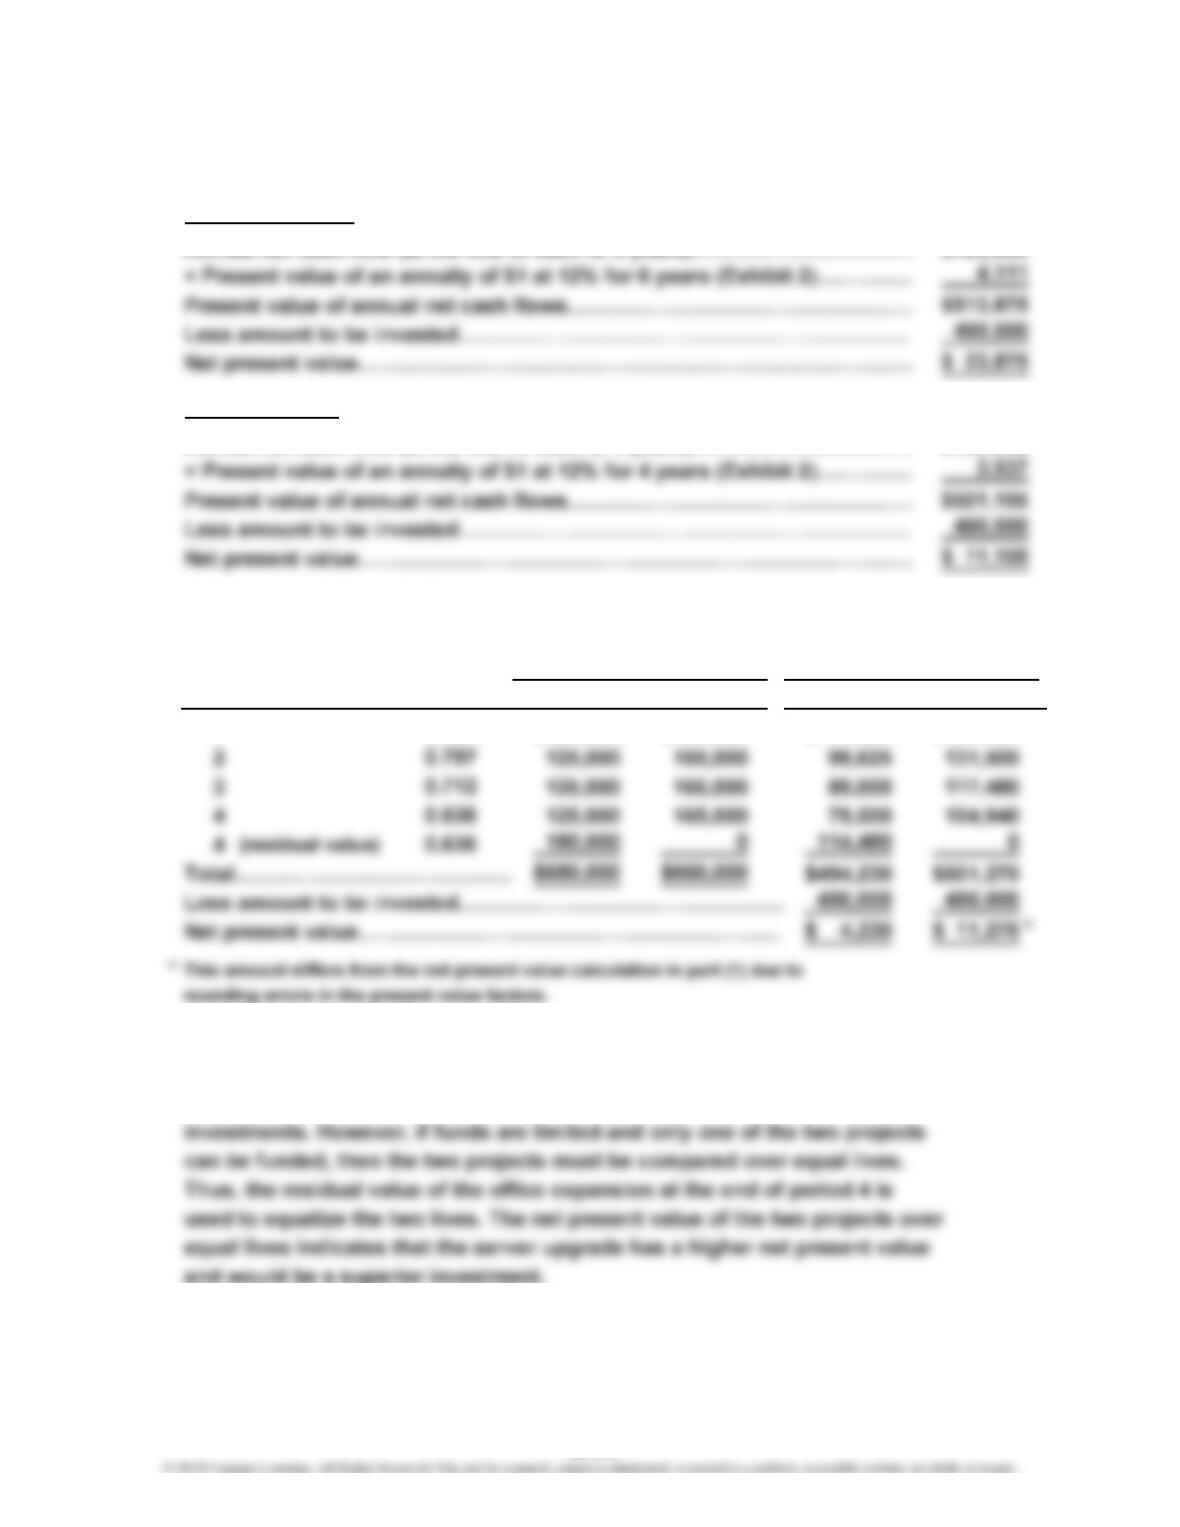
1. Net present value analysis:
Office Expansion:
Annual net cash flow (at the end of each of 6 years)…………………………
…
$125,000
Server Upgrade:
Annual net cash flow (at the end of each of 4 years)…………………………
…
$165,000
2. Net present value analysis:
Expansion Servers Expansion
1 $125,000 $165,000 $111,625 $147,345
3. To: Investment Committee
Both projects have a positive net present value. This means that both
projects meet our minimum expected return of 12% and would be acceptable
Net Cash FlowNet Cash Flow
Present Value of
$1 at 12%
Value of
Present
Servers
Year
0.893
25-24
CHAPTER 25 Capital Investment Analysis
Prob. 25–6A (FIN MAN); Prob. 10–6A (MAN)
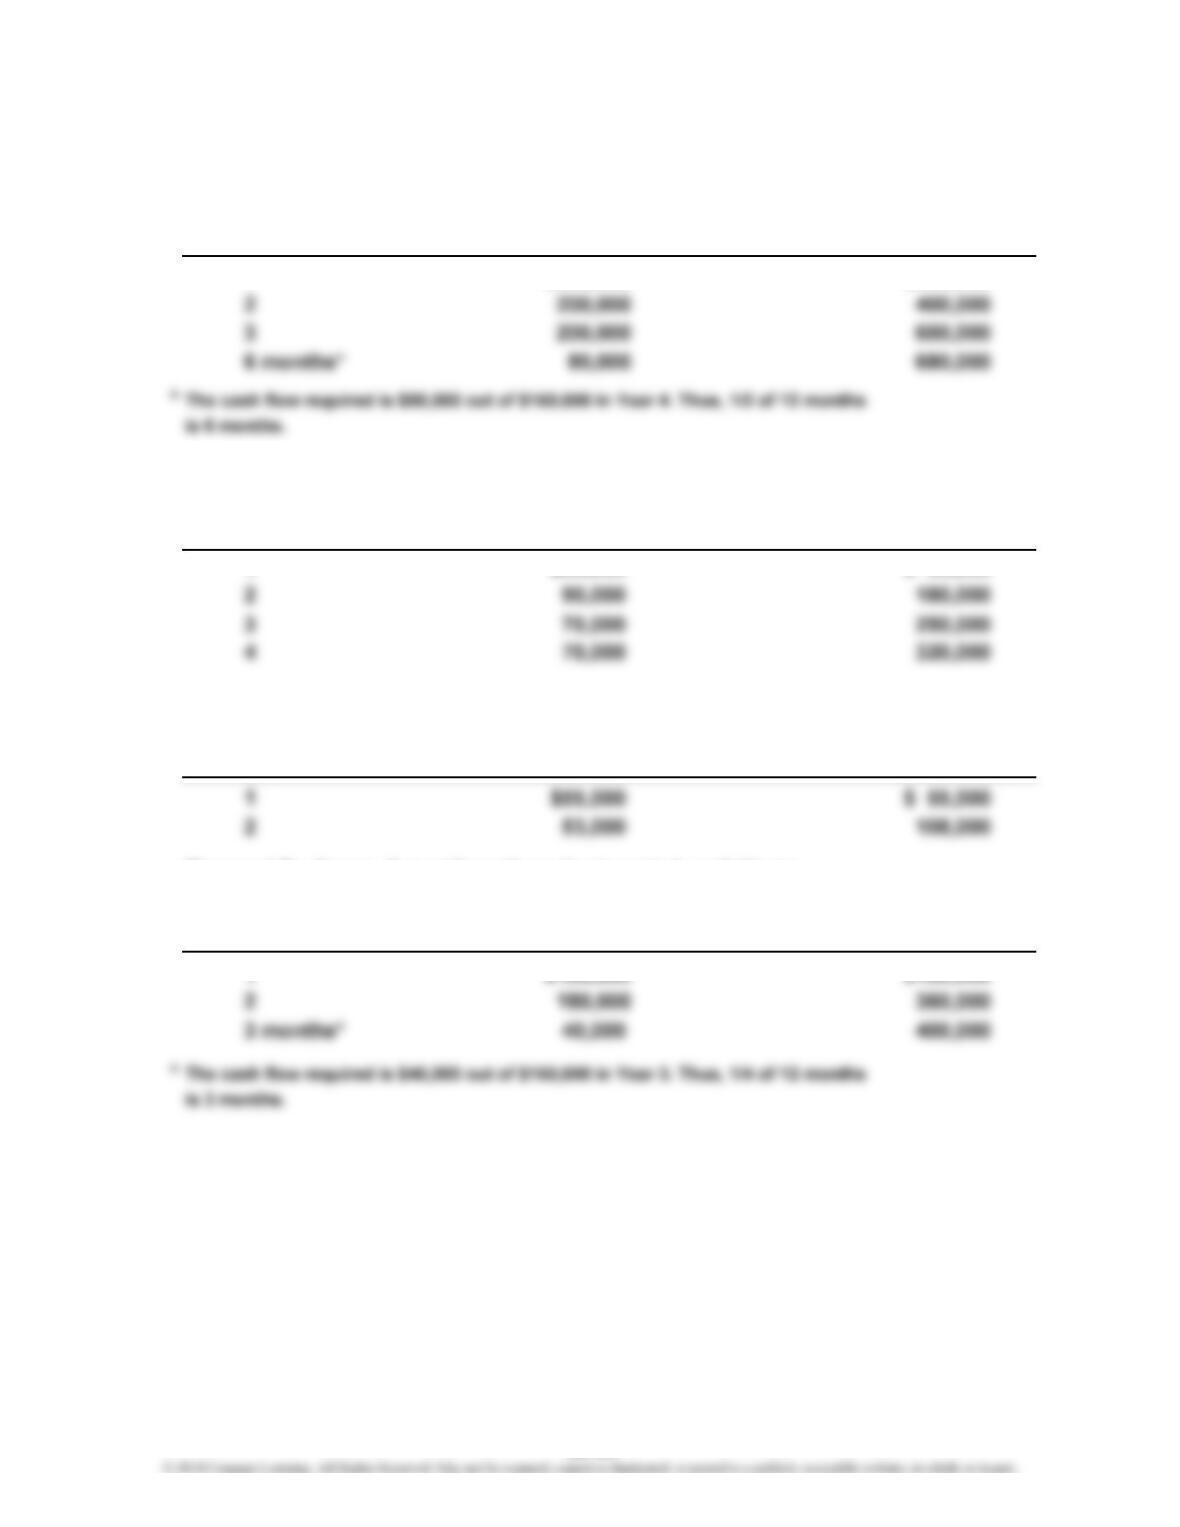
1. Proposal A: 3-year, 6-month cash payback period, as follows:
Net Cash Cumulative
Year Flow Net Cash Flows
1 $200,000 $200,000
Proposal B: 4-year cash payback period, as follows:
Net Cash Cumulative
Year Flow Net Cash Flows
1 $90,000 $ 90,000
Proposal C: 2-year cash payback period, as follows:
Net Cash Cumulative
Year Flow Net Cash Flows
Proposal D: 2-year, 3-month cash payback period, as follows:
Net Cash Cumulative
Year Flow Net Cash Flows
1 $180,000 $180,000
25-25
CHAPTER 25 Capital Investment Analysis
Prob. 25–6A (FIN MAN); Prob. 10–6A (MAN) (Continued)
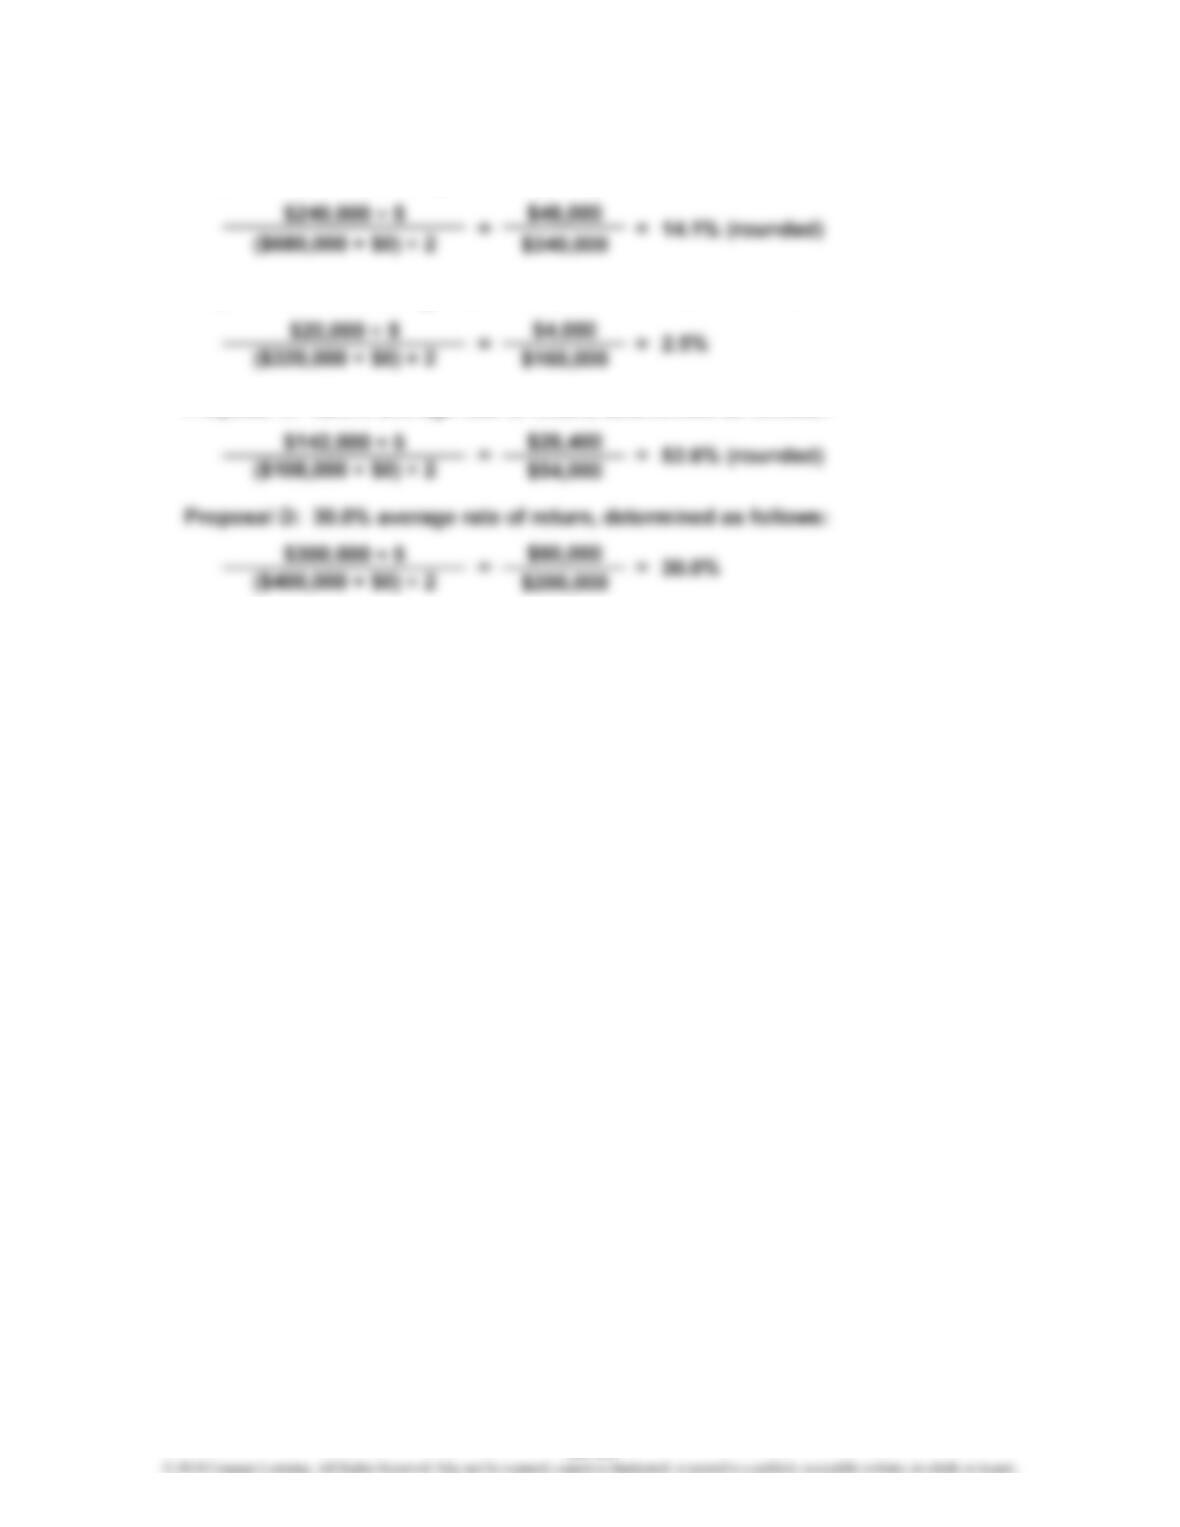
2. Proposal A: 14.1% average rate of return, determined as follows:
Proposal B: 2.5% average rate of return, determined as follows:
Proposal C: 52.6% average rate of return, determined as follows:
25-26
CHAPTER 25 Capital Investment Analysis
Prob. 25–6A (FIN MAN); Prob. 10–6A (MAN) (Continued)
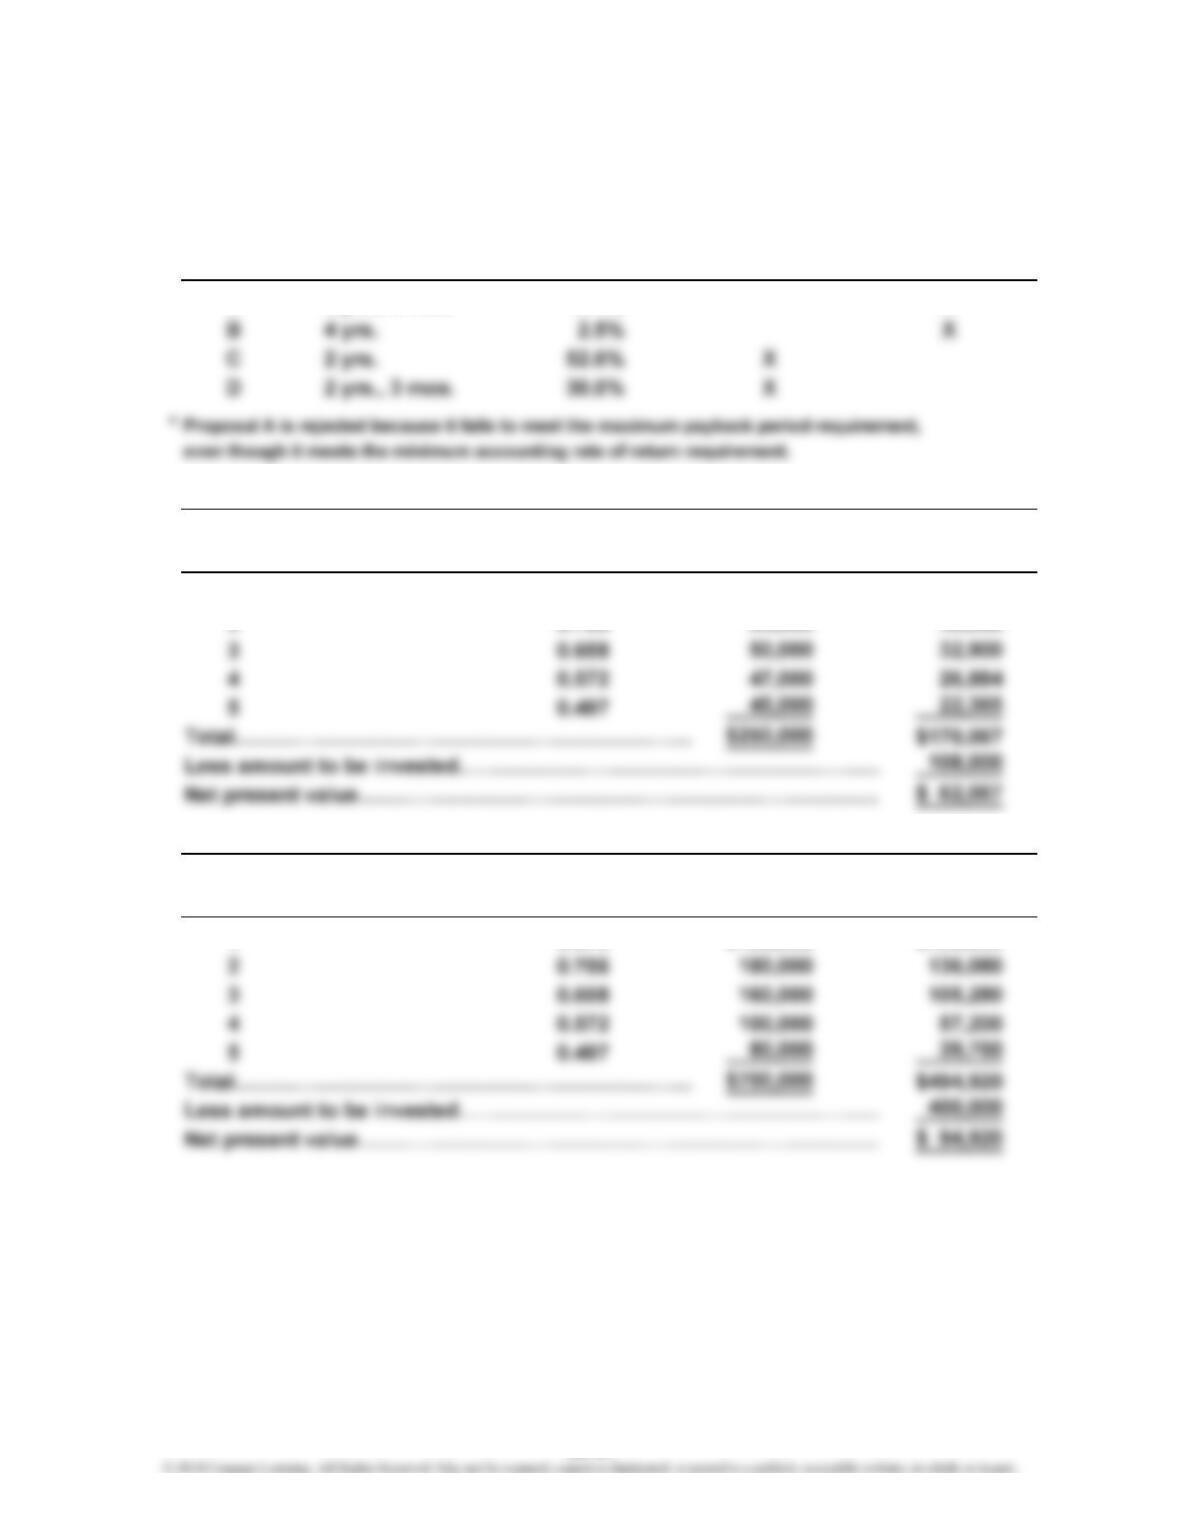
3. Of the four proposed investments, only Proposals C and D meet the company’s
requirements, as the following table indicates:
Cash Payback Average Rate Accept for
Proposal Period of Return Further Analysis Reject
A 3 yrs., 6 mos. 14.1% X*
4.
Present Value Net Cash Present Value of
Year of $1 at 15% Flow Net Cash Flow
1 0.870 $ 55,000 $ 47,850
2 0.756 53,000 40,068
Present Value Net Cash Present Value of
Year of $1 at 15% Flow Net Cash Flow
1 0.870 $180,000 $156,600
Proposal C
Proposal D
25-27
CHAPTER 25 Capital Investment Analysis
Prob. 25–6A (FIN MAN); Prob. 10–6A (MAN) (Concluded)
*Rounded
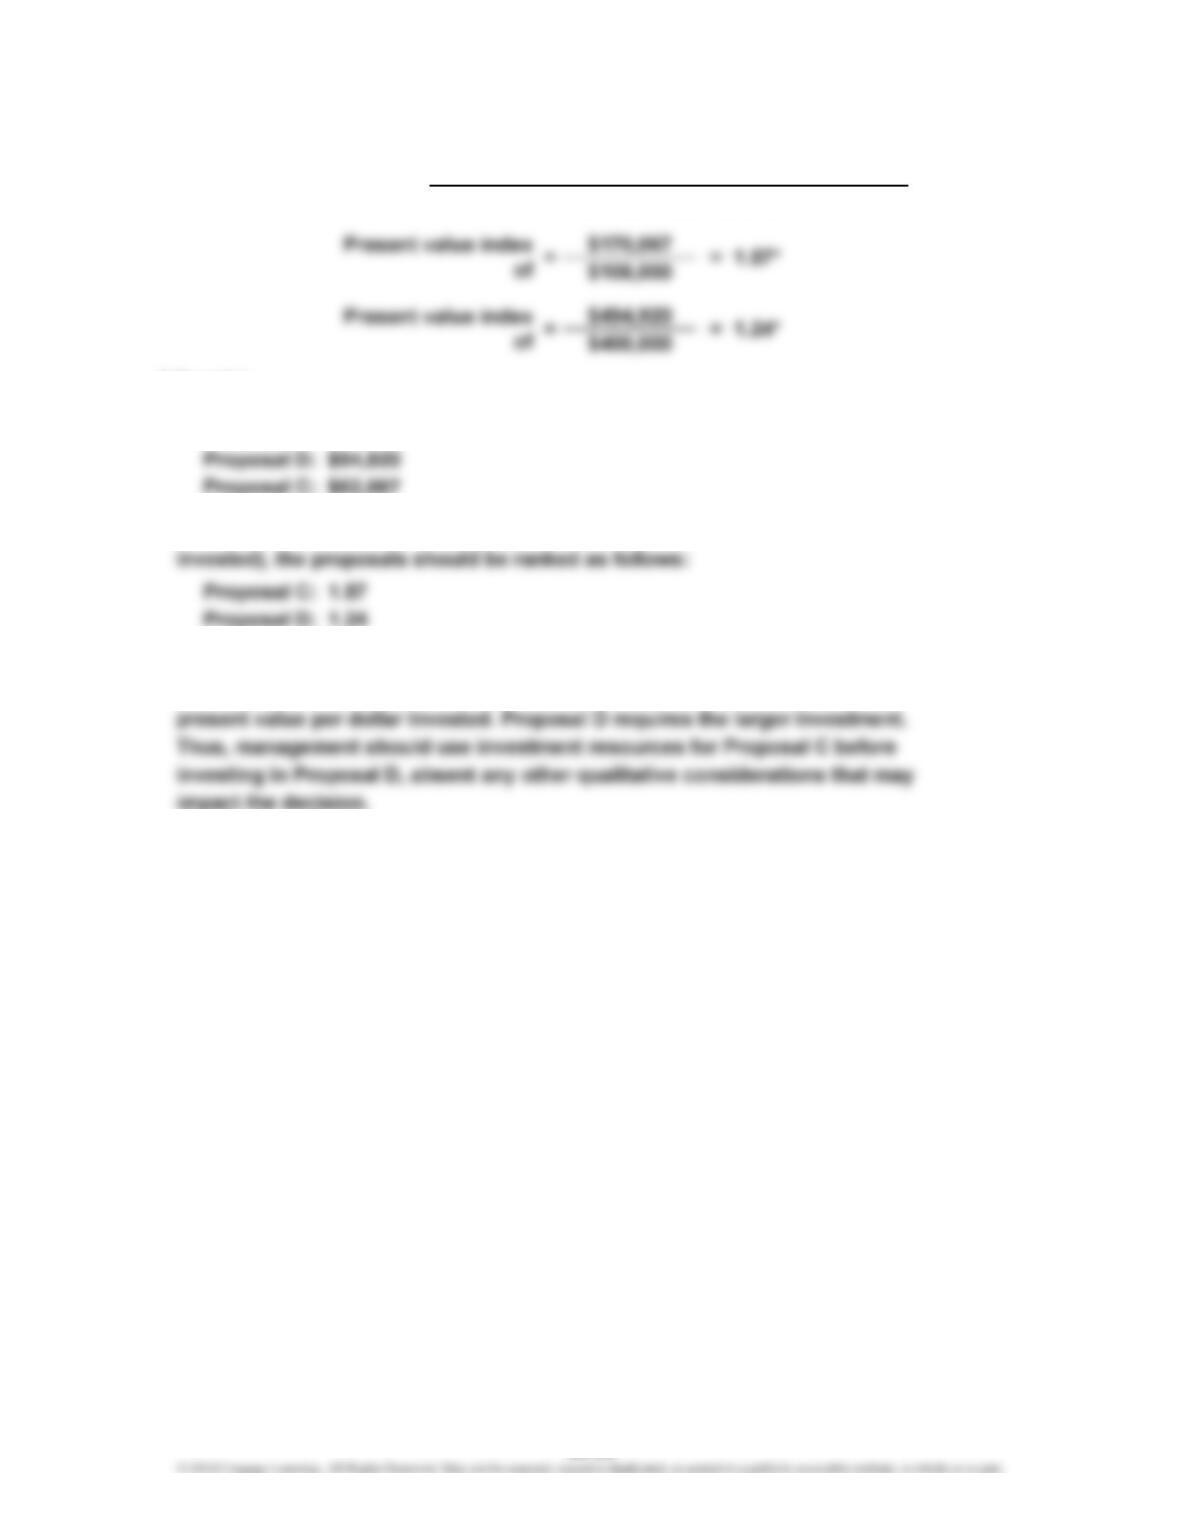
6. Based on the net present value, the proposals should be ranked as follows:
7. Based on the present value index (the amount of present value per dollar
8. The present value indexes indicate that although Proposal D has the larger net
present value, it is not as attractive as Proposal C in terms of the amount of
5.
Present Value Index =
Total Present Value of Net Cash Flow
Amount to Be Invested
25-28
CHAPTER 25 Capital Investment Analysis
Prob. 25–1B (FIN MAN); Prob. 10–1B (MAN)
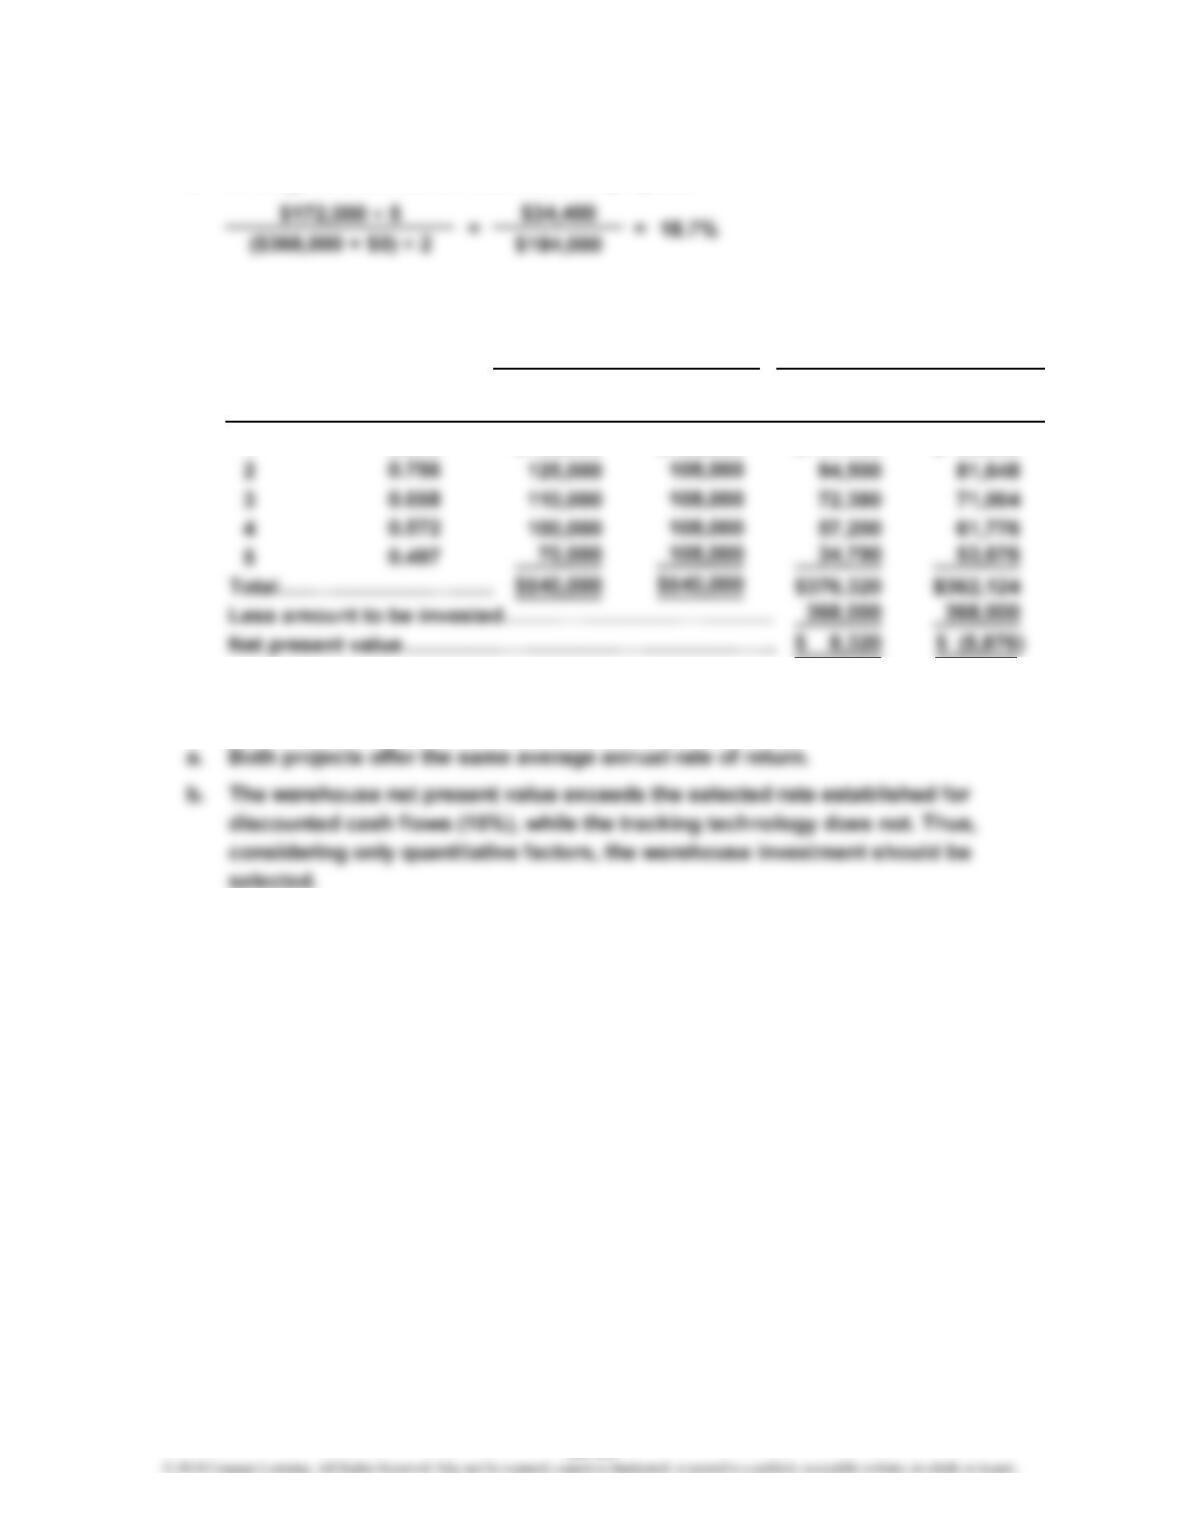
1. a. Average annual rate of return for both projects:
b. Net present value analysis:
Year Warehouse Warehouse
1 $135,000 $117,450 $ 93,960
2. The report to the capital investment committee can take many forms. The
report should, as a minimum, present the following points:
$1 at 15%
Value of
Present
0.870 $108,000
Present Value of
Tracking
Technology
Net Cash FlowNet Cash Flow
Technology
Tracking
25-29
CHAPTER 25 Capital Investment Analysis
Prob. 25–2B (FIN MAN); Prob. 10–2B (MAN)
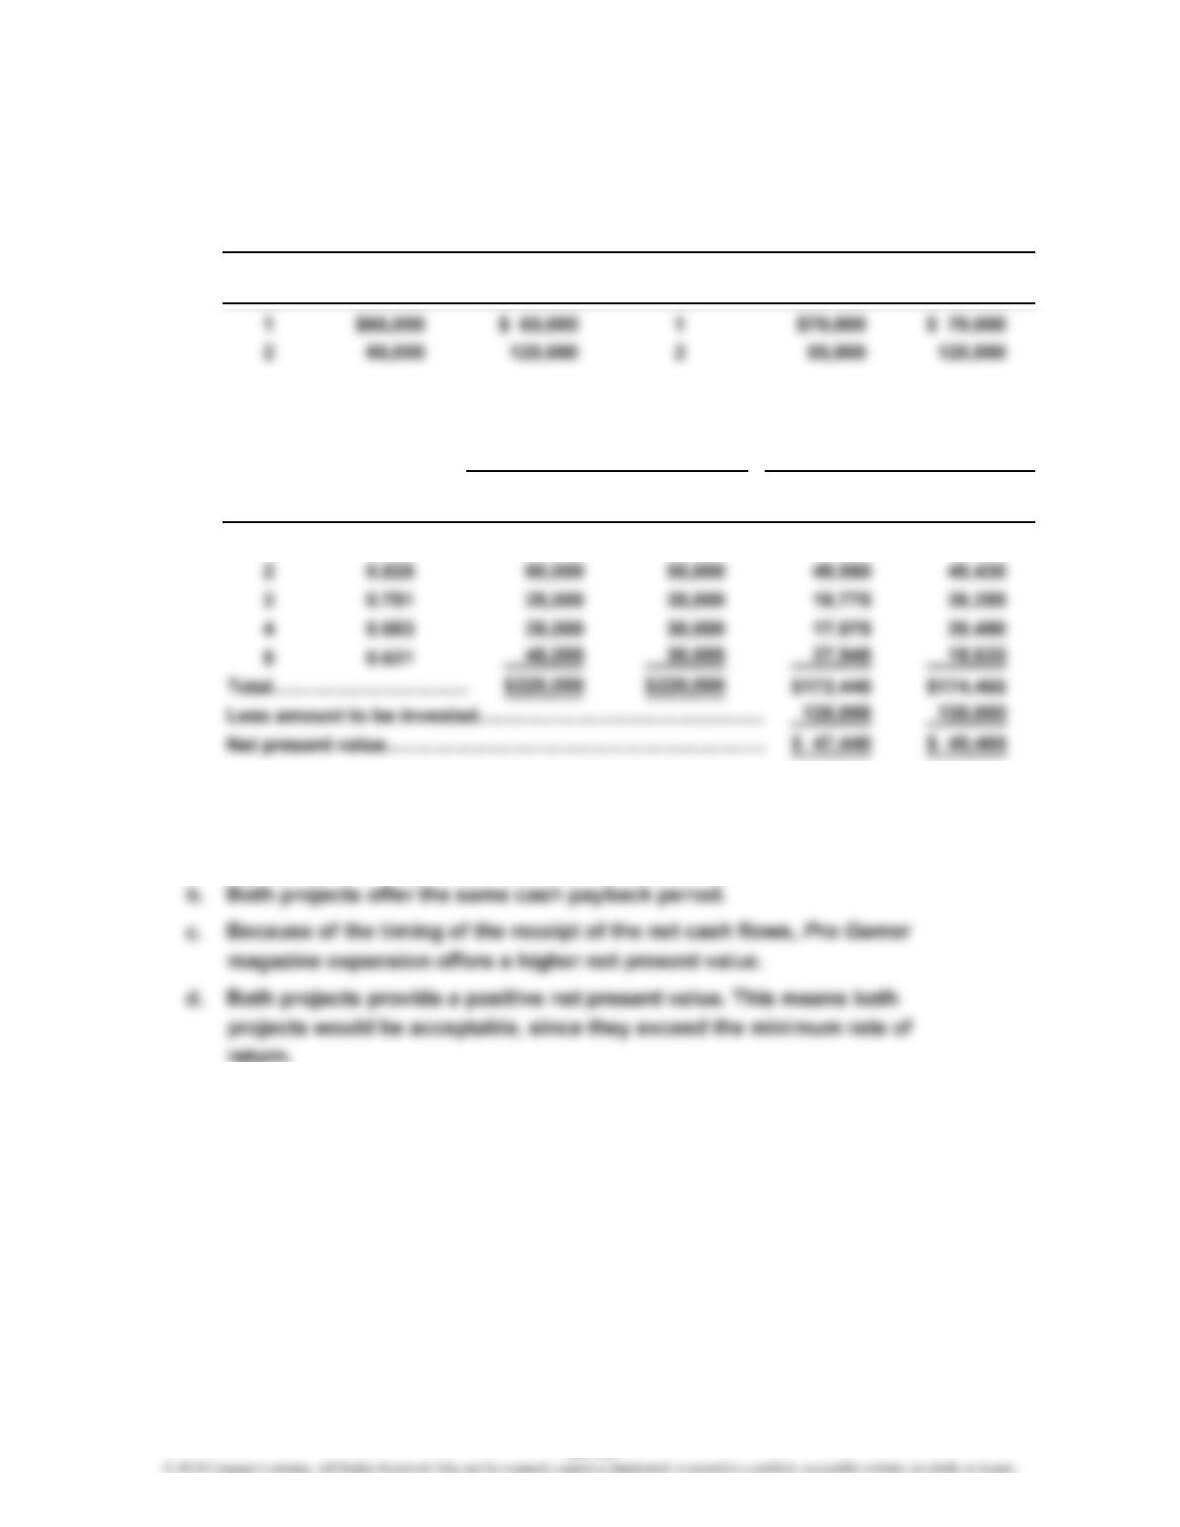
1. a. Cash payback period for both projects: 2 years (the year in which
accumulated net cash flows equal $125,000), shown as follows:
Net Cash Cumulative Net Cash Cumulative
Year Flow Net Cash Flow Year Flow Net Cash Flow
b. Net present value analysis:
Present
Value of Sound Pro Sound Pro
Year $1 at 10% Cellar Gamer Cellar Gamer
1 0.909 $ 65,000 $ 70,000 $ 59,085 $ 63,630
2. The report can take many forms and should include, as a minimum, the
following points:
a. Both projects offer the same total net cash flow.
Sound Cellar
Net Cash FlowNet Cash Flow
Present Value of
Pro Gamer
25-30
CHAPTER 25 Capital Investment Analysis
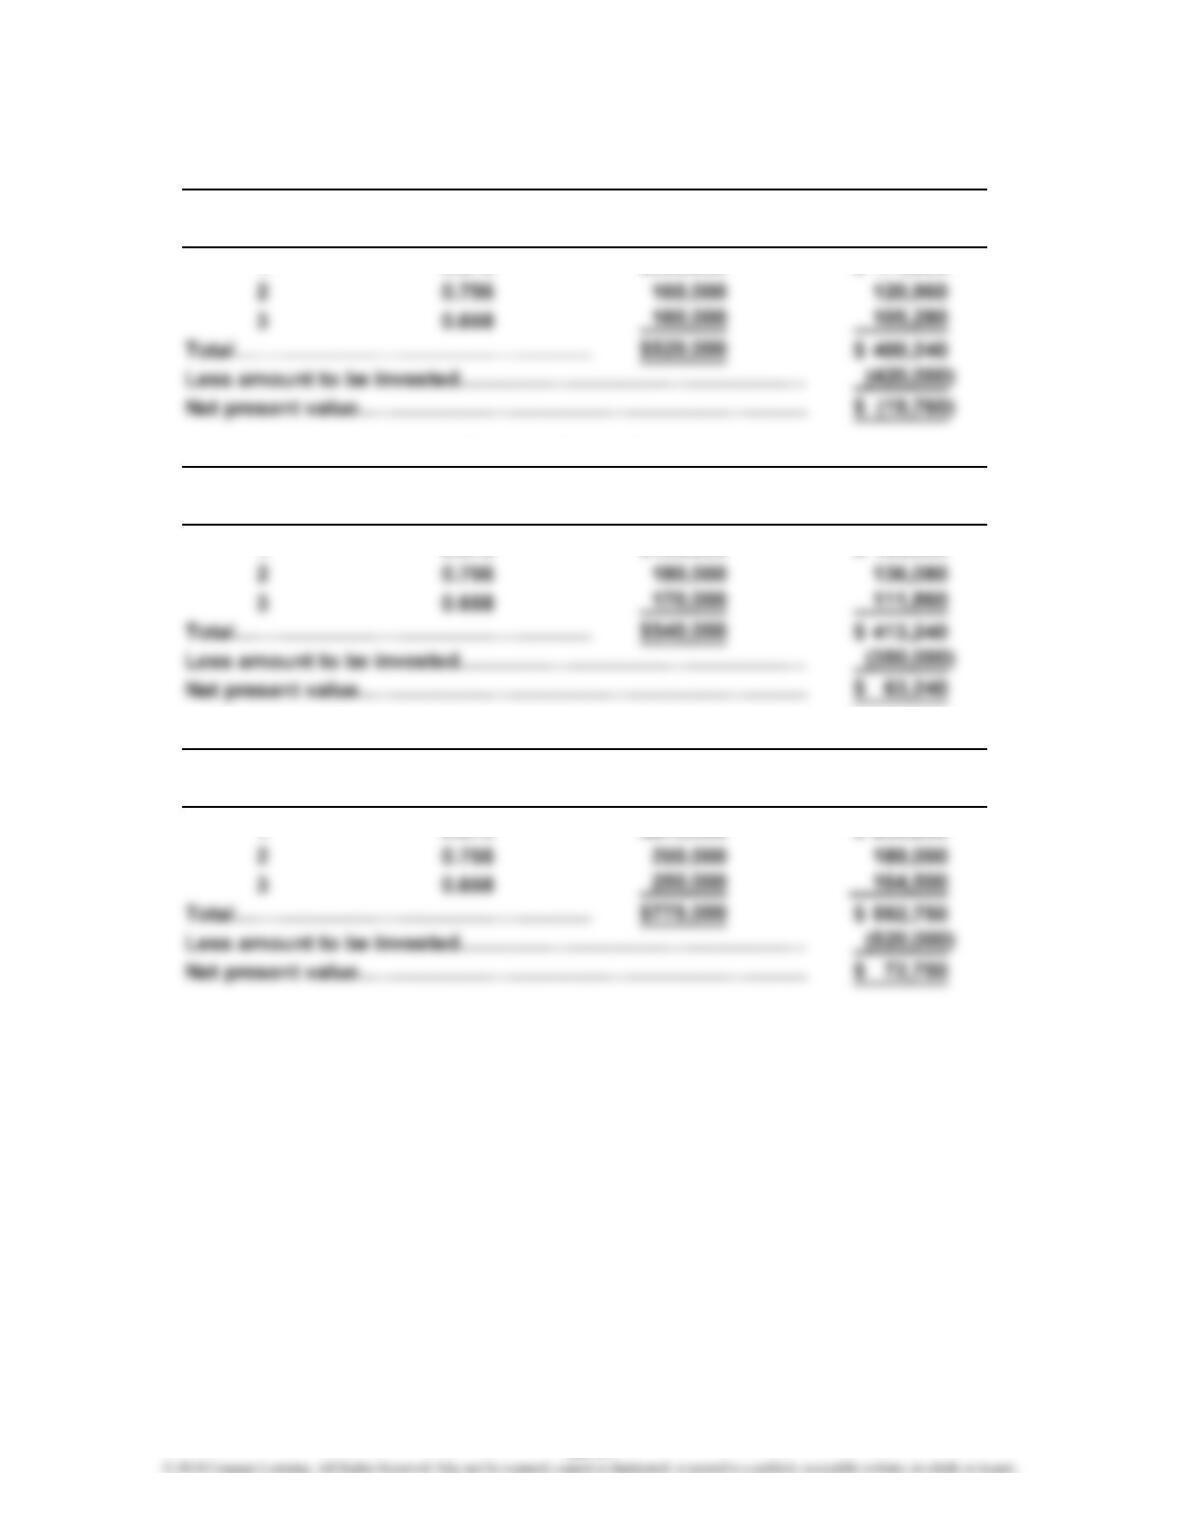
Prob. 25–3B (FIN MAN); Prob. 10–3B (MAN)
1.
Present Value Net Cash Present Value of
Year of $1 at 15% Flow Net Cash Flow
1 0.870 $200,000 $ 174,000
Present Value Net Cash Present Value of
Year of $1 at 15% Flow Net Cash Flow
1 0.870 $190,000 $ 165,300
Present Value Net Cash Present Value of
Year of $1 at 15% Flow Net Cash Flow
1 0.870 $275,000 $ 239,250
Computer System Upgrade
ATM Kiosk Expansion
Branch Office Expansion
25-31
CHAPTER 25 Capital Investment Analysis
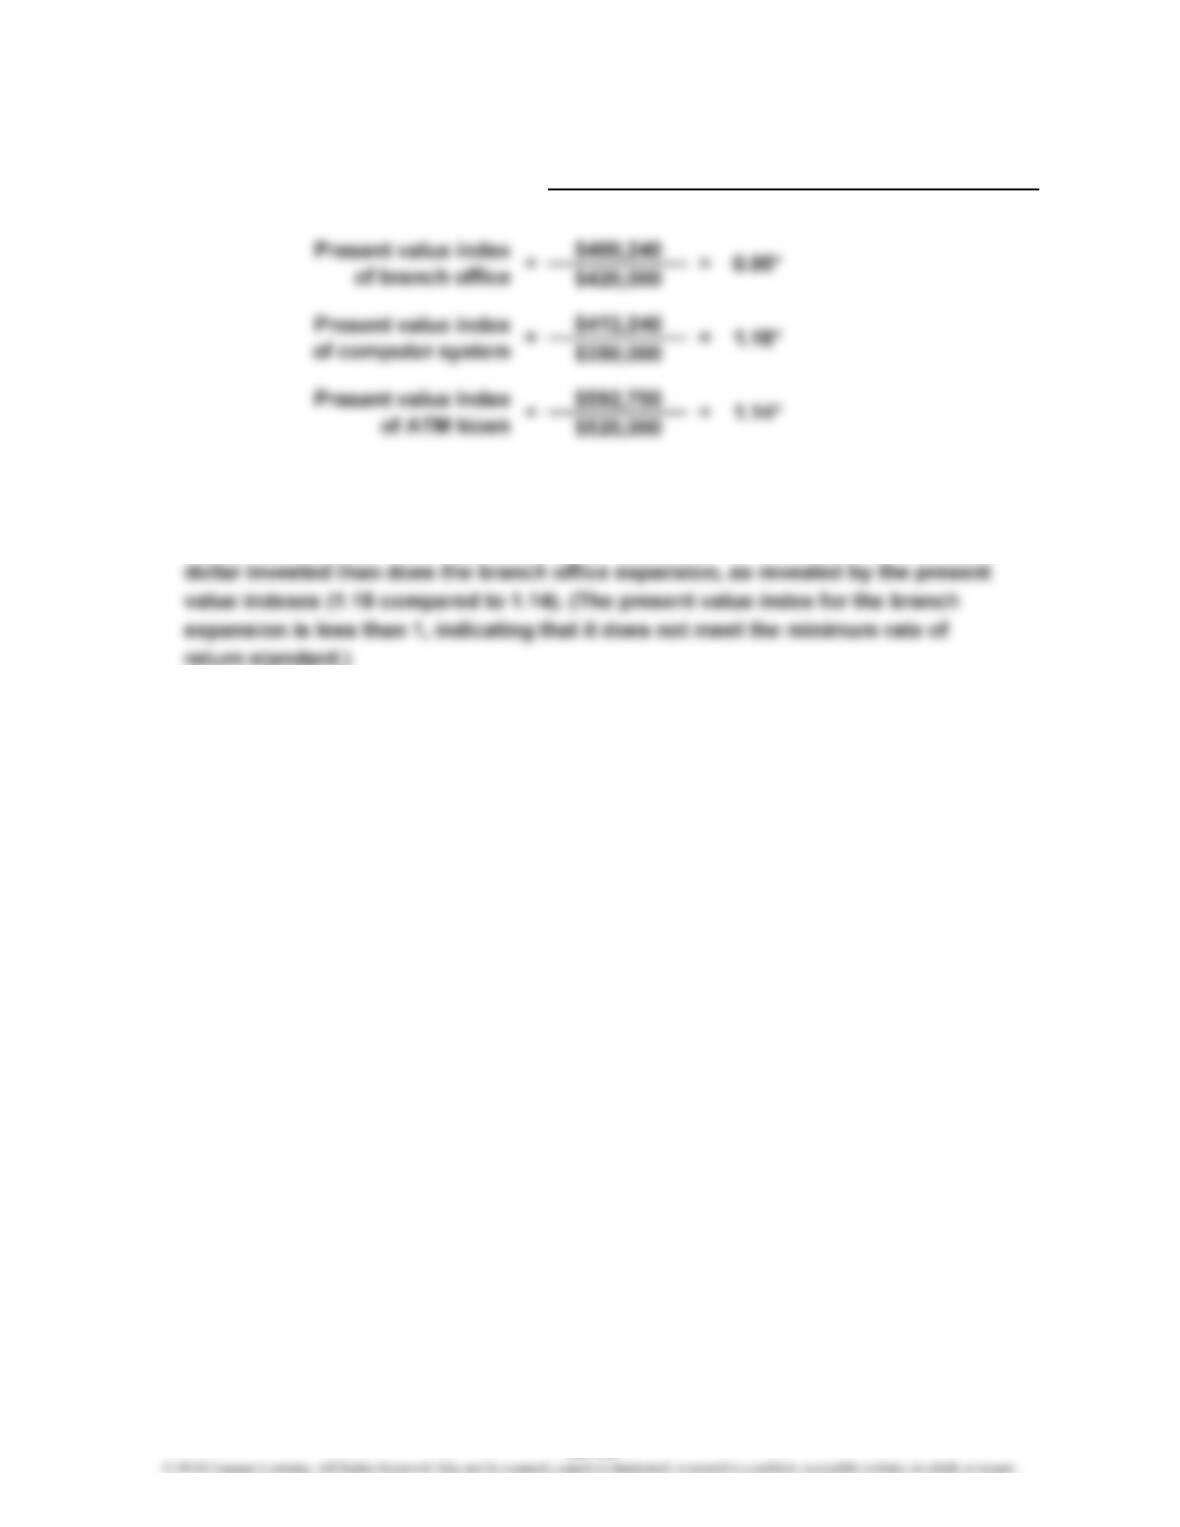
Prob. 25–3B (FIN MAN); Prob. 10–3B (MAN) (Concluded)
*Rounded
3. The computer system upgrade has the largest present value index. Although the ATM
kiosk expansion has the largest net present value, it returns less present value per
Present Value Index = Total Present Value of Net Cash Flow
Amount to Be Invested
2.
25-32


