Chapter 16
Financial Statement Analysis
Solutions to Questions
16-1 Horizontal analysis examines how a
particular item on a financial statement such as
sales or cost of goods sold behaves over time.
Vertical analysis involves analysis of items on an
income statement or balance sheet for a single
period. In vertical analysis of the income
statement, all items are typically stated as a
percentage of sales. In vertical analysis of the
balance sheet, all items are typically stated as a
percentage of total assets.
16-2 By looking at trends, an analyst hopes
to get some idea of whether a situation is
improving, remaining the same, or deteriorating.
Such analyses can provide insight into what is
likely to happen in the future. Rather than
looking at trends, an analyst may compare one
company to another or to industry averages
using common-size financial statements.
16-6 Financial leverage results from
borrowing funds at an interest rate that differs
from the rate of return on assets acquired using
those funds. If the rate of return on the assets is
higher than the interest rate at which the funds
were borrowed, financial leverage is positive and
stockholders gain. If the return on the assets is
lower than the interest rate, financial leverage is
negative and the stockholders lose.
16-7 If the company experiences big
variations in net cash flows from operations,
stockholders might be pleased that the company
has no debt. In hard times, interest payments
might be very difficult to meet.
On the other hand, if investments within
the company can earn a rate of return that
exceeds the interest rate on debt, stockholders
would get the benefits of positive leverage if the
The Foundational 15
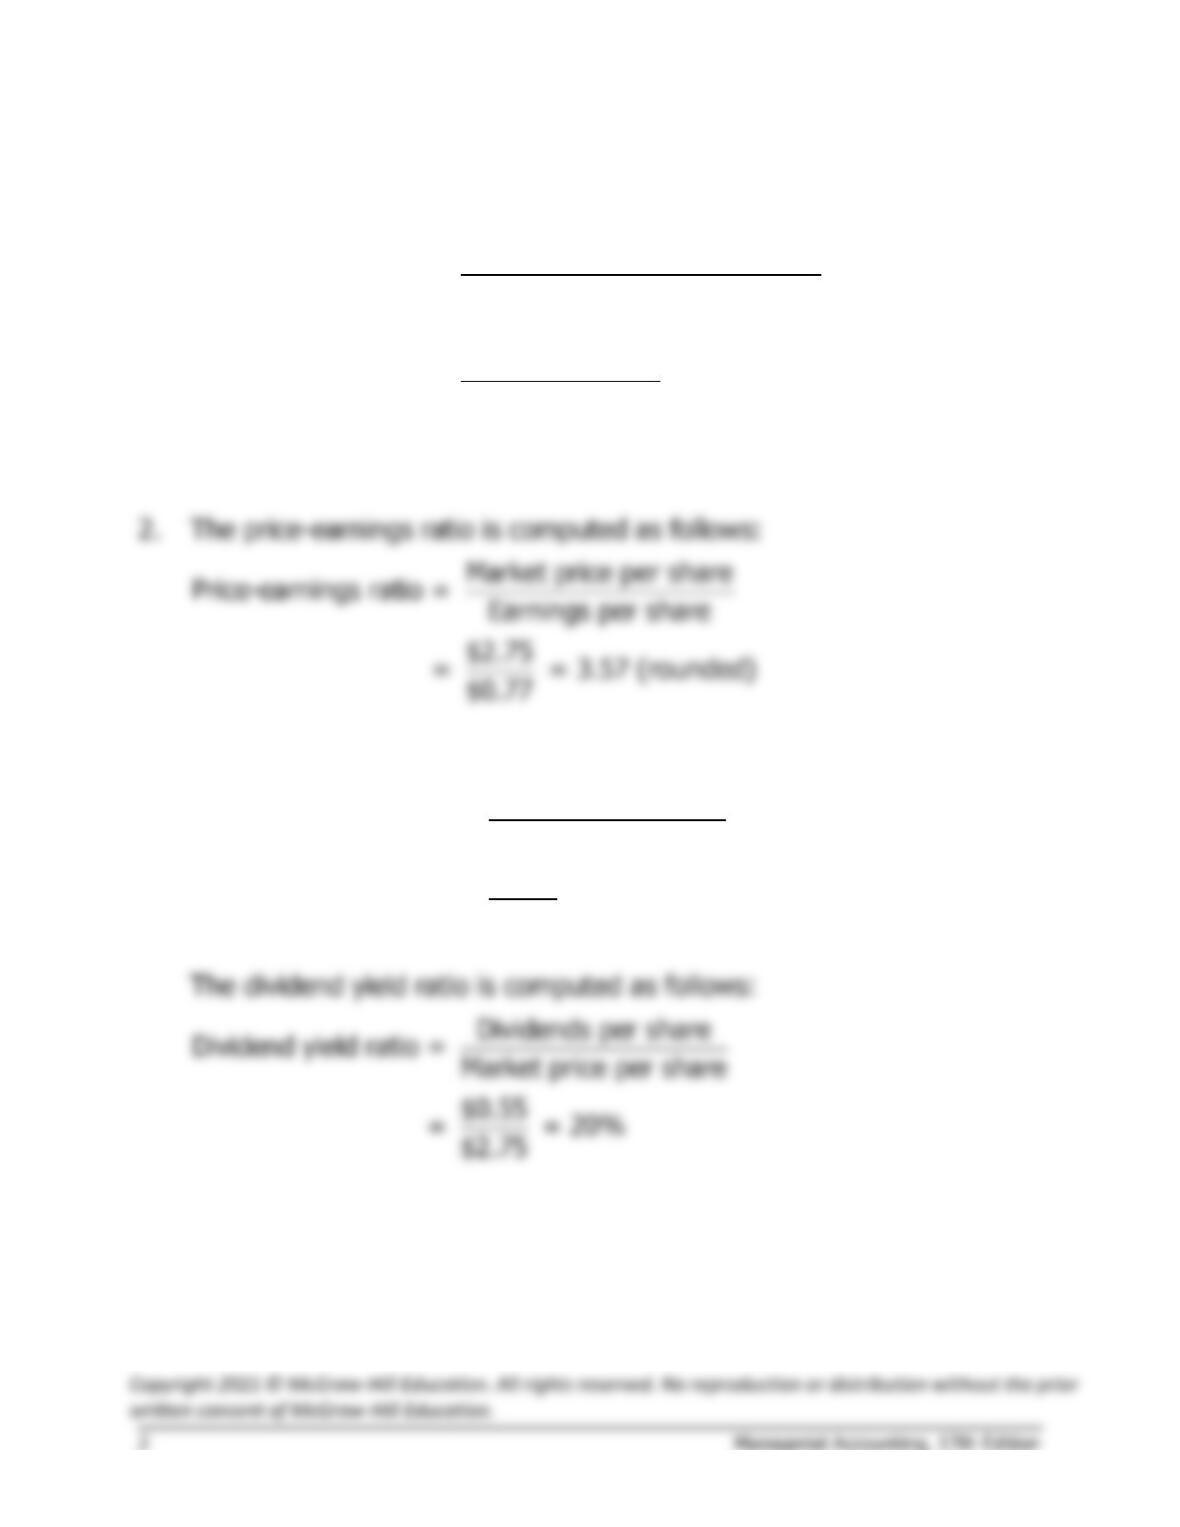
1. The earnings per share is computed as follows:
Net income
Earnings per share =
Average number of common
shares outstanding
$92,400
= = $0.77 per share
120,000 shares*
* $120,000 ÷ $1 par value per share = 120,000 shares
3. The dividend payout ratio is computed as follows:
Dividends per share
Dividend payout ratio =
Earnings per share
$0.55
= = 71% (rounded)
$0.77
The Foundational 15 (continued)
4. The return on total assets is computed as follows:
( )
Net income +
[Interest expense × (1 – Tax rate)]
Return on total assets = Average total assets
$92,400 + [$8,000 × (1 – 0.30)]
= =21.5% rounded
$450,000 + $460,000 /2
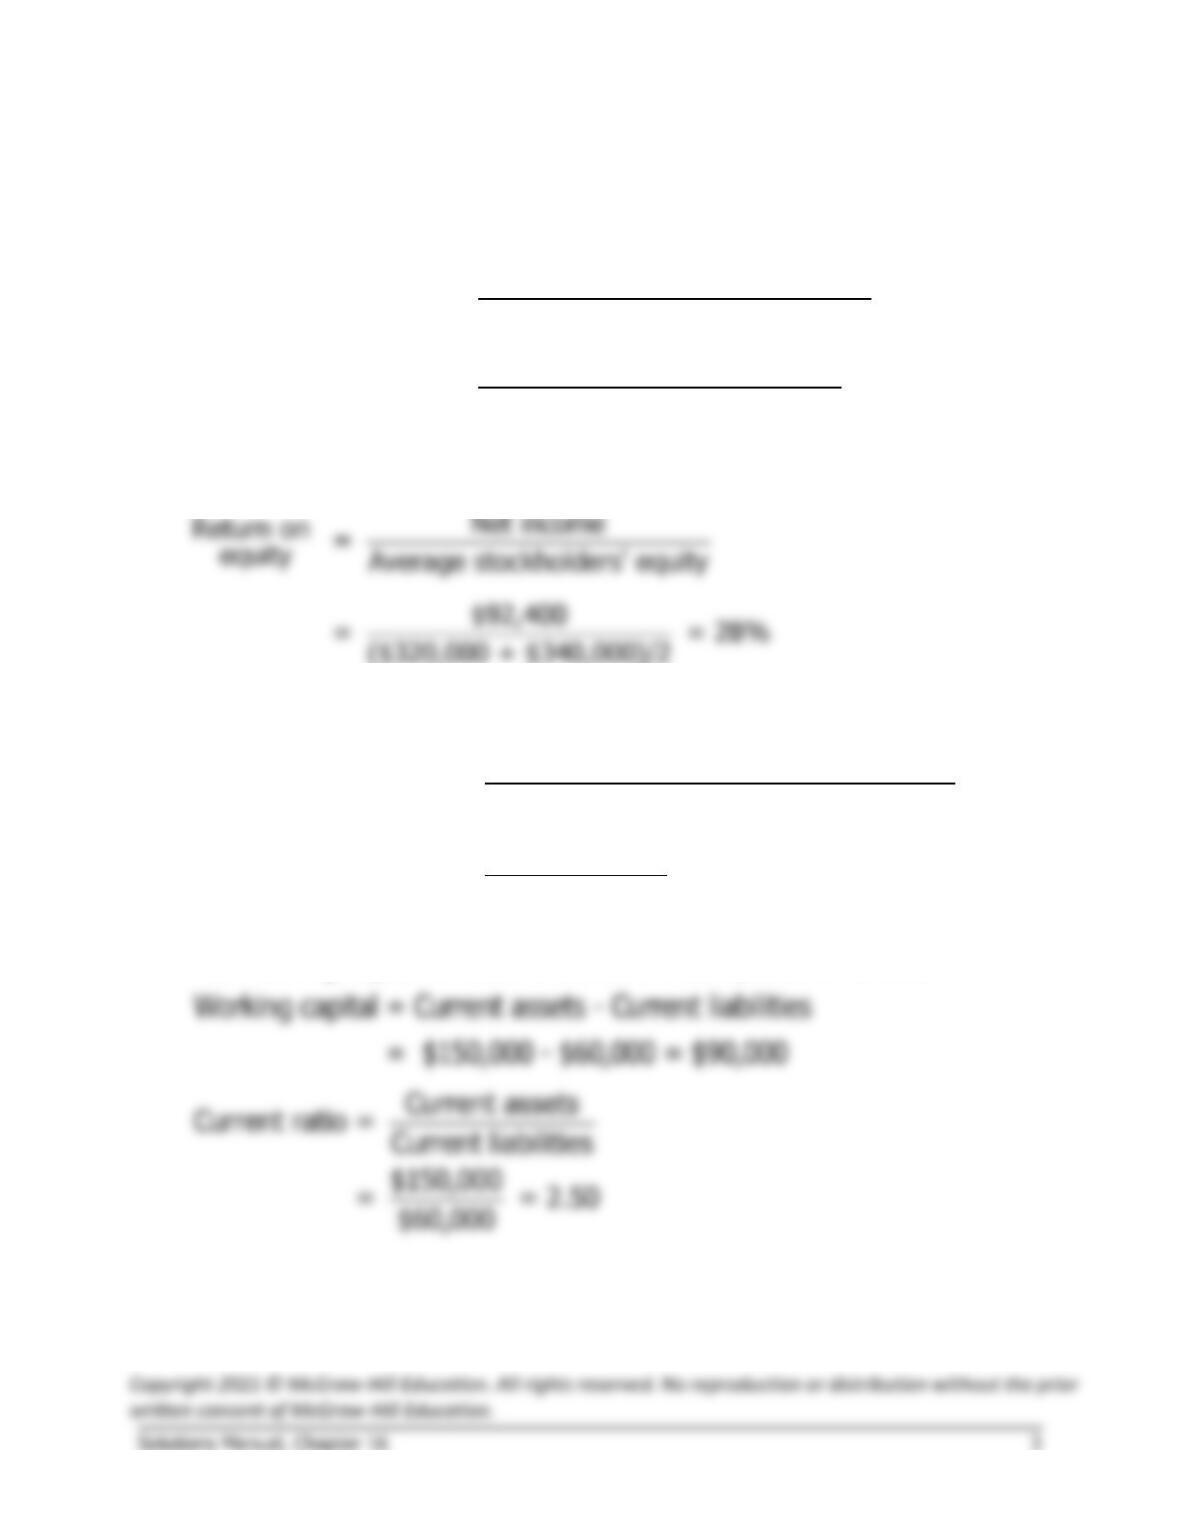
5. The return on equity is computed as follows:
6. The book value per share is computed as follows:
Total stockholders’ equity
Book value per share = Number of common shares outstanding
$320,000
= = $2.67 per share (rounded)
120,000 shares
7. The working capital and current ratio are computed as follows:
The Foundational 15 (continued)
8. The acid-test ratio is computed as follows:
Cash + Marketable securities
+ Accounts receivable
Acid-test ratio = Current liabilities
$35,000 + $0 + $60,000
= = 1.58 (rounded)
$60,000
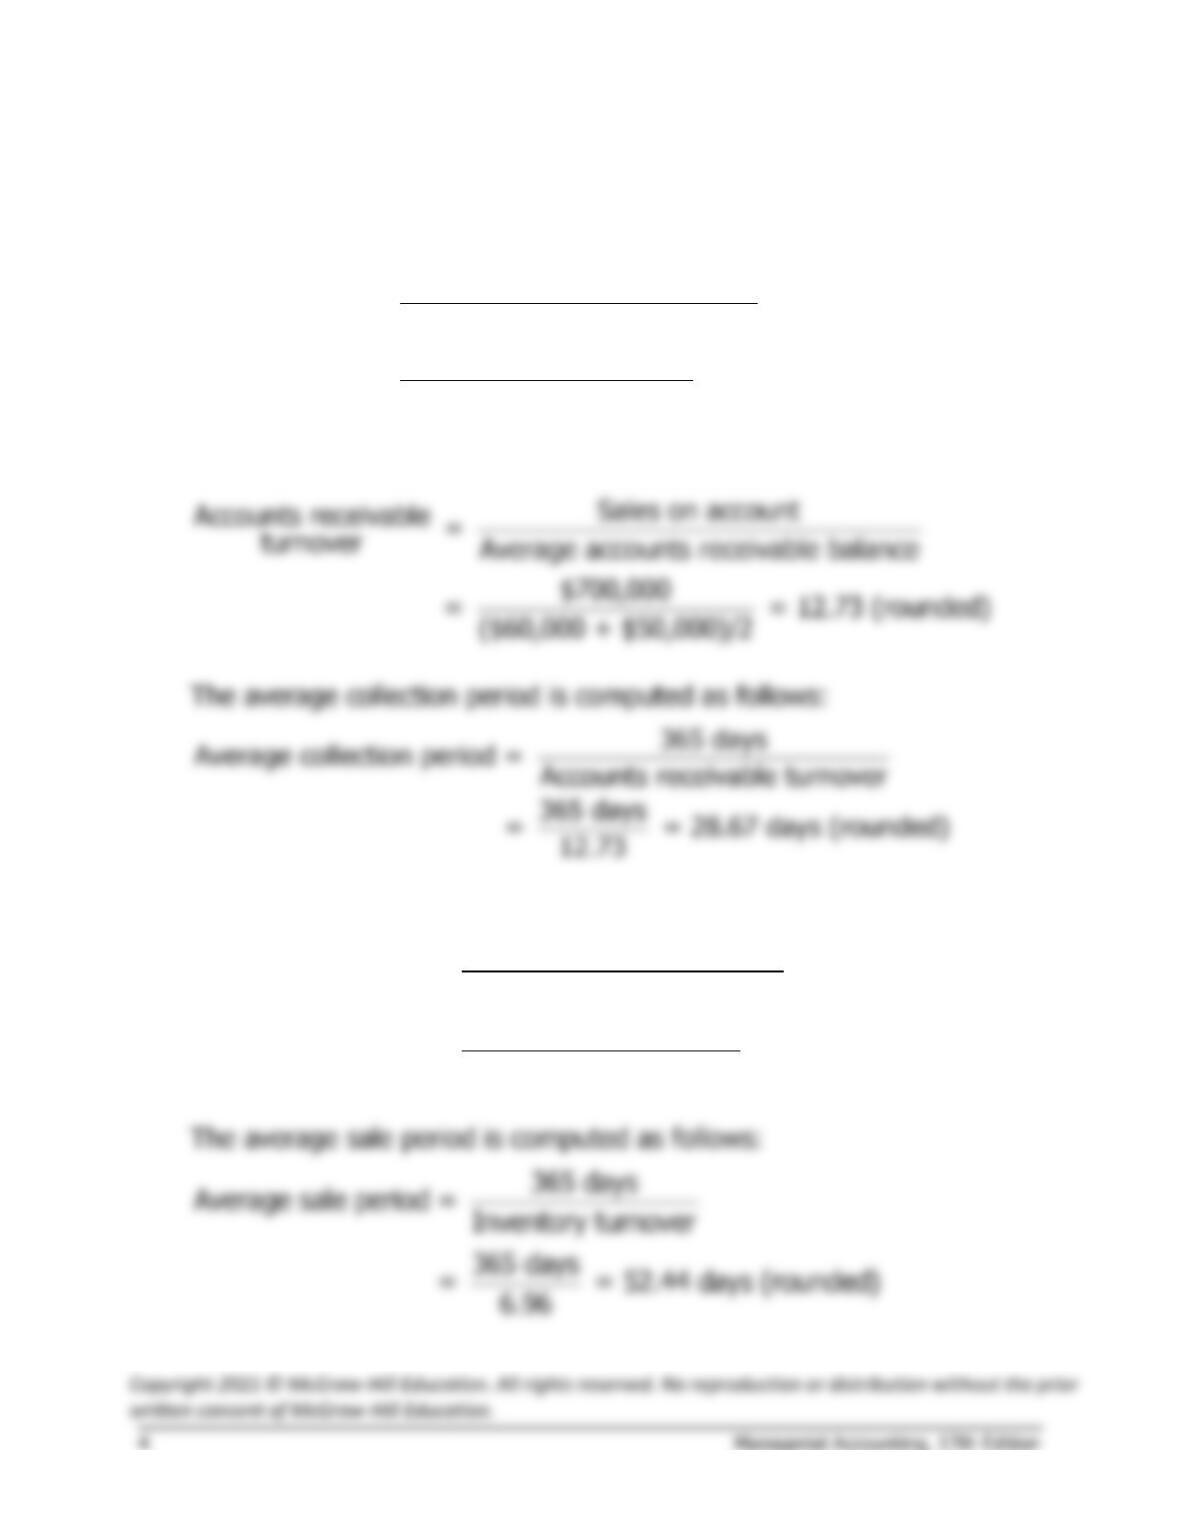
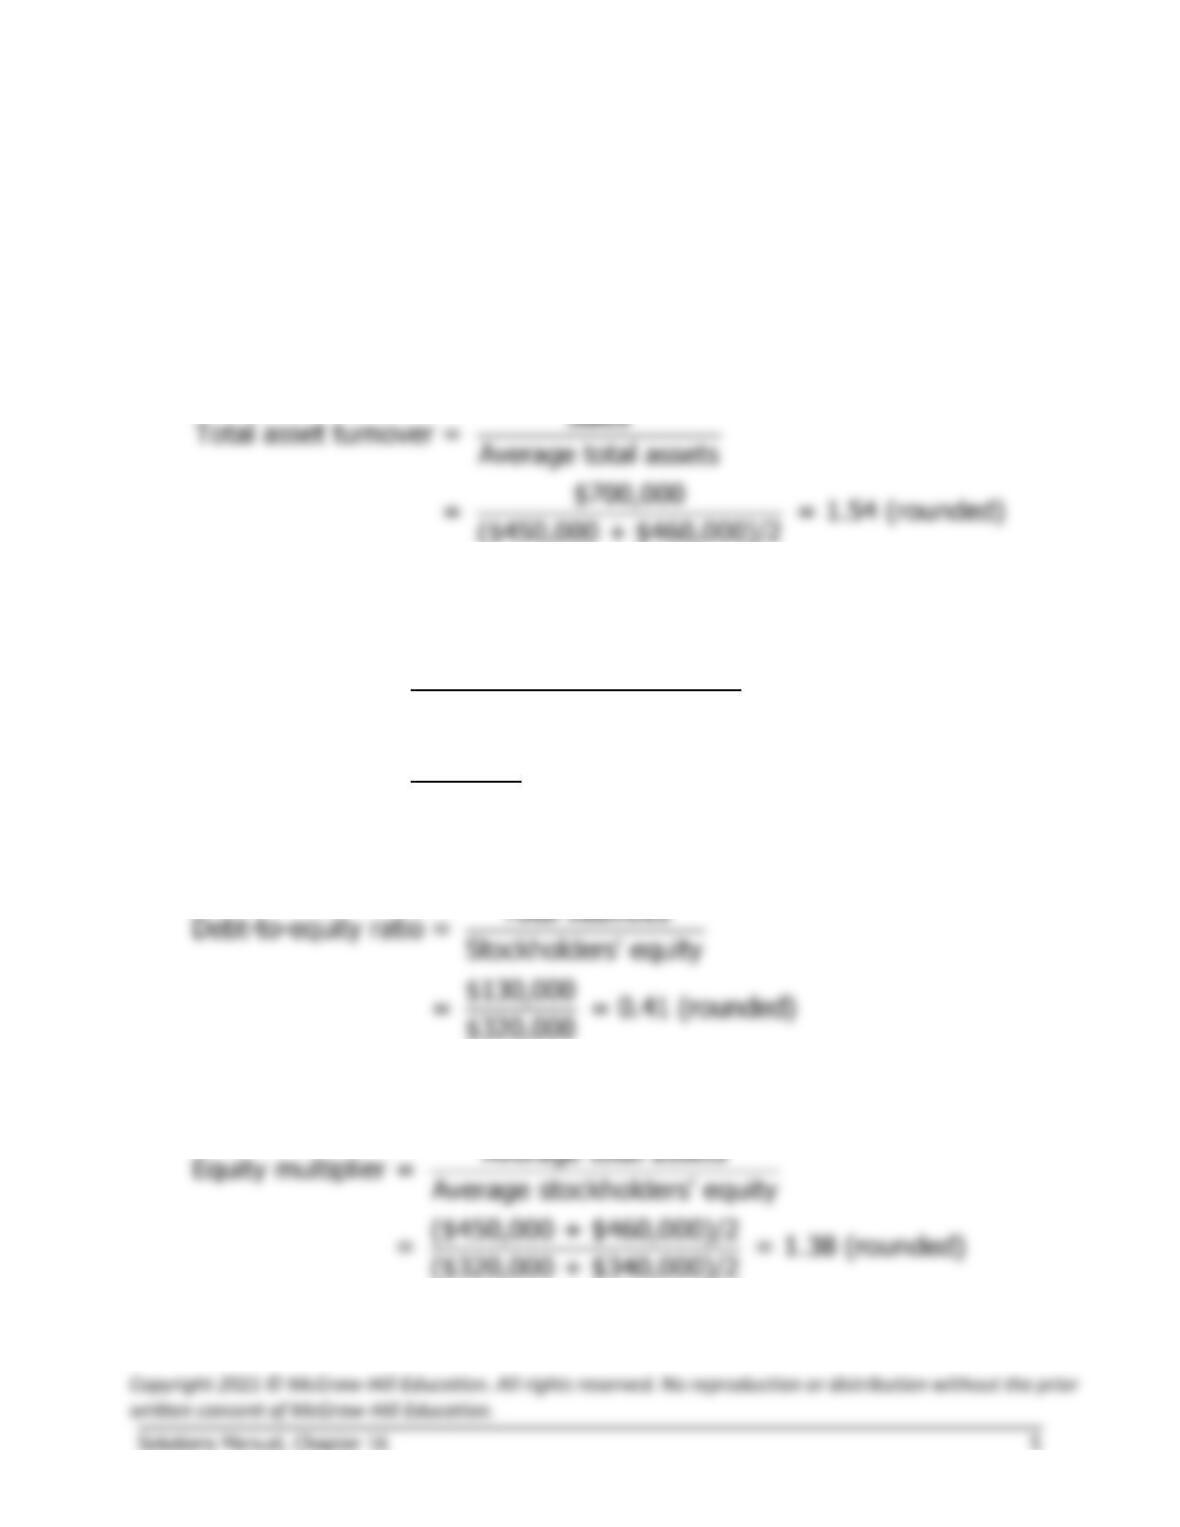
9. The accounts receivable turnover is calculated as follows:
10. The inventory turnover is computed as follows:
Cost of goods sold
Inventory turnover = Average inventory balance
$400,000
= = 6.96 (rounded)
($55,000 + $60,000)/2
The Foundational 15 (continued)
11. The operating cycle is computed as follows:
Operating cycle = Average sale period + Average collection period
= 52.44 days + 28.67 days = 81.11 days
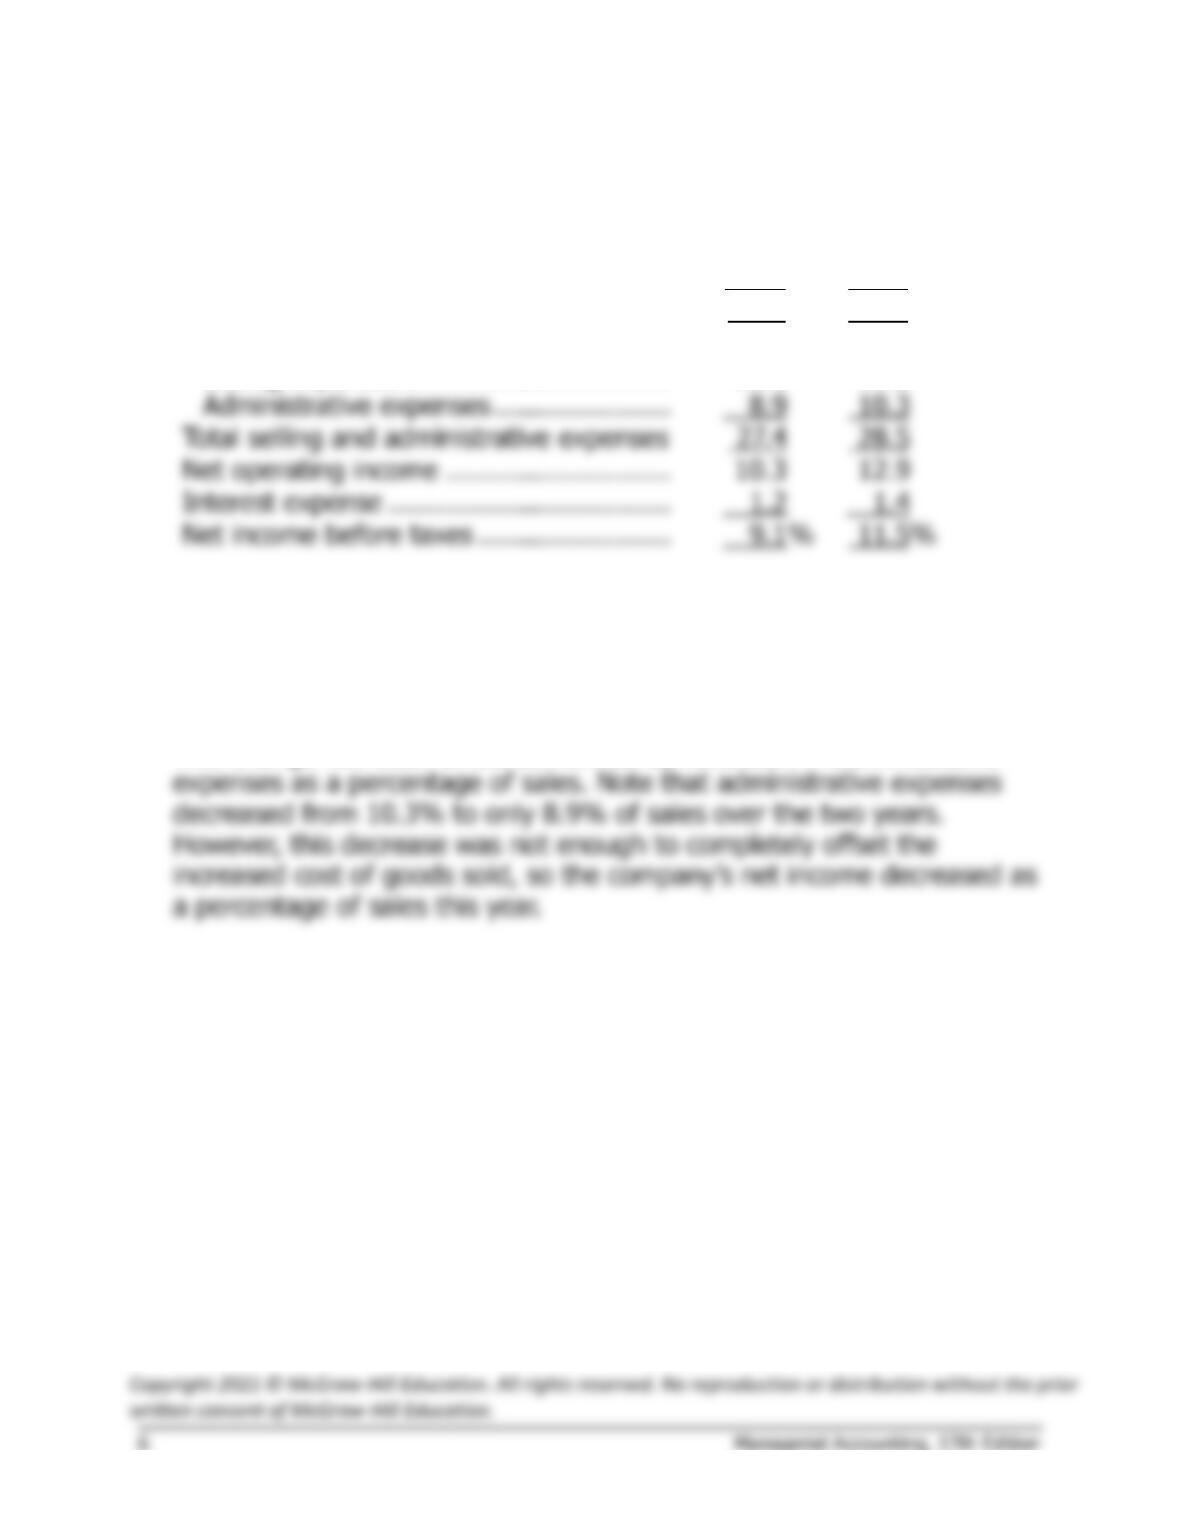
12. The total asset turnover is computed as follows:
13. The times interest earned ratio is computed as follows:
Earnings before interest
expense and income taxes
Times interest =
earned ratio Interest expense
$140,000
= = 17.5
$8,000
14. The debt–to-equity ratio is computed as follows:
15. The equity multiplier is computed as follows:
Exercise 16-1 (15 minutes)
1.
This Year
Last Year
Sales …………………………………………….
100.0
%
100.0
%
Cost of goods sold …………………………...
62.3
58.6
Gross margin…………………………………..
37.7
41.4
Selling and administrative expenses:
Selling expenses …………………………...
18.5
18.2
Administrative expenses ………………….
10.3
Total selling and administrative expenses
28.5
Interest expense ……………………………..
Net income before taxes ……………………
%
11.5
%
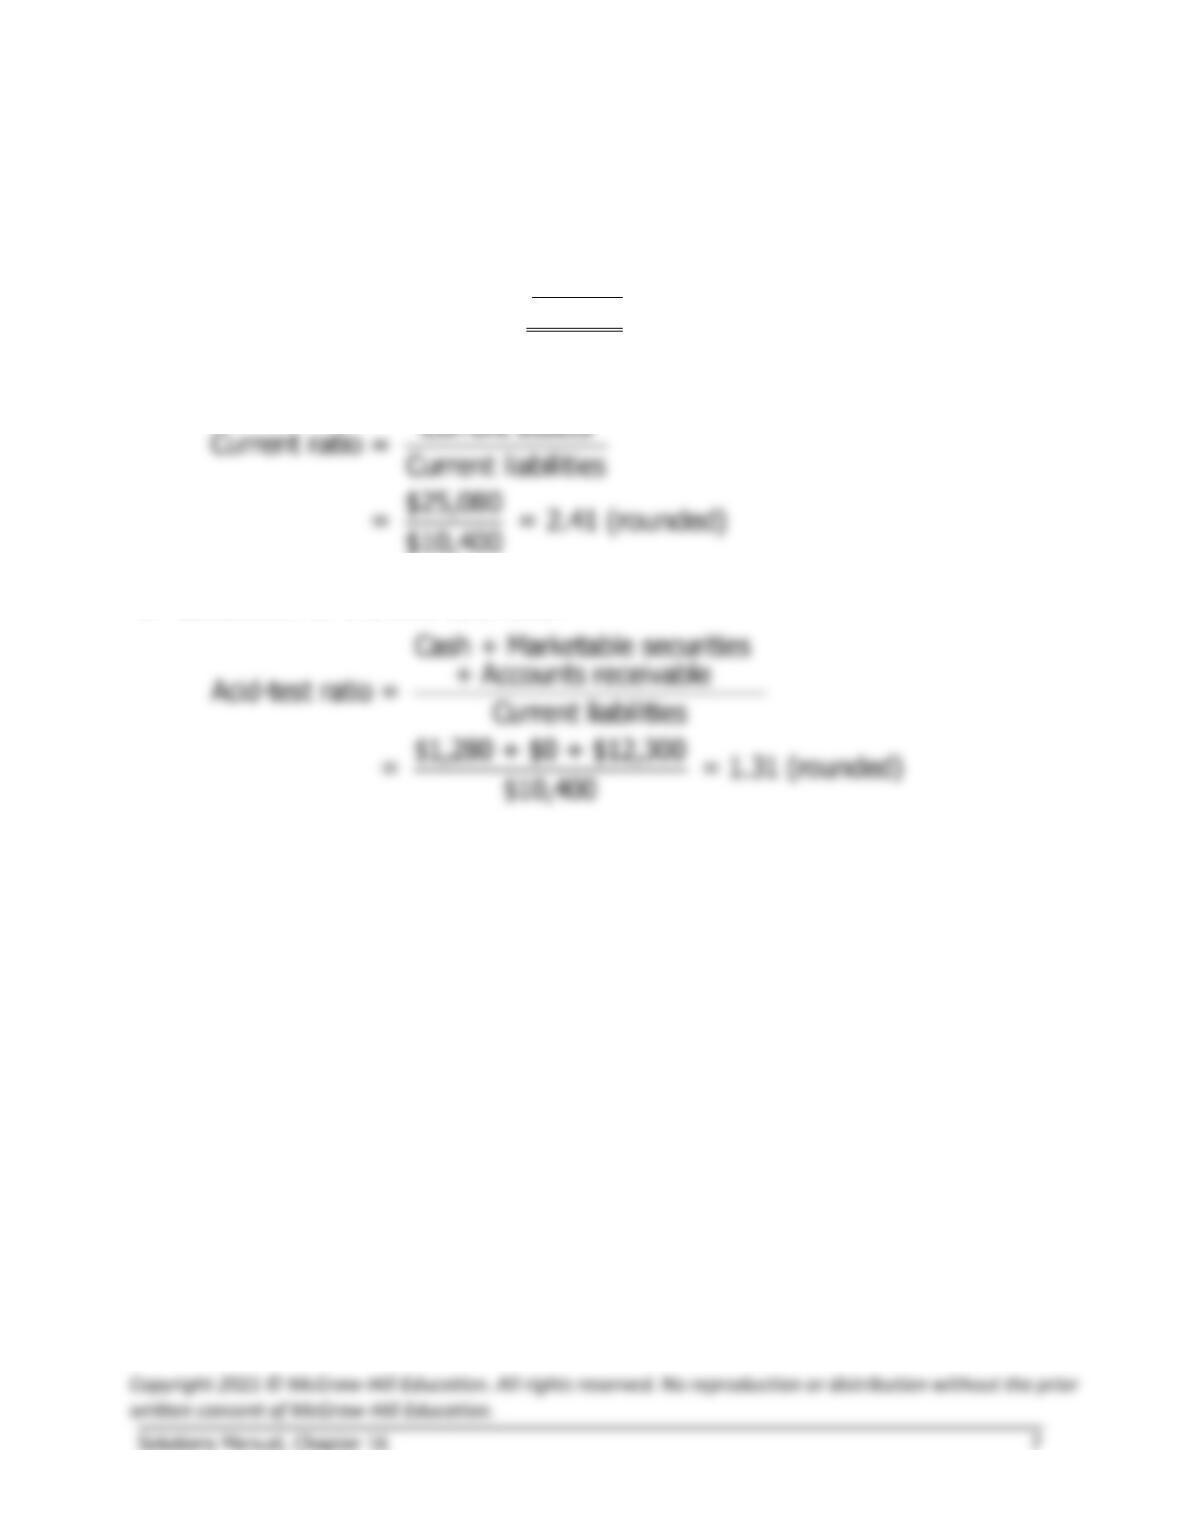
2. The company’s major problem seems to be the increase in cost of goods
sold, which increased from 58.6% of sales last year to 62.3% of sales
this year. This suggests that the company is not passing the increases in
costs of its products on to its customers. As a result, cost of goods sold
as a percentage of sales has increased and gross margin has decreased.
This change has been offset somewhat by reduction in administrative
Exercise 16-2 (10 minutes)
1. Calculation of working capital:
Current assets ……………..
$25,080
Current liabilities ………….
10,400
Working capital ……………
$14,680
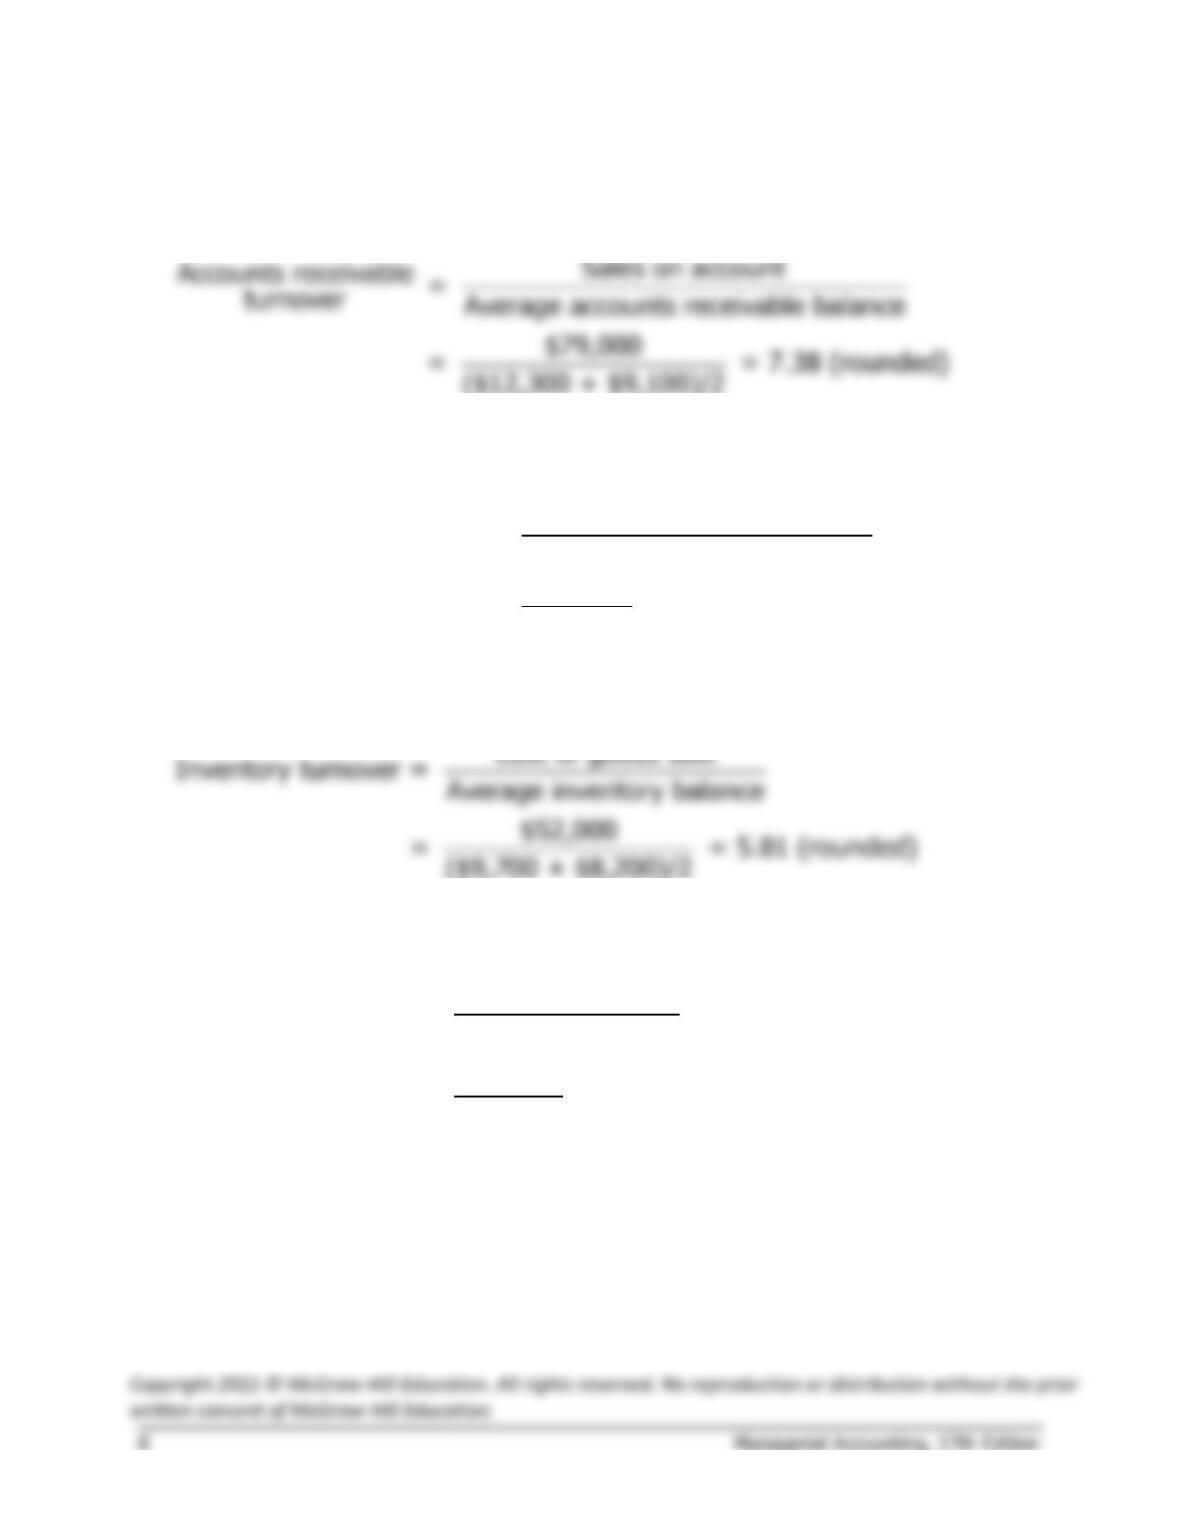
2. Calculation of the current ratio:
3. Calculation of the acid-test ratio:
Exercise 16-3 (20 minutes)
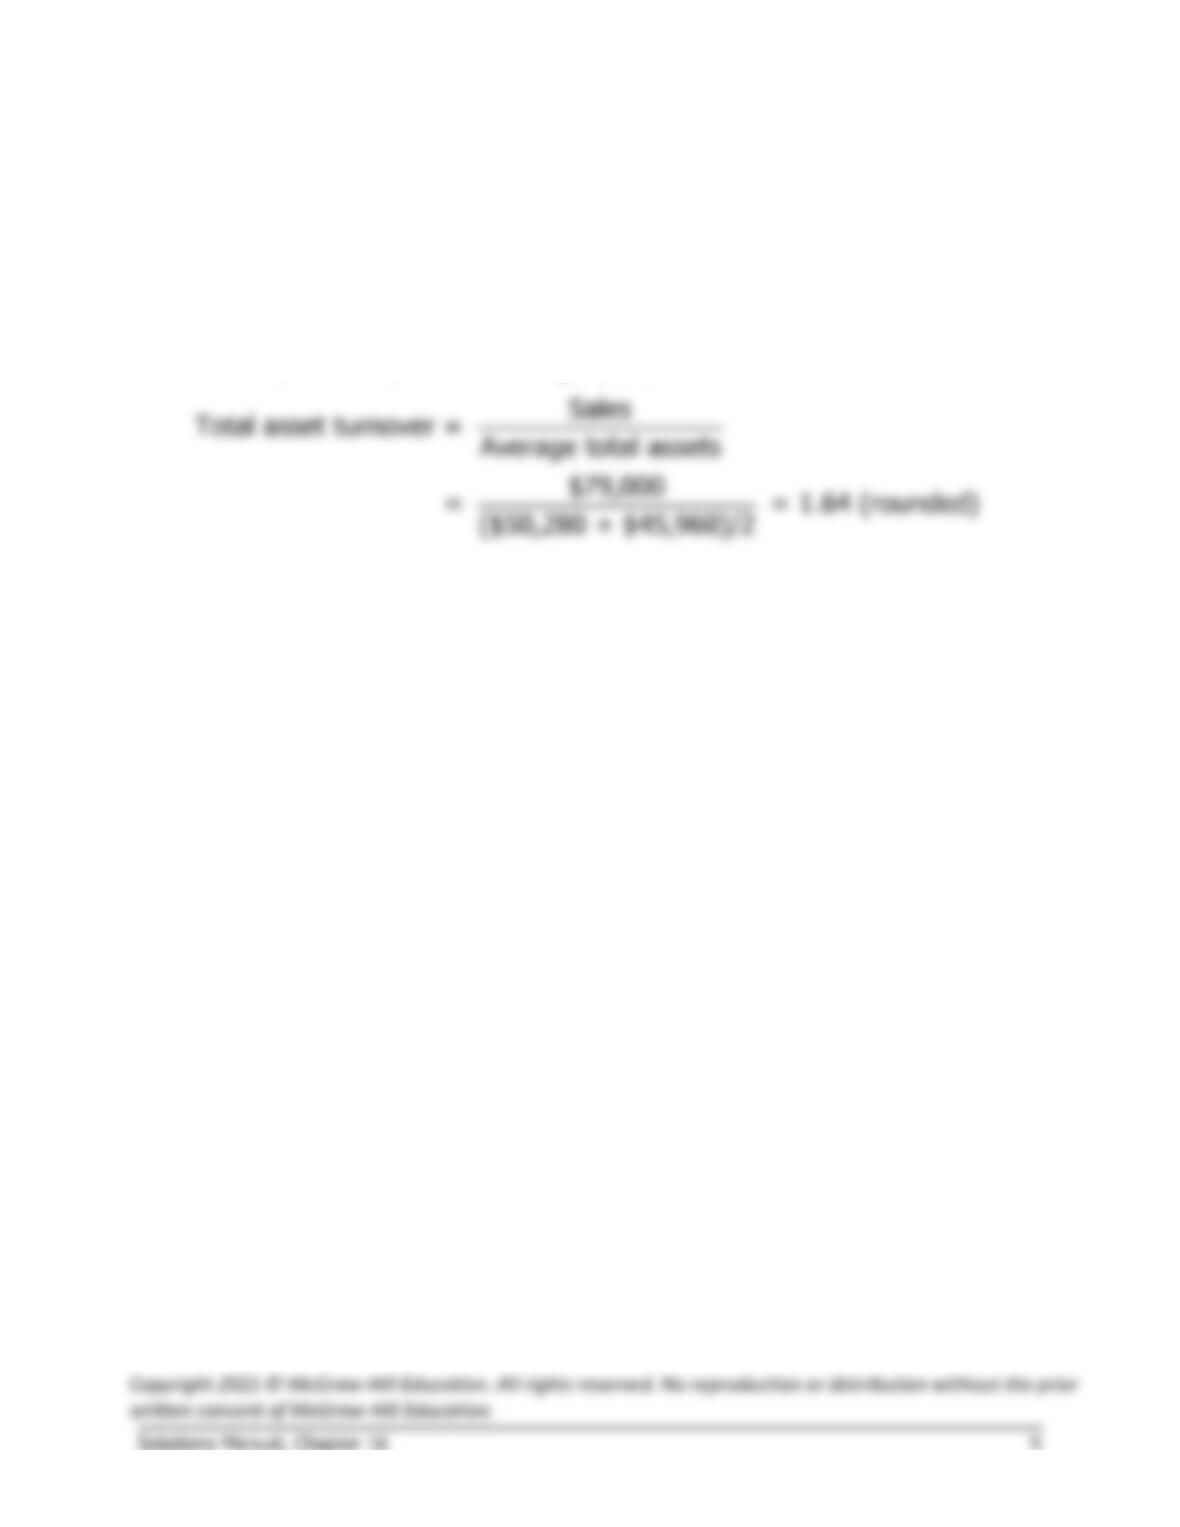
1. Calculation of accounts receivable turnover:
2. Calculation of the average collection period:
365 days
Average collection period = Accounts receivable turnover
365 days
= = 49.46 days (rounded)
7.38
3. Calculation of inventory turnover:
4. Calculation of the average sale period:
365 days
Average sale period = Inventory turnover
365 days
= = 62.82 days (rounded)
5.81
Exercise 16-3 (continued)
5. The operating cycle is computed as follows:
Operating cycle = Average sale period + Average collection period
= 62.82 days + 49.46 days = 112.28 days
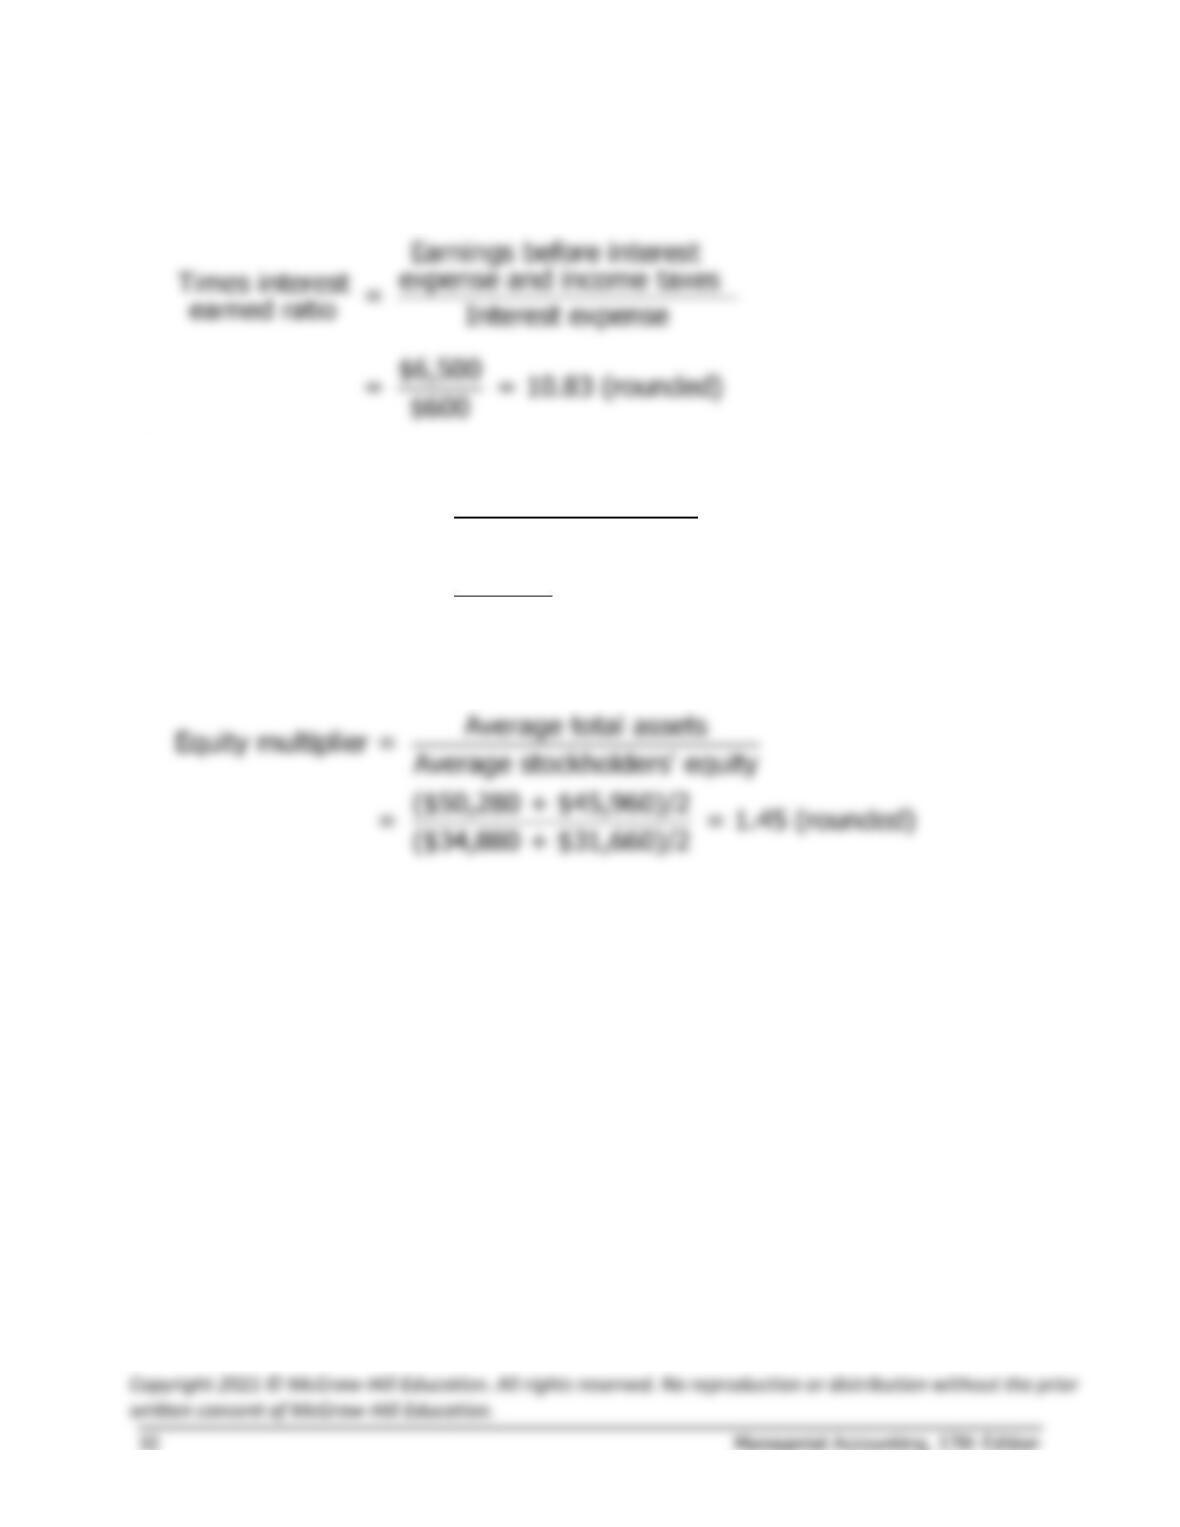
6. The total asset turnover is computed as follows:
Exercise 16-4 (10 minutes)
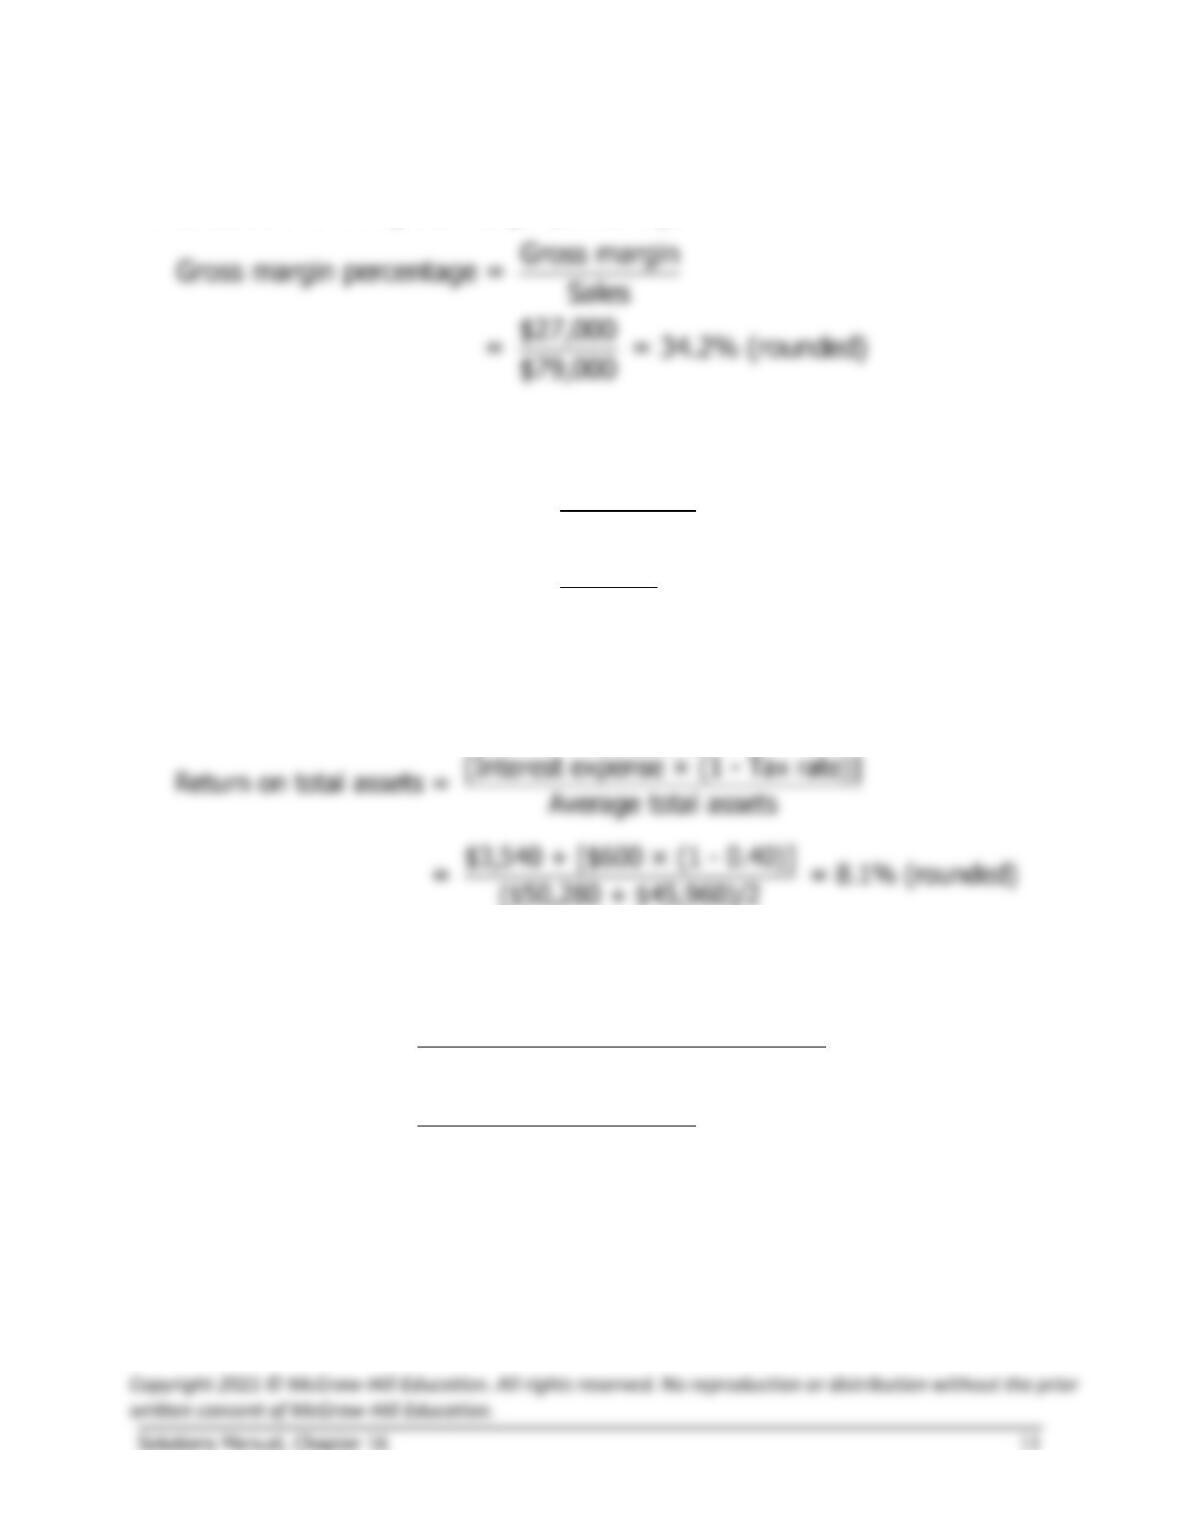
1. Calculation of the times interest earned ratio:
2. Calculation of the debt-to-equity ratio:
Total liabilities
Debt-to-equity ratio = Stockholders’ equity
$15,400
= = 0.44 (rounded)
$34,880
3. Calculation of the equity multiplier:
Exercise 16-5 (10 minutes)
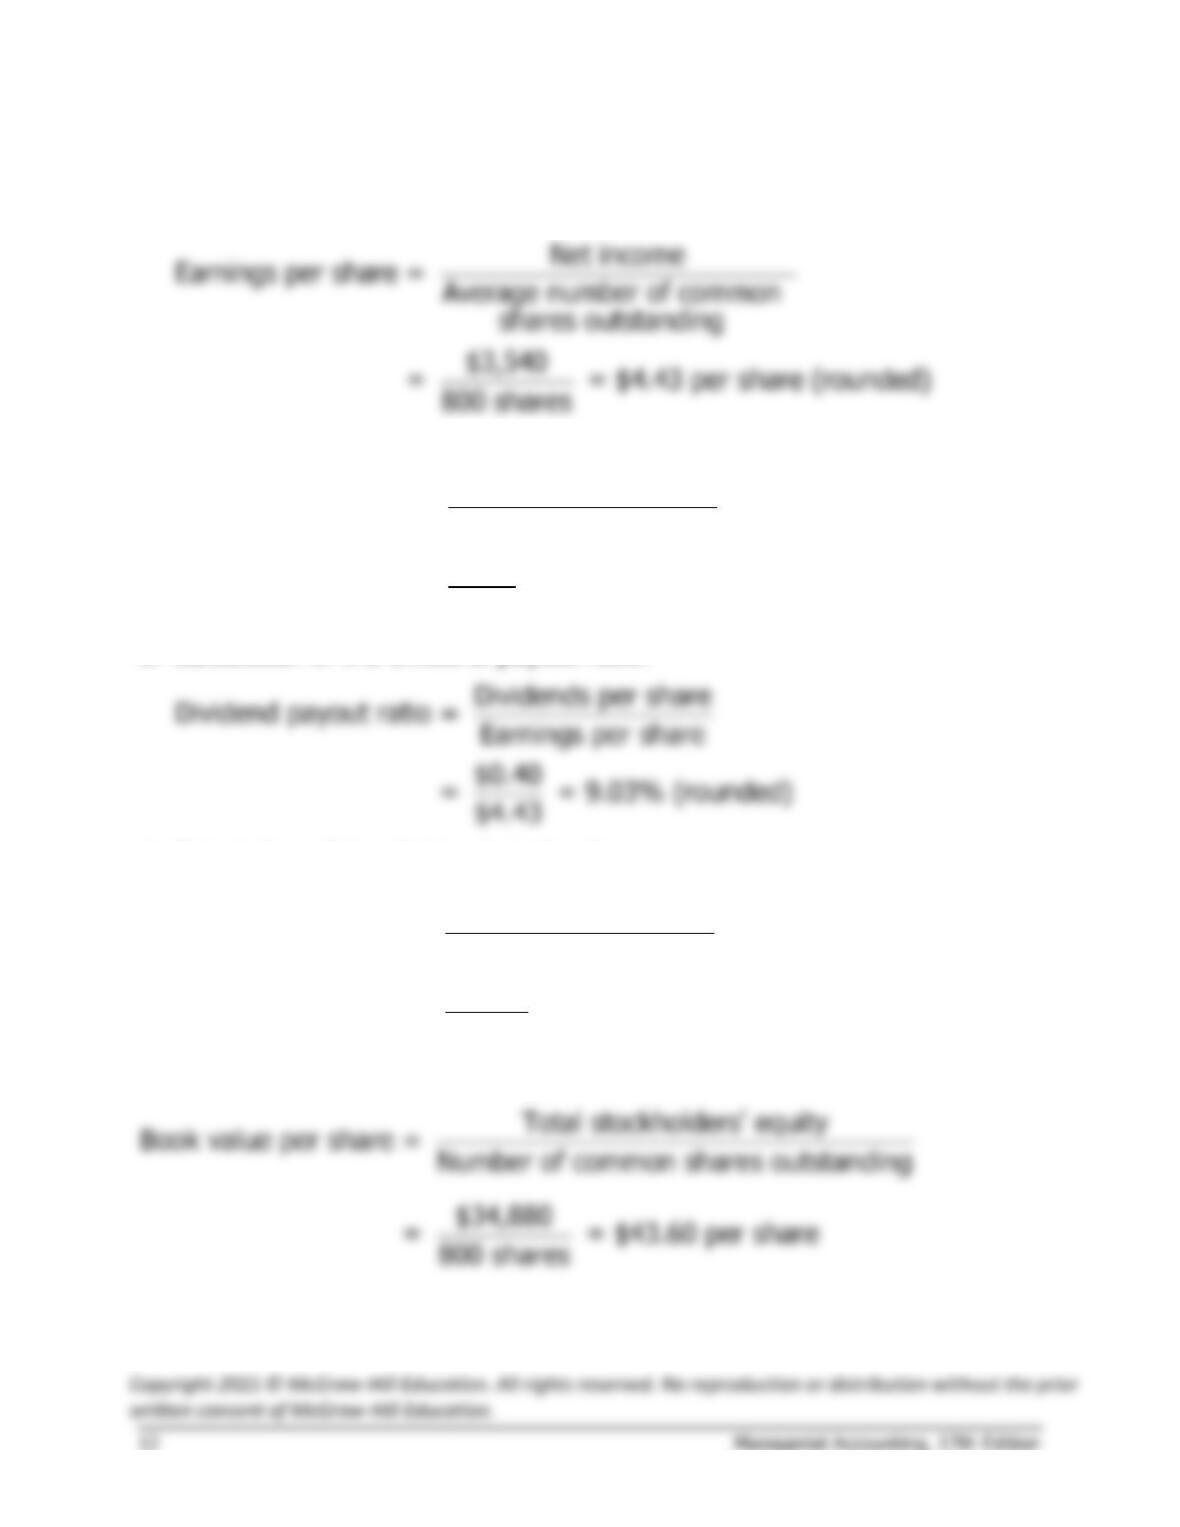
1. Calculation of the gross margin percentage:
2. Calculation of the net profit margin percentage:
Net income
Net profit margin percentage = Sales
$3,540
= = 4.5% (rounded)
$79,000
3. Calculation of the return on total assets:
Net income +
4. Calculation of the return on equity:
Net income
Return on equity =
Average total stockholders’ equity
$3,540
= = 10.64% (rounded)
($34,880 + $31,660)/2
Exercise 16-6 (15 minutes)
1. Calculation of the earnings per share:
2. Calculation of the price-earnings ratio:
Market price per share
Price-earnings ratio =
Earnings per share
$18
= = 4.06 (rounded)
$4.43
4. Calculation of the dividend yield ratio:
Dividends per share
Dividend yield ratio = Market price per share
$0.40
= = 2.22% (rounded)
$18.00
5. Calculation of the book value per share:
Exercise 16-7 (15 minutes)
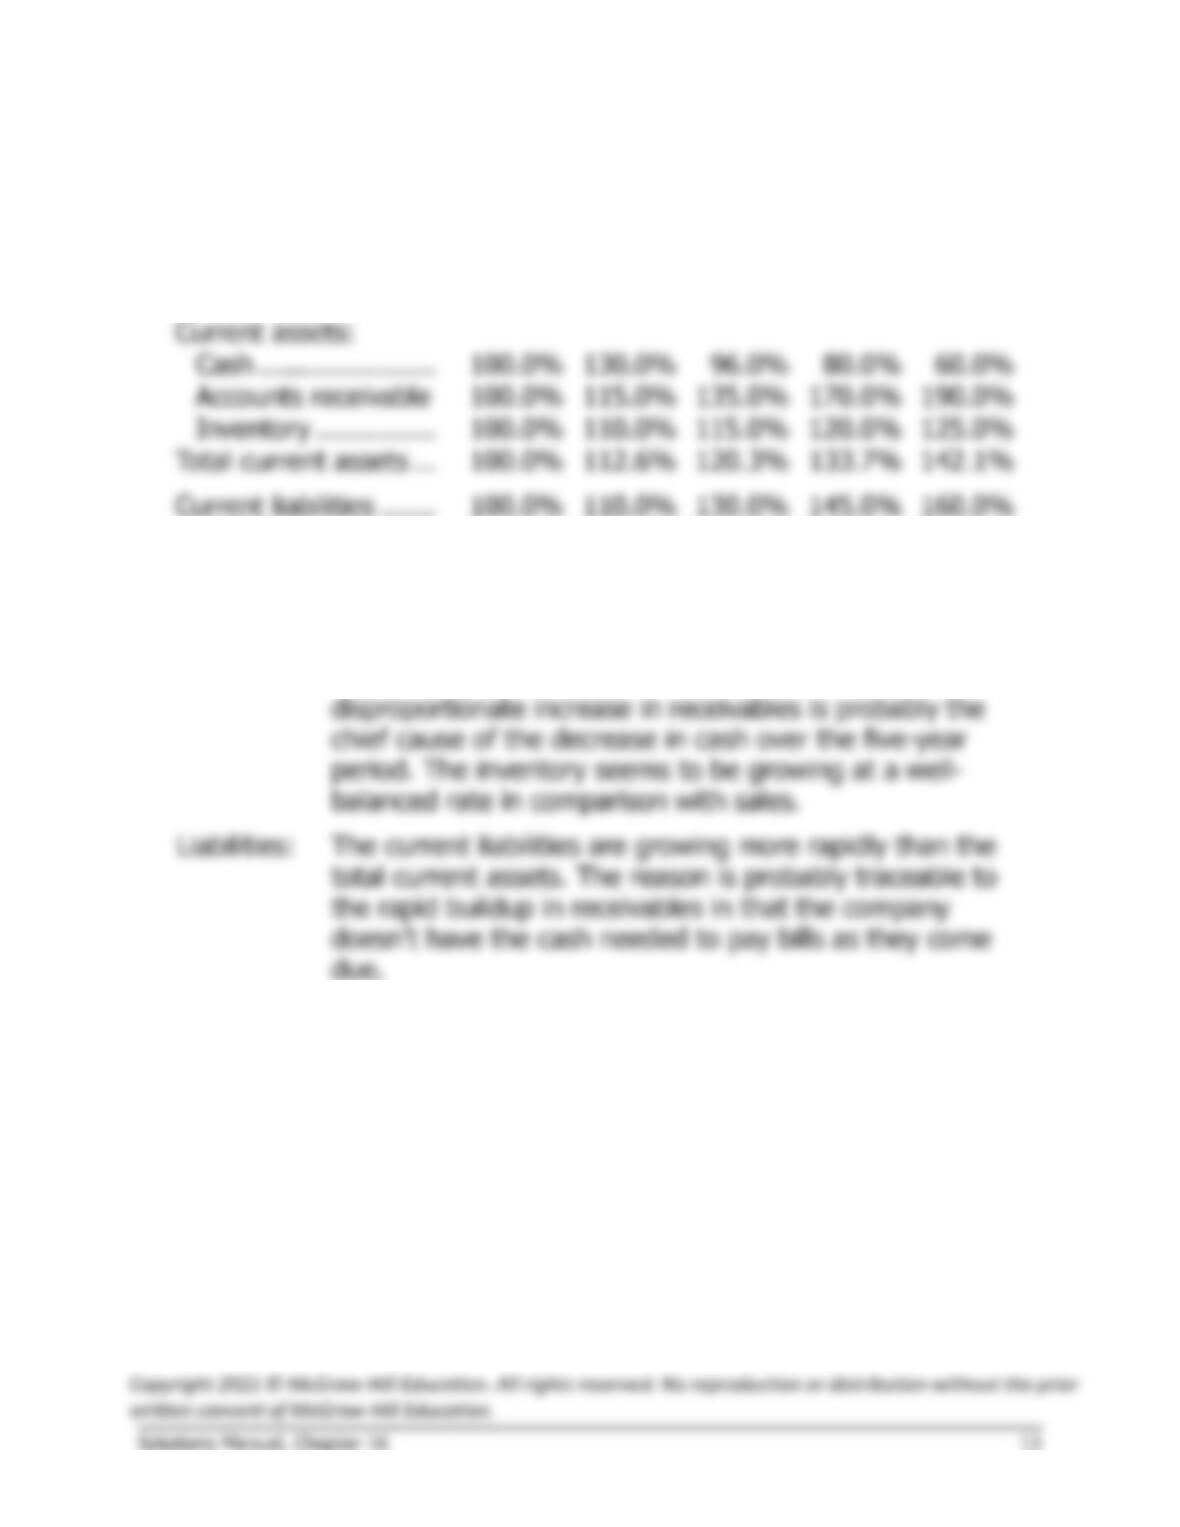
1. The trend percentages (rounded) are:
Year 1
Year 2
Year 3
Year 4
Year 5
Sales ……………………
100.0%
110.0%
115.0%
120.0%
125.0%
Current assets:
100.0%
130.0%
100.0%
115.0%
135.0%
170.0%
190.0%
100.0%
110.0%
115.0%
120.0%
125.0%
2.
Sales:
The sales are increasing at a steady and consistent rate.
Assets:
The most noticeable thing about the assets is that the
accounts receivable has been increasing at a rapid rate—
far outstripping the increase in sales. This
Exercise 16-8 (20 minutes)
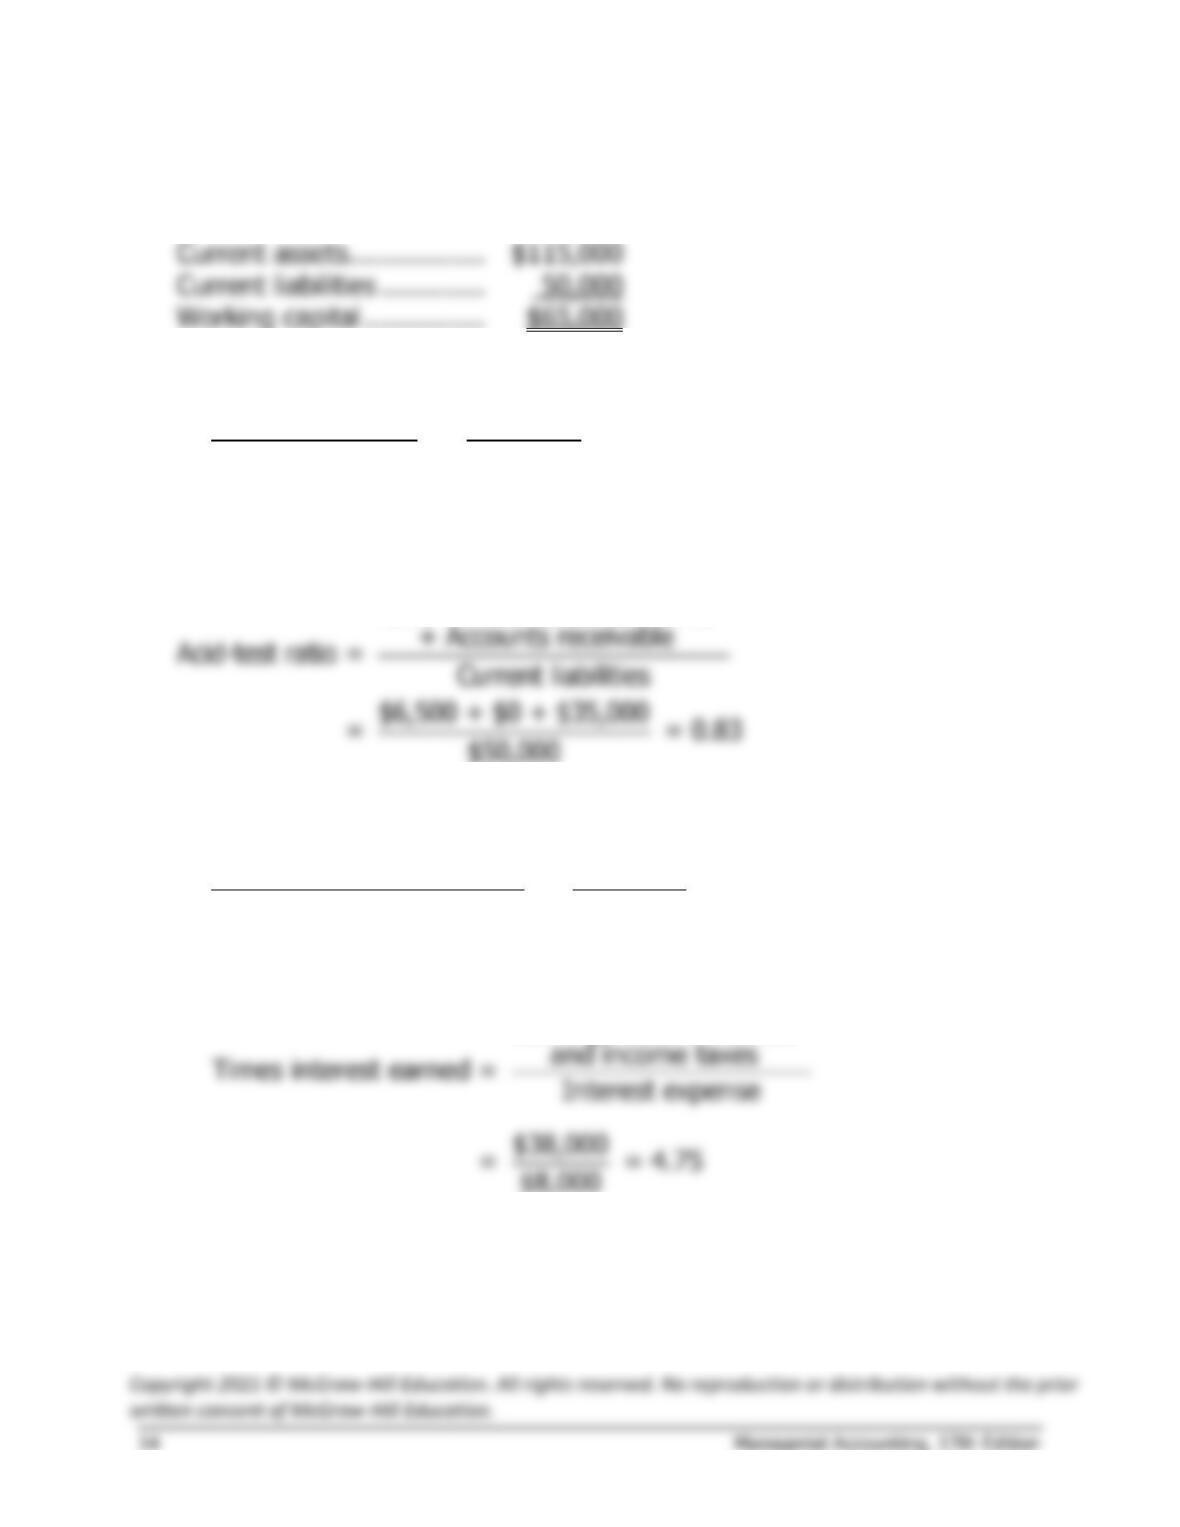
1. Calculation of working capital:
2. Current ratio:
Current assets $115,000
= = 2.3
Current liabilities $50,000
3. Acid-test ratio:
Cash + Marketable securities
4. Debt–to-equity ratio:
Total liabilities $130,000
= = 0.76 (rounded)
Total stockholders‘ equity $170,000
5. Times interest earned:
Earnings before interest
Exercise 16-8 (continued)
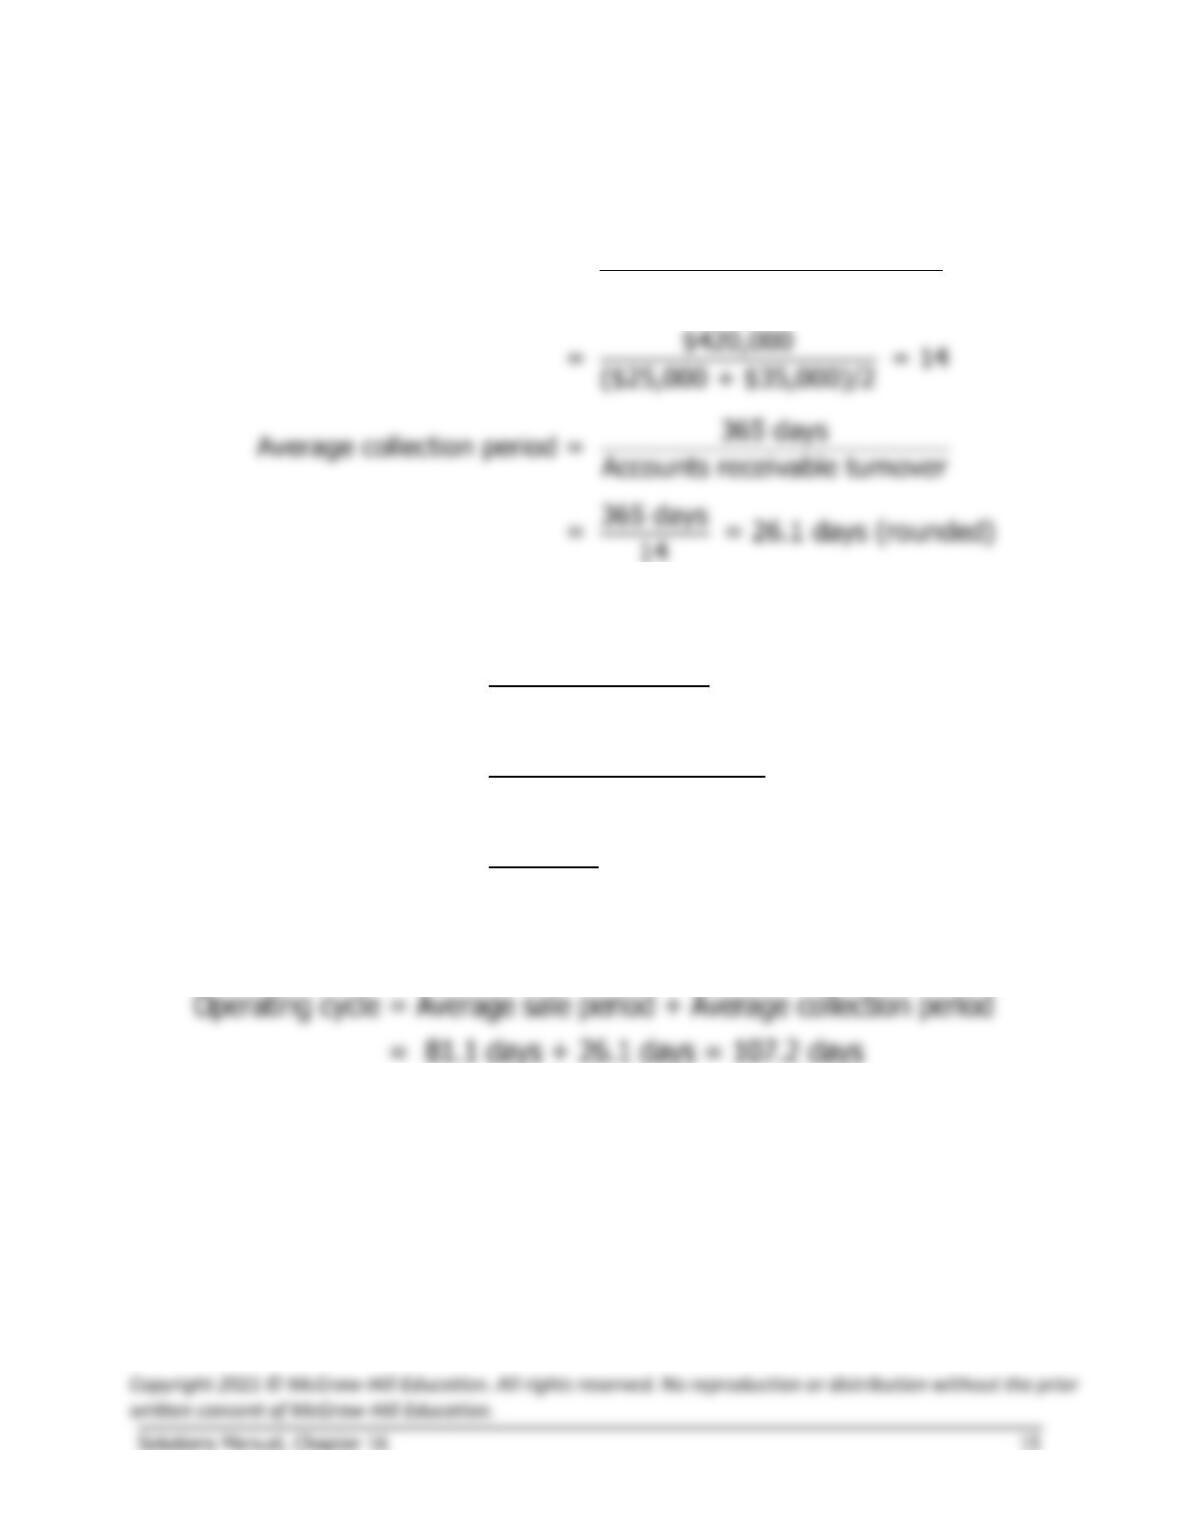
6. Average collection period:
Sales on account
Accounts receivable turnover = Average accounts receivable
7. Average sale period:
Cost of goods sold
Inventory turnover = Average inventory
$292,500
= = 4.5
($60,000 + $70,000)/2
365 days
Average sale period = = 81.11 days (rounded)
4.5
8. The operating cycle is computed as follows:
Exercise 16-9 (20 minutes)
1. Calculation of the gross margin percentage:
Gross margin
Gross margin percentage = Sales
$127,500
= = 30.36% (rounded)
$420,000
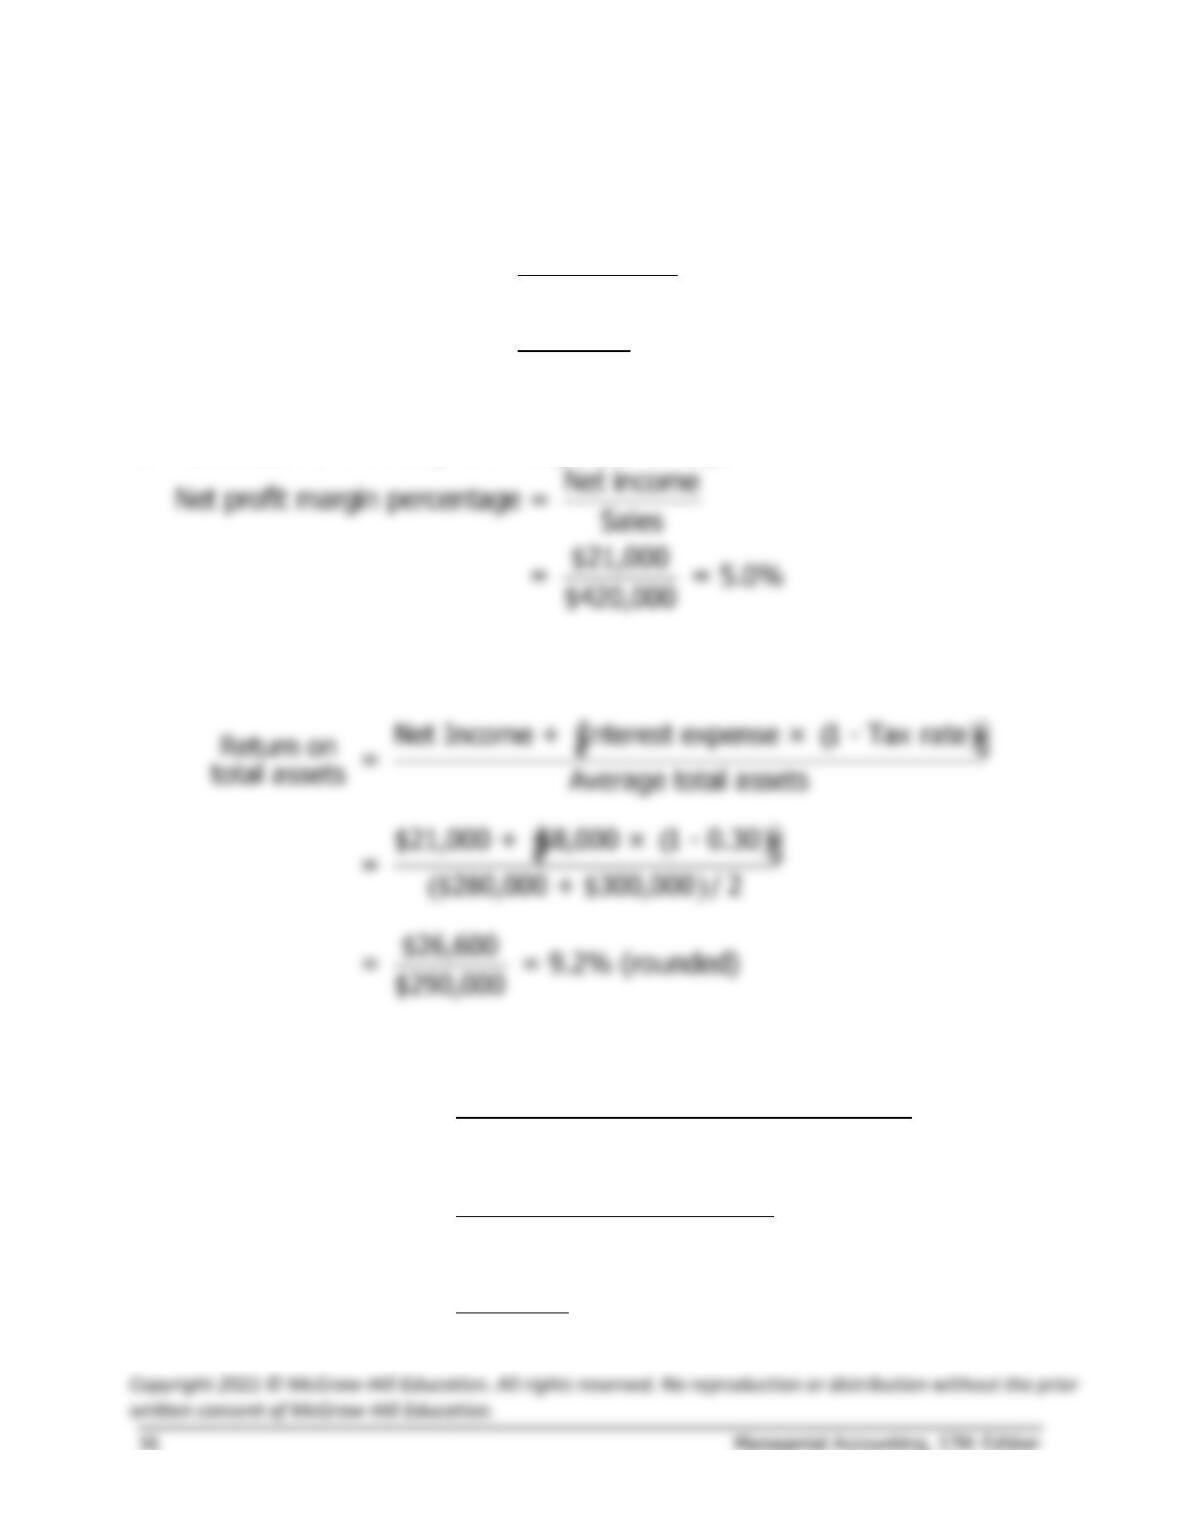
2. Calculation of the net profit margin percentage:
3. Return on total assets:
4. Return on equity:
( )
Net income
=
Return on equity Average common stockholders’ equity
$21,000
=
$161,600 + $170,000 / 2
$21,000
= = 12.7% (rounded)
$165,800
Exercise 16-9 (continued)
5. Financial leverage was positive because the return on equity (12.7%)
was greater than the return on total assets (9.2%). This positive
leverage is traceable in part to the company’s current liabilities, which
Exercise 16-10 (15 minutes)
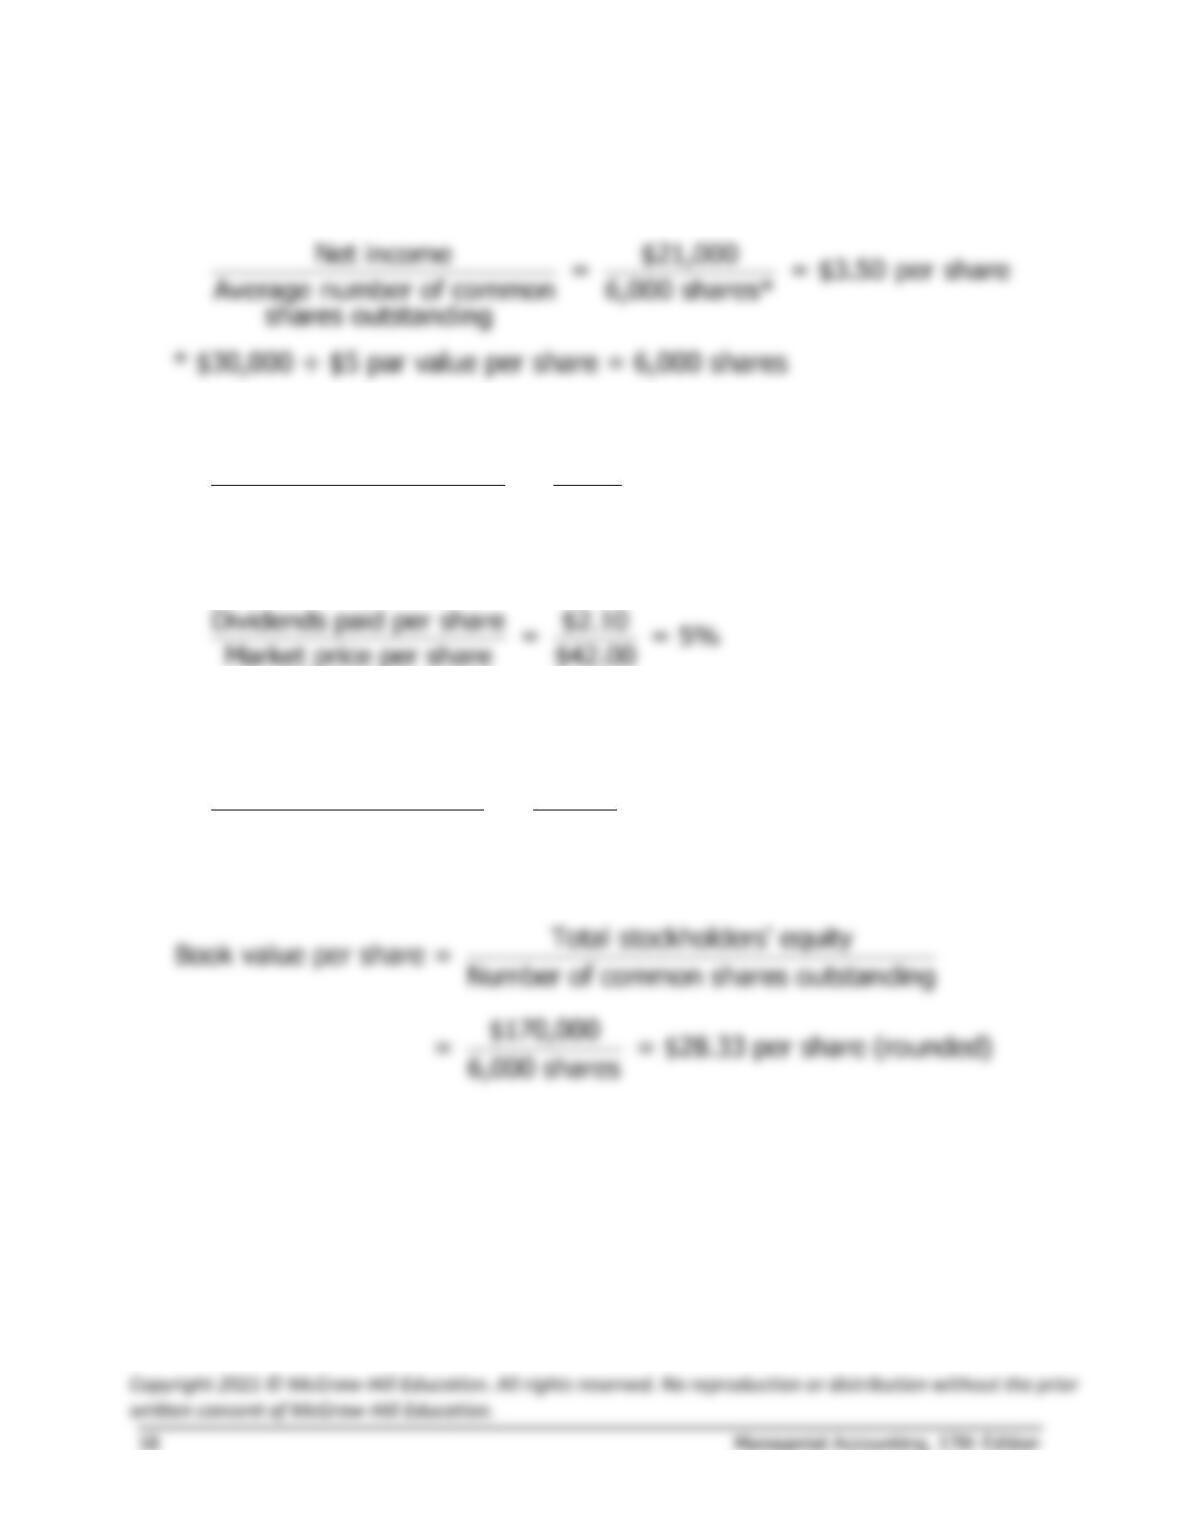
1. Earnings per share:
2. Dividend payout ratio:
Dividends paid per share $2.10
= = 60%
Earnings per share $3.50
3. Dividend yield ratio:
Dividends paid per share $2.10
= = 5%
4. Price-earnings ratio:
Market price per share $42.00
= = 12
Earnings per share $3.50
5. Book value per share:
Exercise 16-11 (15 minutes)
1. Return on total assets:
( )
Net income + [Interest expense × (1 – Tax rate)]
Return on =
total assets Average total assets
$280,000 + [$60,000 × (1 – 0.30)]
= $3,000,000 + $3,600,000 / 2
$322,000
= = 9.8% (rounded)
$3,300,000
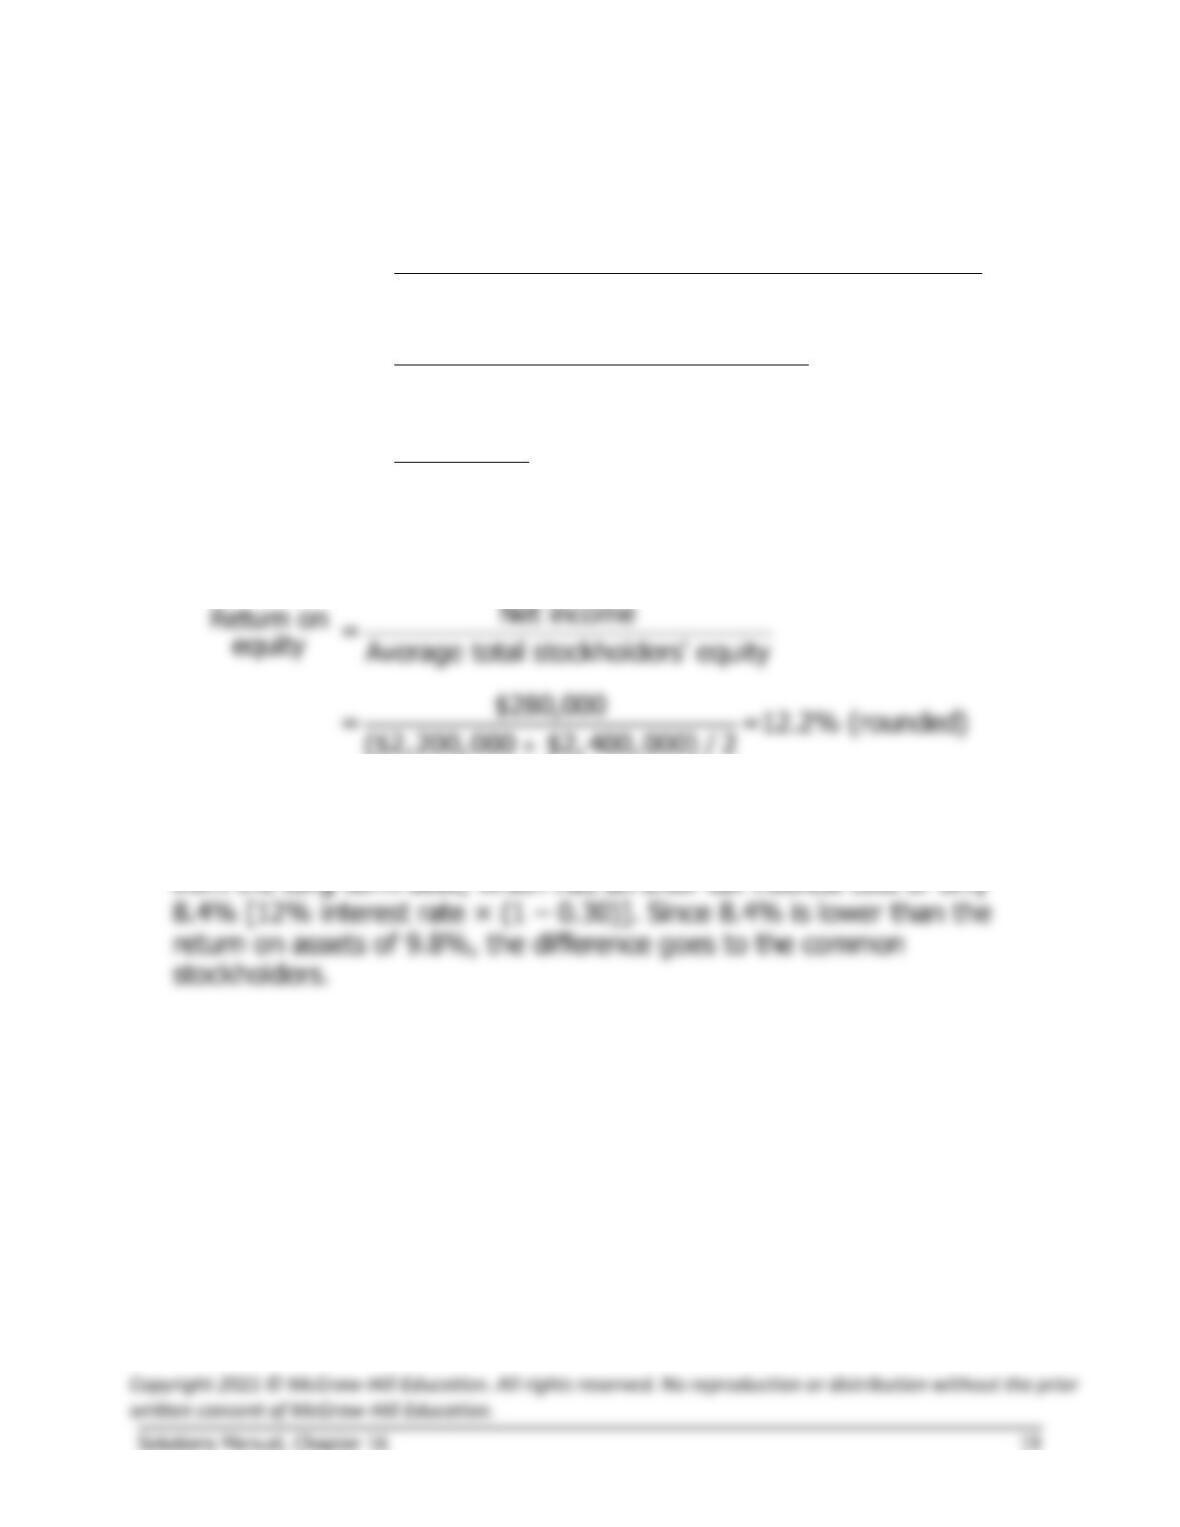
2. Return on equity:
3. Leverage is positive because the return on equity (12.2%) is greater
than the return on total assets (9.8%). This positive leverage arises
Exercise 16-12 (15 minutes)
1.
Current assets
($90,000 + $260,000 + $490,000 + $10,000) ………….
$850,000
Current liabilities ($850,000 ÷ current ratio of 2.5) ………
340,000
Working capital ……………………………………………………
$510,000
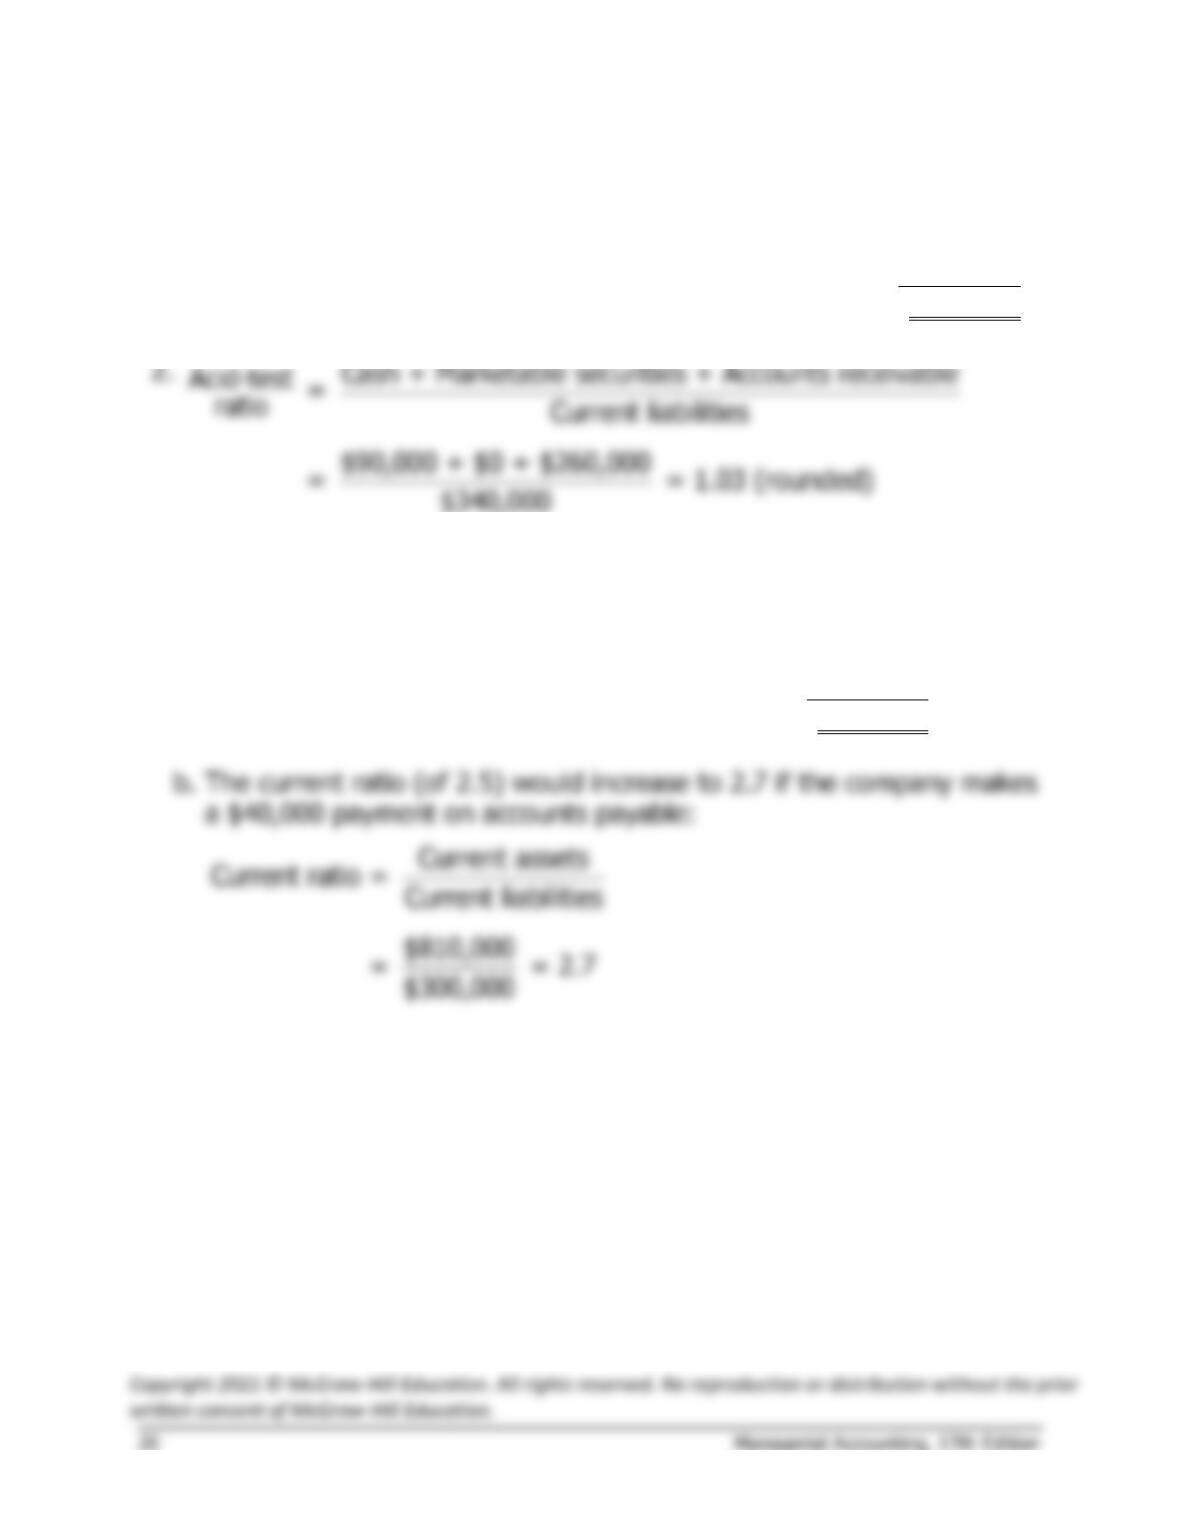
3. a. Working capital would not be affected by a $40,000 payment on
accounts payable:
Current assets ($850,000 – $40,000) ………….
$810,000
Current liabilities ($340,000 – $40,000) ………
300,000
Working capital ……………………………………..
$510,000