16
Fundamentals of Variance Analysis
Solutions to Review Questions
16–1.
For performance evaluation purposes, the costing format should identify the actual costs
for comparison with expected costs during the relevant period. Under absorption costing,
the manufacturing fixed costs are allocated on a per unit basis. An increase in production
results in a lower per unit cost. If all of the production is sold, all of the fixed cost will be
charged against profit. However, if some of the costs are assigned to inventory, the result
can be a deferral of costs that should be evaluated at this time. This problem is highlighted
by the suggestion that one can increase production in times of declining sales in order to
“help the bottom line by spreading fixed costs over more units.” Because variable costing
excludes fixed overhead for inventory valuation (fixed overhead is treated as a period
expense), there is no motivation to produce goods for inventory.
16–2.
The budget can be used as a benchmark against which to evaluate actual results. It can
be used in the same way that actual results of competitors or the actual results from
previous years can be used.
16–3.
False. Only variable costs and revenues “flex” with changes in activity. Fixed costs are
expected to remain the same when operations are in the relevant range.
16–5.
16–6.
16–7.
16–8.
The three primary sources of variances are:
16–9.
The fixed cost variances differ from variable cost variances because fixed costs do not
vary with the level of production activity. Therefore, the fixed costs in the flexible budget
will be the same as in the master budget (within the relevant range). Additionally, there are
no efficiency variances for fixed costs because there is no input-output relationship that
can be applied.
Solutions to Critical Analysis and Discussion Questions
16–10.
Preparation of the ex-post budget allows management to compare actual results with the
budget that would have been instituted if certain ex-ante factors were known. The most
significant of these is, typically, volume of activity. By controlling for the difference
between ex-ante expectations and the ex-post volumes, comparisons between actual
results and plans can be more meaningful. The controllable factors (e.g., costs per unit,
efficiency, sales prices) can be isolated and evaluated.
16–11.
16–12.
Selling more units of a product or service (assuming the price is not changed) might be
“good” news. Having managers offer significant incentives (or, in the extreme, offering to
buy back unused product) might be an example of “bad” news, because these incentives
might result in lower profits.
16–13.
Answers will vary. A common theme might be that the organization used resources that
were not as productive and, as a result, organizational results suffer. The reason might be
the quality of the input (coffee, food, and so on) or the talent of the input (in the case of an
entertainment business or a sports team). This is why it is important to look at variance
analyses in total and not just the individual elements.
16–14.
16–15.
This problem arises more frequently than one would hope. Because costs are
accumulated in responsibility centers usually according to where the cost is incurred, it is
quite likely that the production department will be charged with a cost that originated by
the action of some other (e.g., sales) department. In accepting the rush order, the sales
department would either have raised the selling price to compensate for the special
delivery or undertaken the rush order to avoid losing a sale. The extra costs incurred in
other departments as a direct result of the sales department’s action should be chargeable
back to the sales department.
16–16.
Typically, the labor price variances are relatively small since the rates are usually
16–17.
False. The production volume variance arises because fixed overhead is applied over a
greater or lesser number of units than were used in deriving the fixed overhead application
rate. Hence, the production volume variance does not tell us whether we spent more or
less, but rather only that we produced more or less than expected.
16–18.
It is necessary to investigate the reasons why volume fell short of expectations. If
16–19.
There are two reasons why this view is not a good one. First, the fact that the division is
16–20.
Disagree. Variances are based on the difference between actual and budgeted results.
The budget does not have to be based on the same unit inputs (or unit prices) for all
output levels. If there is a more complicated (nonlinear) relation between inputs and
outputs, the budget can reflect that. For example, if a firm is experiencing important
learning economies, it can use learning curves (see Appendix B of Chapter 5) to use in
budgeting its labor inputs.
Solutions to Exercises
16–21. (20 min.) Flexible Budgeting: Western Company.
Calculations: Master budget dollar amount
Sales revenue ………….
225,000 units × $9.00 per unit =
$2,025,000
Variable costs ………….
225,000 units × $3.75 per unit =
$843,750
Fixed costs ………………
$ 225,000
Western Company
Flexible Budget
Sales revenue ………………………….
$2,070,000
(= $9.00 × 230,000)
Less:
Variable manufacturing costs ….
862,500
(= $3.75 × 230,000)
Contribution margin …………………..
$1,207,500
Less:
Fixed manufacturing costs ………
225,000
Operating profits ……………………….
$982,500
16–22. (30 min.) Sales Activity Variance: Western Company.
Sales revenue …………………………...
$2,025,000
Variable manufacturing costs ……
843,750
Contribution margin …………………….
$1,181,250
Less:
Fixed costs …………………………….
Master Budget
16–23. (30 min.) Profit Variance Analysis: Western Company
Actual
(230,000
Units)
Manufacturing
Variances
Sales Price
Variance
Flexible Budget
(230,000 Units)
Activity
Variance
Master Budget
(225,000 Units)
Sales revenue ……………………
$2,093,000a
$23,000 F
$2,070,000b
$45,000 F
$2,025,000c
Less:
Variable manufacturing costs
1,035,000d
$172,500 U
_______
862,500e
18,750 U
843,750f
Contribution margin ……………
1,058,000
172,500 U
$23,000 F
$1,207,500
26,250 F
1,181,250
Less:
________
_______
_______
16–24. (20 min.) Flexible Budget.
a.
$40,000
b.
$8
per unit
VC
=
(TC – FC) ÷ X
=
($120,000 – $40,000) ÷ 10,000 units
c.
$104,000
=
F + VX
=
$40,000 + ($8 × 8,000 units)
d.
$168,000
=
F + VX
=
$40,000 + ($8 × 16,000 units)
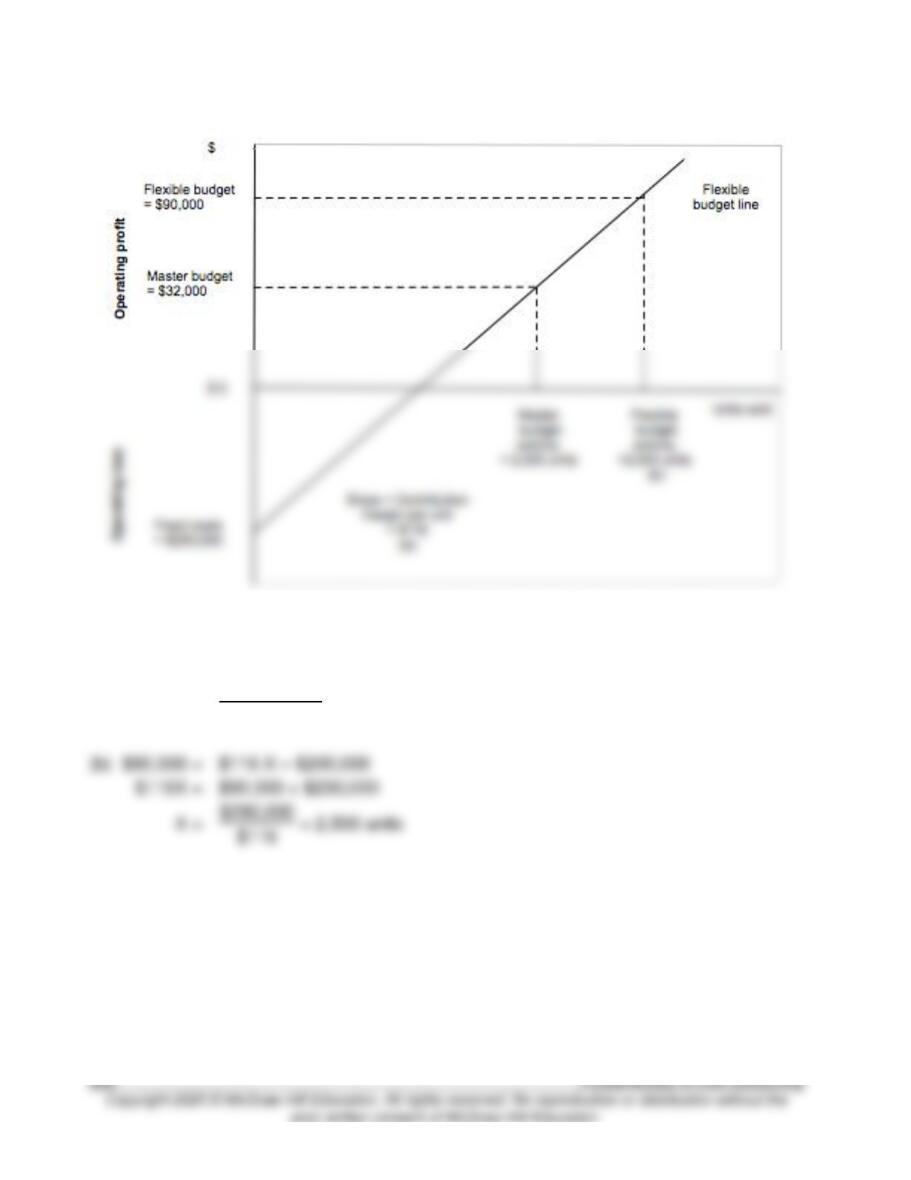
16–25. (25 min.) Fill In Amounts On Flexible Budget Graph.
Computations:
(a)
Profit
=
(P – V)X – FC
$32,000
=
(P – V)(2,000 units) – $200,000
(P – V)
=
$232,000
= $116 per unit
2,000 units
(b)
=
$116 X – $200,000
=
=
$290,000
= 2,500 units
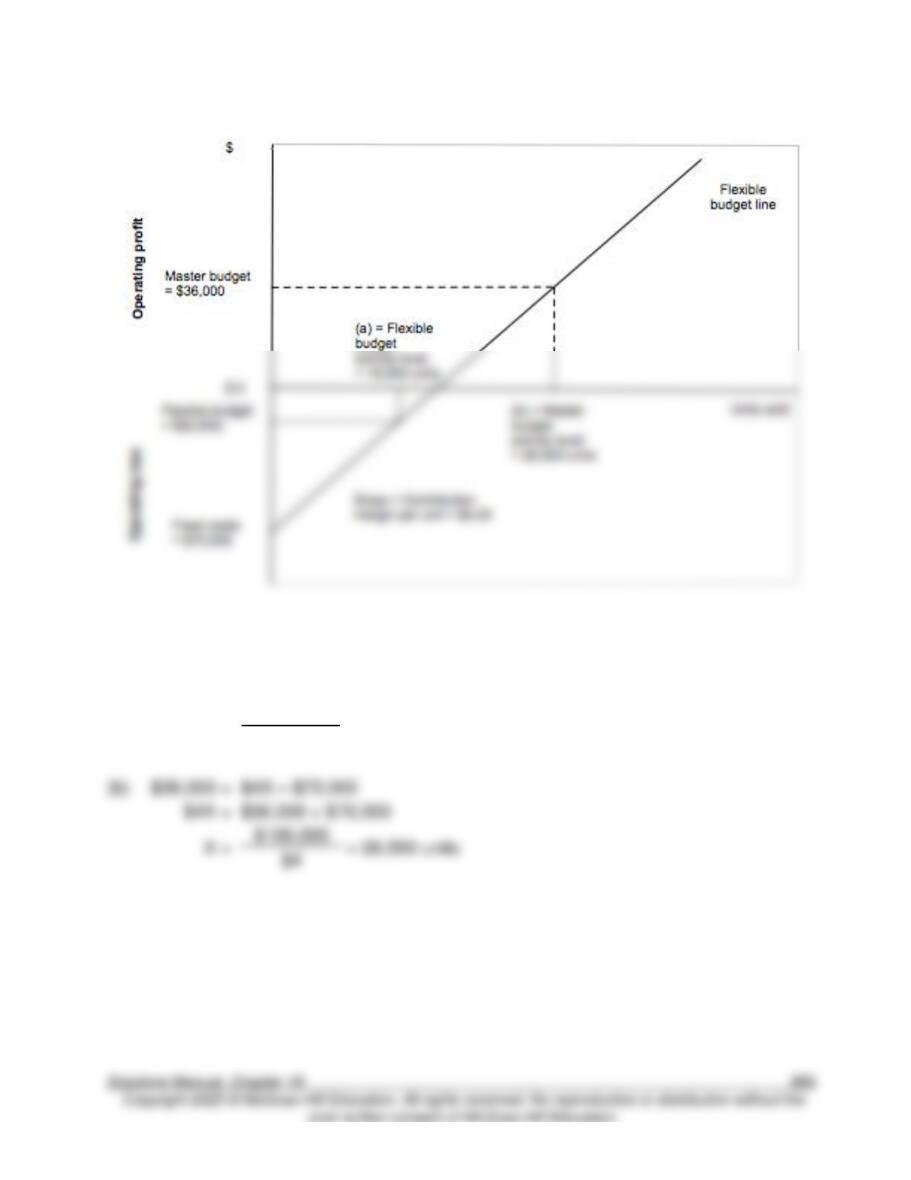
16–26. (25 min.) Flexible Budget.
Computations:
(a)
Profit
=
(P – V)X – FC
$(6,000)
=
$4X – $70,000
$4X
=
($6,000) + $70,000
X
=
$64,000
= 16,000 units
$4
(b)
=
$4X – $70,000
$4X
=
X
=
$4
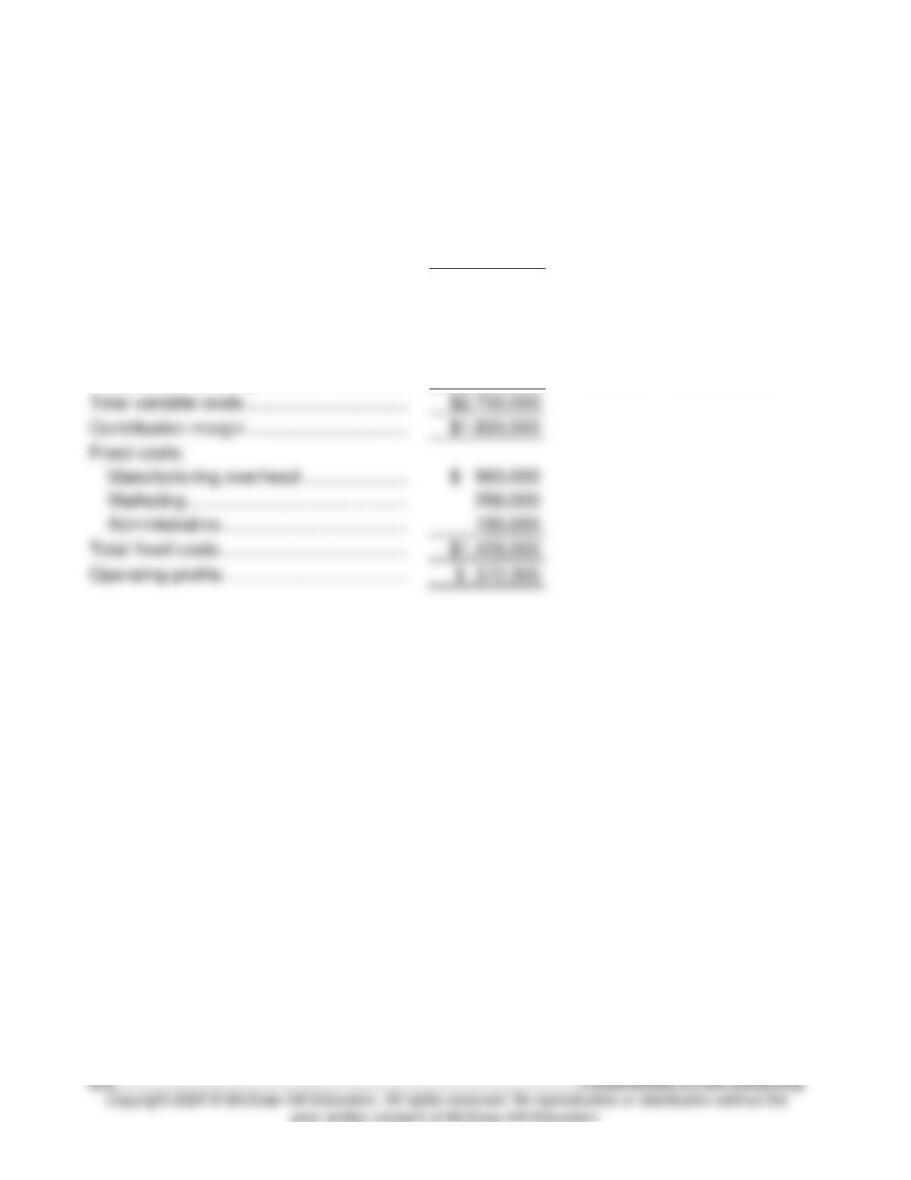
16–27. (35 min.) Prepare Flexible Budget: Osage, Inc.
Flexible
Budget
(based on
actual of
450,000 units)
Calculations
(000 omitted for units)
Sales revenue …………………………………..
$4,500,000
$4,800,000
×
(450 ÷ 480)
Variable costs:
Materials ………………………………………
1,350,000
1,440,000
×
(450 ÷ 480)
Direct labor …………………………..……….
315,000
336,000
×
(450 ÷ 480)
Variable overhead ………………………….
585,000
624,000
×
(450 ÷ 480)
Variable marketing and administrative
450,000
480,000
×
(450 ÷ 480)
Total variable costs …………………………...
Contribution margin …………………………..
$1,800,000
Fixed costs:
Manufacturing overhead …………………
Marketing ……………………………………..
Administrative………………………………..
Total fixed costs ………………………………..
Operating profits ……………………………….
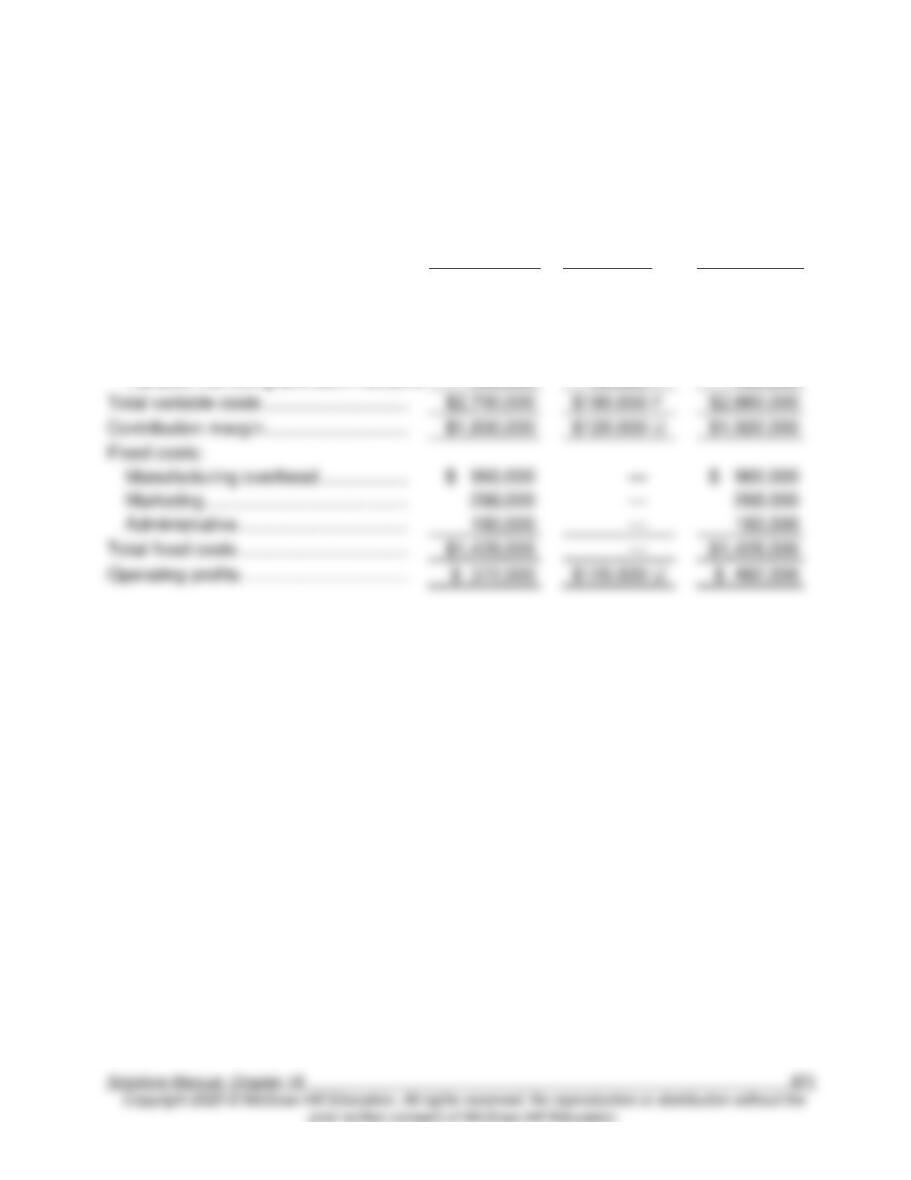
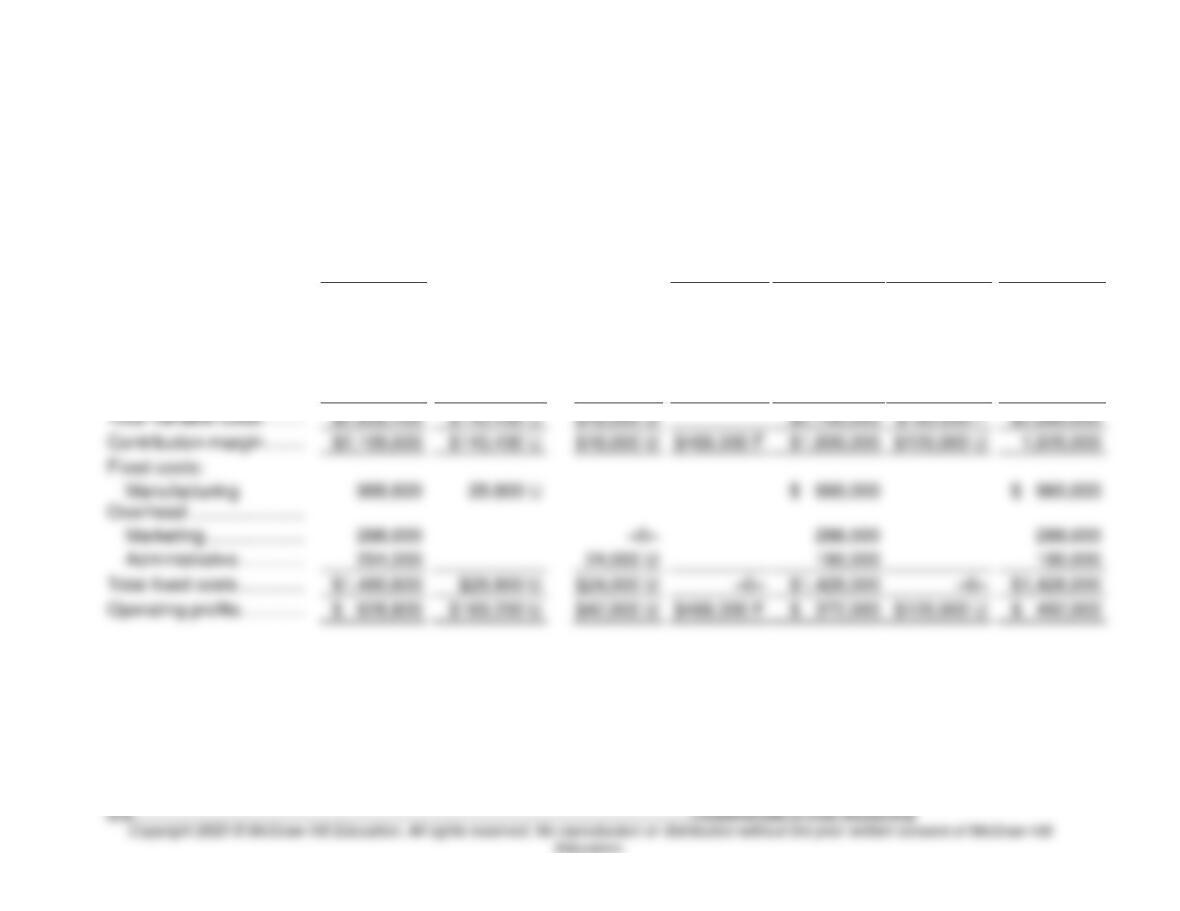
16–28. (45 min.) Sales Activity Variance: Osage, Inc.
Flexible
Budget
(based on
actual of
450,000
units)
Sales Activity
Variance
Master
Budget
(based on
budgeted
480,000
units)
Sales revenue …………………………..…..
$4,500,000
$300,000
U
$4,800,000
Variable costs:
Materials ……………………………………
1,350,000
90,000
F
1,440,000
Direct labor ………………………………..
315,000
21,000
F
336,000
Variable overhead ………………………
585,000
39,000
F
624,000
Variable marketing and administrative
F
480,000
Total variable costs ………………………..
F
Contribution margin ………………………..
$120,000
U
Fixed costs:
Manufacturing overhead ………………
$ 960,000
Marketing …………………………..………
288,000
Administrative …………………………….
Total fixed costs …………………………….
$1,428,000
Operating profits …………………………….
$ 372,000
$120,000
U
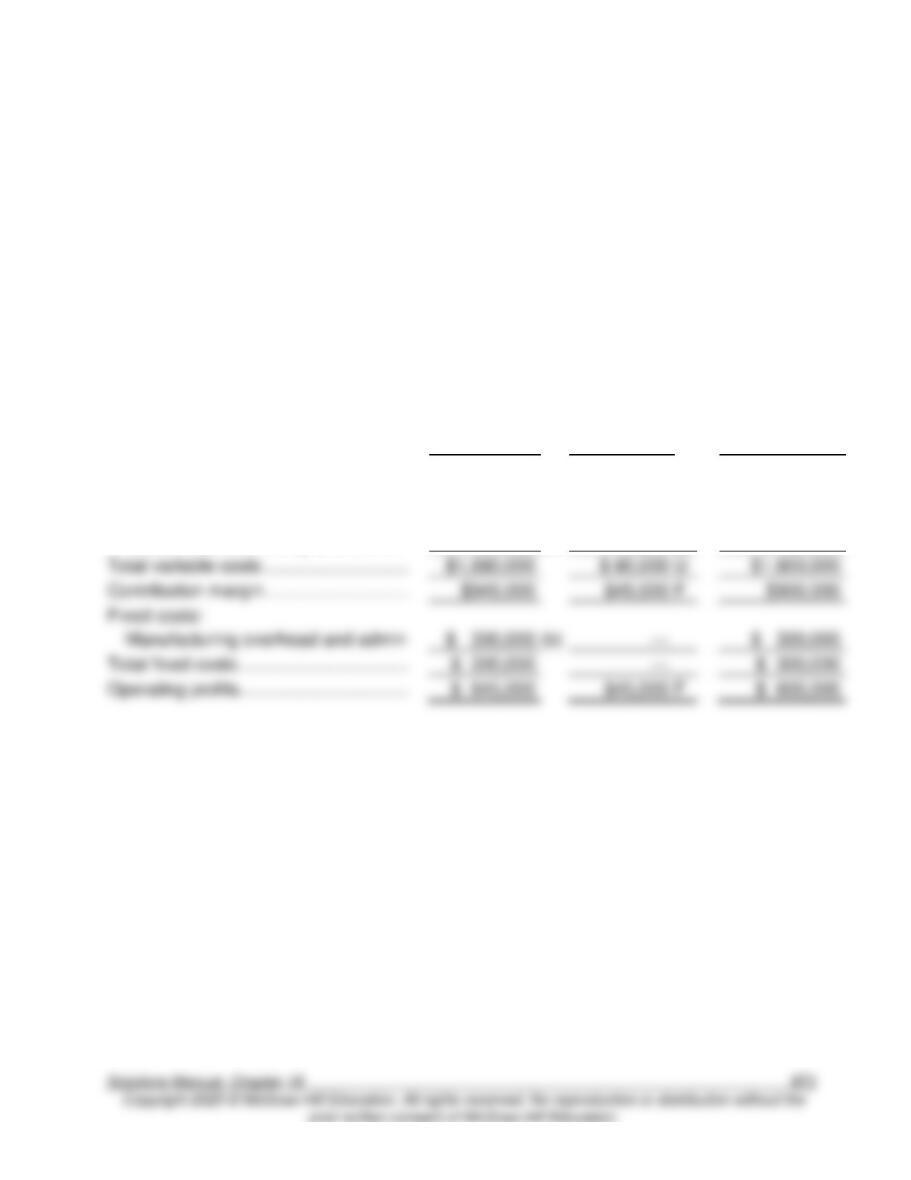
16–29. (30 min.) Profit Variance Analysis: Osage, Inc.
Actual
(based on
450,000
units)
Manufacturing
Variances
Marketing and
Administrative
Variances
Sales Price
Variance
Flexible
Budget
(based on
450,000
units)
Sales
Activity
Variance
Master
Budget
(based on
480,000
units)
Sales revenue …………….
$4,968,000
$468,000 F
$4,500,000
$300,000 U
$4,800,000
Materials ……………………
1,440,000
$90,000 U
1,350,000
90,000 F
1,440,000
Direct labor …………………
276,000
39,000 F
315,000
21,000 F
336,000
Variable overhead ……….
674,400
89,400 U
585,000
39,000 F
624,000
Variable marketing and
administrative ………….
468,000
$18,000 U
450,000
30,0000 F
480,000
Total variable costs ……..
$2,880,000
Contribution margin ……..
$468,000 F
$1,800,000
$120,000 U
1,920,000
Fixed costs:
Marketing ………………..
288,000
288,000
Administrative ………….
204,000
Total fixed costs ………….
$1,428,000
Operating profits………….
$ 628,800
$468,000 F
$120,000 U
$ 492,000
16–30. (20 min.) Sales Activity Variance: Slacker & Sons.
a. 157,500 actual units sold.
Flexible budget revenue = $2,500,000 + $125,000 = $2,625,000, which is a 5%
increase. Note that as a budgeted amount, the sales price is the same between the
master budget and the flexible budget.
Therefore, actual sales units = 150,000 × 1.05 = 157,500.
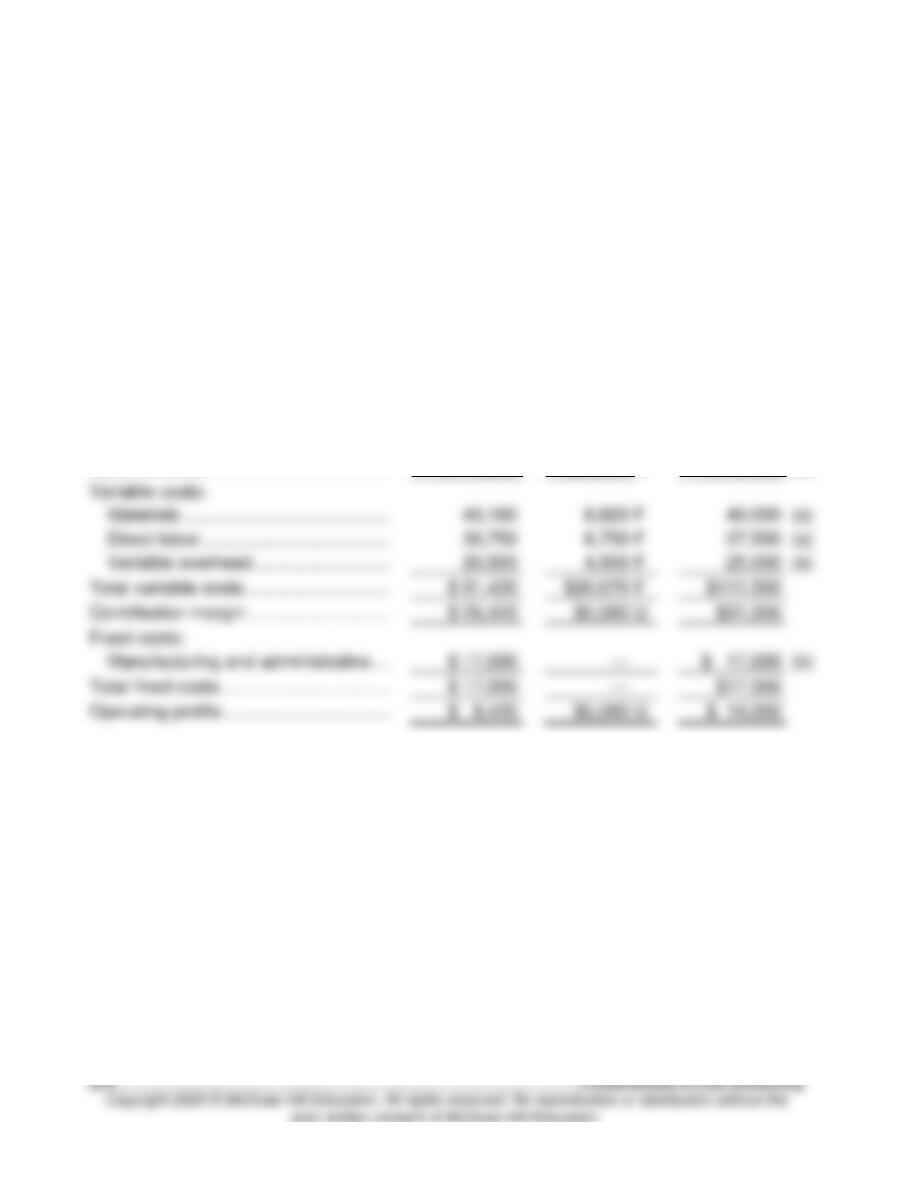
b. Flexible Budget.
Flexible
Budget
(based on
157,500 units
actual sales)
Sales Activity
Variance
Master Budget
(based on
150,000 units
budgeted
sales)
Sales revenue …………………………..…..
$2,625,000
(a)
$125,000
F
$2,500,000
Variable costs:
Materials ……………………………………
892,500
(a)
42,500
U
850,000
Direct labor ………………………………..
656,250
(a)
31,250
U
625,000
Variable manufacturing and admin ..
131,250
(a)
6,250
U
125,000
Total variable costs ………………………..
$1,680,000
U
$1,600,000
Contribution margin ………………………..
$945,000
F
Manufacturing overhead and admin
(b)
$ 300,000
Total fixed costs …………………………….
Operating profits …………………………….
$ 645,000
F
Notes:
a. 5% greater than master budget.
b. No change, because these are fixed costs.
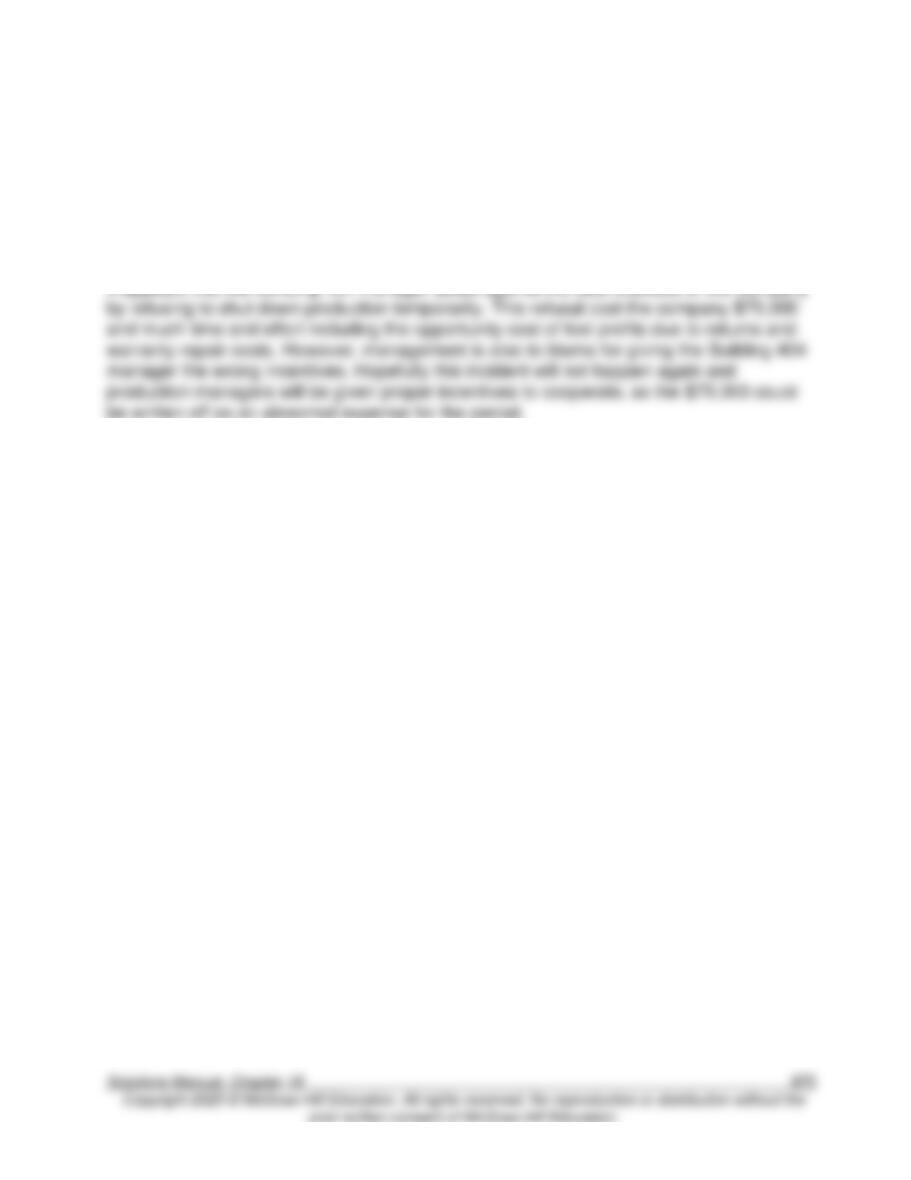
16–31. (20 min.) Sales Activity Variance: Rio Vista Company.
a. 15,000 units budgeted sales.
Master budget variable overhead = $20,500 + $4,500 = $25,000. (Because the variance is
favorable, the actual variable overhead was less than the master budget variable
overhead.) Therefore, actual production was 18% (=$4,500 ÷ $25,000) below master
budget production.
Budgeted units = 12,300 = 15,000 × 0.82.
Flexible
Budget
(based on
12,300 units
actual sales)
Sales Activity
Variance
Master Budget
(based on 15,000
units budgeted
sales)
(a)
(a)
(b)
Notes:
a. Equal to flexible budget amounts multiplied by (15,000 ÷ 12,300).
b. No change, because these are fixed costs.
16–32. (15 min.) Assigning Responsibility: Wallace Manufacturing.
Answers will vary. This situation is a normal part of a production department’s business
and would probably be charged to the production department. In the future, it would be
beneficial for the production department to be able to rely on the purchasing department’s
work with reasonable assurance. The purchasing department should be charged for the
rework if the mistake was due to negligence on the part of the purchasing department to
give them incentives to do the job right.
16–33. (15 min.) Assigning Responsibility: Davidson Communications.
16–34. (30 min.) Prepare Flexible Budget: Paynesville Corporation
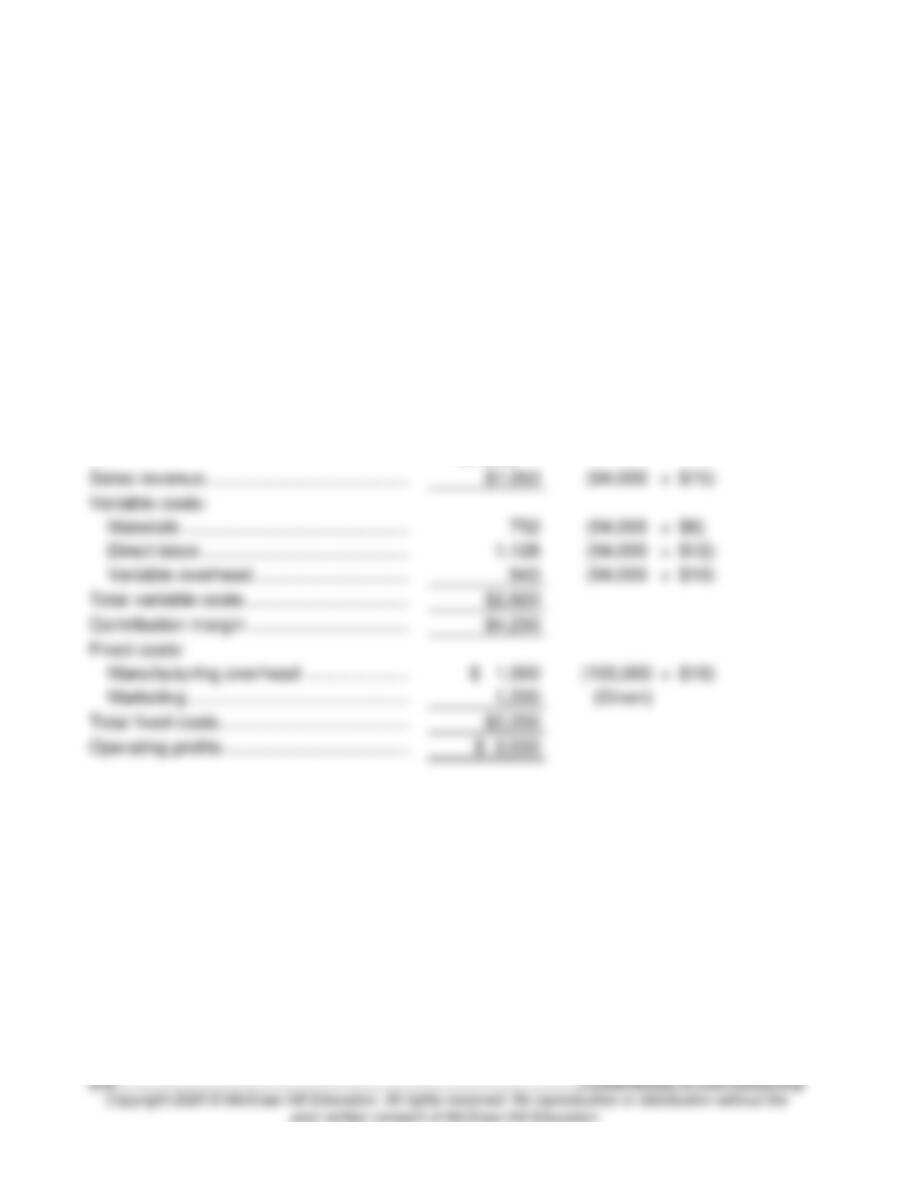
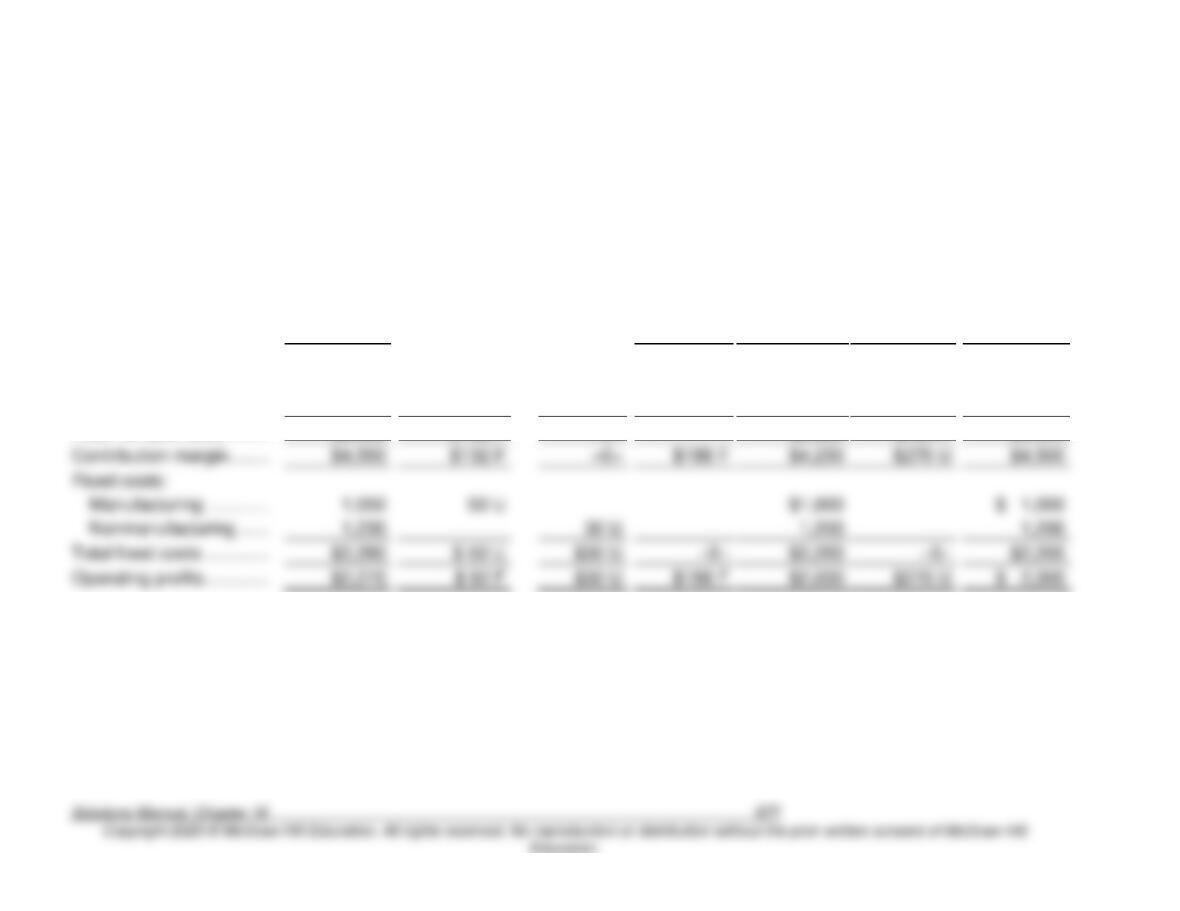
The first step is to determine the actual quantity sold. The standard variable overhead per
unit is $10 (= 0.5 hours × $20 per hour). The standard total variable cost for a unit is $30
(= $8 direct material + $12 direct labor + $10 variable overhead). Therefore, the standard
contribution margin is $45 per unit (= $75 sales price – $30 standard variable costs).
The sales activity variance was $270,000 unfavorable, so the company must have sold
6,000 units (= $270,000 ÷ $45) fewer than the master budget level of 100,000. Actual
sales volume was 94,000 units (= 100,000 – 6,000).
Flexible
Budget
(based on
actual of
94,000 units)
(thousands of
dollars)
Calculations
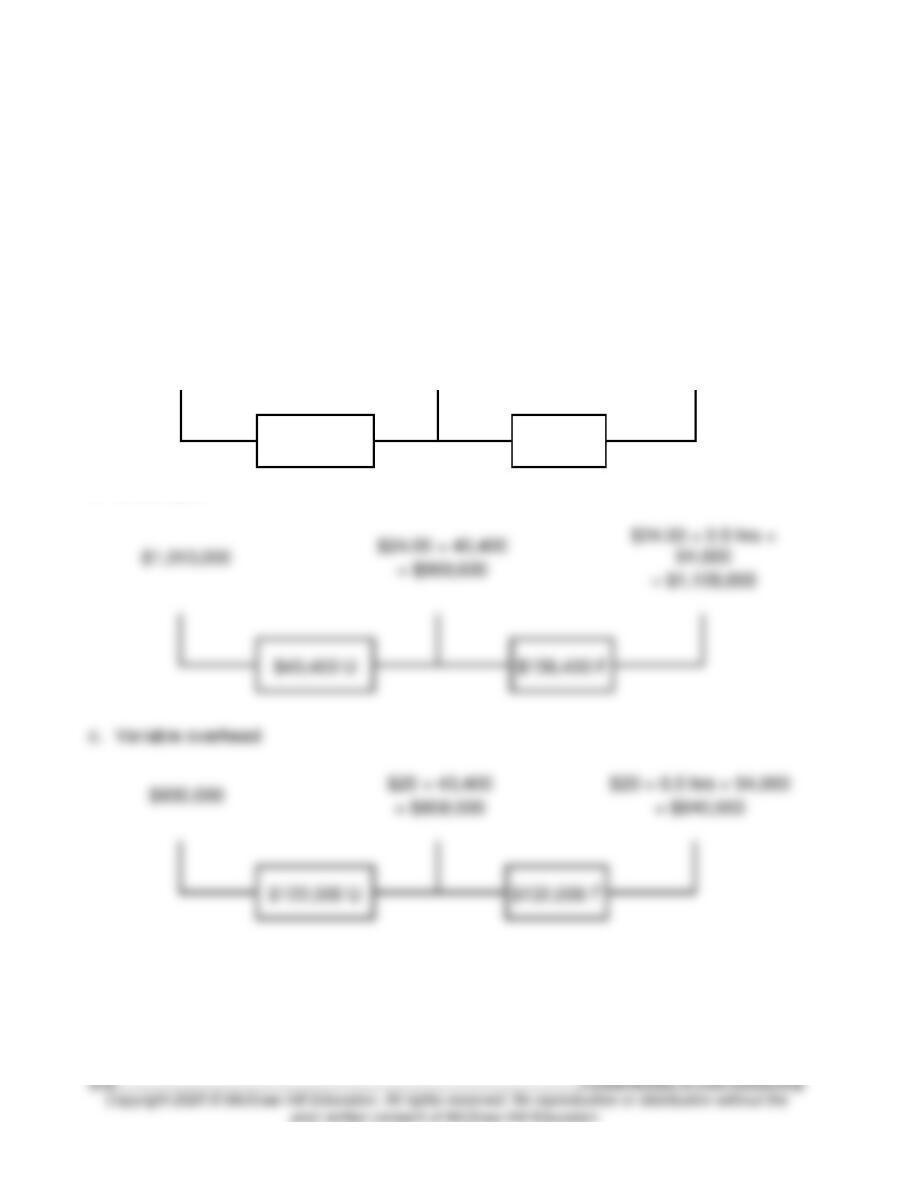
16–35. (30 min.) Profit Variance Analysis: Paynesville Corporation.
Note: In thousands of dollars
Actual
(based on
94,000 units)
Manufacturing
Variances
Non-
Manufacturing
Variances
Sales Price
Variance
Flexible
Budget
(based on
94,000 units)
Sales
Activity
Variance
Master
Budget
(based on
100,000
units)
Sales revenue …………….
$7,238
$188 F
$7,050
$450 U
$7,500
Materials …………………….
748
$ 4 F
752
48 F
800
Direct labor …………………
1,010
118 F
1,128
72 F
1,200
Variable overhead ……….
930
10 F
940
60 F
1,000
Contribution margin ……..
$4,550
$188 F
$4,230
$270 U
$4,500
Fixed costs:
Manufacturing …………
1,050
$1,000
Total fixed costs ………….
$2,280
$2,200
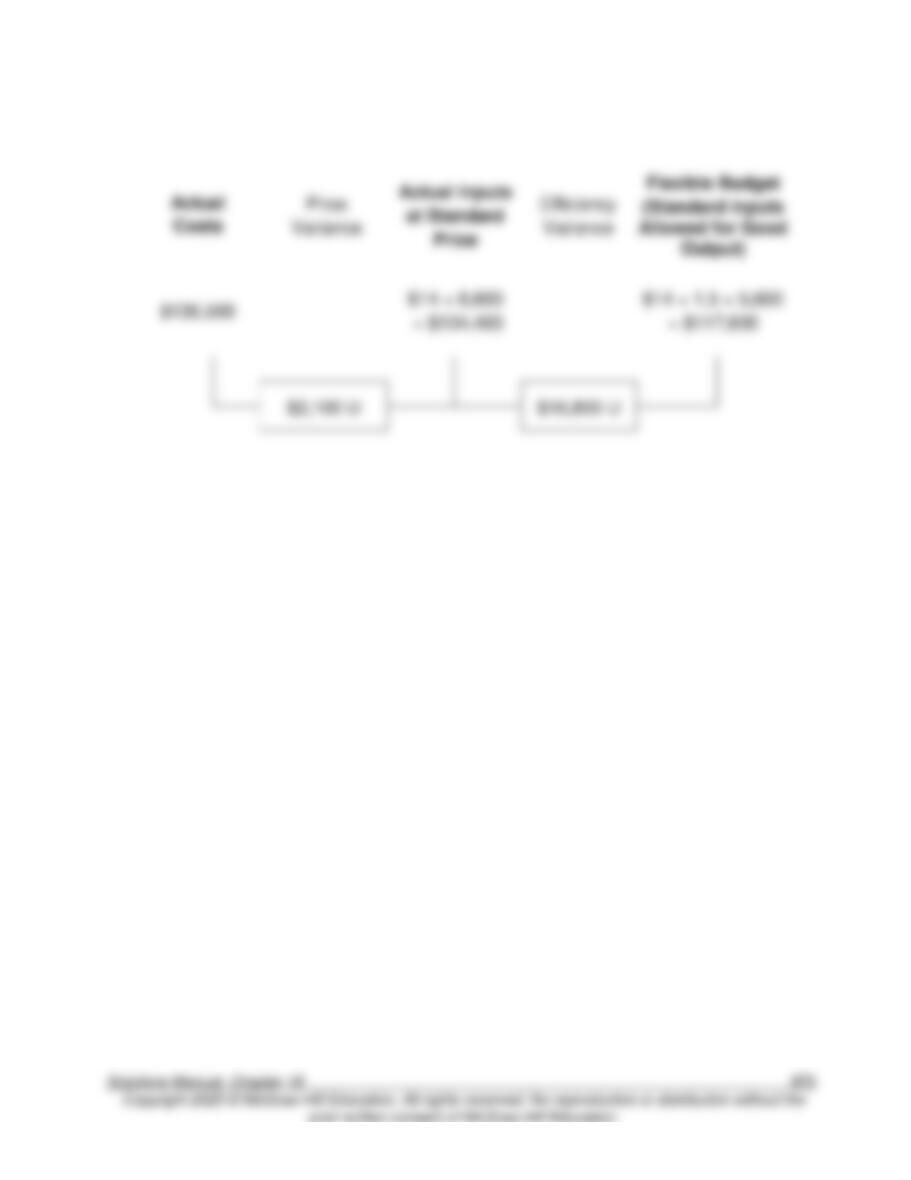
16–36. (30 min.) Variable Cost Variances: Paynesville Corporation.
a. Direct materials:
Actual
Costs
Price
Variance
Actual Inputs
at Standard
Price
Efficiency
Variance
Flexible Budget
(Standard Inputs
Allowed for Good
Output)
(AP × AQ)
(SP × AQ)
(SP × SQ)
$748,000
$4 × 176,000
= $704,000
$2 × 4 lbs × 94,000
= $752,000
$44,000 U
$48,000 F
b. Direct labor:
16–37. (10 min.) Variable Cost Variances.