CHAPTER 15 Financial Statement Analysis
Ex. 15–14
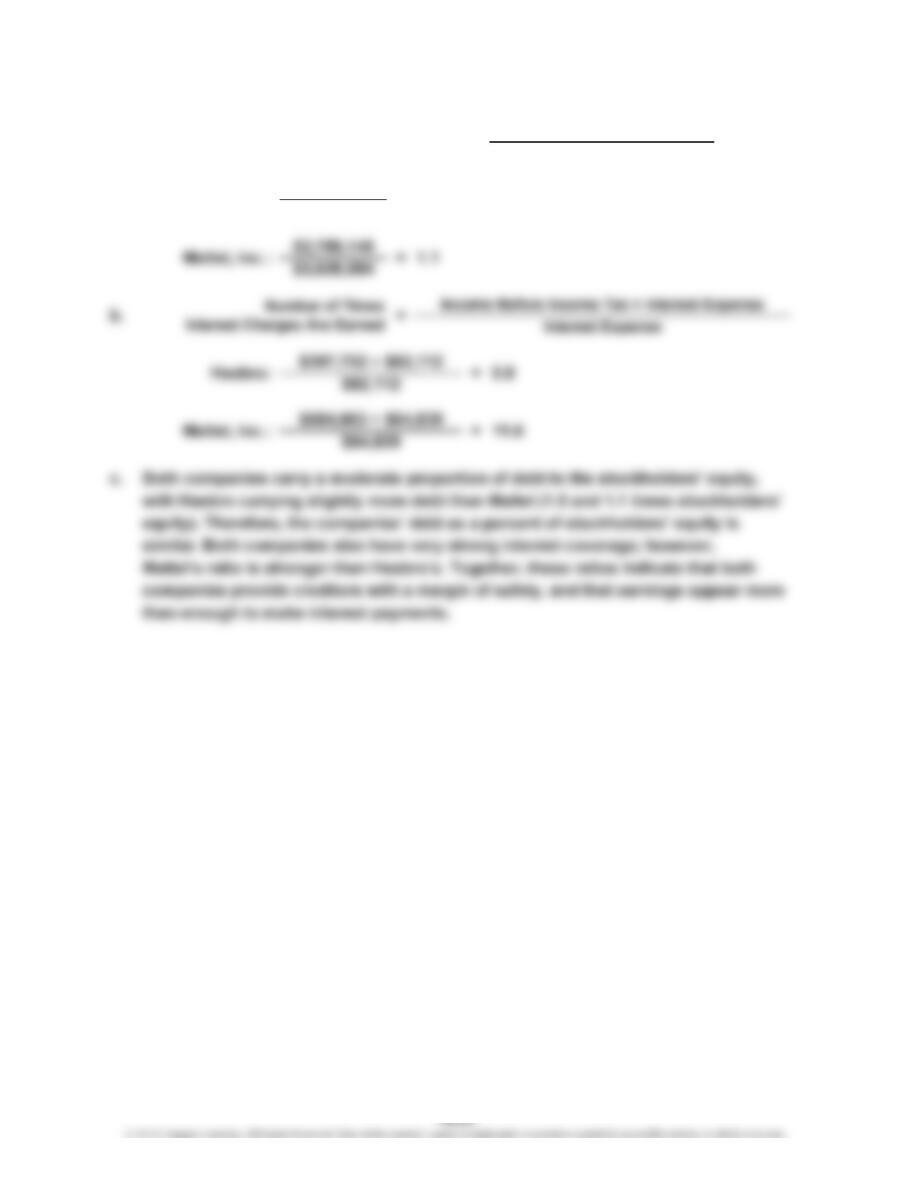
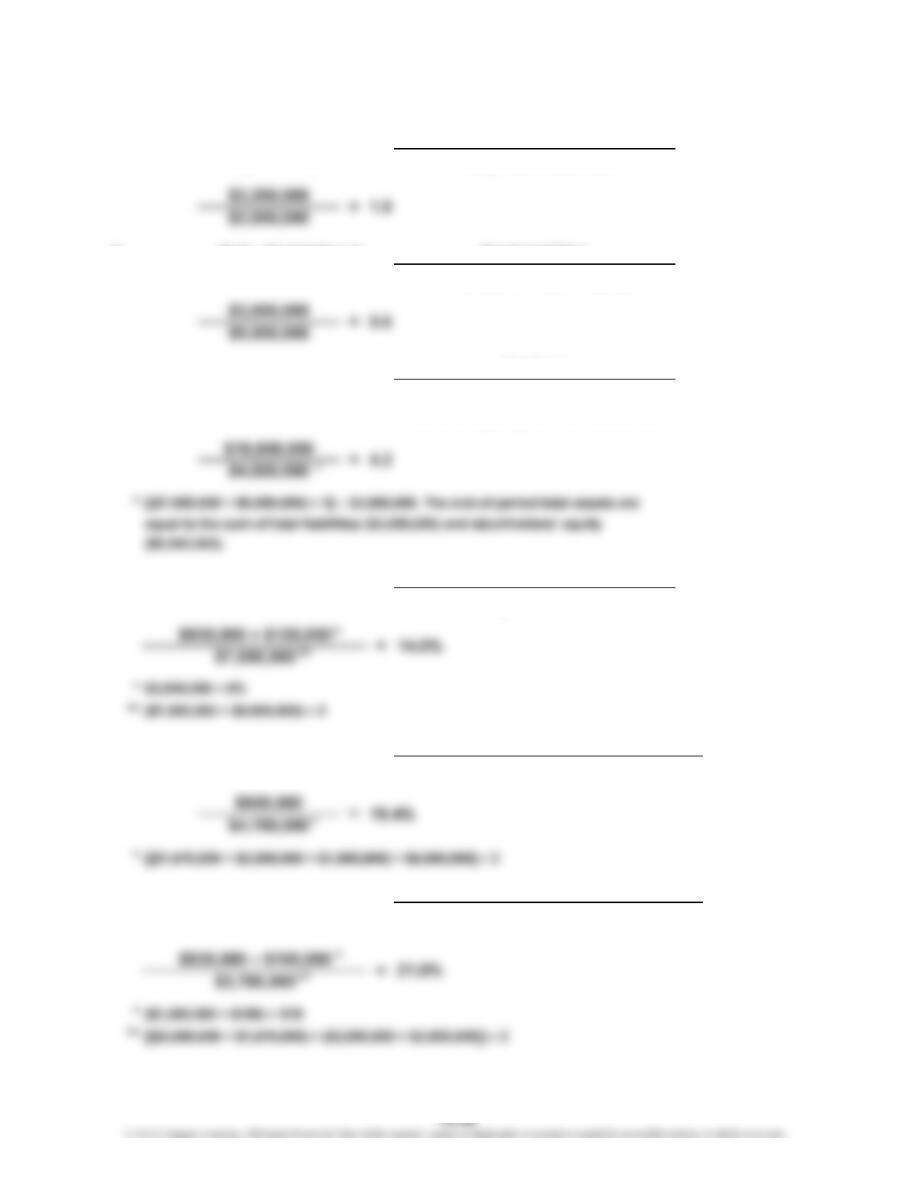
Hasbro: $2,477,806 = 1.5
$1,615,420
a. Ratio of Liabilities to Stockholders’ Equity = Total Liabilities
Total Stockholders’ Equity
CHAPTER 15 Financial Statement Analysis
Ex. 15–15
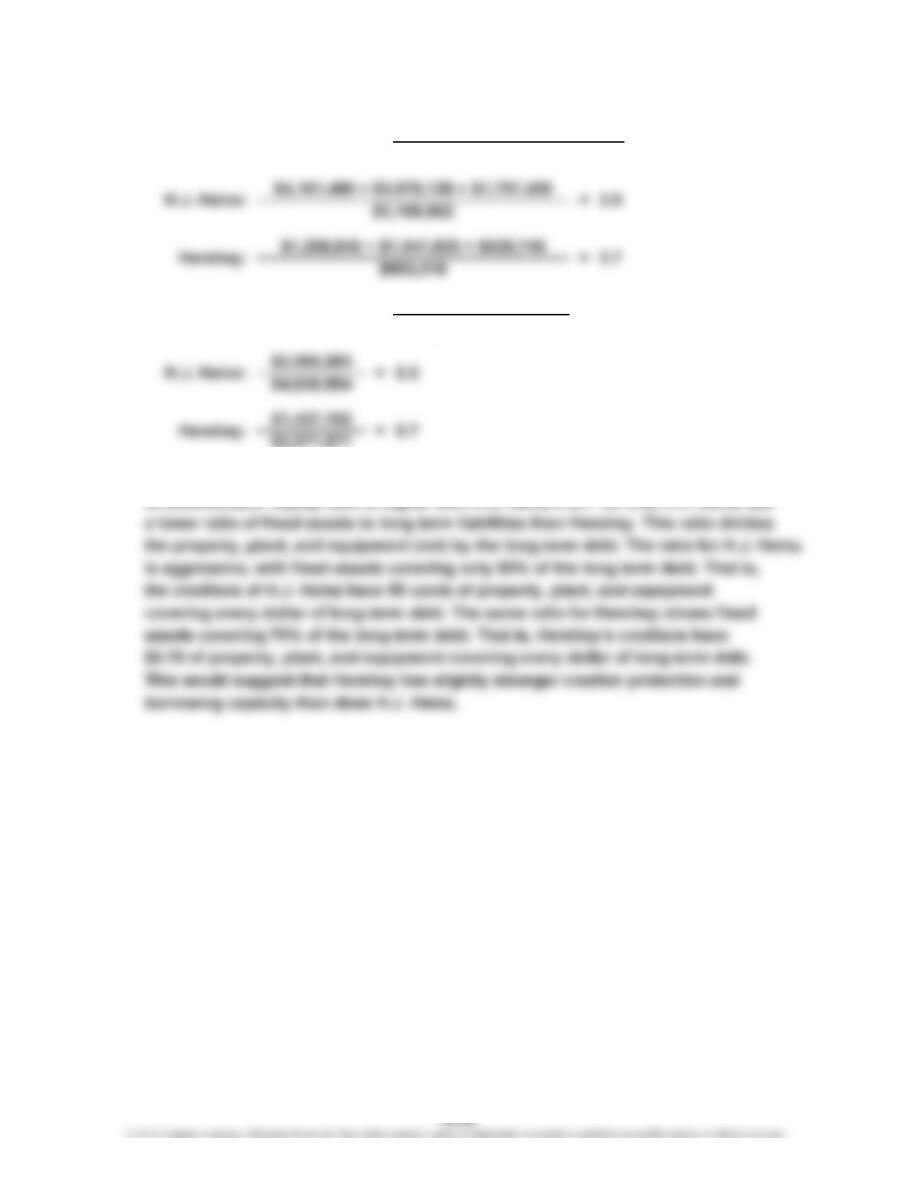
c. Hershey uses more debt than does H.J. Heinz. As a result, Hershey’s total liabilities
to stockholders’ equity ratio is higher than H.J. Heinz’s (3.7 vs. 2.9). H.J. Heinz has
Fixed Assets (net)
Long-Term Liabilities
b. Ratio of Fixed Assets to
Long-Term Liabilities =
a. =
Ratio of Liabilities to
Stockholders’ Equity
Total Liabilities
Total Stockholders’ Equity
CHAPTER 15 Financial Statement Analysis
Ex. 15–16
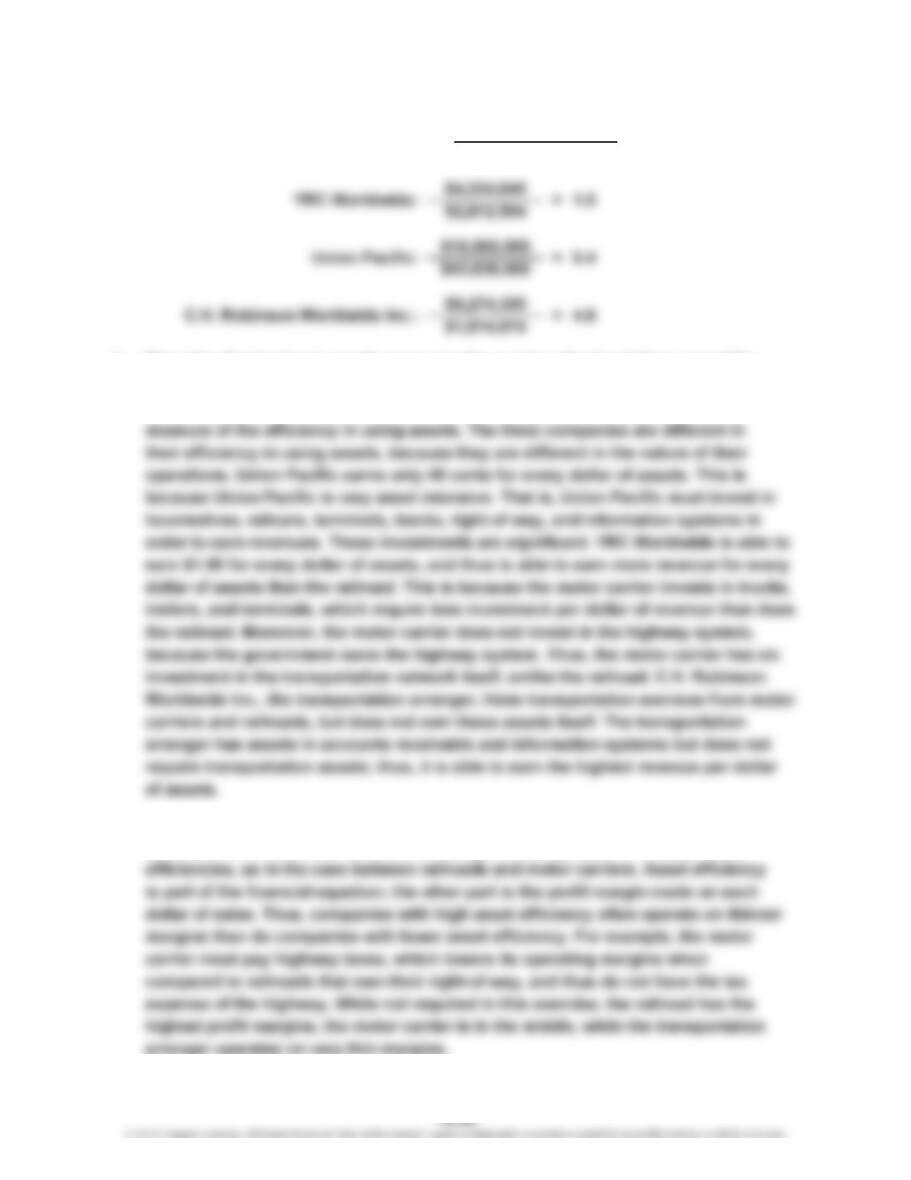
b. The ratio of net sales to assets measures the number of sales dollars earned for
each dollar of assets. The greater the number of sales dollars earned for every
dollar of assets, the more efficient a firm is in using assets. Thus, the ratio is a
Note to Instructors: Students may wonder how asset-intensive companies
overcome their asset efficiency disadvantages to competitors with better asset
a. =Net Sales
Average Total Assets
Ratio of Net Sales to Total Assets
CHAPTER 15 Financial Statement Analysis
Ex. 15–17
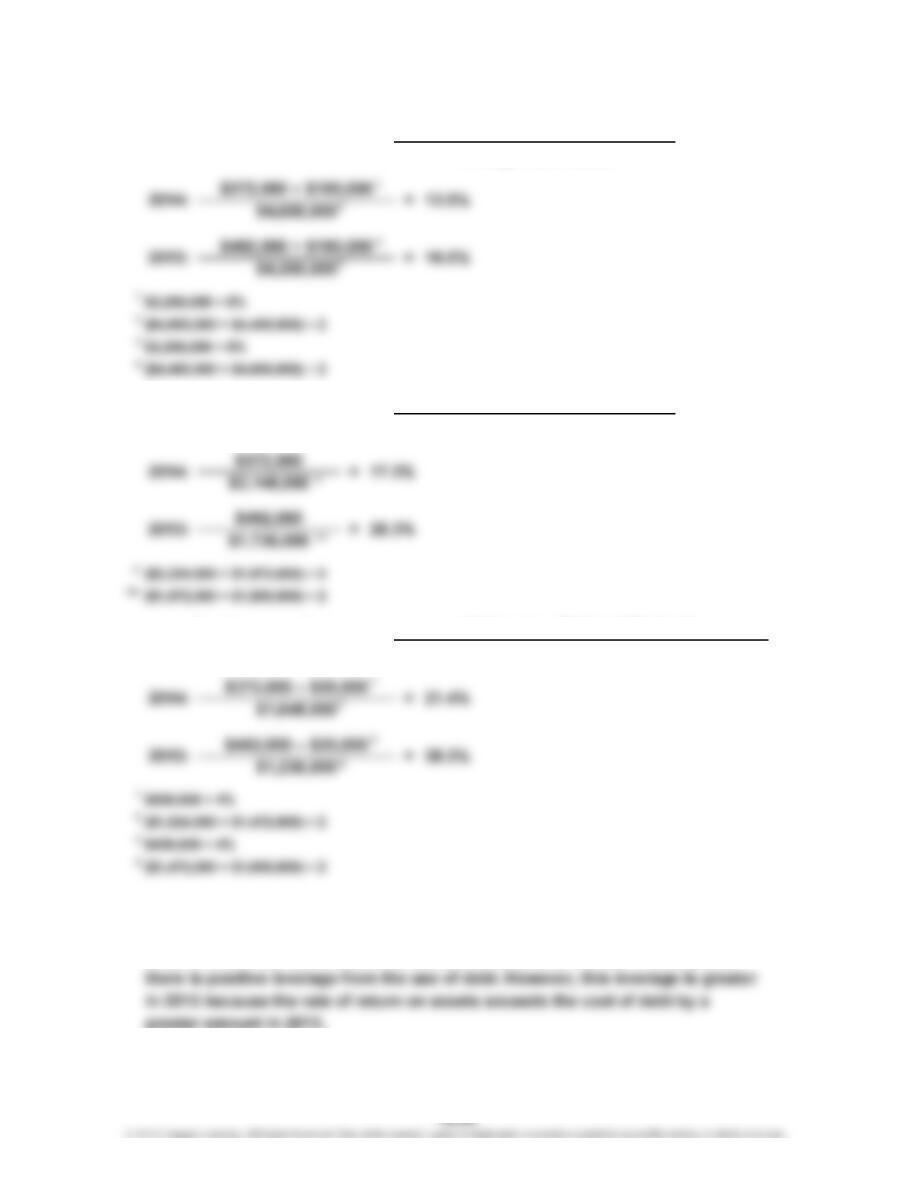
b. The profitability ratios indicate that Robinson Inc.’s profitability has deteriorated.
Most of this change is from net income falling from $492,000 in 2013 to $372,000
in 2014. Since the rate of return on assets exceeds this amount in both years,
=
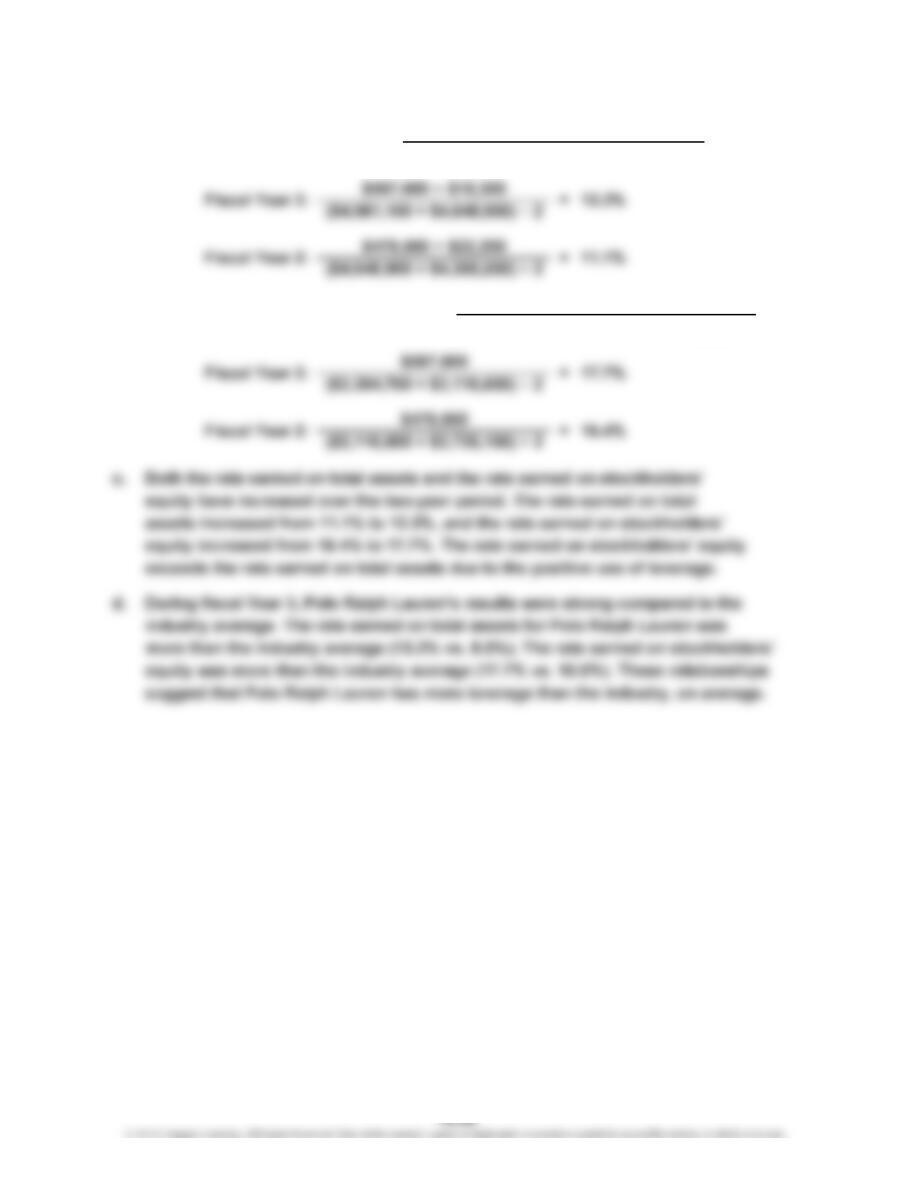
Rate Earned on
Stockholders’ Equity
Average Total Stockholders’ Equity
a. =
Rate Earned on Total Assets
Average Total Assets
Net Income + Interest Expense
Net Income
Rate Earned on Common
Stockholders’ Equity =Average Common Stockholders’ Equity
Net Income – Preferred Dividends
CHAPTER 15 Financial Statement Analysis
Ex. 15–18
b.
=Average Total Stockholders’ Equity
Net Income
a. =
Rate Earned on Total Assets Net Income + Interest Expense
Average Total Assets
Rate Earned on Stockholders’ Equity
CHAPTER 15 Financial Statement Analysis
Ex. 15–19
Rate Earned on Total Assets = Net Income + Interest Expense
Average Total Assets
=Net Income
Average Total Stockholders’ Equity
c. Ratio of Net Sales to Assets = Average Total Assets
d.
b. Ratio of Liabilities to
Stockholders’ Equity =Total Liabilities
Total Stockholders’ Equity
e.
f. Rate Earned on Common
Stockholders’ Equity
Rate Earned on
Stockholders’ Equity
=
Net Sales
a. =
Ratio of Fixed Assets to
Long-Term Liabilities Long-Term Liabilities
Fixed Assets (net)
(excluding long-term investments)
Net Income – Preferred Dividends
Average Common Stockholders’ Equity
CHAPTER 15 Financial Statement Analysis
Ex. 15–20
Preferred Dividends
Net Income
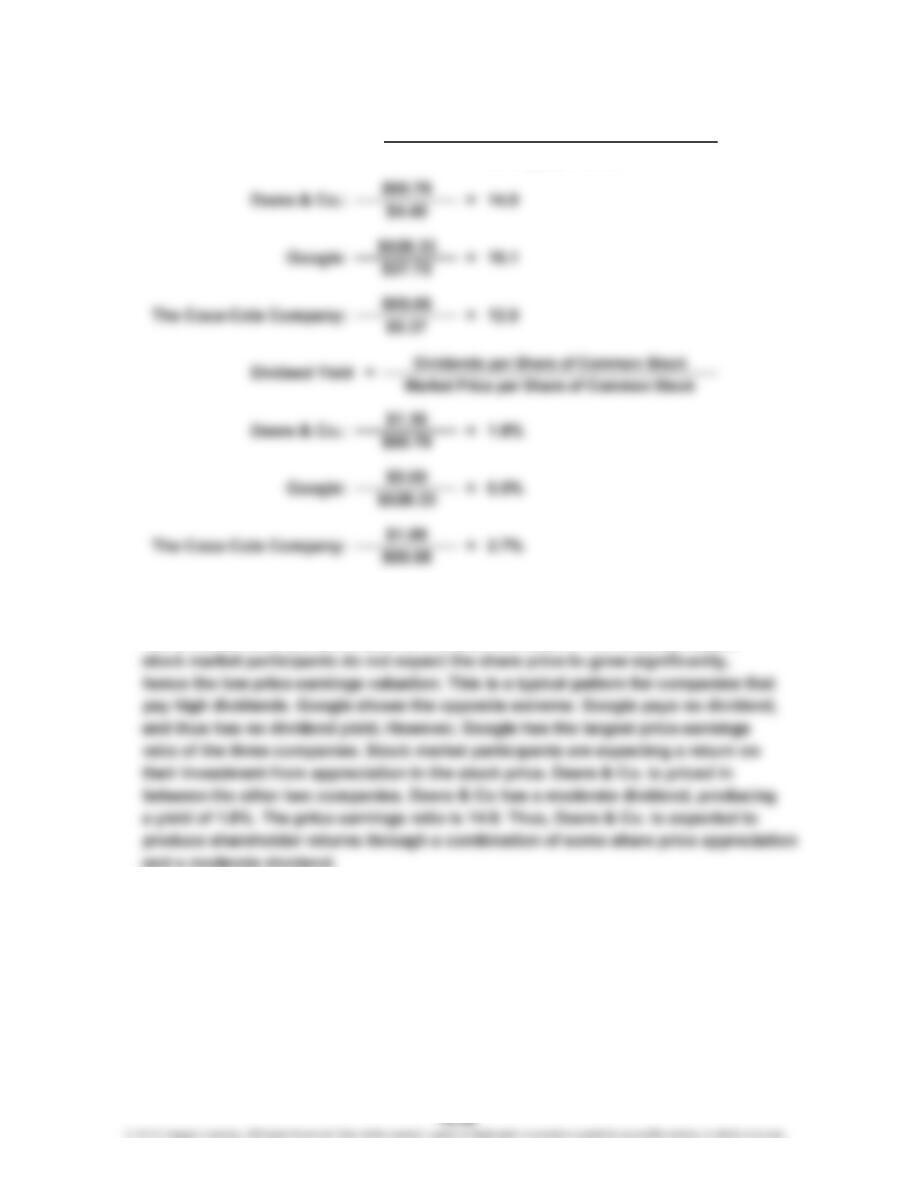
Dividends per Share of Common Stock
Market Price per Share of Common Stock
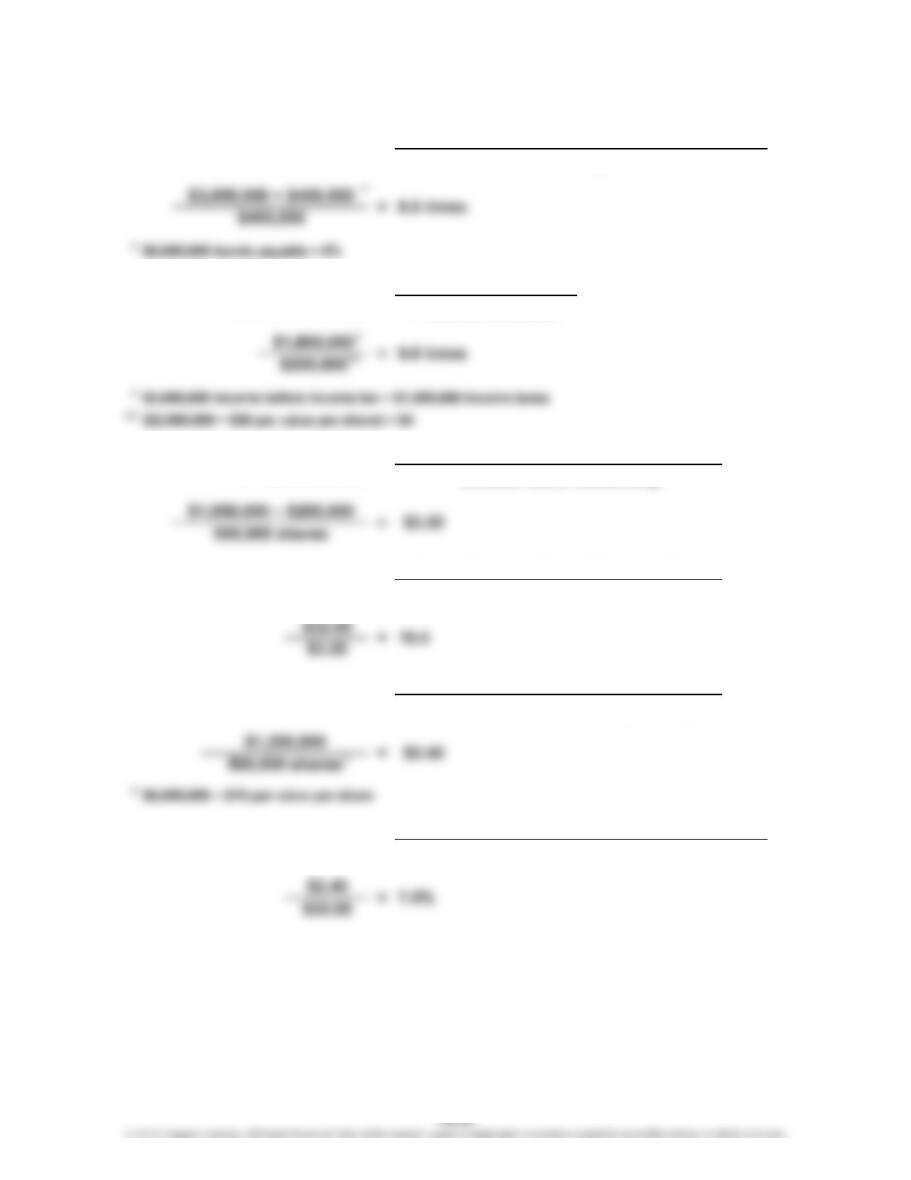
a. =
Number of Times Bond
Interest Charges Are Earned
Market Price per Share of Common Stock
Income Before Income Tax + Interest Expense
c. Earnings per Share
on Common Stock =
Interest Expense
Net Income – Preferred Dividends
Common Stock Outstanding
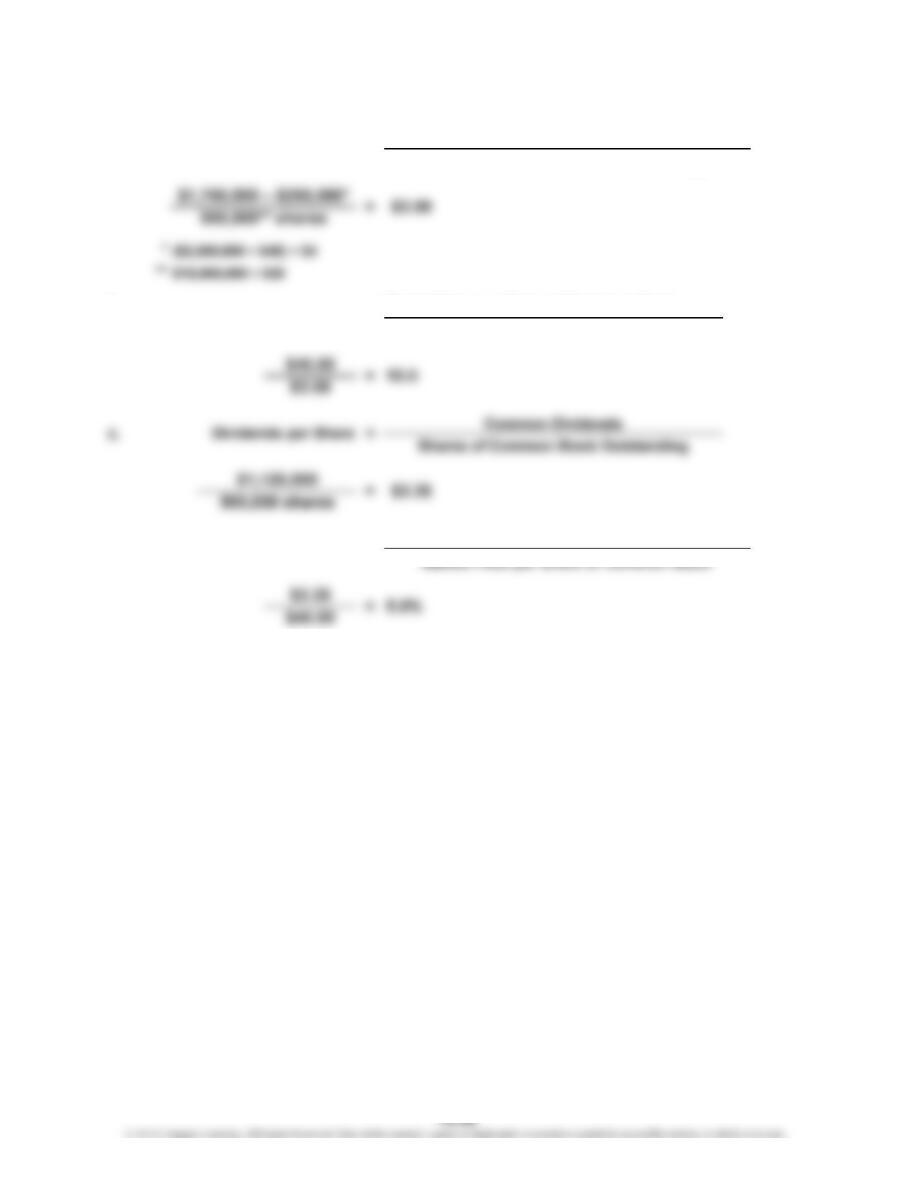
f. Dividend Yield
=
e.
b. Number of Times Preferred
Dividends Are Earned =
d. =
Price-Earnings Ratio
Dividends per Share
of Common Stock =
Earnings per Share
Dividends on Common Stock
Shares of Common Stock Outstanding
CHAPTER 15 Financial Statement Analysis
Ex. 15–21
Market Price per Share of Common Stock
a. =Earnings per Share
b.
Price-Earnings Ratio = Earnings per Share of Common Stock
d. Dividend Yield
Market Price per Share of Common Stock
Net Income – Preferred Dividends
Shares of Common Stock Outstanding
=Dividends per Share of Common Stock
CHAPTER 15 Financial Statement Analysis
Ex. 15–22
b. Coca-Cola has a large dividend yield, but the smallest price-earnings ratio. Stock
market participants value Coca-Cola common stock on the basis of its dividend.
The dividend is an attractive yield at this date. Because of this attractive yield,
a. =Price-Earnings Ratio Earnings per Share
Market Price per Share of Common Stock
CHAPTER 15 Financial Statement Analysis
Appendix Ex. 15–23
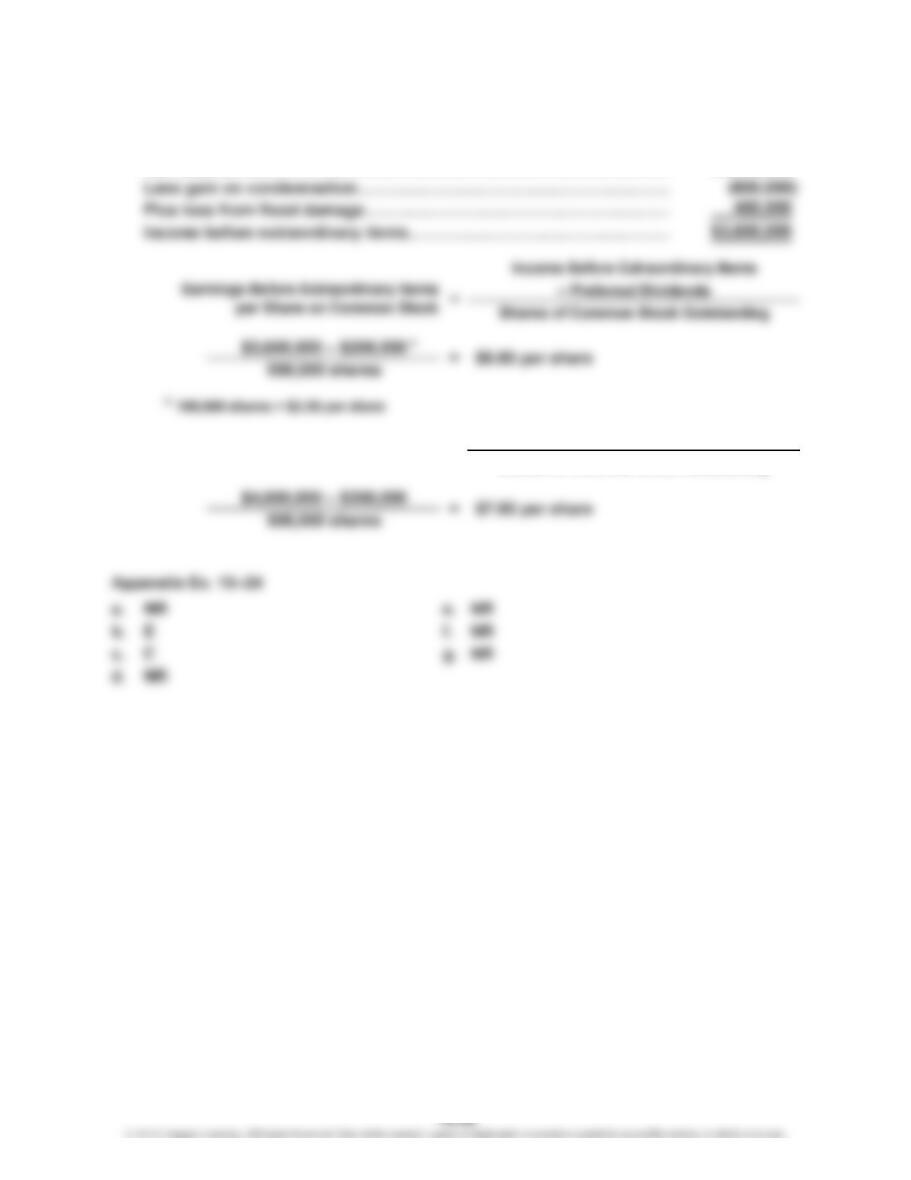
a. Earnings per share on income before extraordinary items:
Net income………………………………………………………………………
…
$4,000,000
=Net Income – Preferred Dividends
Shares of Common Stock Outstanding
b.
Earnings per Share on Common Stock
…
CHAPTER 15 Financial Statement Analysis
Appendix Ex. 15–25
a.
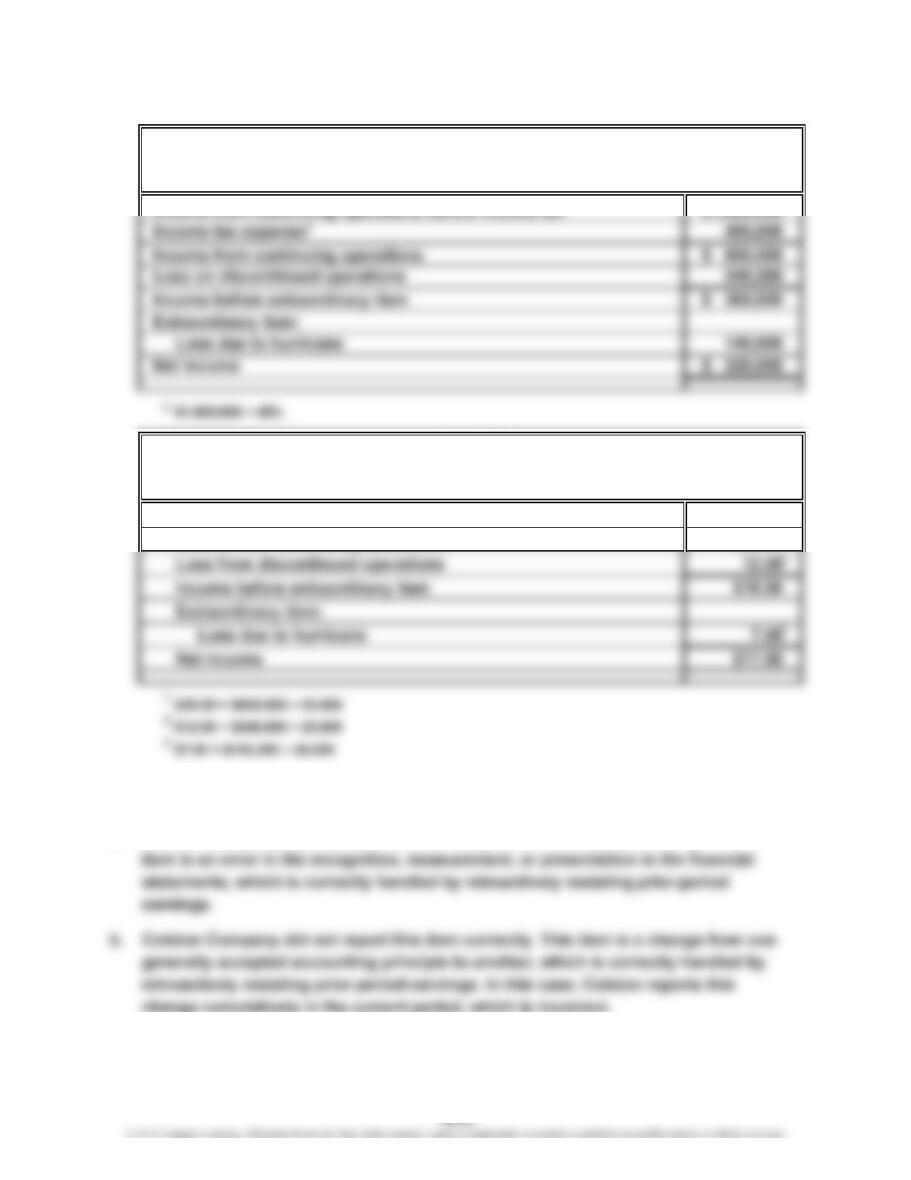
Income from continuing operations before income tax $1,000,000
b.
Earnings per common share:
Income from continuing operations $30.00
Appendix Ex. 15–26
a. Colston Company reported this item correctly in the financial statements. This
Partial Income Statement
For the Year Ended December 31, 2014
CRUZ, INC.
Partial Income Statement
For the Year Ended December 31, 2014
CRUZ, INC.
1
CHAPTER 15 Financial Statement Analysis
Prob. 15–1A
1.
2014 2013 Amount Percent
Sales $1,092,500 $950,000 $142,500 15.0%
Sales returns and allowances 57,500 50,000 7,500 15.0%
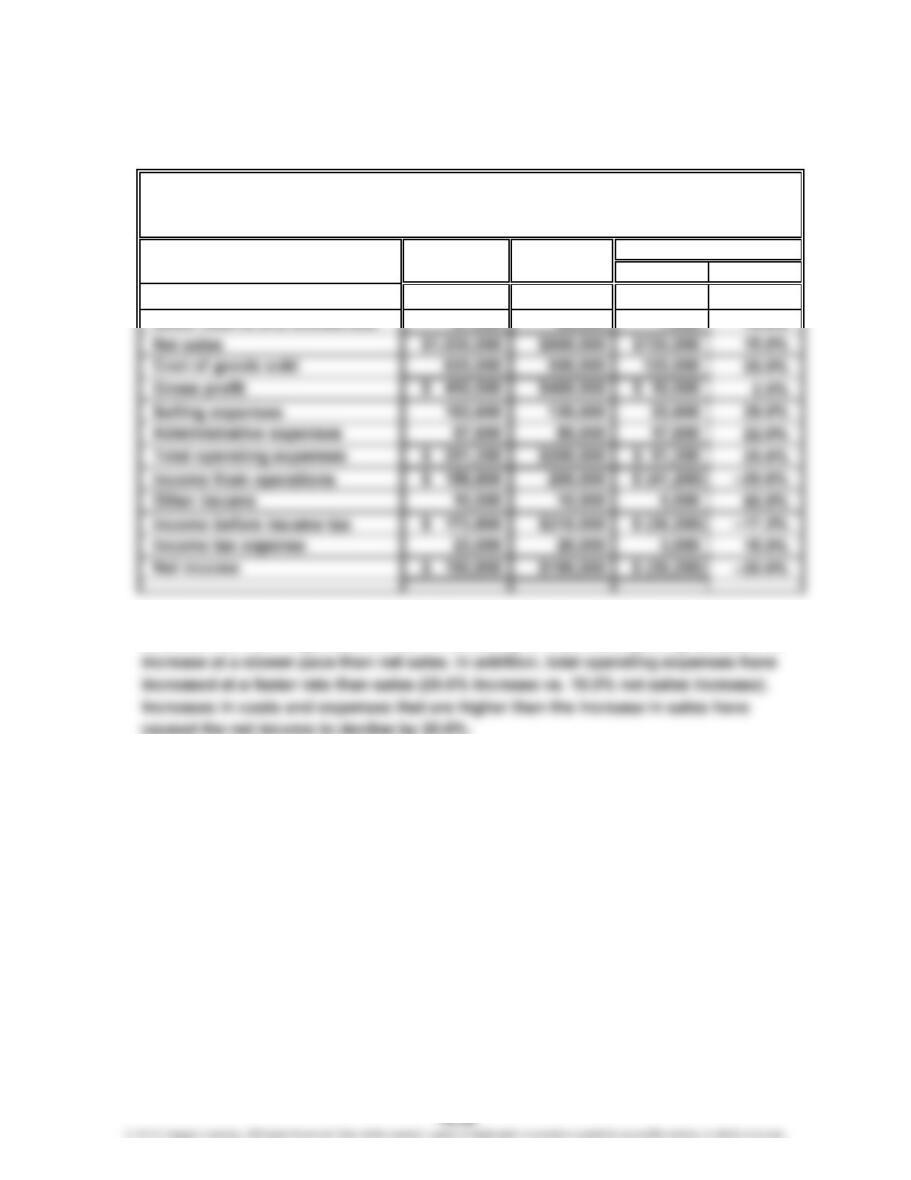
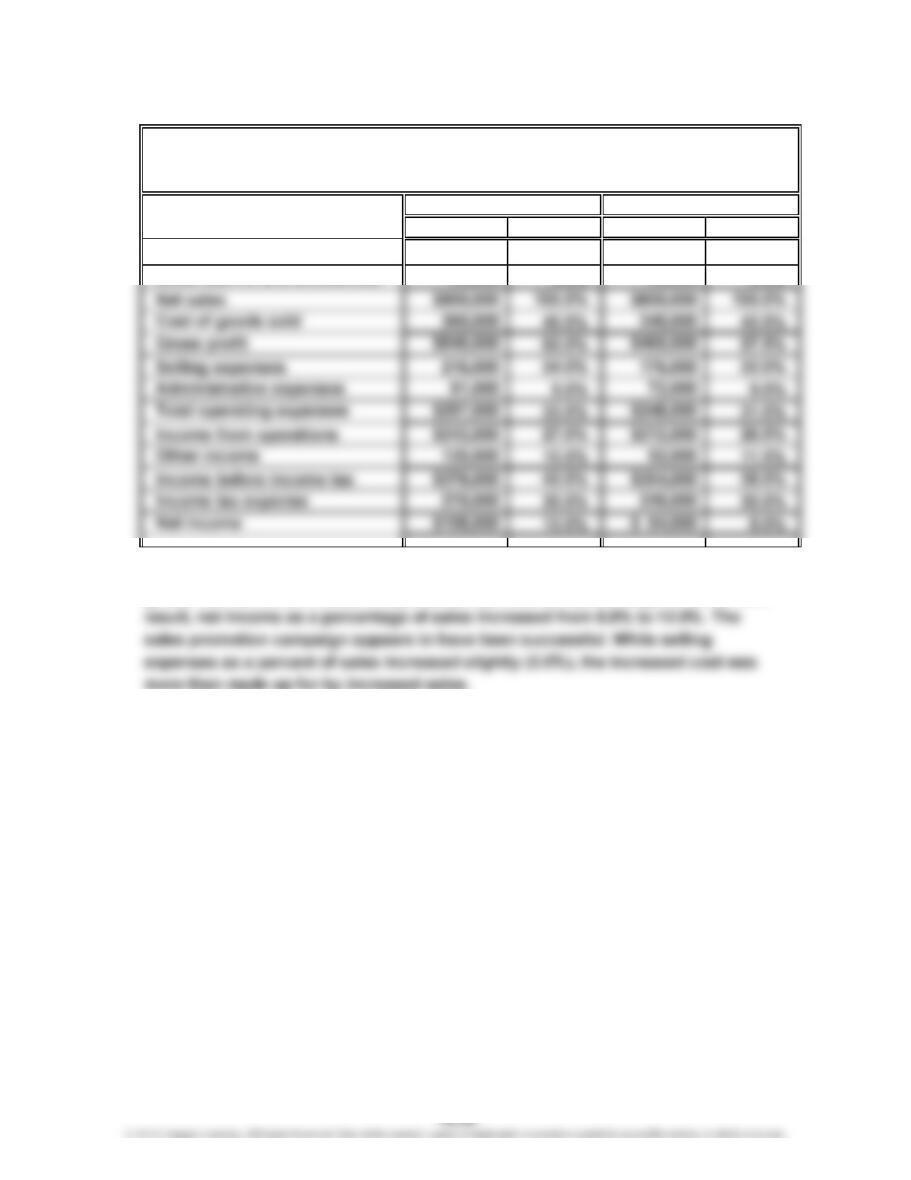
2. Net income has declined from 2013 to 2014. Net sales have increased by 15.0%;
however, the cost of goods sold has increased by 25.0%, causing the gross profit to
PROBLEMS
Increase (Decrease)
LINDELL COMPANY
Comparative Income Statement
For the Years Ended December 31, 2014 and 2013
CHAPTER 15 Financial Statement Analysis
Prob. 15–2A
1.
Amount Percent Amount Percent
Sales $922,500 102.5% $820,000 102.5%
Sales returns and allowances 22,500 2.5% 20,000 2.5%
2. The vertical analysis indicates that the costs other than selling expenses (cost of
goods sold and administrative expenses) improved as a percentage of sales. As a
2014 2013
KASAY COMPANY
Comparative Income Statement
For the Years Ended December 31, 2014 and 2013
CHAPTER 15 Financial Statement Analysis
Prob. 15–3A
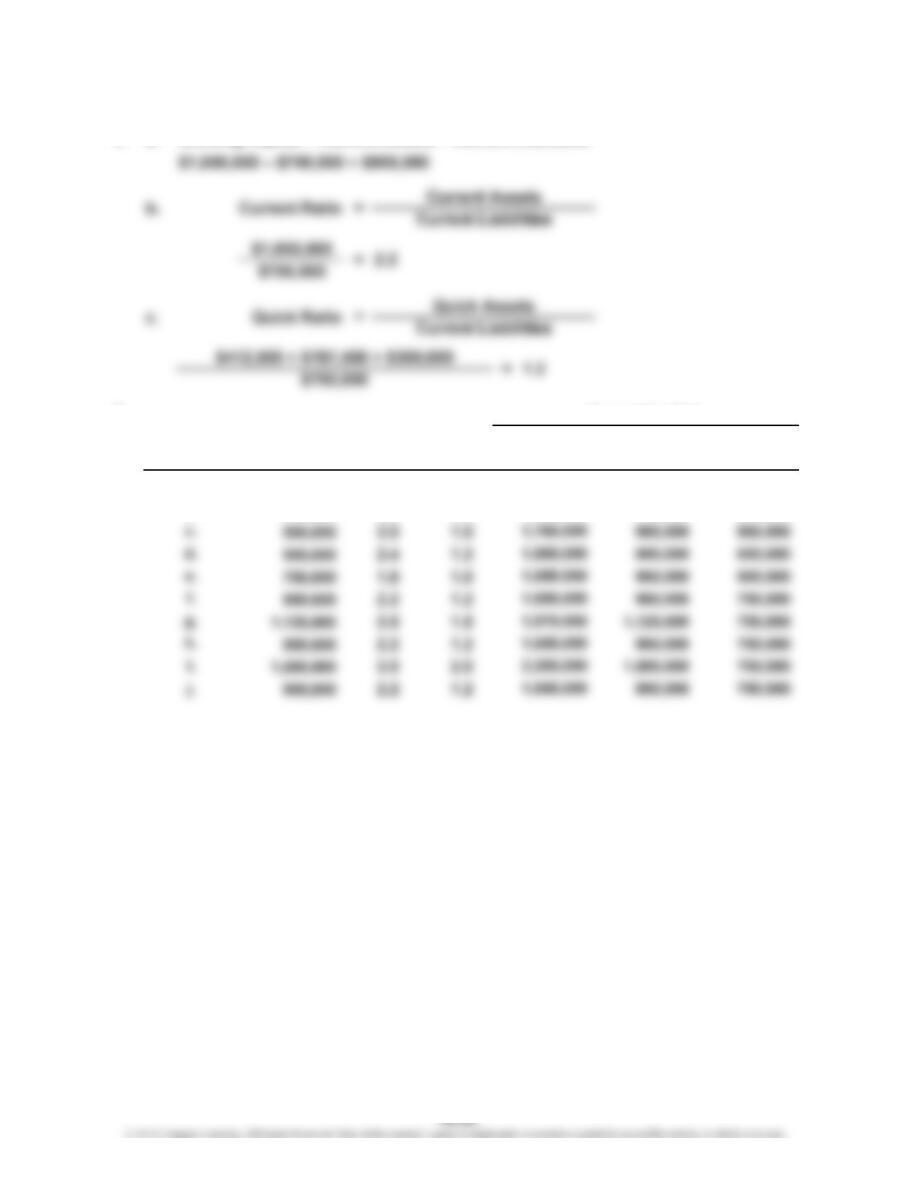
1. a. Working Capital = Current Assets – Current Liabilities
2.
Working Quick Current
Capital Assets Liabilities
$ 900,000 $ 900,000 $750,000
900,000 775,000 625,000
AssetsTransaction
Current
Ratio
Quick
Ratio
Current
b. 2.4 1.2 1,525,000
a. 2.2 1.2 $1,650,000
Supporting Data
CHAPTER 15 Financial Statement Analysis
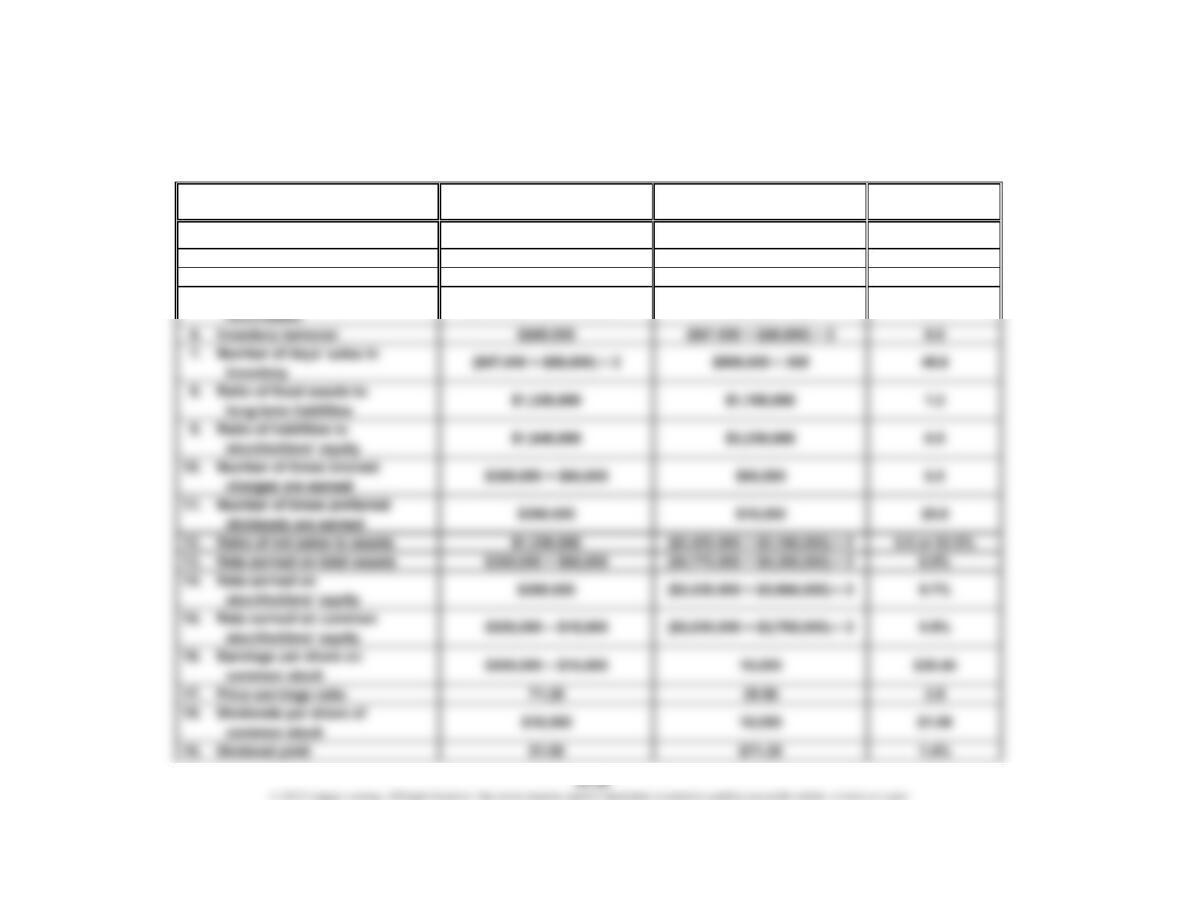
Prob. 15–4A
1. Working Capital: $1,100,000 – $440,000 = $660,000
Calculated
Numerator Denominator Value
2. Current ratio $1,100,000 $440,000 2.5
3. Quick ratio $880,000 $440,000 2.0
4. Accounts receivable turnover $1,200,000 ($130,000 + $110,000) ÷ 2 10.0
5. Number of days’ sales in
Ratio
($130,000 + $110,000) ÷ 2 $1,200,000 ÷ 365
36.5
CHAPTER 15 Financial Statement Analysis
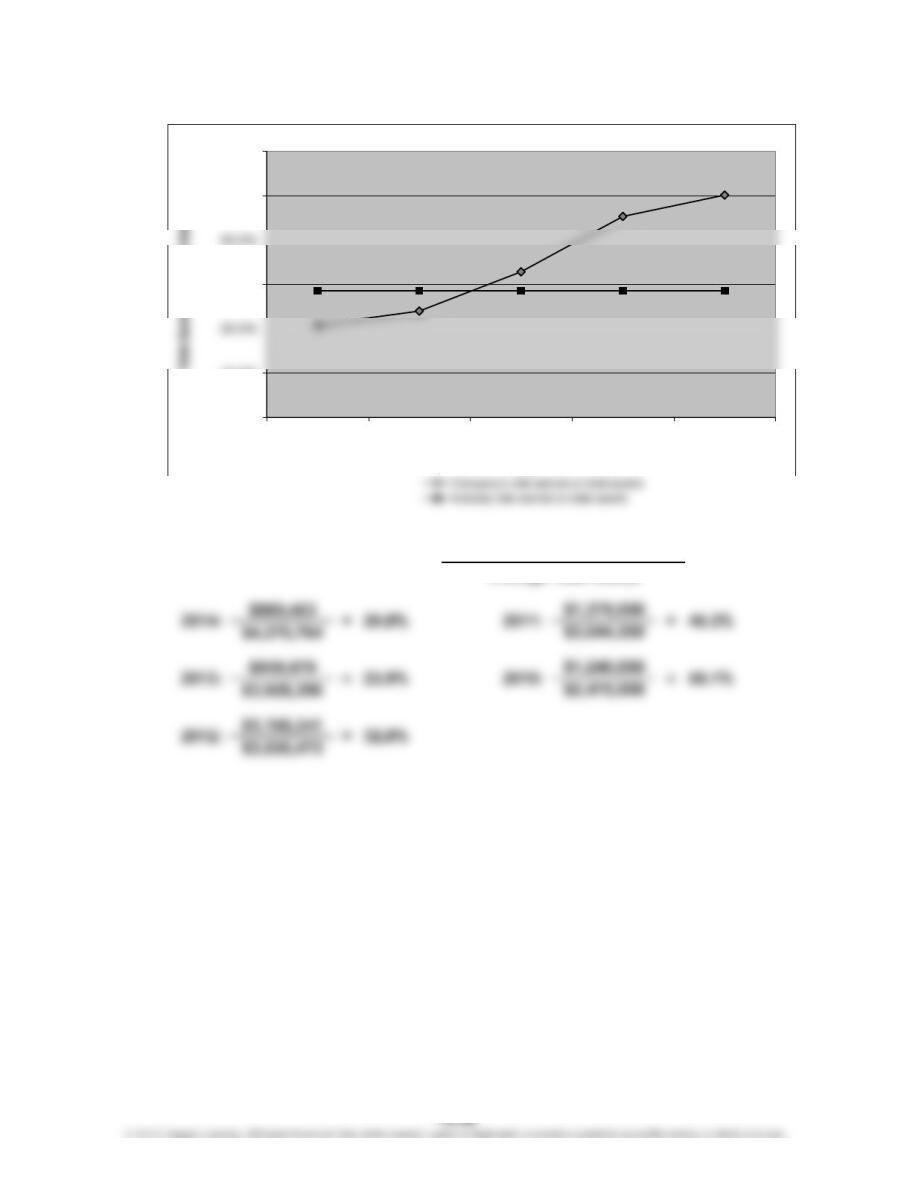
Prob. 15–5A
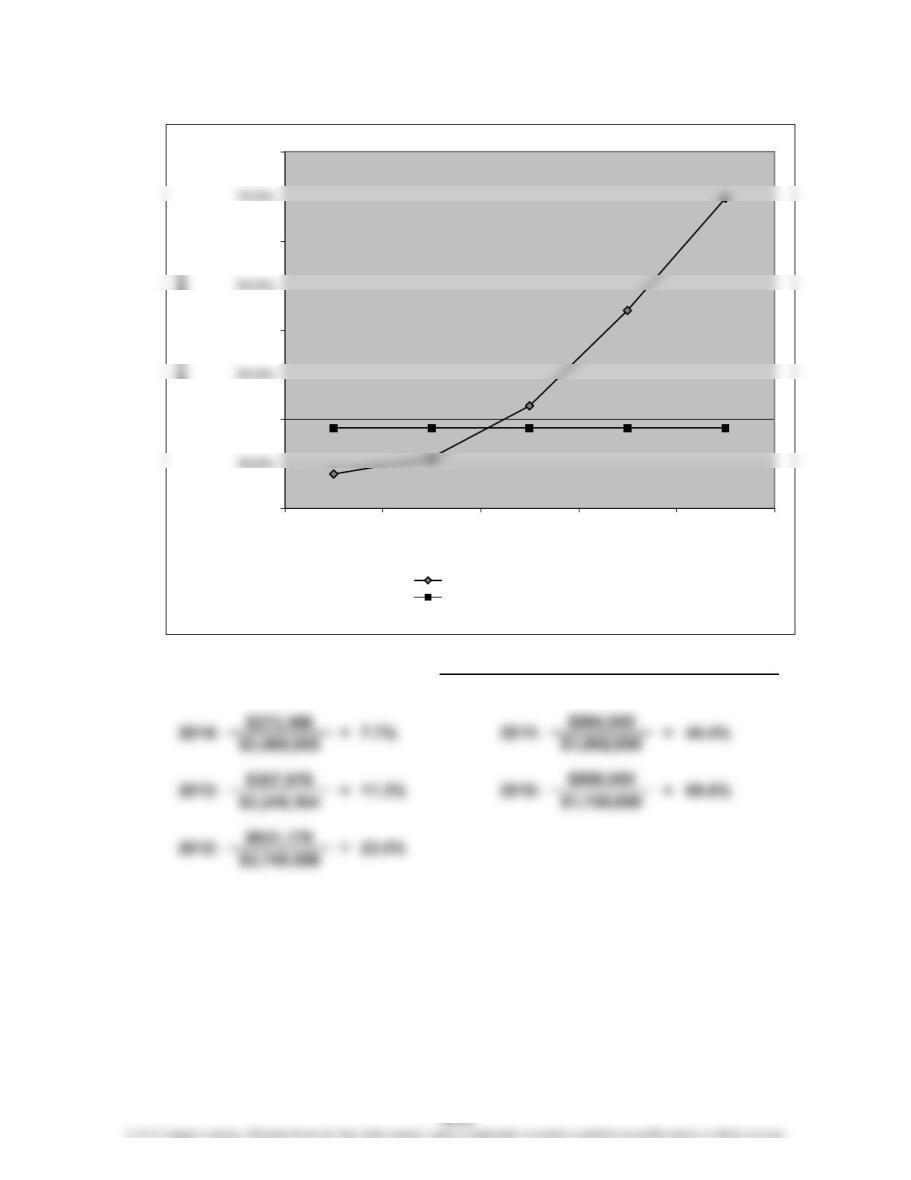
1. a.
Net Income + Interest Expense
Average Total Assets
Rate Earned on Total Assets =
0.0%
10.0%
30.0%
50.0%
60.0%
2014 2013 2012 2011 2010
Year
CHAPTER 15 Financial Statement Analysis
Prob. 15–5A (Continued)
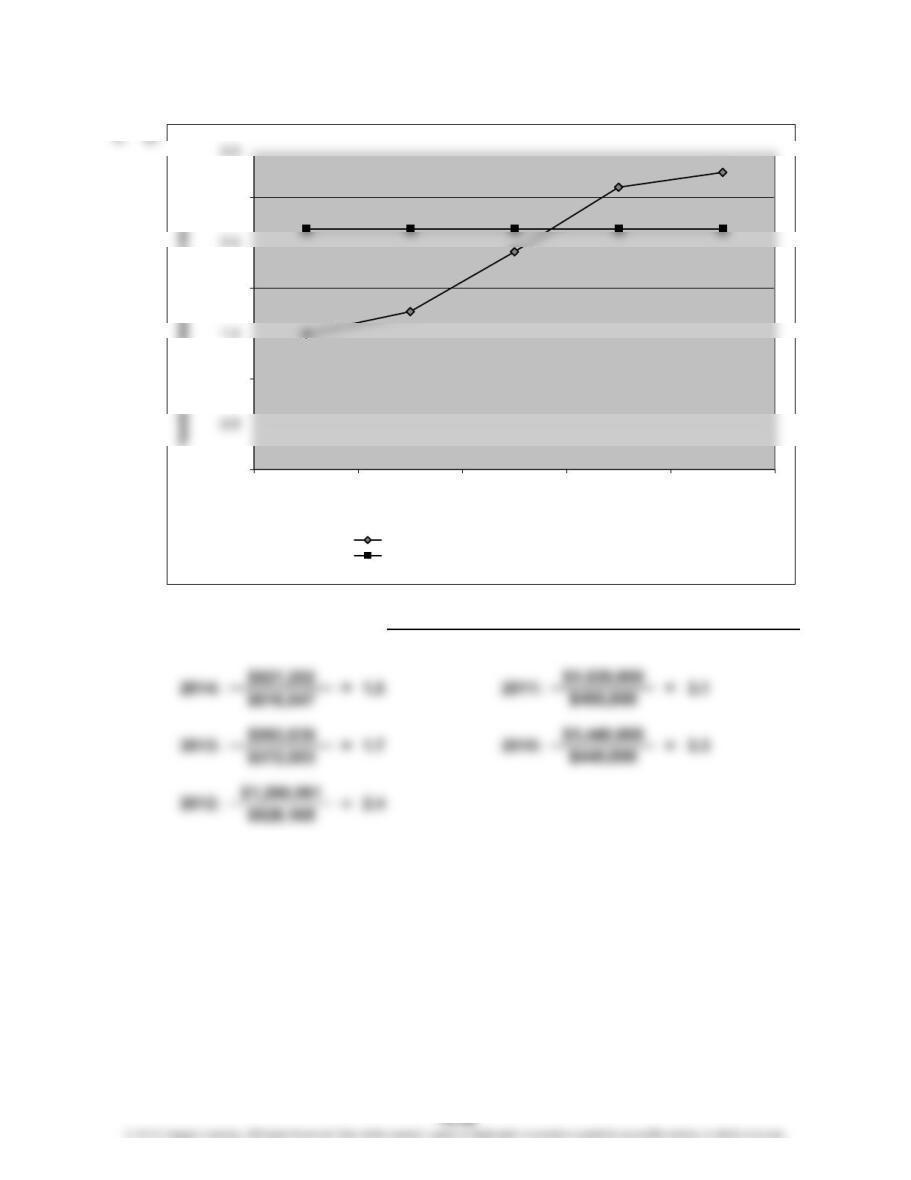
1. b.
Rate Earned on
Stockholders’ Equity
=
Average Total Stockholders’ Equity
Net Income
0.0%
20.0%
40.0%
60.0%
80.0%
2014 2013 2012 2011 2010
Year
Rate Earned on Stockholders’ Equity
Company’s rate earned on stockholders’ equity
Industry rate earned on stockholders’ equity
CHAPTER 15 Financial Statement Analysis
Prob. 15–5A (Continued)
Number of Times
Interest Charges Are Earned
Net Income + Income Tax Expense + Interest Expense
Interest Expense
=
0.0
1.0
2.0
3.0
2014 2013 2012 2011 2010
Year
Company’s number of times interest charges are earned
Industry number of times interest charges are earned
CHAPTER 15 Financial Statement Analysis
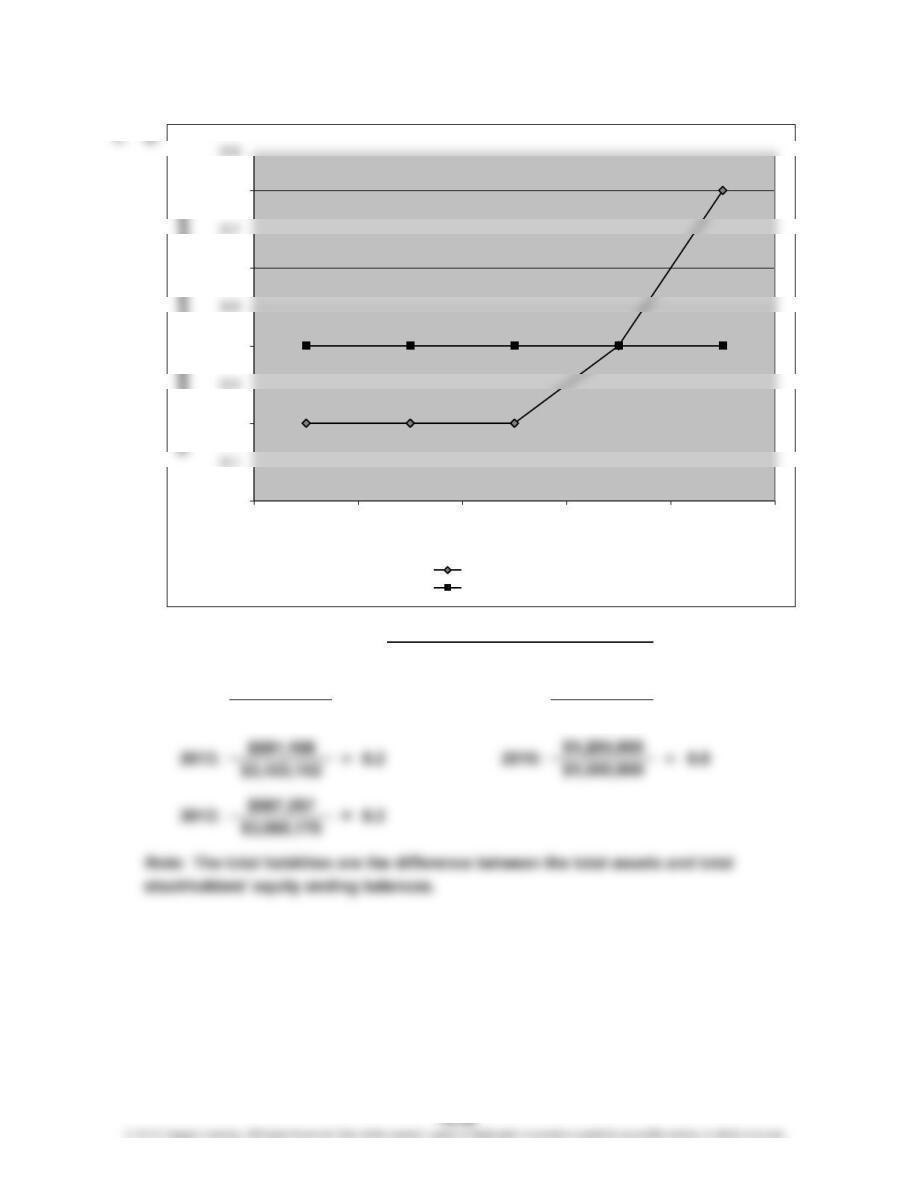
Prob. 15–5A (Continued)
$710,621
$3,706,557
0.22014:
Ratio of Liabilities to
Stockholders’ Equity =
=
2011:
0.4
Total Liabilities
Total Stockholders’ Equity
$904,500
$2,434,000
=
0.0
0.2
0.4
0.6
0.8
2014 2013 2012 2011 2010
Year
Company’s liabilities to equity
Industry liabilities to equity
CHAPTER 15 Financial Statement Analysis
Prob. 15–5A (Concluded)
2. Both the rate earned on total assets and the rate earned on stockholders’ equity
have been moving in a negative direction in the last five years. Both measures have