500
P15–3
1.
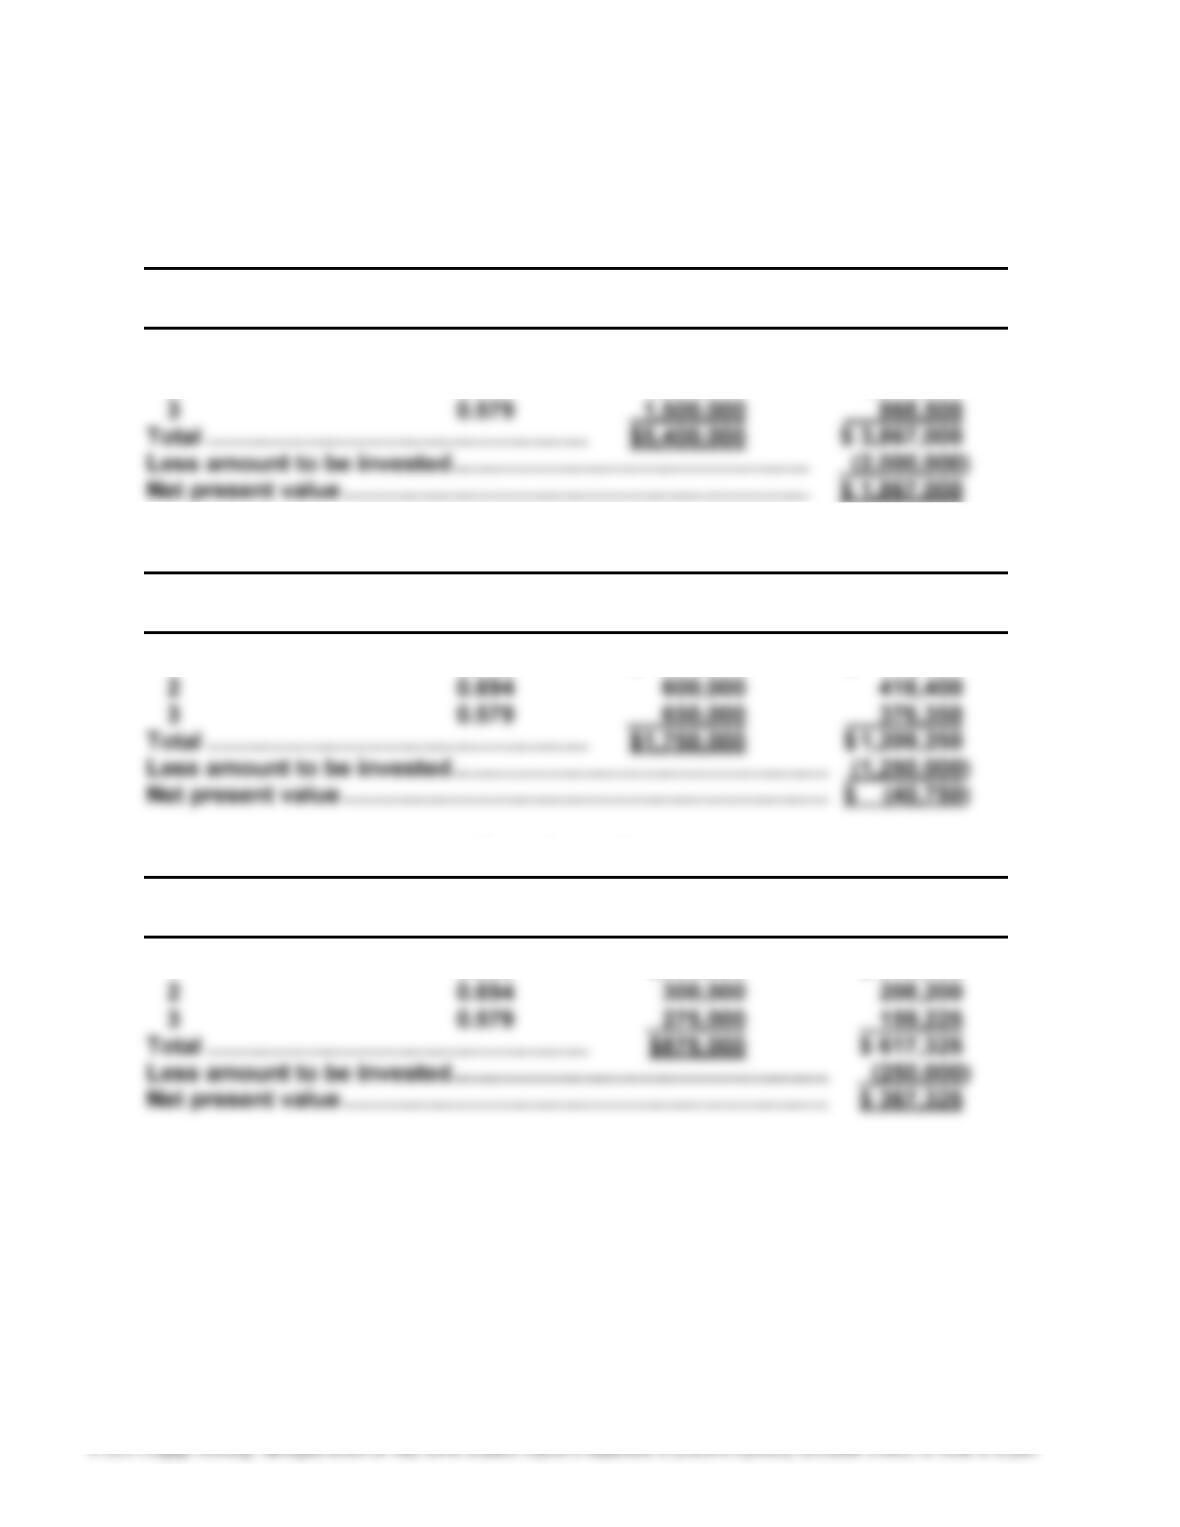
EZ Expansion
Present Value Net Cash Present Value of
Year of $1 at 20% Flow Net Cash Flow
1 0.833 $2,100,000 $ 1,749,300
2 0.694 1,800,000 1,249,200
Notorious Facilities
Present Value Net Cash Present Value of
Year of $1 at 20% Flow Net Cash Flow
1 0.833 $ 500,000 $ 416,500
Short Network
Present Value Net Cash Present Value of
Year of $1 at 20% Flow Net Cash Flow
1 0.833 $300,000 $ 249,900
501
P15–3, Concluded
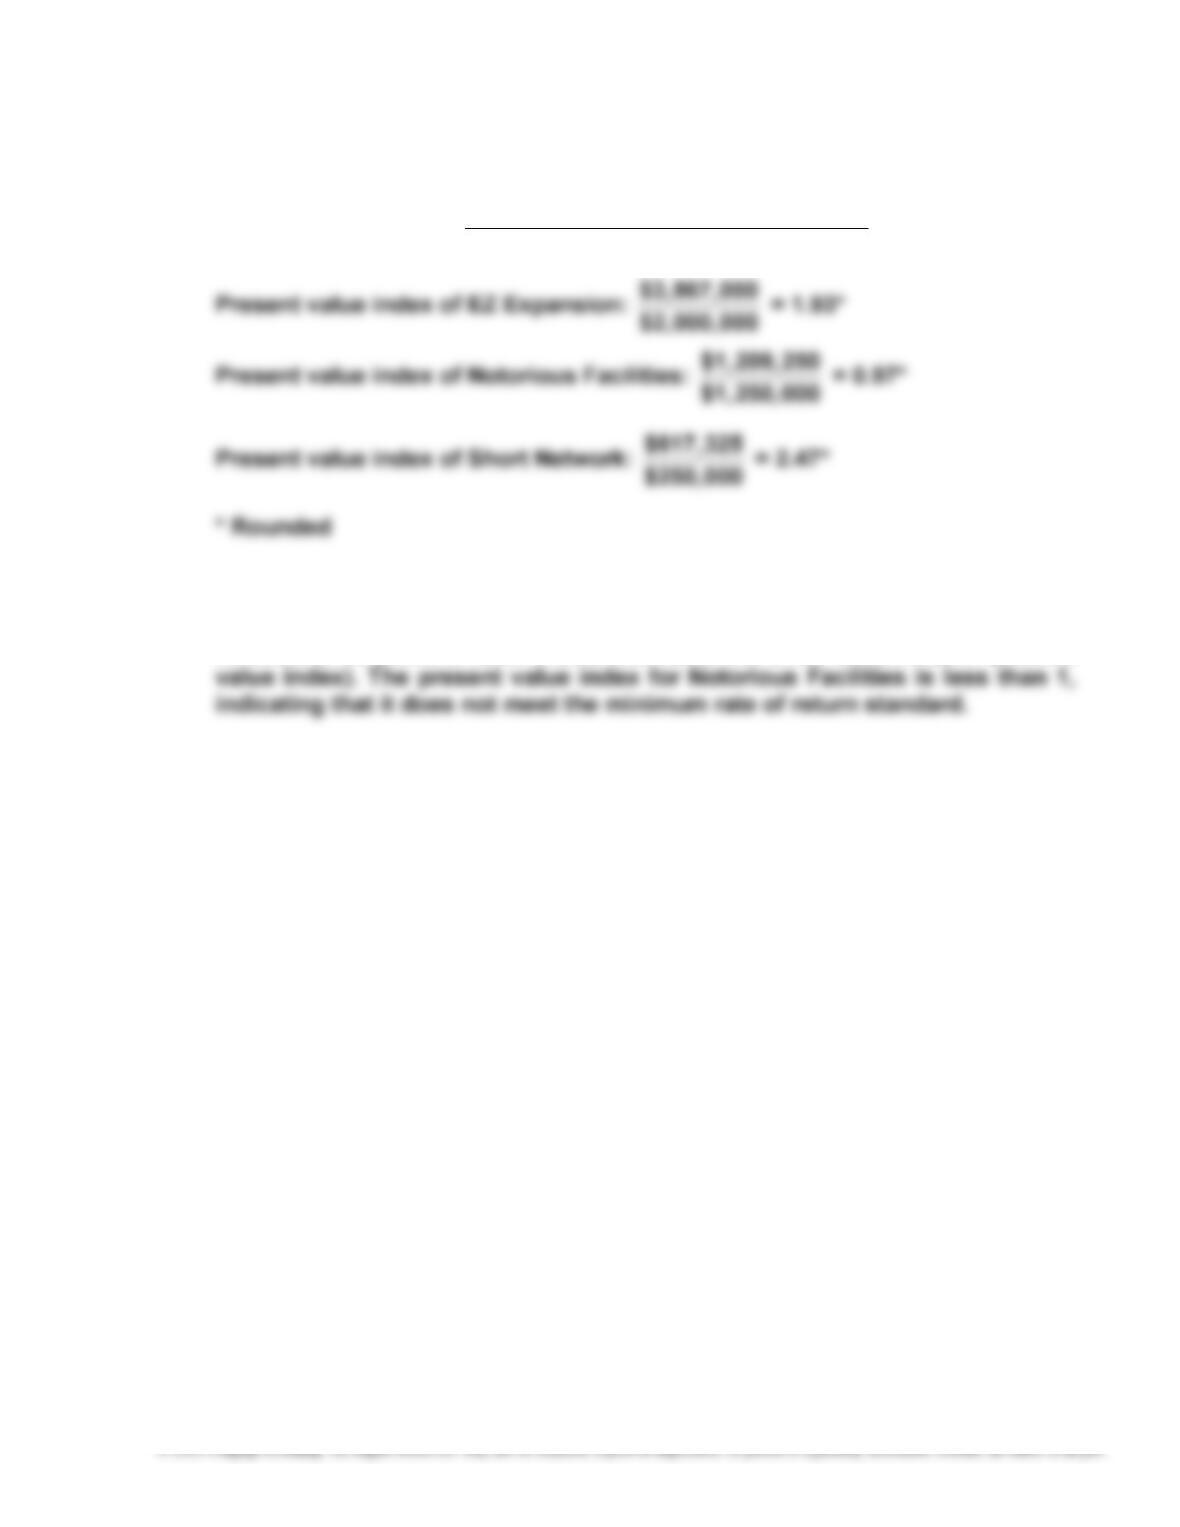
2. Present Value Index = Total Present Value of Net Cash Flow
Amount to Be Invested
3. The Short Network has the largest present value index. Although EZ Expan-
sion has the largest net present value, it returns less present value per dollar
invested (1.93 present value index) than does the Short Network (2.47 present
502
P15–4
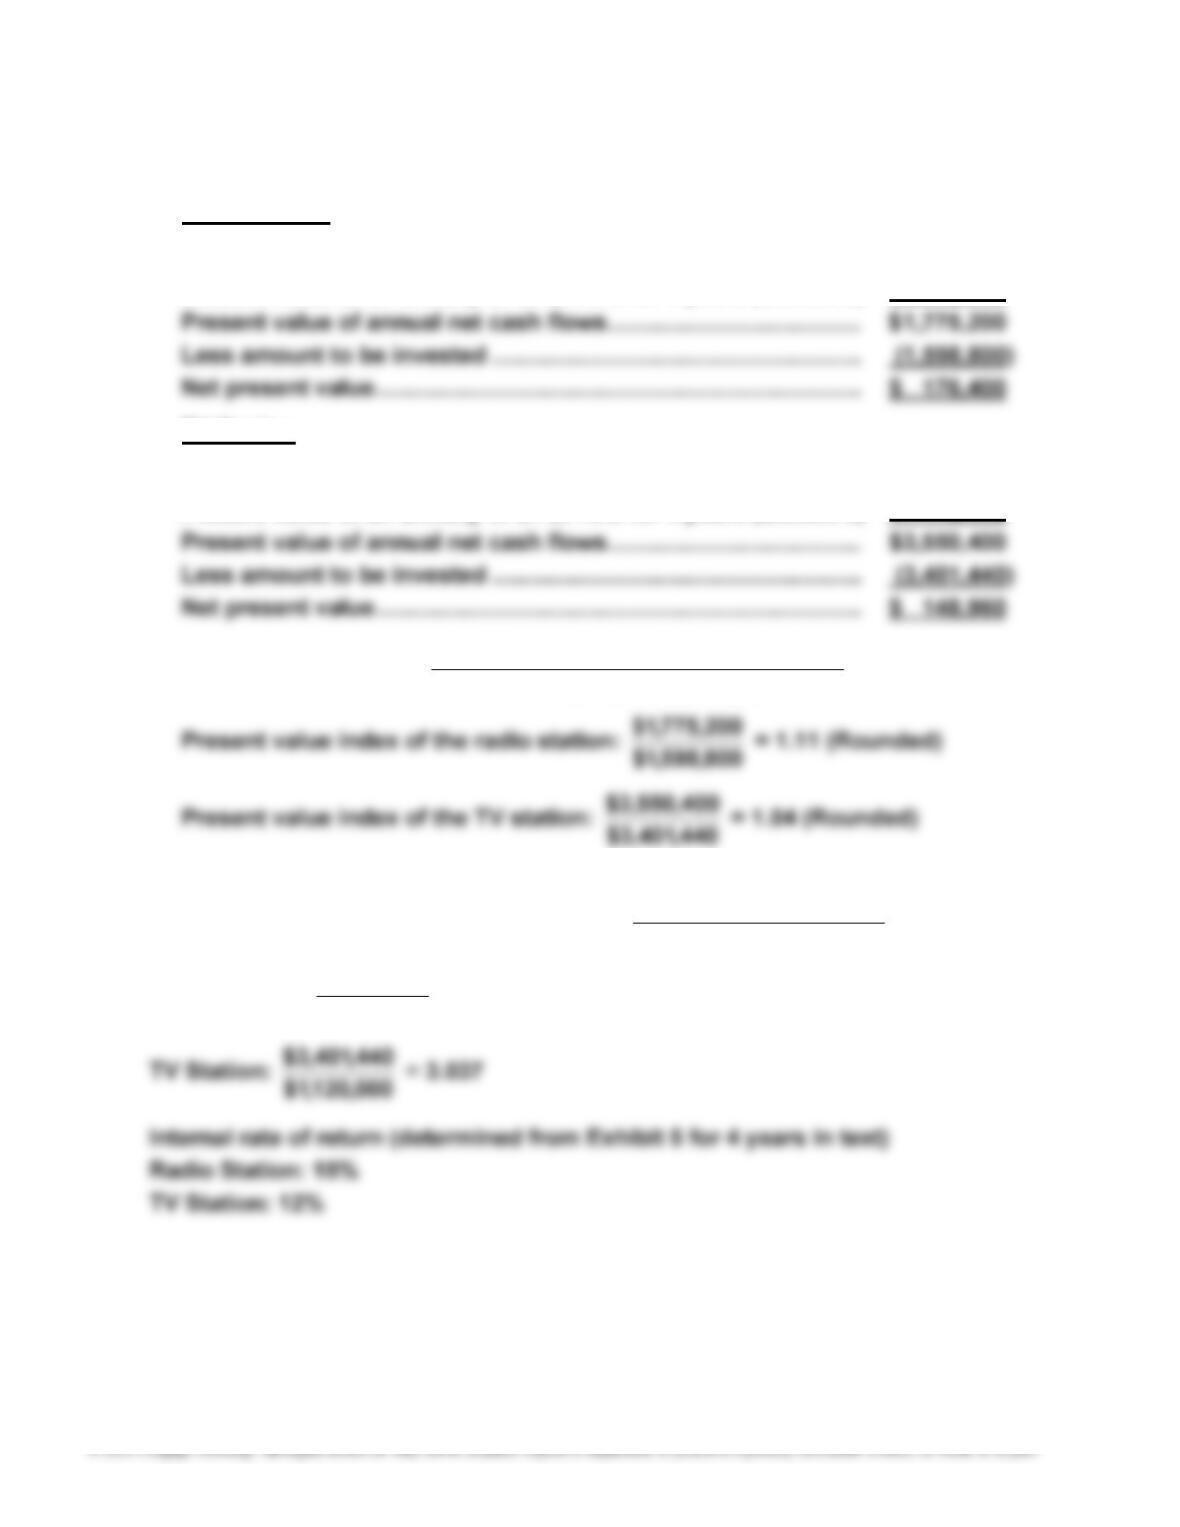
1. a. Radio Station
Annual net cash flows (at the end of each of 4 years) …………… $ 560,000
Present value of an annuity of $1 at 10% for 4 years (Exhibit 5) × 3.170
TV Station
Annual net cash flows (at the end of each of 4 years) …………… $ 1,120,000
Present value of an annuity of $1 at 10% for 4 years (Exhibit 5) × 3.170
b. Present Value Index = Invested Be to Amount
Flows Cash Net of ValuePresent Total
2. Present Value Factor for an Annuity of $1 = Flows Cash Net Annual
Invested Be to Amount
Radio Station: 000,560$
800,598,1$ = 2.855

503
P15–4, Concluded
3. By using the internal rate of return method, all proposals are placed on a
504
P15–5
1. Net present value analysis:
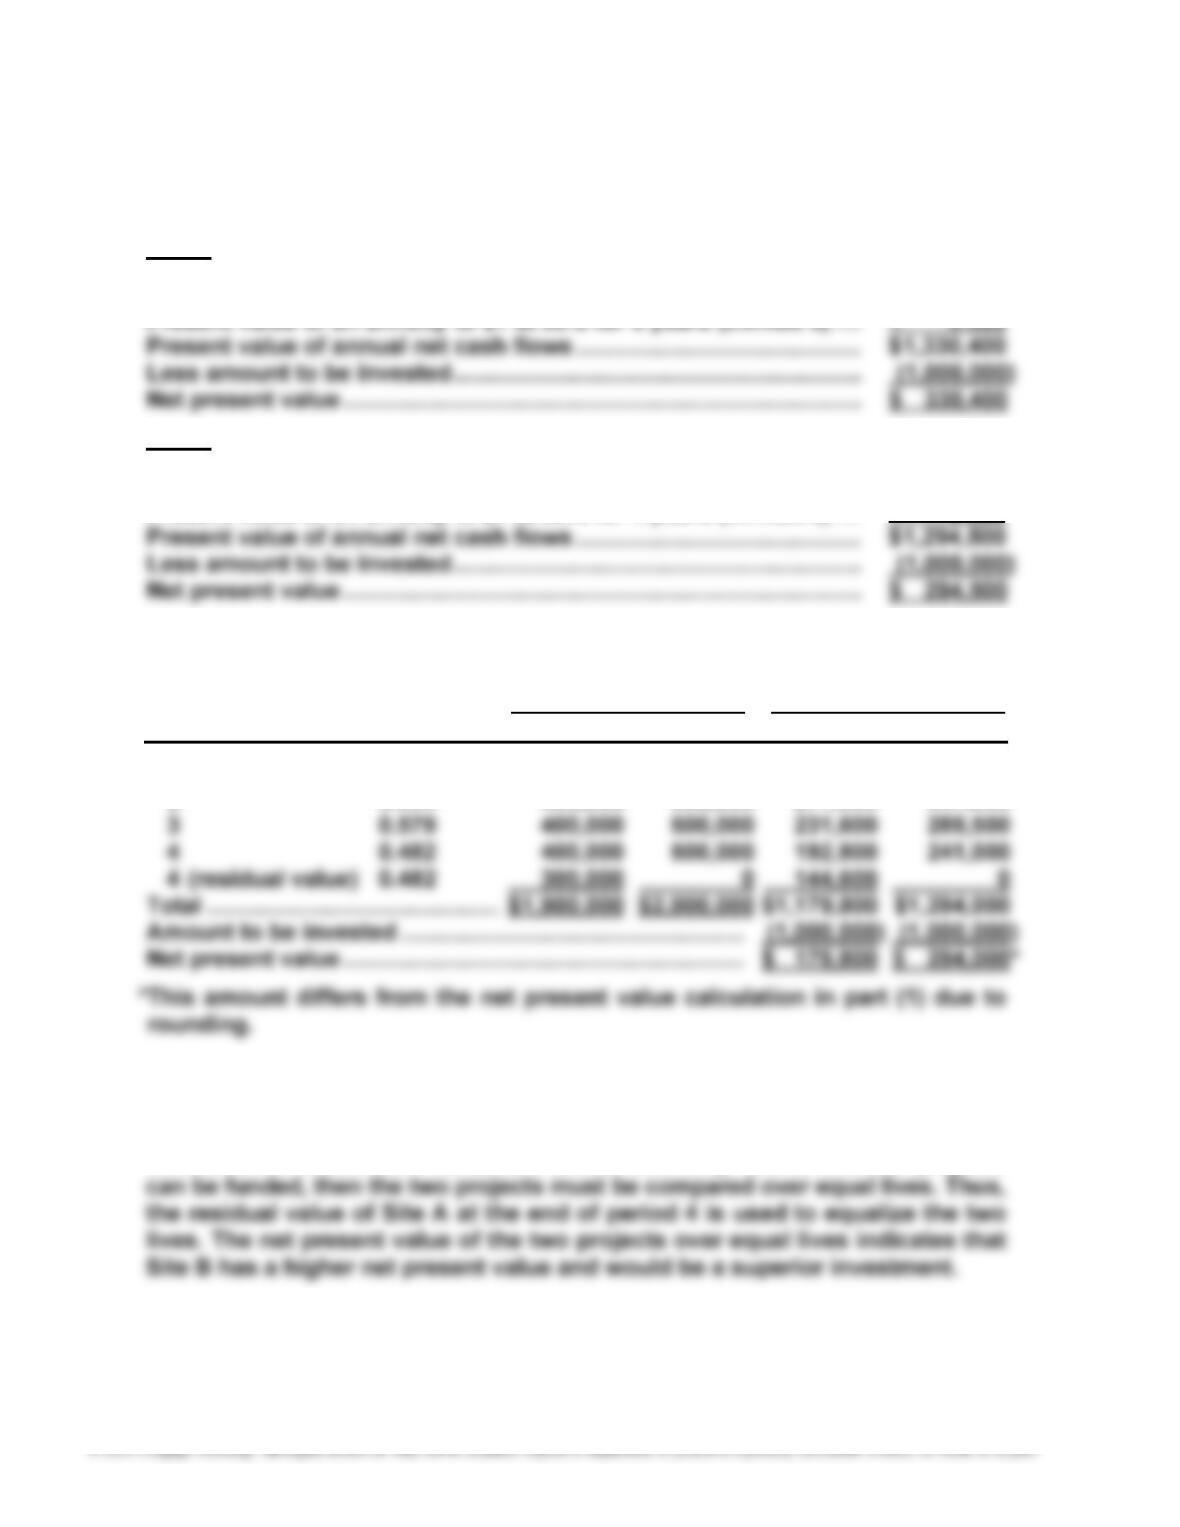
Site A
Annual net cash flows (at the end of each of 6 years) ………………… $ 400,000
Site B
Annual net cash flows (at the end of each of 4 years) ………………… $ 500,000
Present value of an annuity of $1 at 20% for 4 years (Exhibit 5) …. × 2.589
2. Net present value analysis:
Present Value of
Present Value of Net Cash Flows Net Cash Flows
Year $1 at 20% Site A Site B Site A Site B
1 0.833 $ 400,000 $ 500,000 $ 333,200 $ 416,500
3. To: Investment Committee
Both Sites A and B have a positive net present value. This means both pro-
jects meet our minimum expected return of 20% and would be acceptable
investments. However, if funds are limited and only one of the two projects
505
P15–6
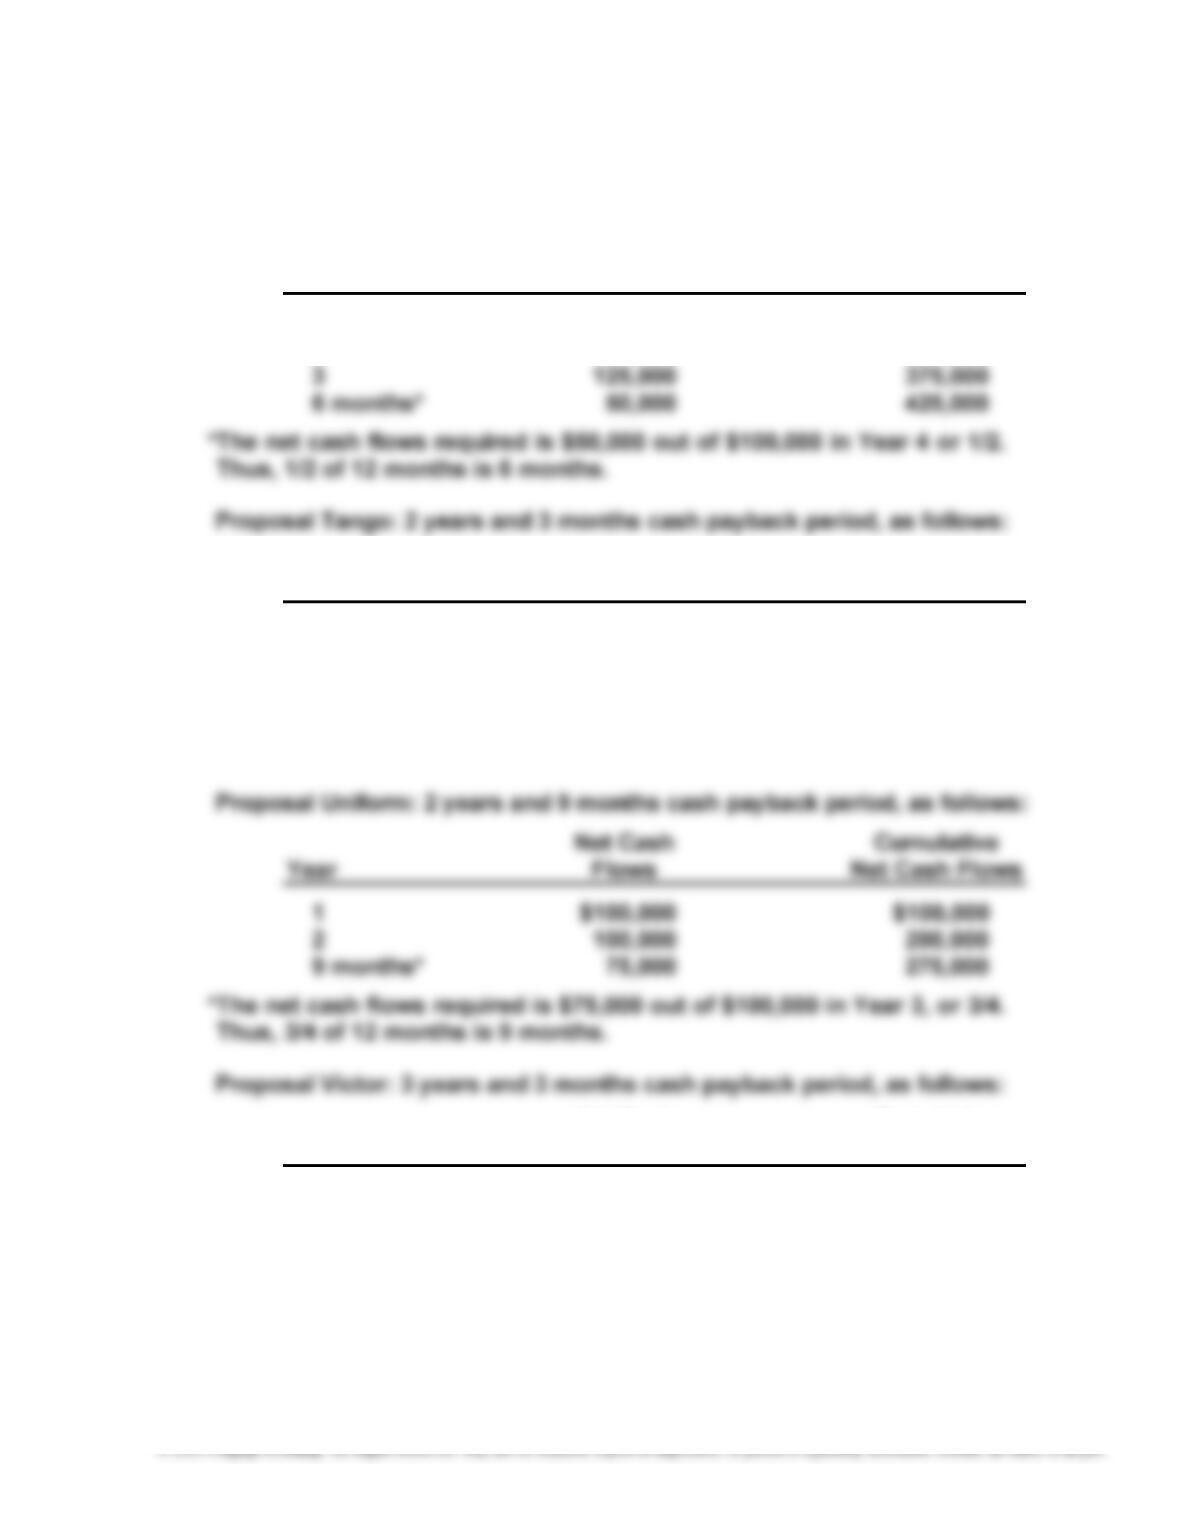
1. Proposal Bravo: 3 years and 6 months cash payback period, as follows:
Net Cash Cumulative
Year Flows Net Cash Flows
1 $125,000 $125,000
2 125,000 250,000
Net Cash Cumulative
Year Flows Net Cash Flows
1 $280,000 $280,000
2 270,000 550,000
3 months* 50,000 600,000
*The net cash flows required is $50,000 out of $200,000 in Year 3 or 1/4.
Thus, 1/4 of 12 months is 3 months.
Net Cash Cumulative
Year Flows Net Cash Flows
1 $60,000 $ 60,000
2 60,000 120,000
3 60,000 180,000
3 months* 10,000 190,000
*The net cash flows required is $10,000 out of $40,000 in Year 4 or 1/4.
Thus, 1/4 of 12 months is 3 months.
506
P15–6, Continued
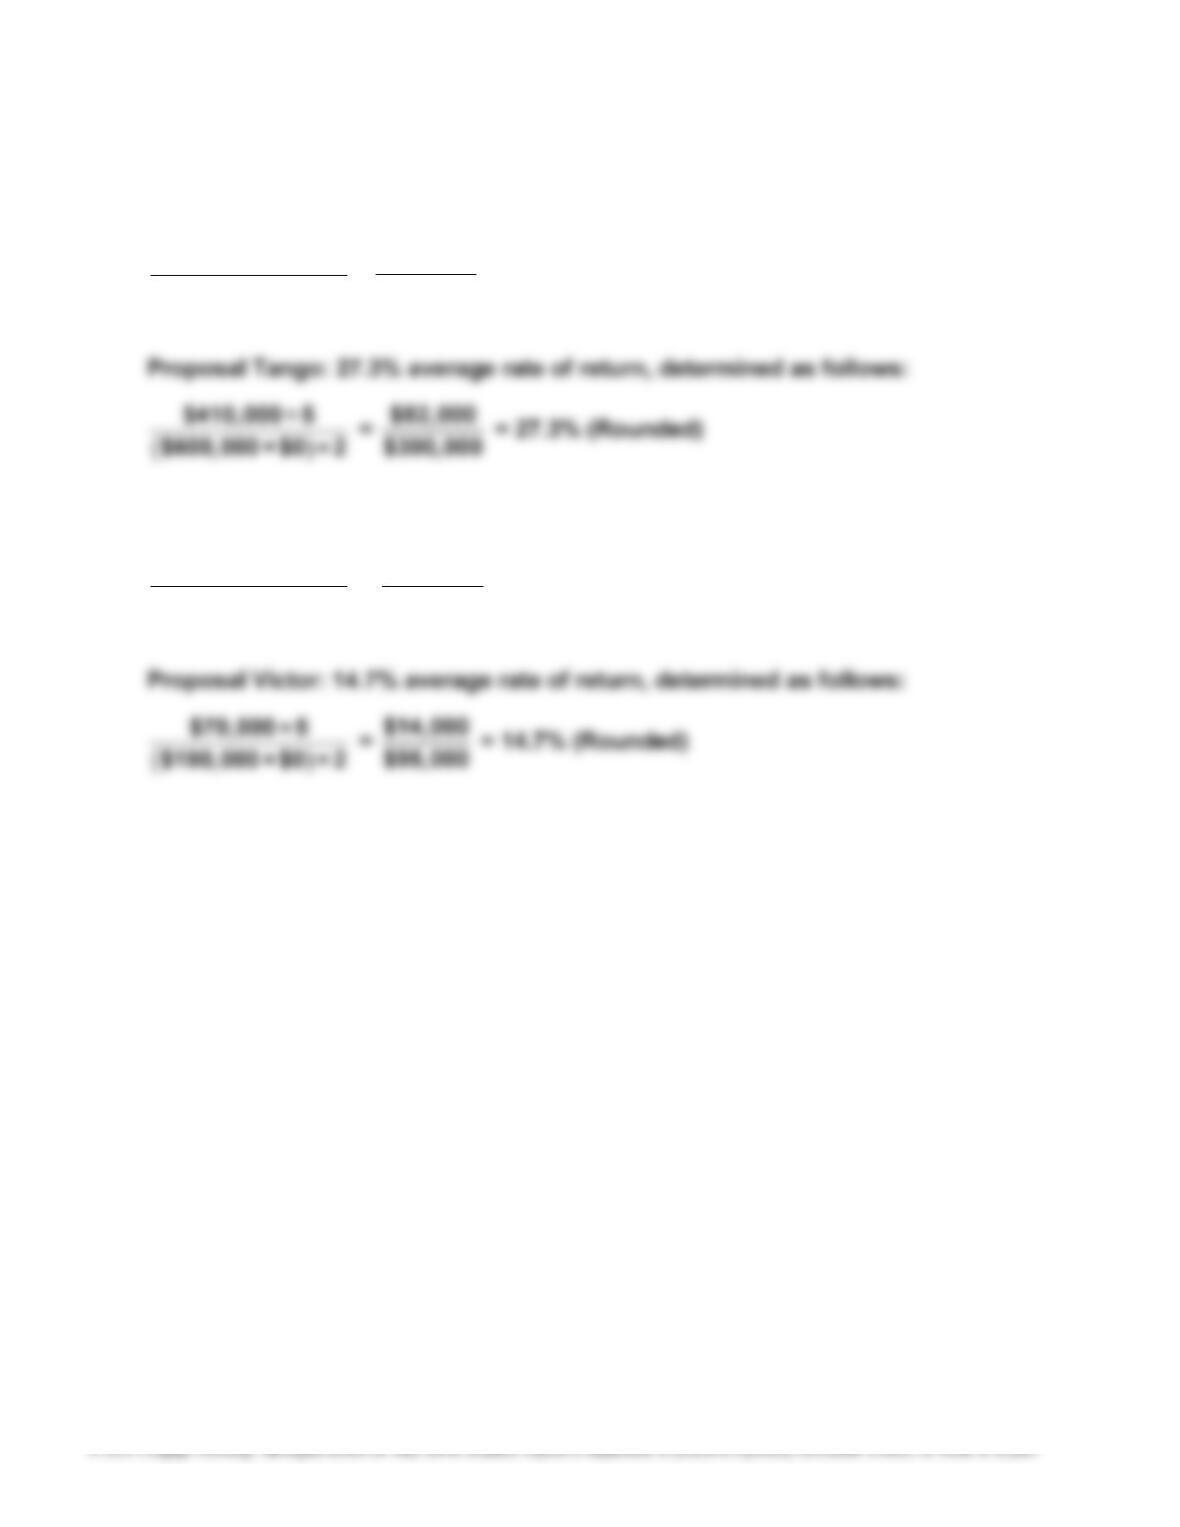
2. Proposal Bravo: 9.4% average rate of return, determined as follows:
$100,000 ÷ 5
$425,000 + $0 ÷ 2 = $20,000
$212,500 = 9.4% (Rounded)
Proposal Uniform: 31.3% average rate of return, determined as follows:
$215,000 ÷ 5
$275,000 + $0 ÷ 2 = $43,000
$137,500 = 31.3% (Rounded)
507
P15–6, Continued
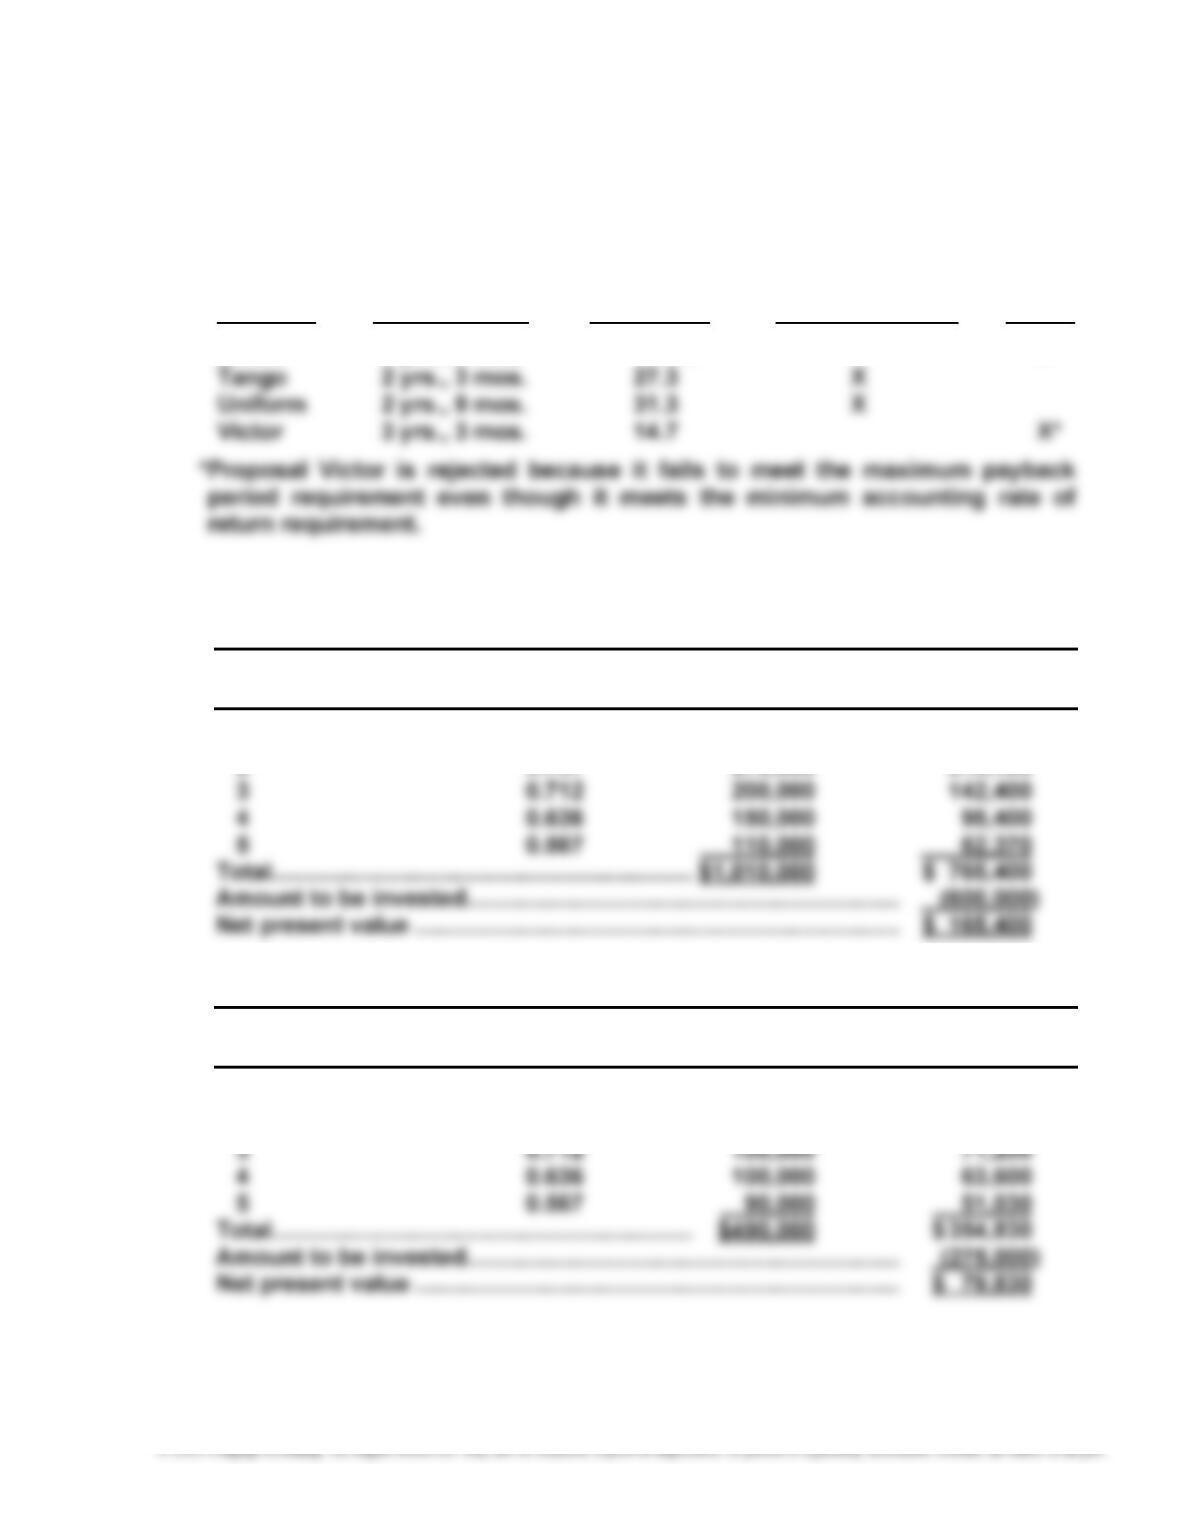
3. Of the four proposed investments, only Proposals Tango and Uniform meet
the company’s requirements as the following table indicates:
Cash Payback Average Rate Accept for
Proposal Period of Return Further Analysis Reject
Bravo 3 yrs., 6 mos. 9.4% X
4.
Proposal Tango
Present Value Net Cash Present Value of
Year of $1 at 12% Flows Net Cash Flows
1 0.893 $ 280,000 $ 250,040
Proposal Uniform
Present Value Net Cash Present Value of
Year of $1 at 12% Flows Net Cash Flows
1 0.893 $100,000 $ 89,300
2 0.797 100,000 79,700
508
P15–6, Concluded
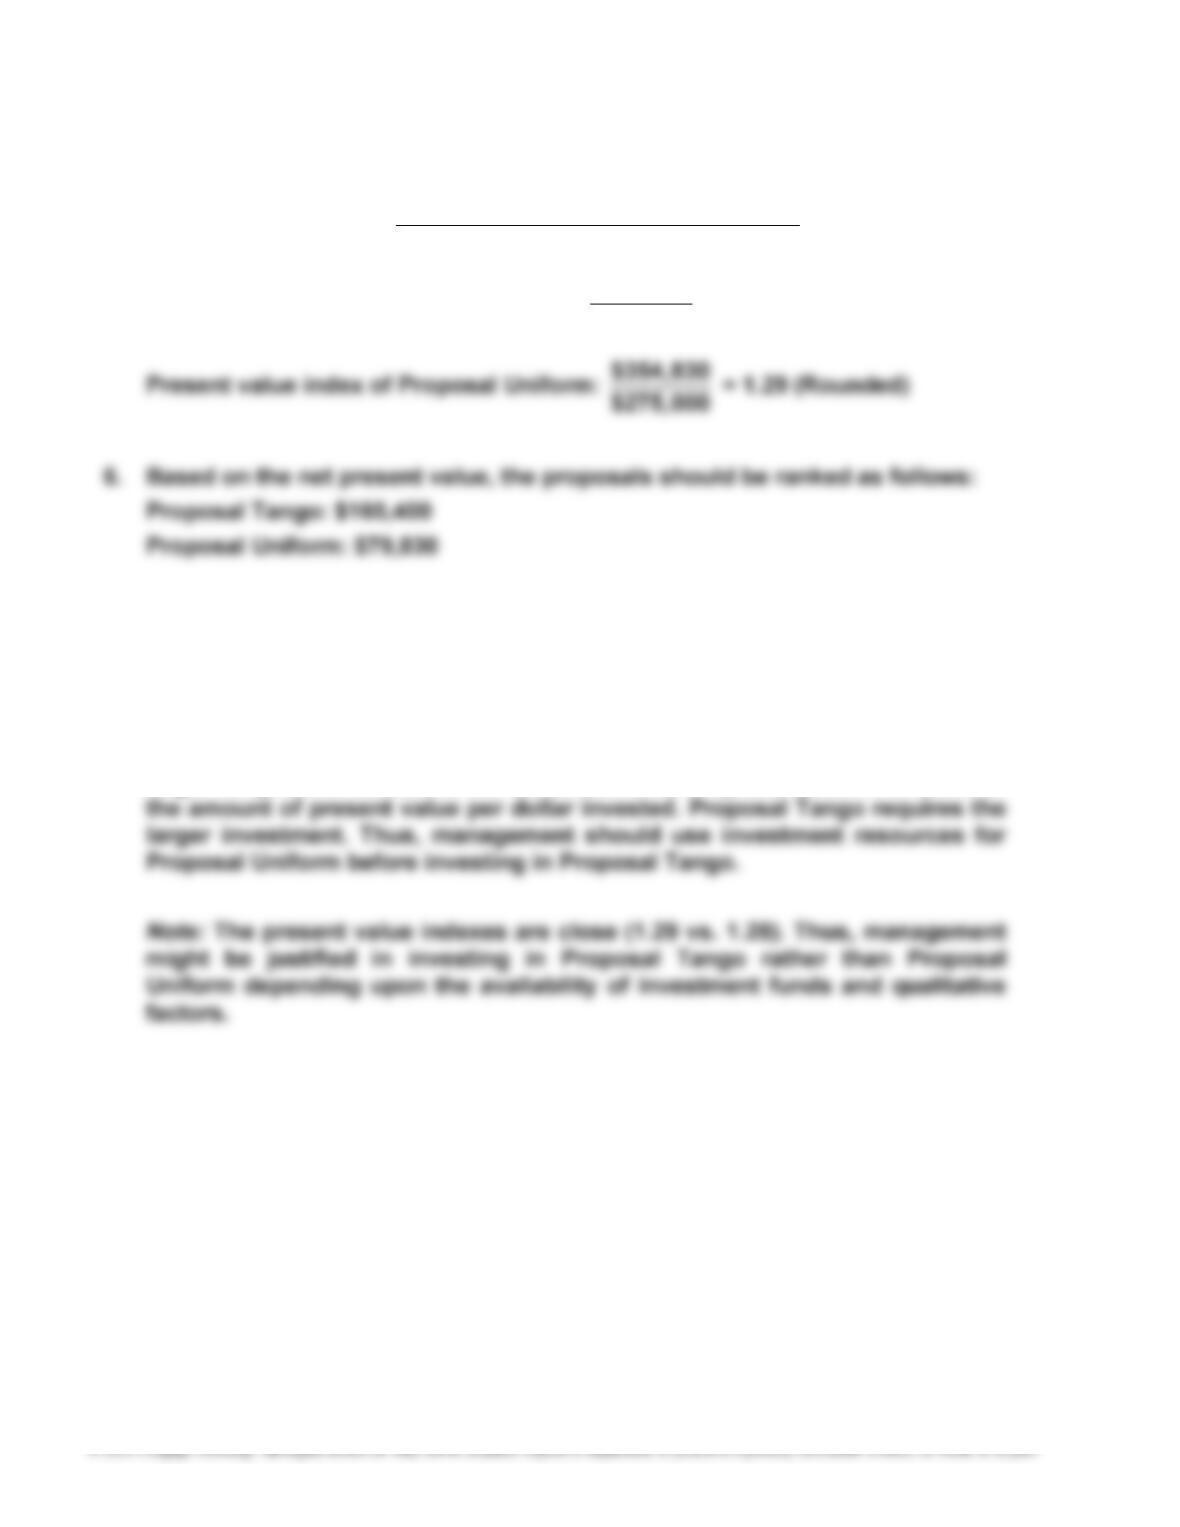
5. Present Value Index = Invested Be toAmount
Flow CashNet of luePresent Va Total
Present value index of Proposal Tango: $765,400
$600,000 = 1.28 (Rounded)
7. Based on the present value index, the proposals should be ranked as follows:
Proposal Uniform: 1.29
Proposal Tango: 1.28
8. The present value indexes indicate that although Proposal Tango has the
larger net present value, it is not as attractive as Proposal Uniform in terms of
509
METRIC-BASED ANALYSIS
MBA 15–1
1. Return on Total Assets = $35,058
$254,580 = 13.8%
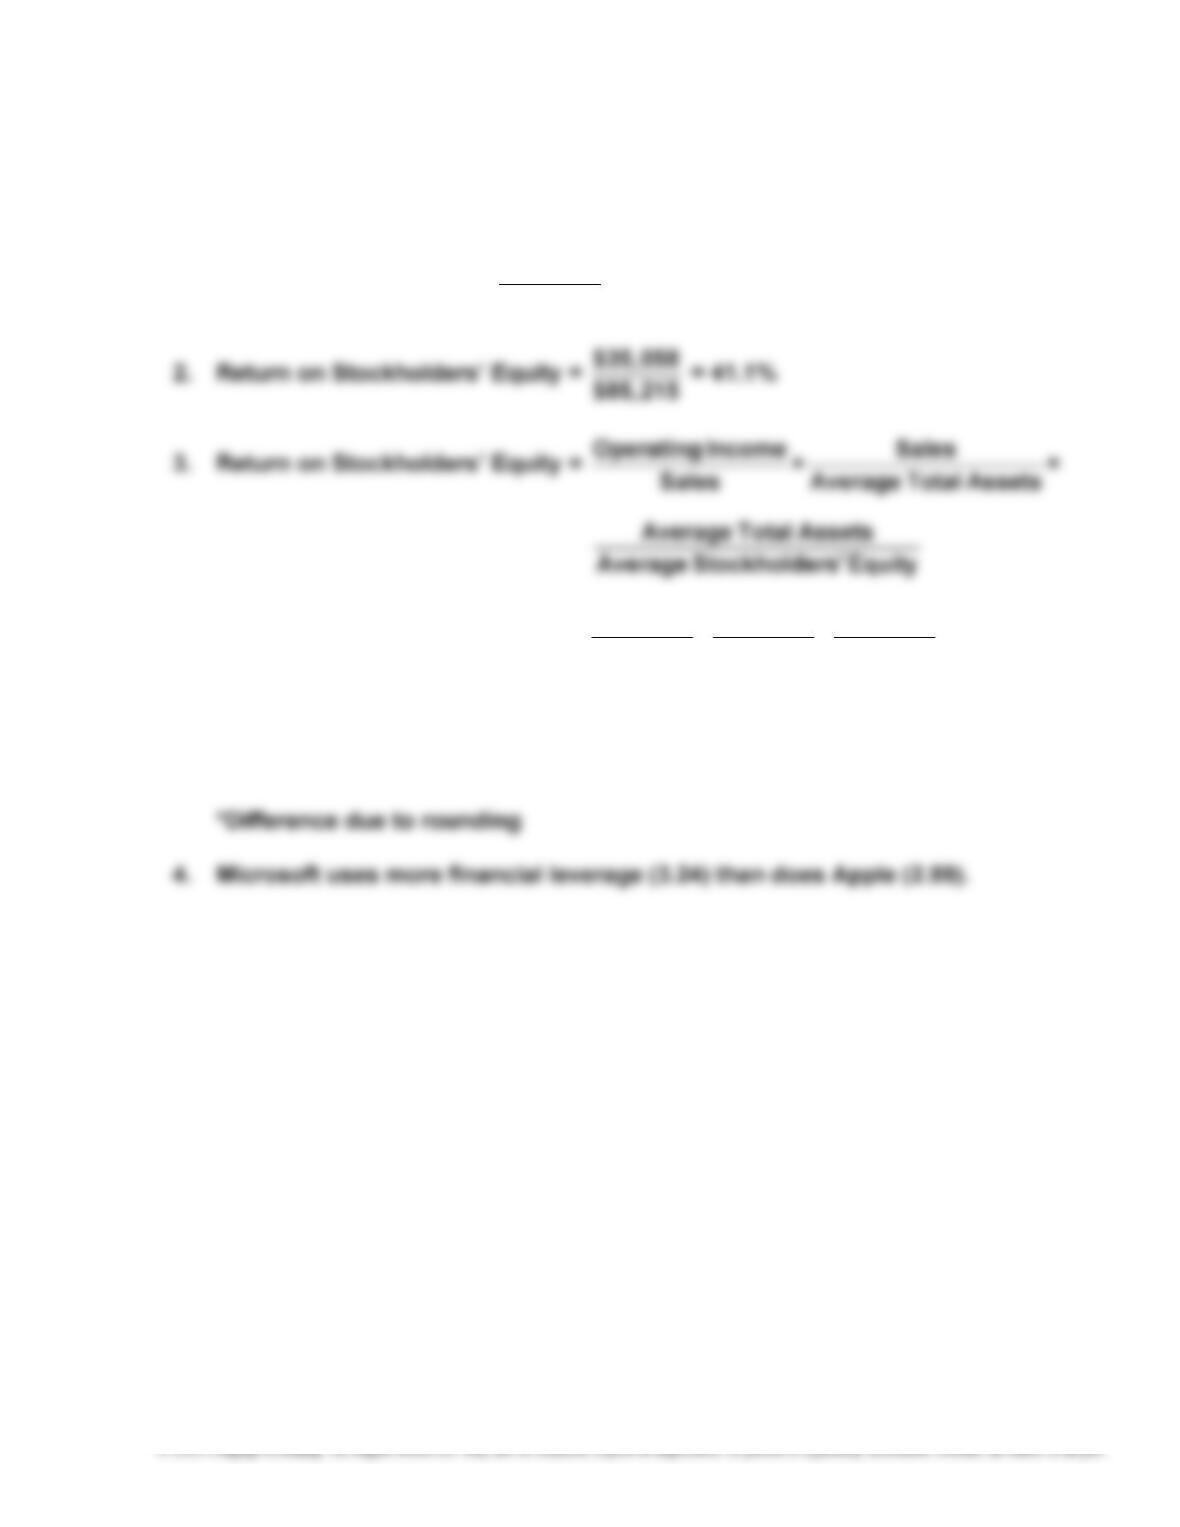
Return on Stockholders’ Equity = $35,058 $110,360 $254,580
××
$110,360 $254,580 $85,215
Return on Stockholders’ Equity = 31.77% × 0.43 × 2.99 = 40.8%*
Profit Asset Financial
Margin Turnover Leverage
510
MBA 15–2
1. Return on Total Assets =
$4,116
$24,198
= 17.0%
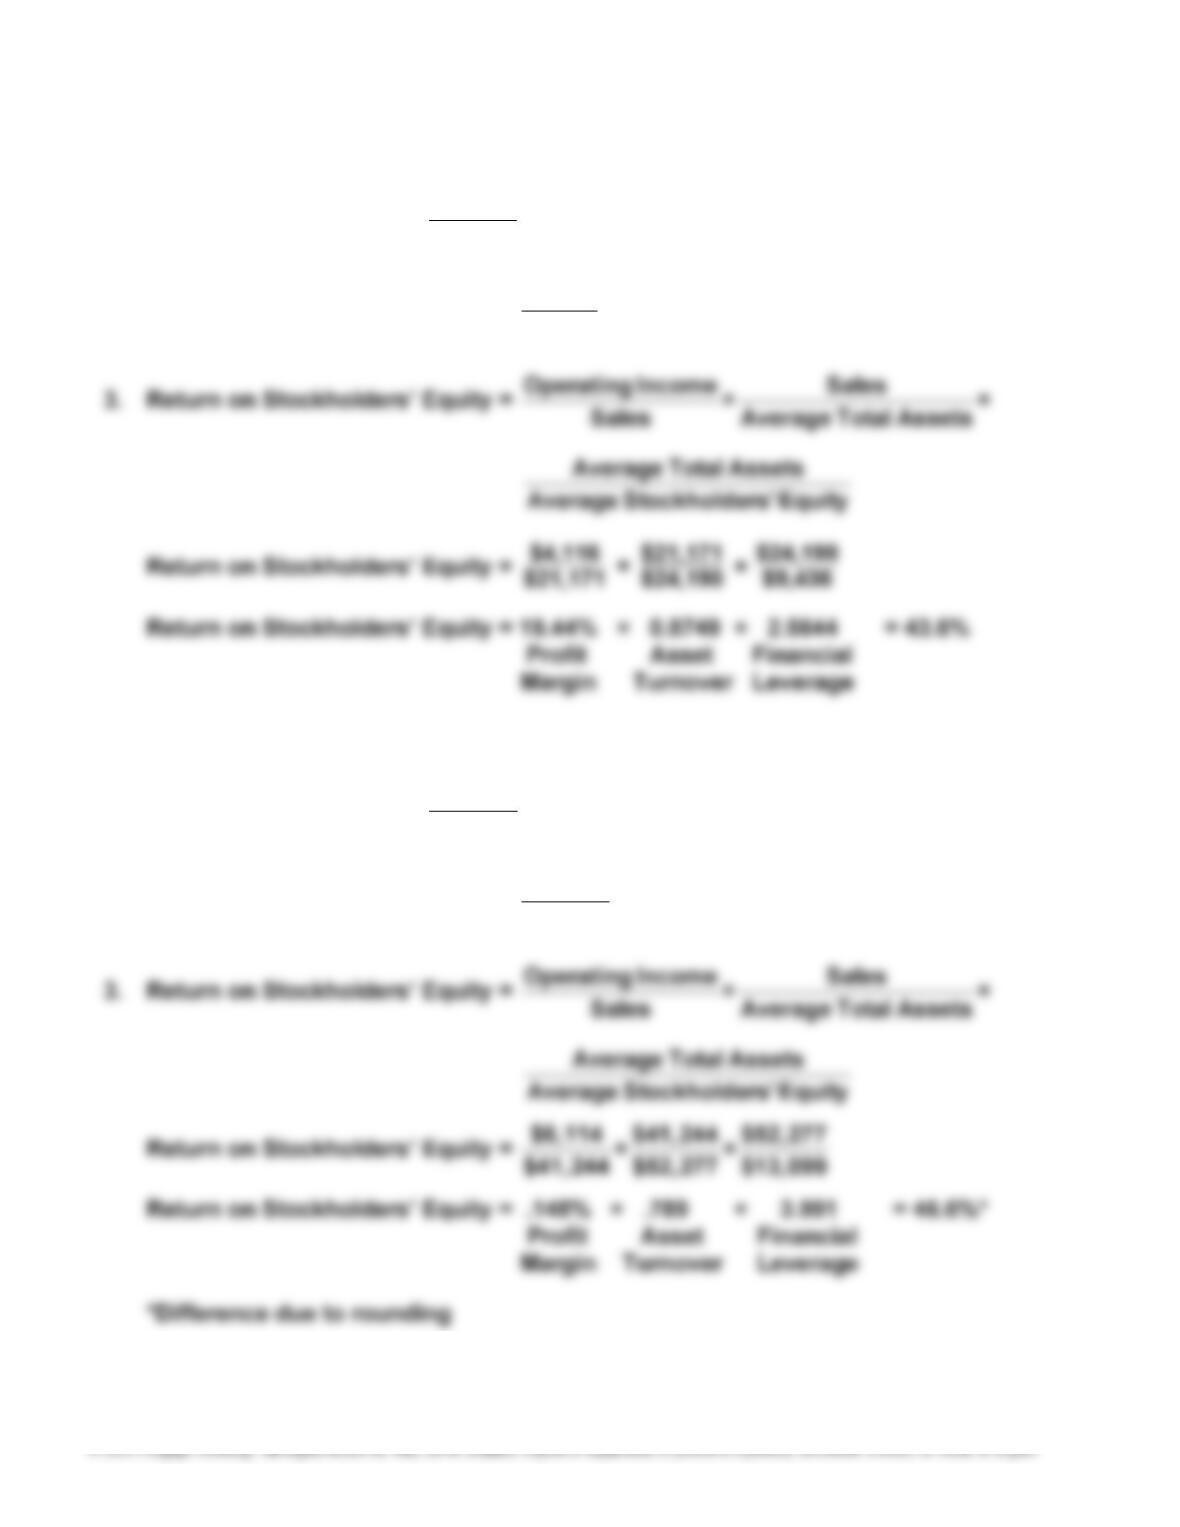
2. Return on Stockholders’ Equity =
$4,116
$9,436
= 43.6%
MBA 15–3
1. Return on Total Assets =
$6,114
$52,277
= 11.7%
2. Return on Stockholders’ Equity =
$6,114
$13,099
= 46.7%
511
MBA 15–4
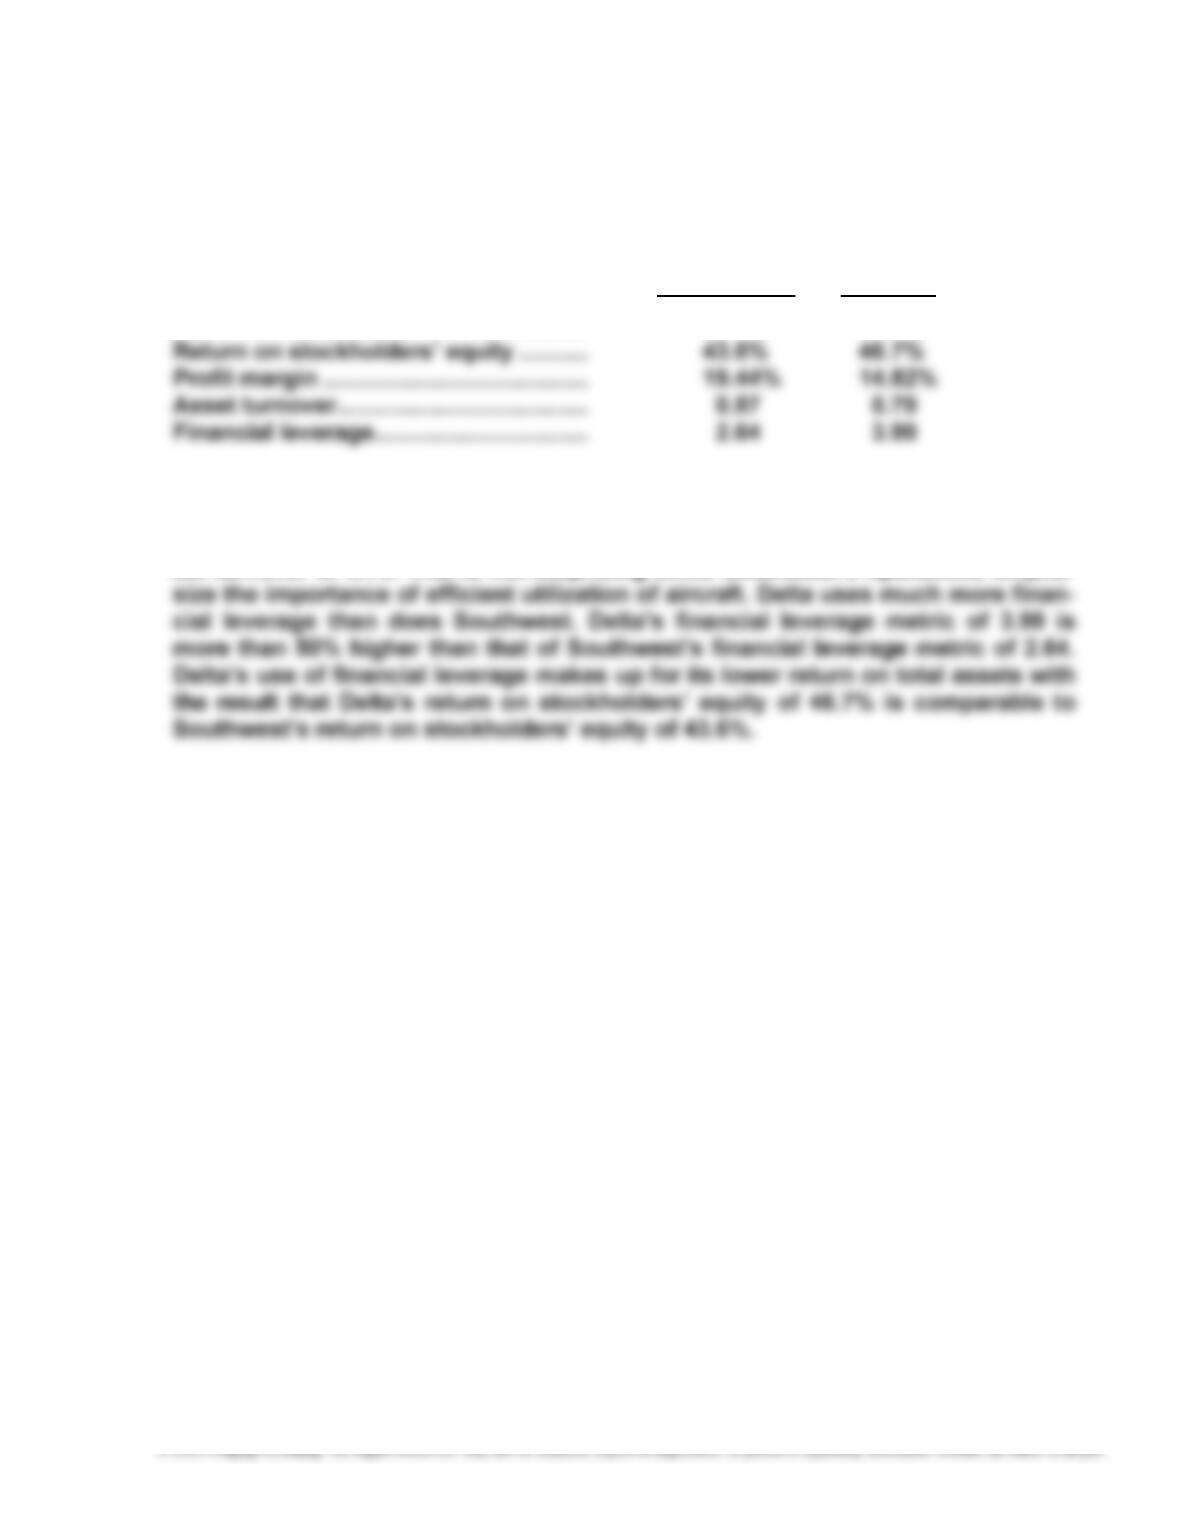
The comparative metrics for Southwest Airlines and Delta Air Lines are summa-
rized as follows:
Southwest Delta
Return on total assets …………………….. 17.0% 11.7%
Southwest’s profit margin of 19.44% is significantly higher than Delta’s profit
margin of 14.82%. This is surprising given the competitive nature of the passen-
ger airline services. Southwest’s asset turnover of 0.87 is higher than Delta’s as-
512
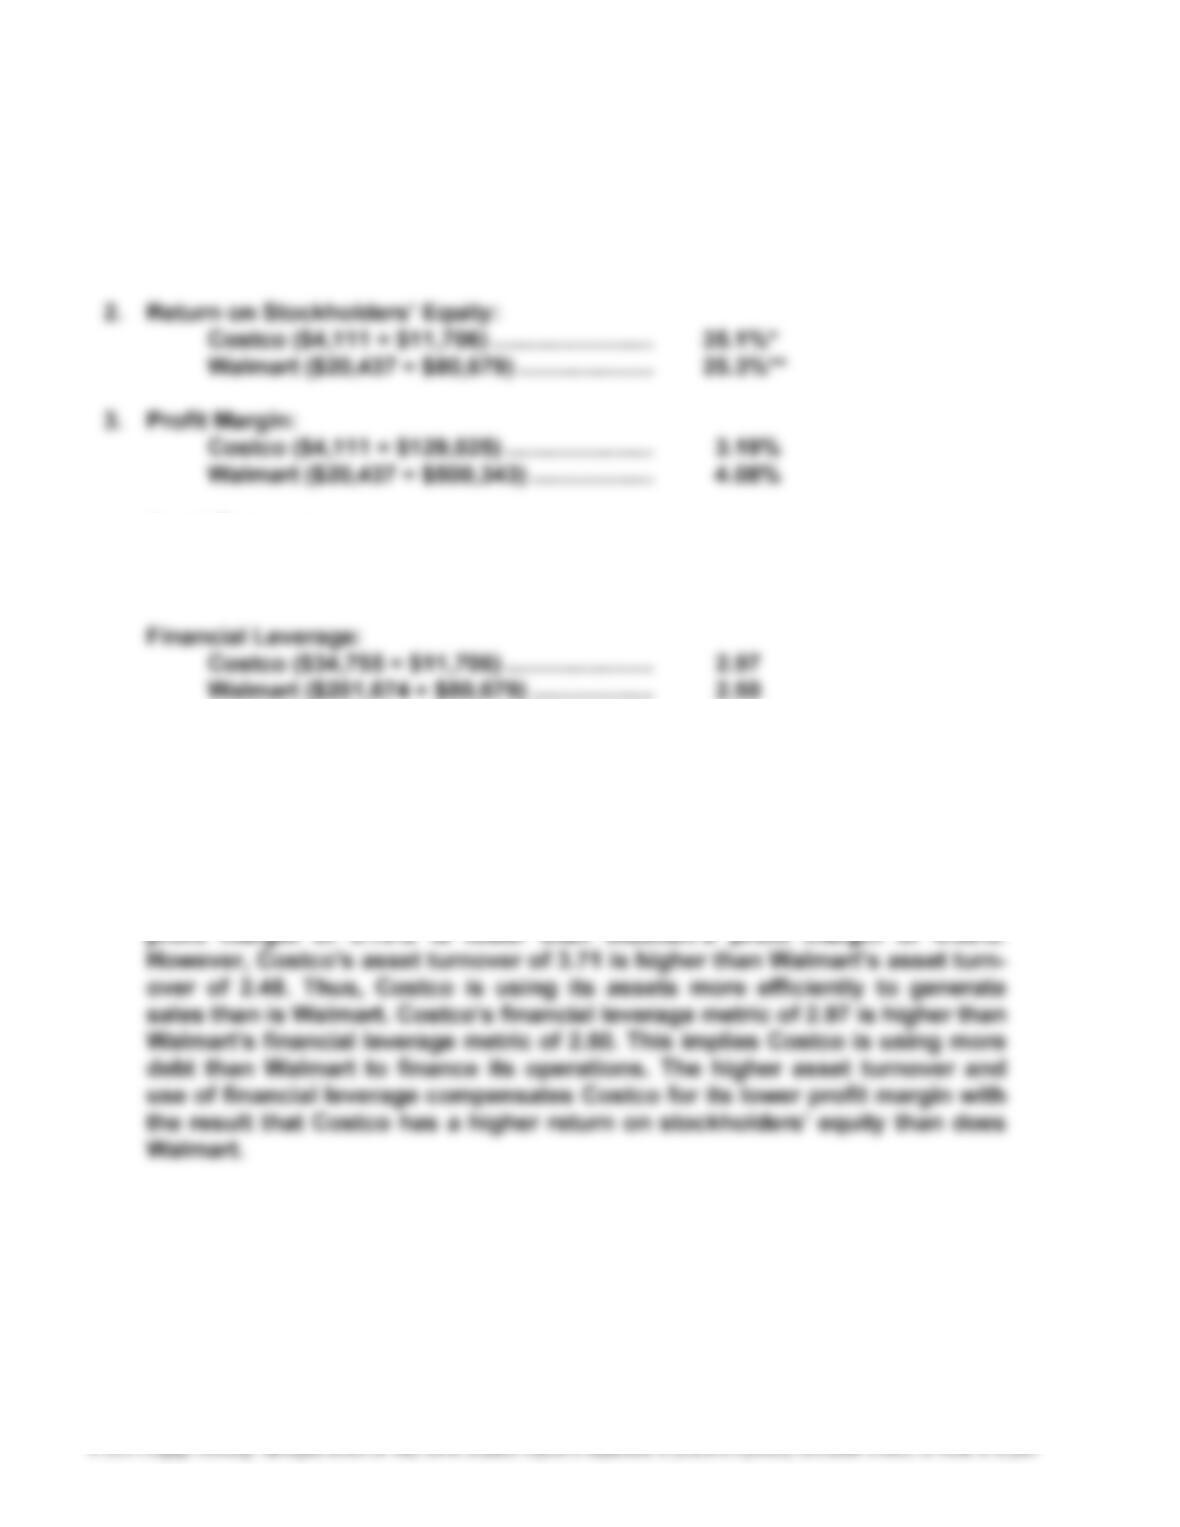
MBA 15–5
1. Return on Total Assets:
Costco ($4,111 ÷ $34,755) ……………………. 11.8%
Walmart ($20,437 ÷ $201,674) ………………. 10.1%
Asset Turnover:
Costco ($129,025 ÷ $34,755) ………………… 3.71
Walmart ($500,343 ÷ $201,674) …………….. 2.48
* 35.1% = 3.19% × 3.71 × 2.97
** 25.3% = 4.08% × 2.48 × 2.50
4. The return on total assets is higher for Costco (11.8%) than Walmart (10.1%).
Costco’s return on stockholders’ equity of 35.1% is higher than Walmart’s
25.3%. The profit margin, asset turnover, and financial leverage metrics reveal
operating differences between Costco and Walmart. Specifically, Costco’s
513
CASES
Case 15–1
The plant manager wants a project to become accepted and places pressure
on the analyst to come up with the “right numbers.” Zuhair is right when he
states the net present value analysis has many assumptions and room for
interpretation. Many use this room for interpretation to work the numbers until
they satisfy the minimum return (hurdle) rate. Some analysts state they start with
the hurdle rate and work back into the numbers. Clearly, this is not what should
be expected of Erin.
on his systems so he doesn’t need the warehouse space.
This difficult issue revolves around the nature of ethical dilemmas. Erin has had a
brief tenure with the organization. Erin has little organizational clout and could
easily find her career short-circuited by crossing Zuhair. Erin might want to slide
on this one; after all, who would know? If the project is eventually a failure, it’s
unlikely that the decision would come back to haunt Erin. Much time will have
passed, and Erin will likely be in another job in the company. The decision to con-
front Zuhair has immediate repercussions. This is the heart of real-world ethical
dilemmas. The dilemma occurs when the ethical decision has grave short-term
consequences (Zuhair short-circuits the career) and few seemingly long-term
rewards (no one sees the ethical decision), while the unethical decision looks
514
Case 15–2
1. Annual salary …………………………………………………………………… $ 50,000
Present value of $1 annuity for 10 years at 10% ………………… × 6.145
2. Annual tuition at the beginning of the graduate year …………. $ (15,000)
Annual salary …………………………………………………………………… $ 65,000
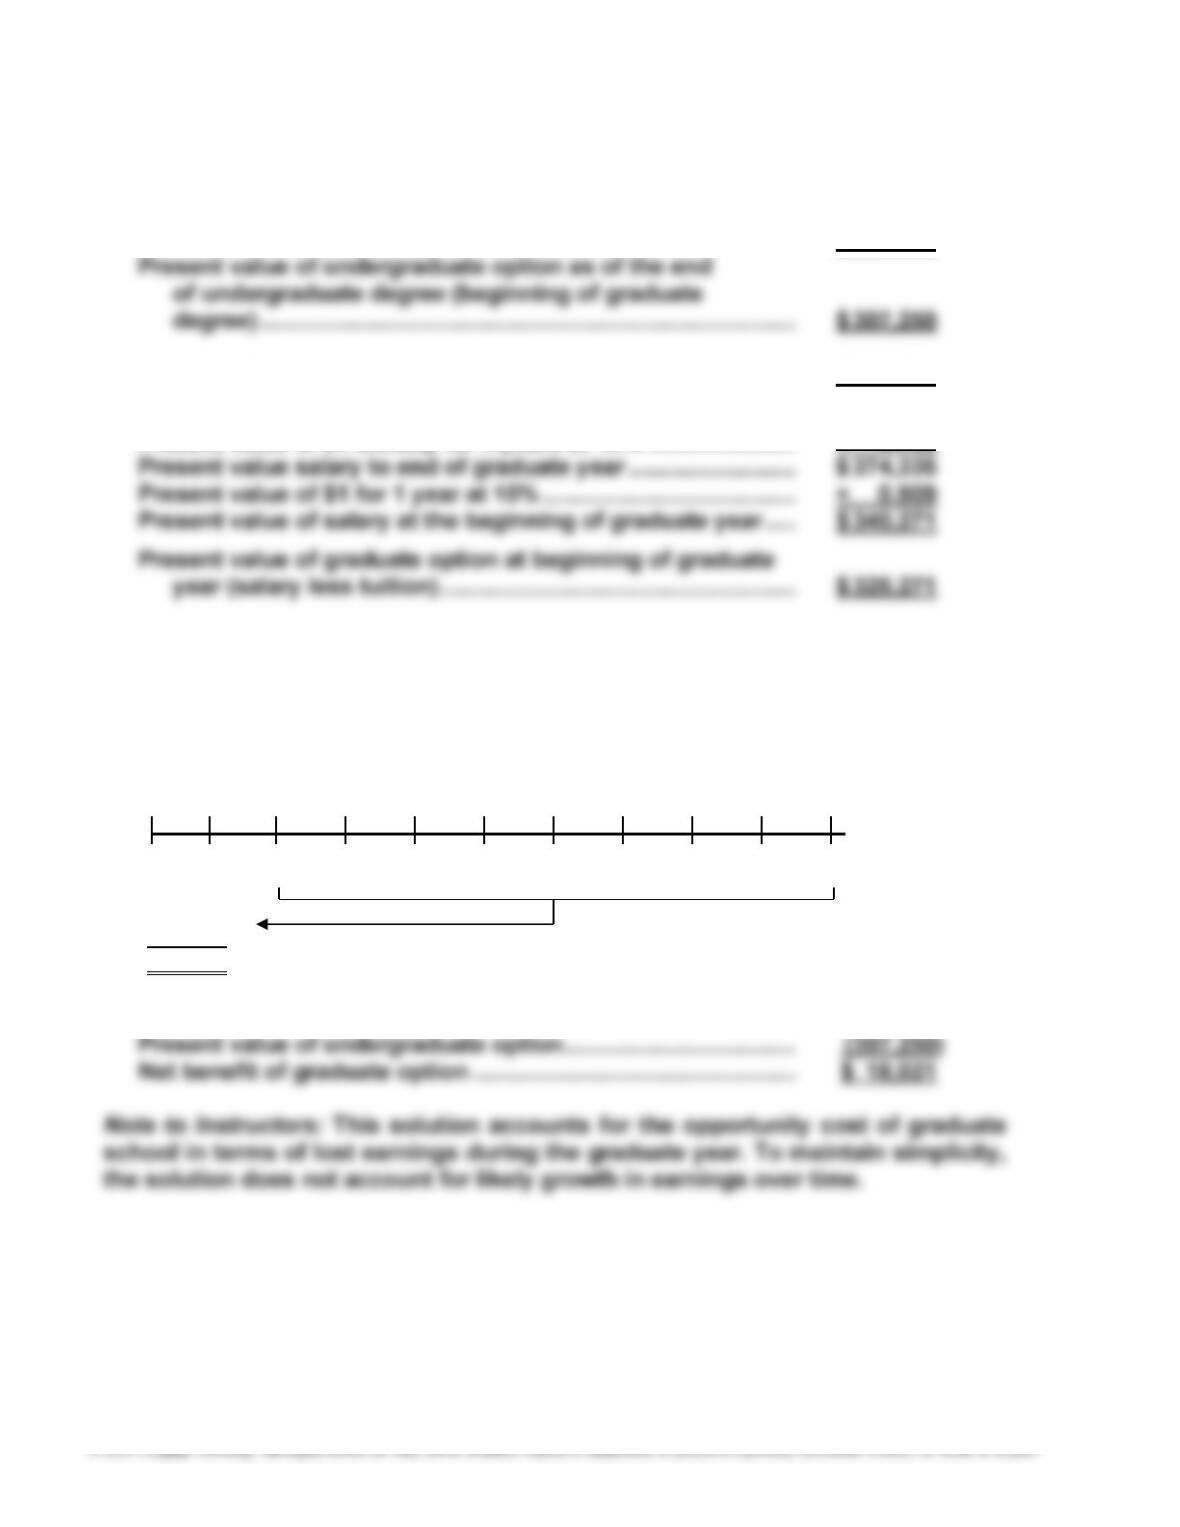
Note: The present values of parts (1) and (2) must be determined as of the
beginning of the graduate year in order to be compared. Thus, the present
value of the salary at the end of graduate school must be brought back one
period to the beginning of the graduate year since this salary stream is
delayed by one year of schooling. The following timeline shows the calculation.
0 1 2 3 4 5 6 7 8 9 10
($ 15,000) $65,000 $65,000 $65,000 $65,000 $65,000 $65,000 $65,000 $65,000 $65,000
$340,271 ($65,000 5.759) 0.909
$325,271
3. Present value of graduate option ………………………………………. $325,271
515
Case 15–3
1. Since all the net cash flows are incurred in the local economy under this
assumption, the internal rate of return of the new plant will likely decline. This
is because the cash profits earned on the plant will be less in U.S. dollars as a
2. If the plant produced for export only, then the expenses would be incurred in
local currency, and the revenues would be earned in U.S. dollars. This could
work in favor of the project because the expenses in U.S. dollar terms would
Case 15–4
In all three companies, the executives indicate that financial investment analysis
plays a minor role in the selection of projects because all three companies deal
with products that have highly uncertain future cash flows. Thus, any attempt at a
financial investment analysis could be highly suspect. Instead, these managers
516
Case 15–5
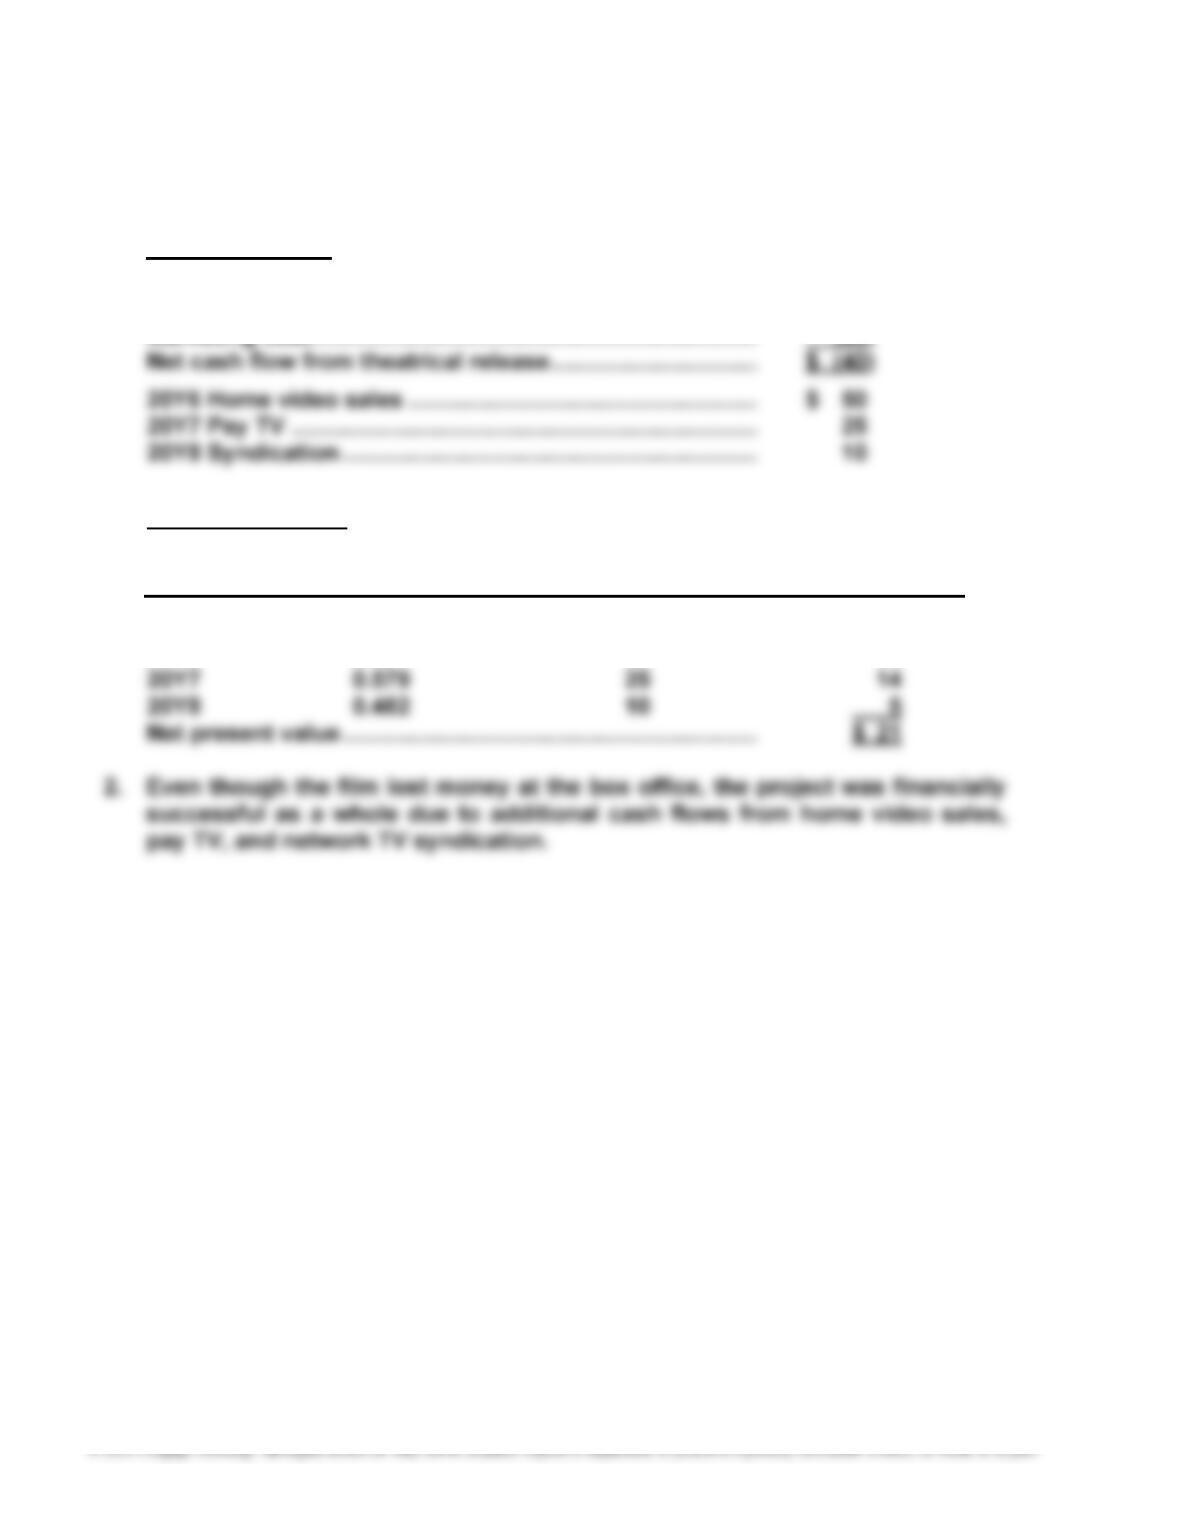
1. (All amounts are in millions.)
20Y5 cash flows:
Gross ticket sales ……………………………………………………… $ 240
Production cost …………………………………………………………. (200)
Net present value:
Present Value Net Cash Present Value of
Year of $1 at 20% Flows Net Cash Flows
20Y5 0.833 $(40) $ (33)
20Y6 0.694 50 35
517
Case 15–6
This activity could be assigned individually or in groups. This activity has the stu-
dent(s) perform a capital investment analysis for a printer/copier/scanner/fax
machine, using information available to them on the Internet and from local busi-
Assumed average charge per document ……………………………….. $ 0.20
Semester cost (1,000 documents × $0.20) ……………………………… $ 200
Present value of $200 for 6 semiannual periods at 5%
($200 × 5.08) ……………………………………………………………….. $1,016
Less assumed price of a mid-range printer/copier/scanner/fax