1. The two major types of financial statement analysis discussed in this chapter are common-size
analysis and ratio analysis.
2. Horizontal analysis expresses line items of financial statements as a percentage of a prior-
period amount. Vertical analysis expresses the line item as a percentage of some other line item
for the same time period. Both should be done as each provides different insights into the
financial strength of a company.
4. Liquidity ratios measure the ability of a firm to meet its short-term obligations. Leverage ratios
measure the ability of a firm to meet both long- and short-term obligations. Profitability ratios
measure the earning ability of a firm.
5. Two types of standards used in ratio analysis are historical and industrial standards. Historical
standards allow one to assess trends over time. Industrial standards allow one to assess a
company’s performance relative to that of other firms.
6. The current ratio includes all current assets, from very liquid cash to less liquid inventories. The
quick ratio excludes inventories and thus provides a better measure of liquidity (inventories are
sometimes obsolete or may turn over slowly).
9. The debt ratio is computed as total liabilities divided by total assets. By restricting the debt ratio,
the bank is trying to reduce the risk of default by ensuring that assets remain relatively high
compared with liabilities.
10. The purchase alternative would increase the liabilities reported on the balance sheet. Increasing
liabilities may cause the company to violate some existing debt covenants. The lease payment,
however, had an immediate impact on the income statement rather than the balance sheet.
15 FINANCIAL STATEMENT ANALYSIS
DISCUSSION QUESTIONS
CHAPTER 15 Financial Statement Analysis
12. For someone retiring, an annual income would be needed. Accordingly, companies that have
high yields and moderate payout ratios would be preferred to those that have a lower yield.
14. Earnings per share is calculated as (Net Income – Preferred Dividends)/Average Common
Shares. When a company participates in a stock buyback program, it reduces the number of
outstanding shares of its common stock, which serves as the denominator in the earnings-per-
share ratio calculation. Therefore, when a company participates in a stock buyback program, it
increases its earnings per share by decreasing the denominator of Average Common Shares
outstandin
g
.
Some stock market analysts believe that one of the main reasons why firms participate in stock
bu
y
back
p
ro
g
rams is to increase its earnin
g
s
p
er share.
CHAPTER 15 Financial Statement Analysis
15-1. b
15-5. d
15-6. c
15-7. e
MULTIPLE-CHOICE QUESTIONS
CHAPTER 15 Financial Statement Analysis
BE 15-11
Y
ear 1 is the base year. Therefore, every dollar amount in Year 1 is 100% of itself.
Dollars Dollars Percent Dollars Percent
Net sales…………
…
$1,000,000 100% $1,100,000 110% $1,300,000 130%
Less: Cost of
goods sold……
…
(300,000) 100 (310,000) 103 (364,000) 121
Gross margin……
…
$ 700,000 100 $ 790,000 113 $ 936,000 134
Less: Operating
…
Percent
Dollar Amount of Line Item
BRIEF EXERCISES: SET A
Y
ear 1
Y
ear 2
Y
ear 3
Dollar Amount of Base Year Line Item
Percent for a Line Item =
CHAPTER 15 Financial Statement Analysis
BE 15-12
Since the analysis is based on net sales, net sales in each year equals 100% of itself.
Then, every line item on the income statement is expressed as a percent of that
year’s net sales.
Percent Dollars Percent Dollars Percent
Net sales…………
…
100% $1,100,000 100% $1,300,000 100%
Less: Cost of
goods sold……… 30 (310,000) 28 (364,000) 28
Gross margin……
…
70 $ 790,000 72 $ 936,000 72
…
BE 15-13
=
Y
ou first need to calculate marketable securities by subtracting the specific
known current assets from the given total current assets. Therefore, marketable
securities = $5,000,000 – $1,000,000 cash – $2,250,000 accounts receivable –
Current Liabilities
Quick Ratio
1.25
Cash + Marketable Securities + Accounts Receivable
Current Liabilities
2. =
=Percent for a Line Item
=Current Ratio
Y
ear 1
Dollars
=
1.
$5,000,000
$4,000,000
Current Assets
$1,000,000
(300,000)
$ 700,000
Dollar Amount of Line Item
Dollar Amount of Base Year Line Item
Y
ear 2
Y
ear 3
CHAPTER 15 Financial Statement Analysis
BE 15-14
= $157,500,000
3. Accounts Receivable Turnover
in Days
=
=
=
1. Average Accounts Receivable =
=
Beginning Receivables + Ending Receivable
s
2
$142,650,000 + $172,350,000
2
25.0 days
365 days
14.6 times
Days in a Year
Accounts Receivable Turnover Ratio
CHAPTER 15 Financial Statement Analysis
BE 15-15
4. Nikkola’s inventory turnover ratio is 30.0 times, which indicates that, on average,
the company converts finished goods inventory into sales 30 times a year.
Nikkola’s inventory turnover in days is 12.2, which indicates that, on average, the
company turns over finished goods inventory about every 12 days, which is
slightly more than twice per month. Without more detailed information on Nikkola
and its industry, it is difficult to classify these results as outstanding, poor,
Average Inventory
Inventory Turnover in Days
1.
3.
=
=
= $58,500,000
=
= 12.2 days
Inventory Turnover Ratio
$54,374,200 + $62,625,800
Days in a Year
Beginning Inventory + Ending Inventory
2
2
=
365 days
30.0
CHAPTER 15 Financial Statement Analysis
BE 15-17
BE 15-18
BE 15-19
Net Income + [Interest Expense × (1 – Tax Rate*)]
Average Total Assets
Return on Sales
=
1.
2.
Net Income
Sales
$915,197
Return on Assets
Average Total Assets
=$8,281,989
2
=
=
Debt Ratio1.
= $7,321,576=
=Beginning Total Assets + Ending Total Assets
2
$8,121,576 + $6,521,576
=
$7,321,576
$915,197 + [$50,000* × (1 – 0.40)]
=
=
0.111, or 11.1%
Total Liabilities
Total Assets
$32,500,000
$40,625,000
= 0.80, or 80%
CHAPTER 15 Financial Statement Analysis
BE 15-20
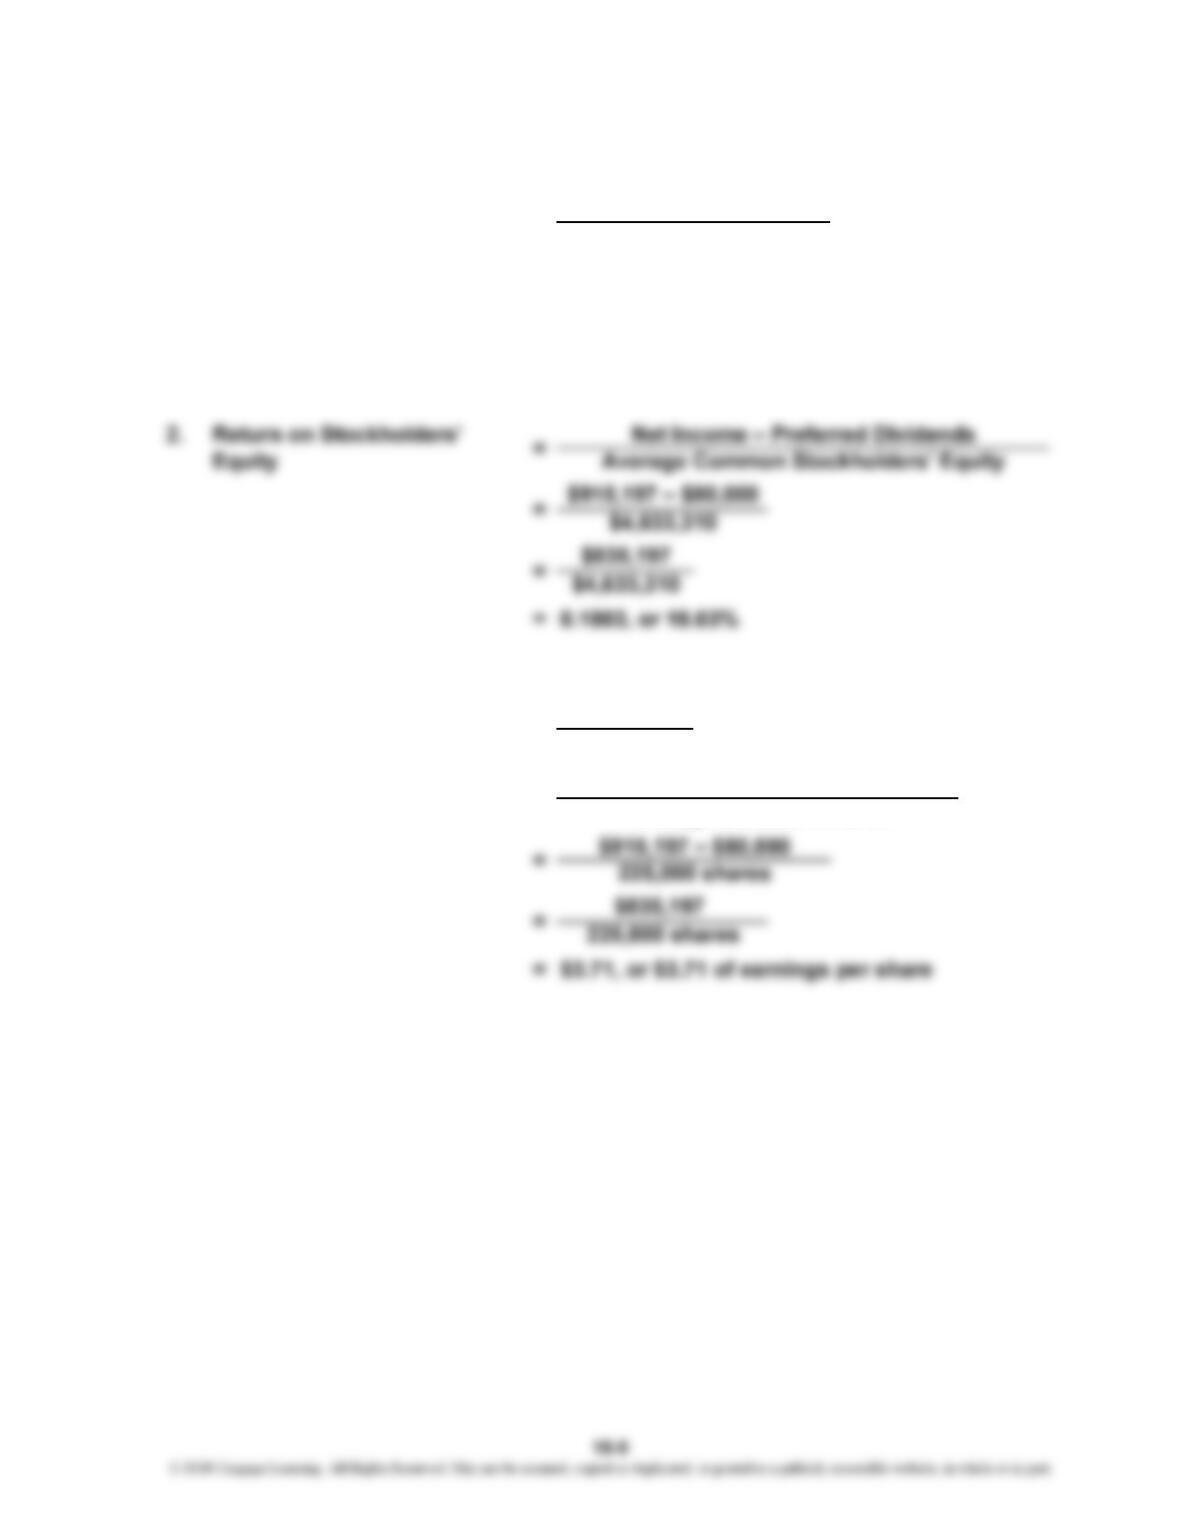
1. Average Common
Stockholders’ Equity
=
Note: Common stockholders’ equity for each year is calculated by summing
common stock, additional paid-in capital, and retained earnings. Therefore,
common stockholders’ equity for 20X1 = $337,500 + $2,000,000 + $2,612,465 =
BE 15-21
$4,949,965.
1.
Earnings per Share2. =
Number of Common Shares
$4,316,655 + $4,949,965
2
$4,633,310
=
Net Income – Preferred Dividends
=
$337,500
$1.50
Average Common Shares
= 225,000 shares
CHAPTER 15 Financial Statement Analysis
BE 15-22
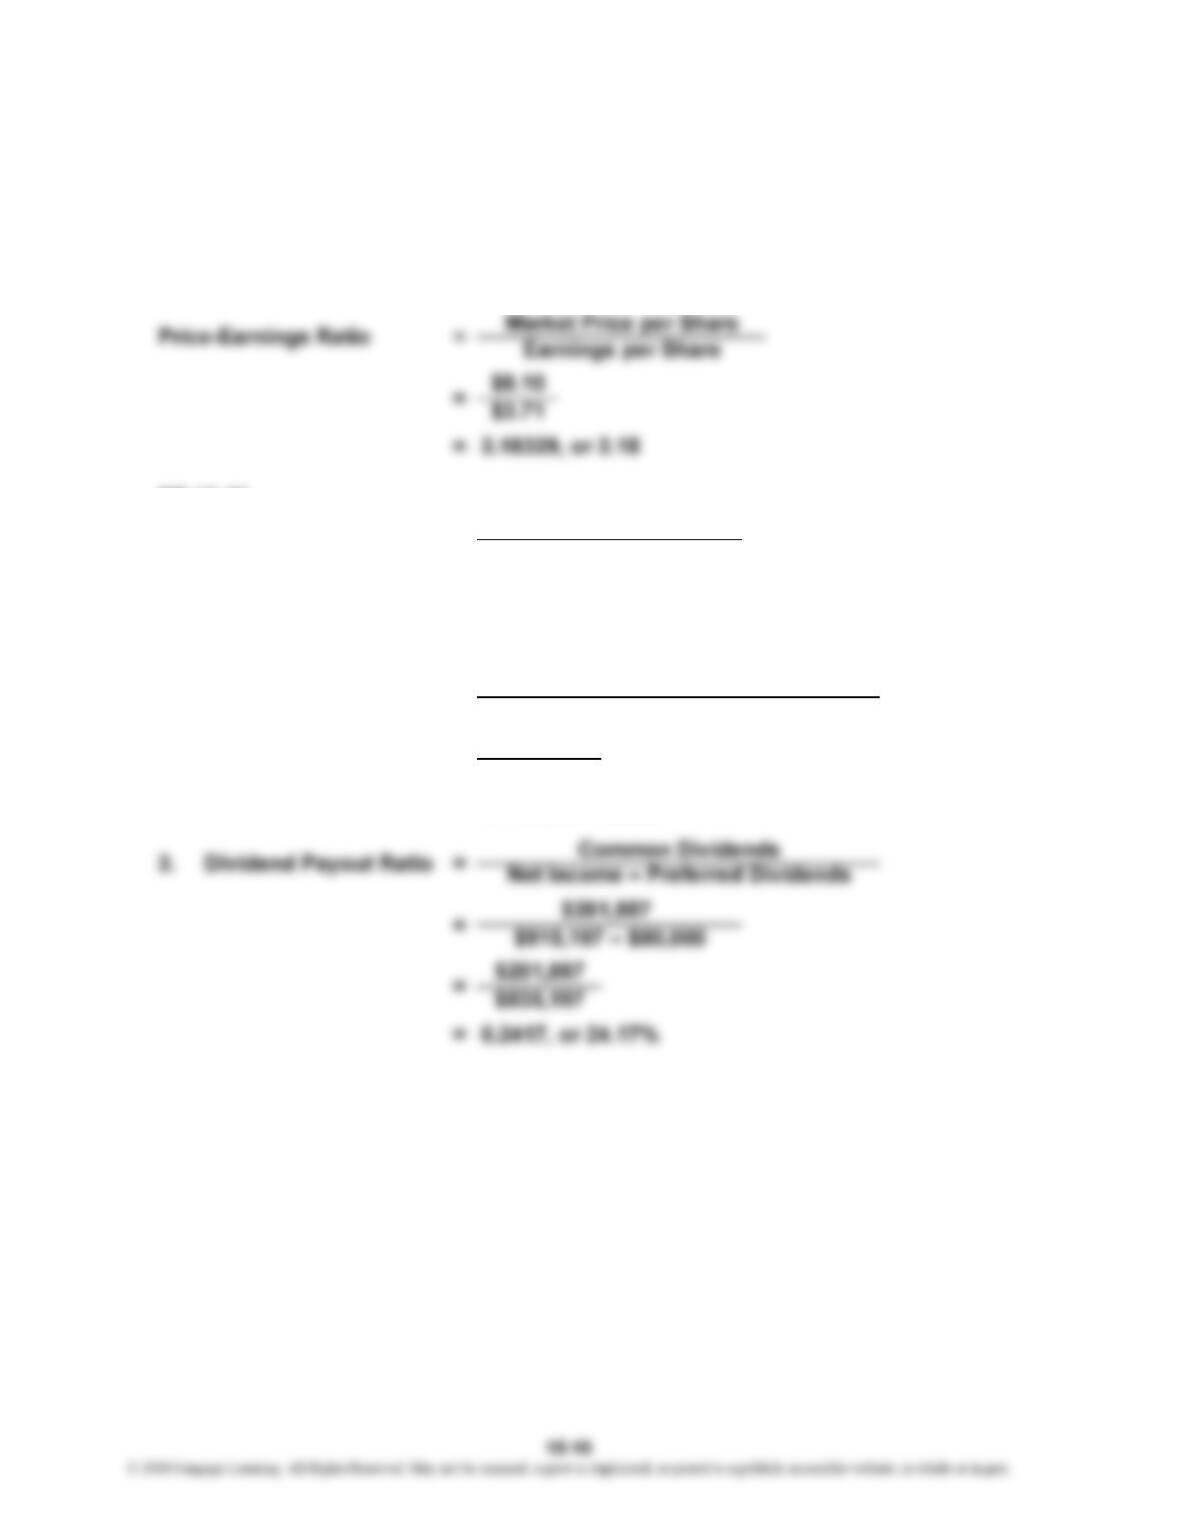
Before the price-earnings ratio can be computed, earnings per share must be
calculated for use as the denominator in the price-earnings ratio. Earnings per
share for Somerville equal $3.71. Refer to Brief Exercise 15-21 for
specific guidance on how to calculate earnings per share.
BE 15-23
Note: Number of common shares = $337,500/$1.50 par value per common
share = 225,000 common shares (see Brief Exercise 15-21 for
specific guidance on how to calculate the number of common shares).
= 0.1108, or 11.08%
225,000 shares
2.
1. Dividends per Share
Dividend Yield
=
=
=
= $0.8973
Dividends per Common Share
Market Price per Common Share
$0.8973
$8.10
$201,887
CHAPTER 15 Financial Statement Analysis
BE 15-24
Y
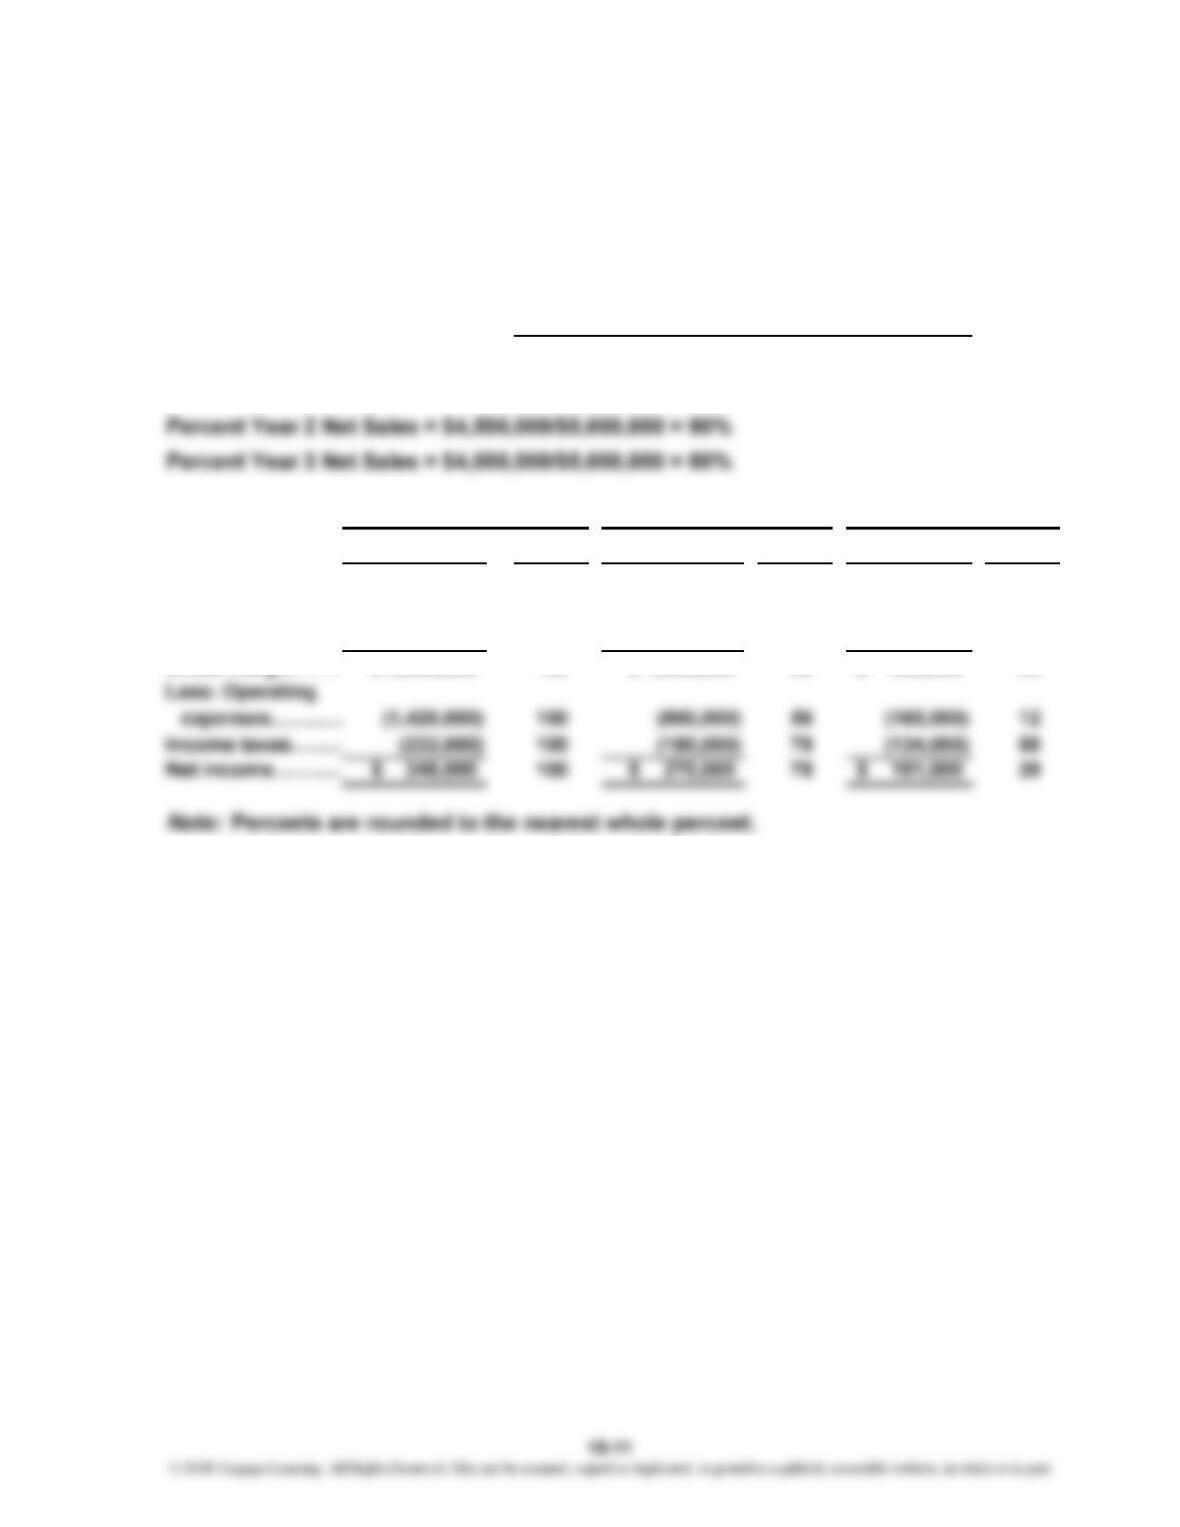
ear 1 is the base year. Therefore, every dollar amount in Year 1 is 100% of itself.
Percent Year 1 Net Sales = $5,000,000/$5,000,000 = 100
%
Dollars Percent Dollars Percent Dollars Percent
Net sales…………
…
$ 5,000,000 100% $ 4,500,000 90% $ 4,000,000 80%
Less: Cost of
goods sold……
…
(3,000,000) 100 (3,250,000) 108 (3,600,000) 120
…
Y
ear 1
Y
ear 2
Y
ear 3
BRIEF EXERCISES: SET B
Percent for a Line Item = Dollar Amount of Line Item
Dollar Amount of Base Year Line Item
CHAPTER 15 Financial Statement Analysis
BE 15-25
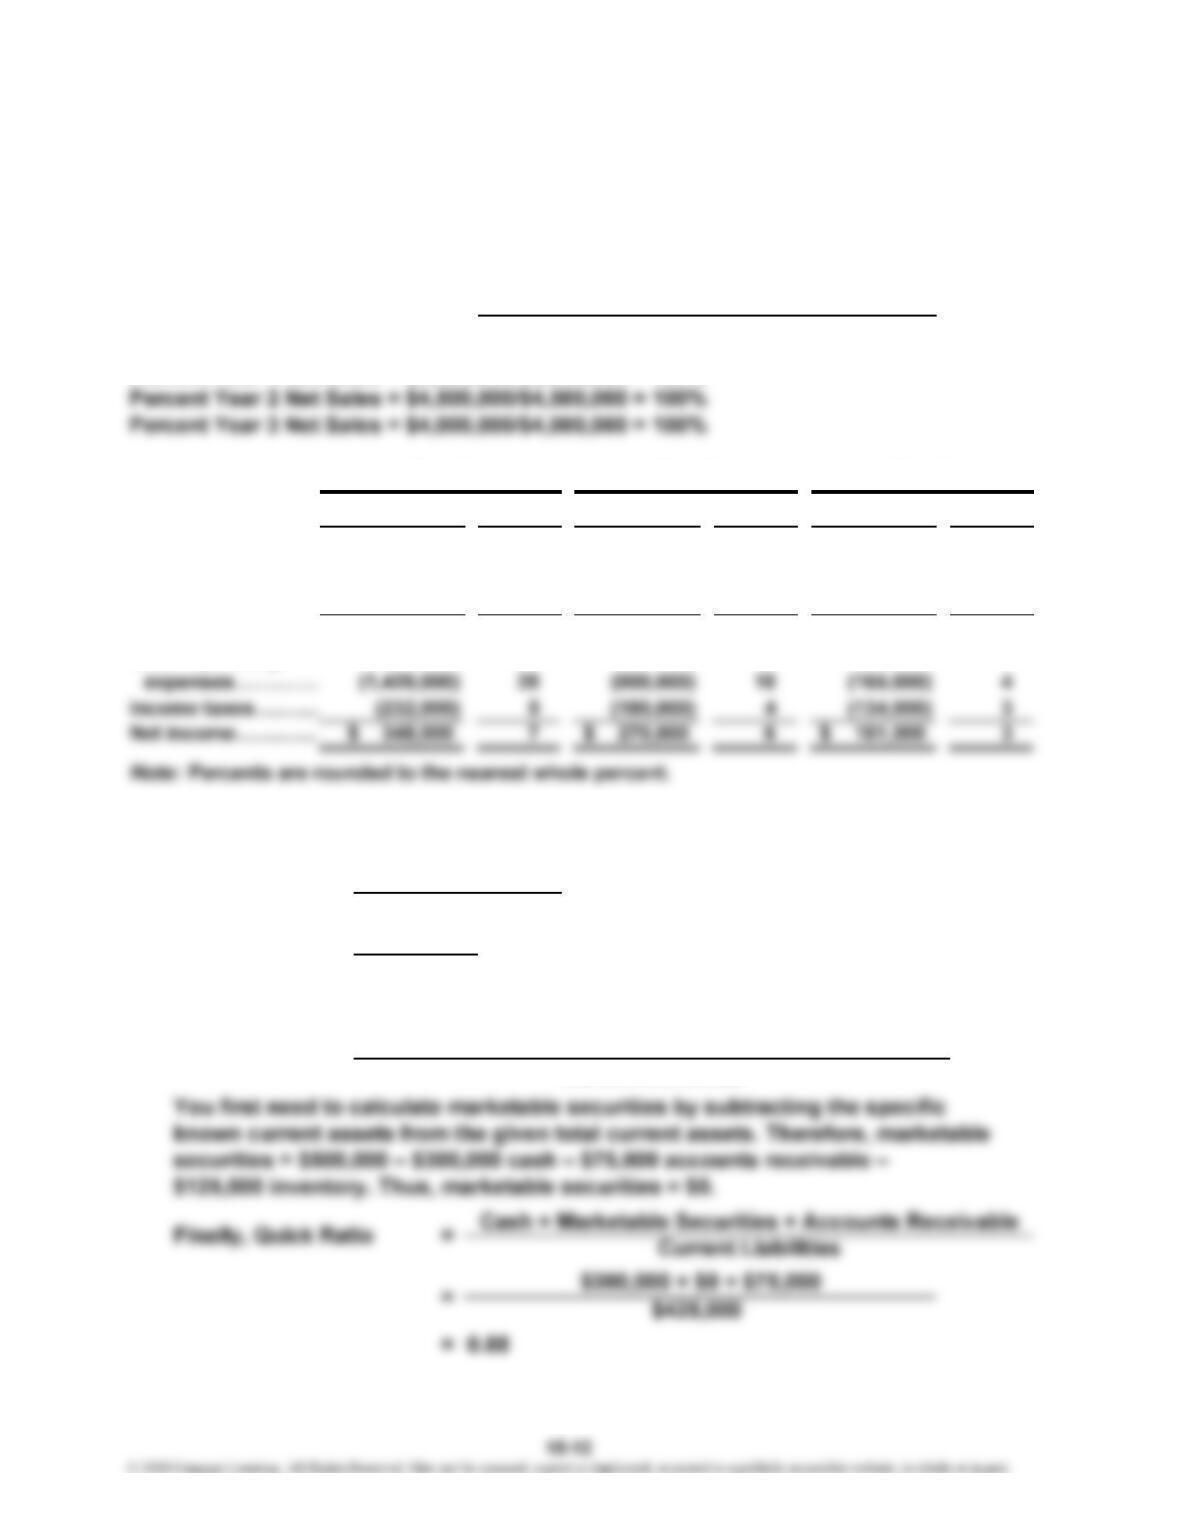
Since the analysis is based on net sales, net sales in each year equals 100% of itself.
Then, every line item on the income statement is expressed as a percent of that
year’s net sales.
Percent Year 1 Net Sales = $5,000,000/$5,000,000 = 100
%
Percent Dollars Percent Dollars Percent
Net sales……………
…
100% $ 4,500,000 100% $ 4,000,000 100%
Less: Cost of
goods sold………
…
60 (3,250,000) 72 (3,600,000) 90
Gross margin……… 40 $ 1,250,000 28 $ 400,000 10
Less: Operating
…
BE 15-26
=
Dollar Amount of Line Item
Dollar Amount of Base Year Line Item
Y
ear 1
Y
ear 2
Y
ear 3
Percent for a Line Item
1. =Current Ratio
=
Dollars
$ 5,000,000
(3,000,000)
$ 2,000,000
1.18
Current Assets
Current Liabilities
=$500,000
$425,000
2. =Quick Ratio Cash + Marketable Securities + Accounts Receivable
Current Liabilities
%
%
CHAPTER 15 Financial Statement Analysis
BE 15-27
= $6,000,000
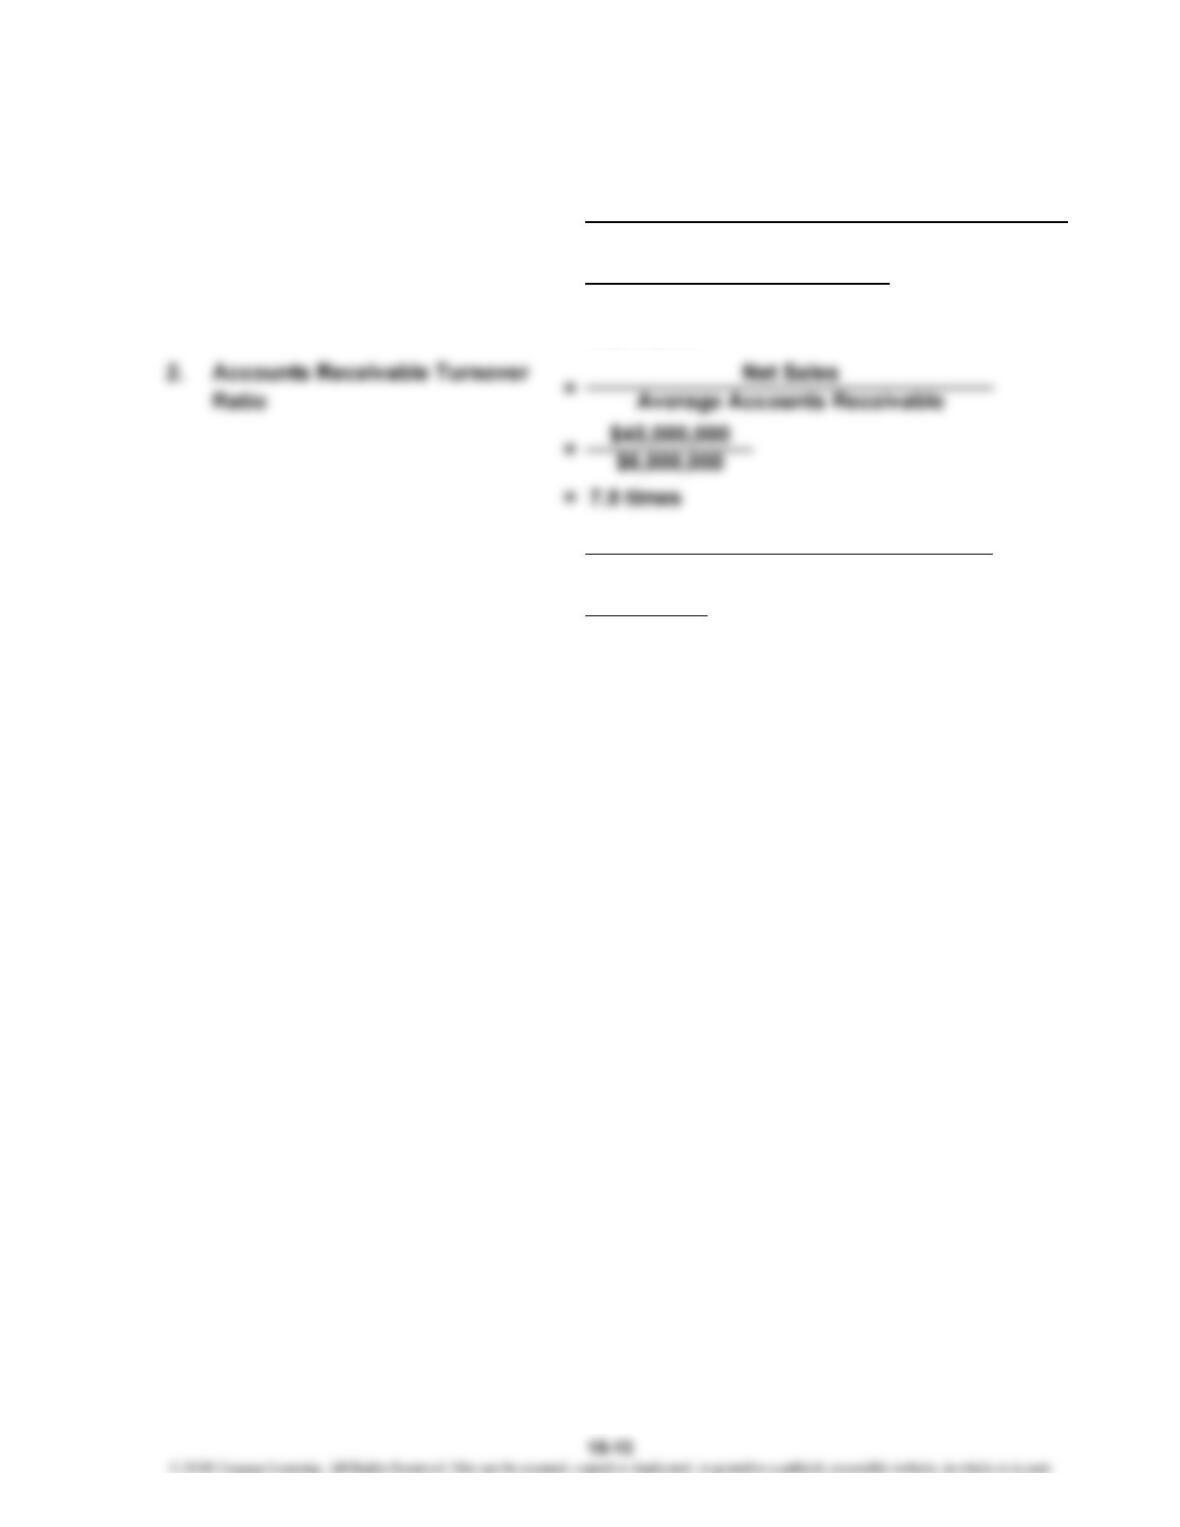
3. Accounts Receivable Turnover
in Days
=
=$5,500,000 + $6,500,000
2
1. Average Accounts Receivable = Beginning Receivables + Ending Receivable
s
2
48.7 days
=Days in a Year
Accounts Receivable Turnover Ratio
=365 days
7.5 times
CHAPTER 15 Financial Statement Analysis
BE 15-28
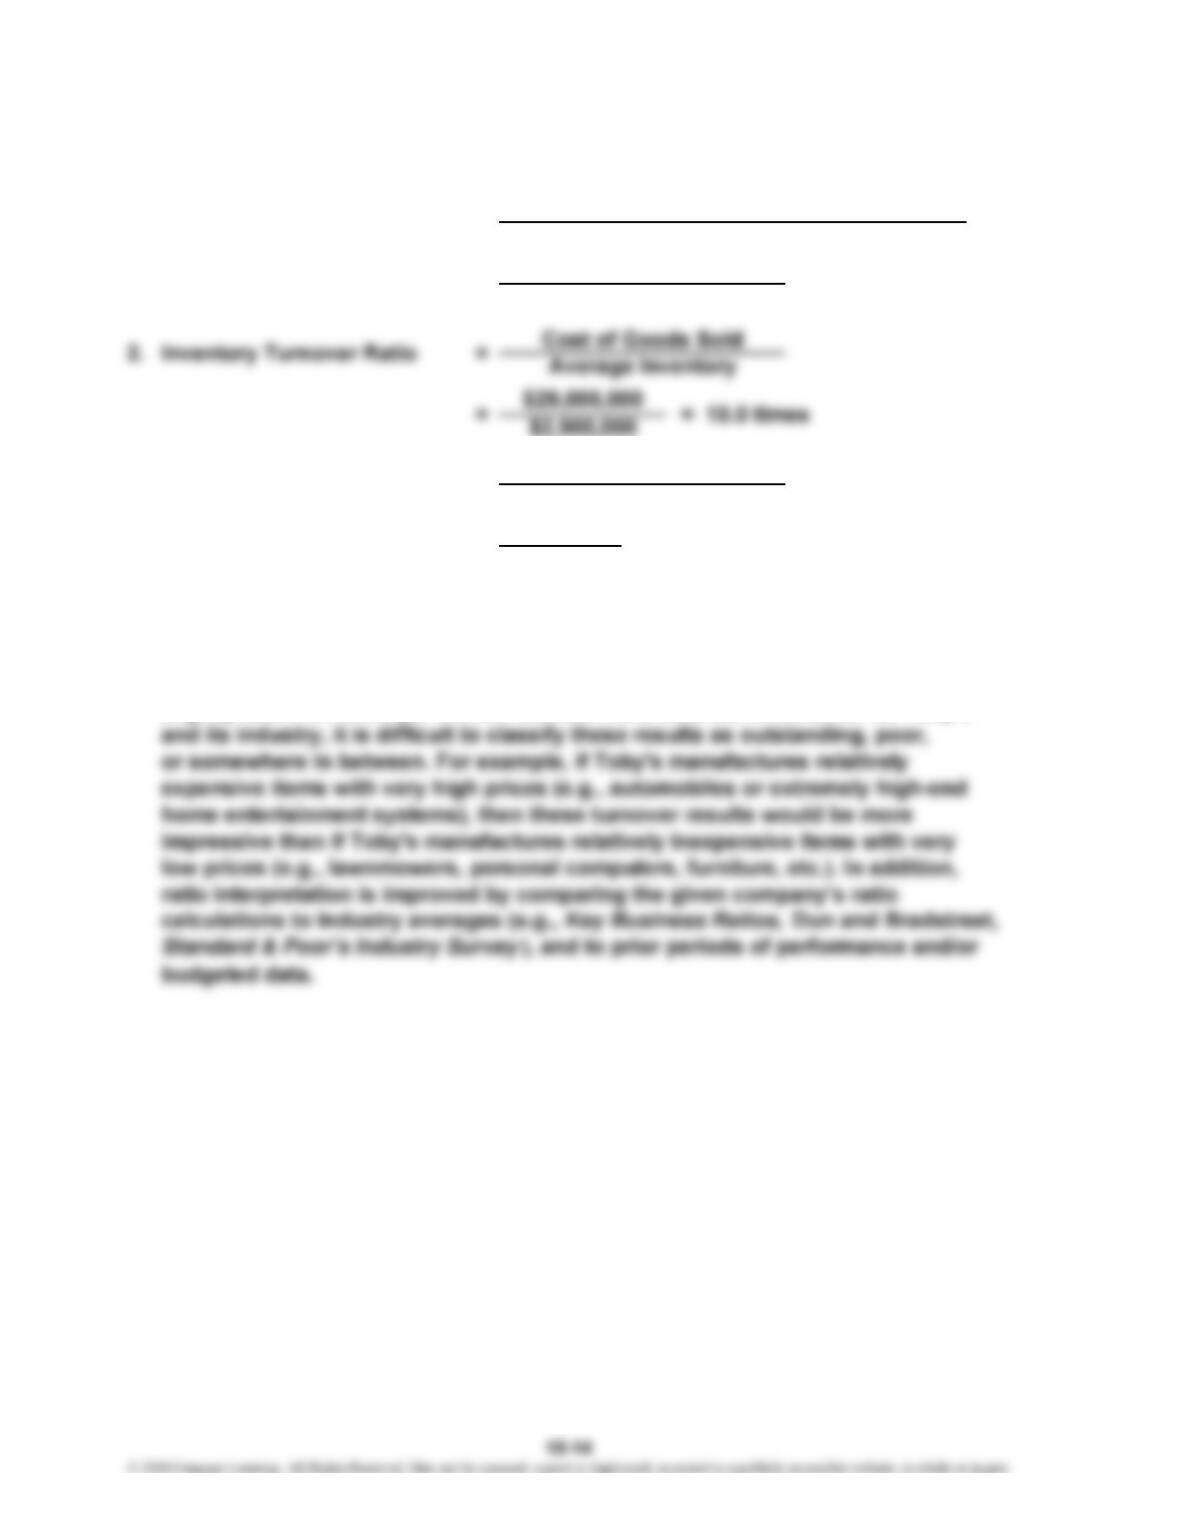
4. Toby’s inventory turnover ratio is 10.0 times, which indicates that, on average,
the company converts finished goods inventory into sales 10 times a year.
Toby’s inventory turnover in days is 36.5, which indicates that, on average, the
company turns over finished goods inventory about every 36 days, which is
slightly less than once per month. Without more detailed information on Toby’s
1. Average Inventory = Beginning Inventory + Ending Inventory
2
2
=$3,000,000 + $2,800,000 = $2,900,000
10.0
3. Inventory Turnover in Days = Days in a Year
Inventory Turnover Ratio
=365 days = 36.5 days
CHAPTER 15 Financial Statement Analysis
BE 15-29
BE 15-32
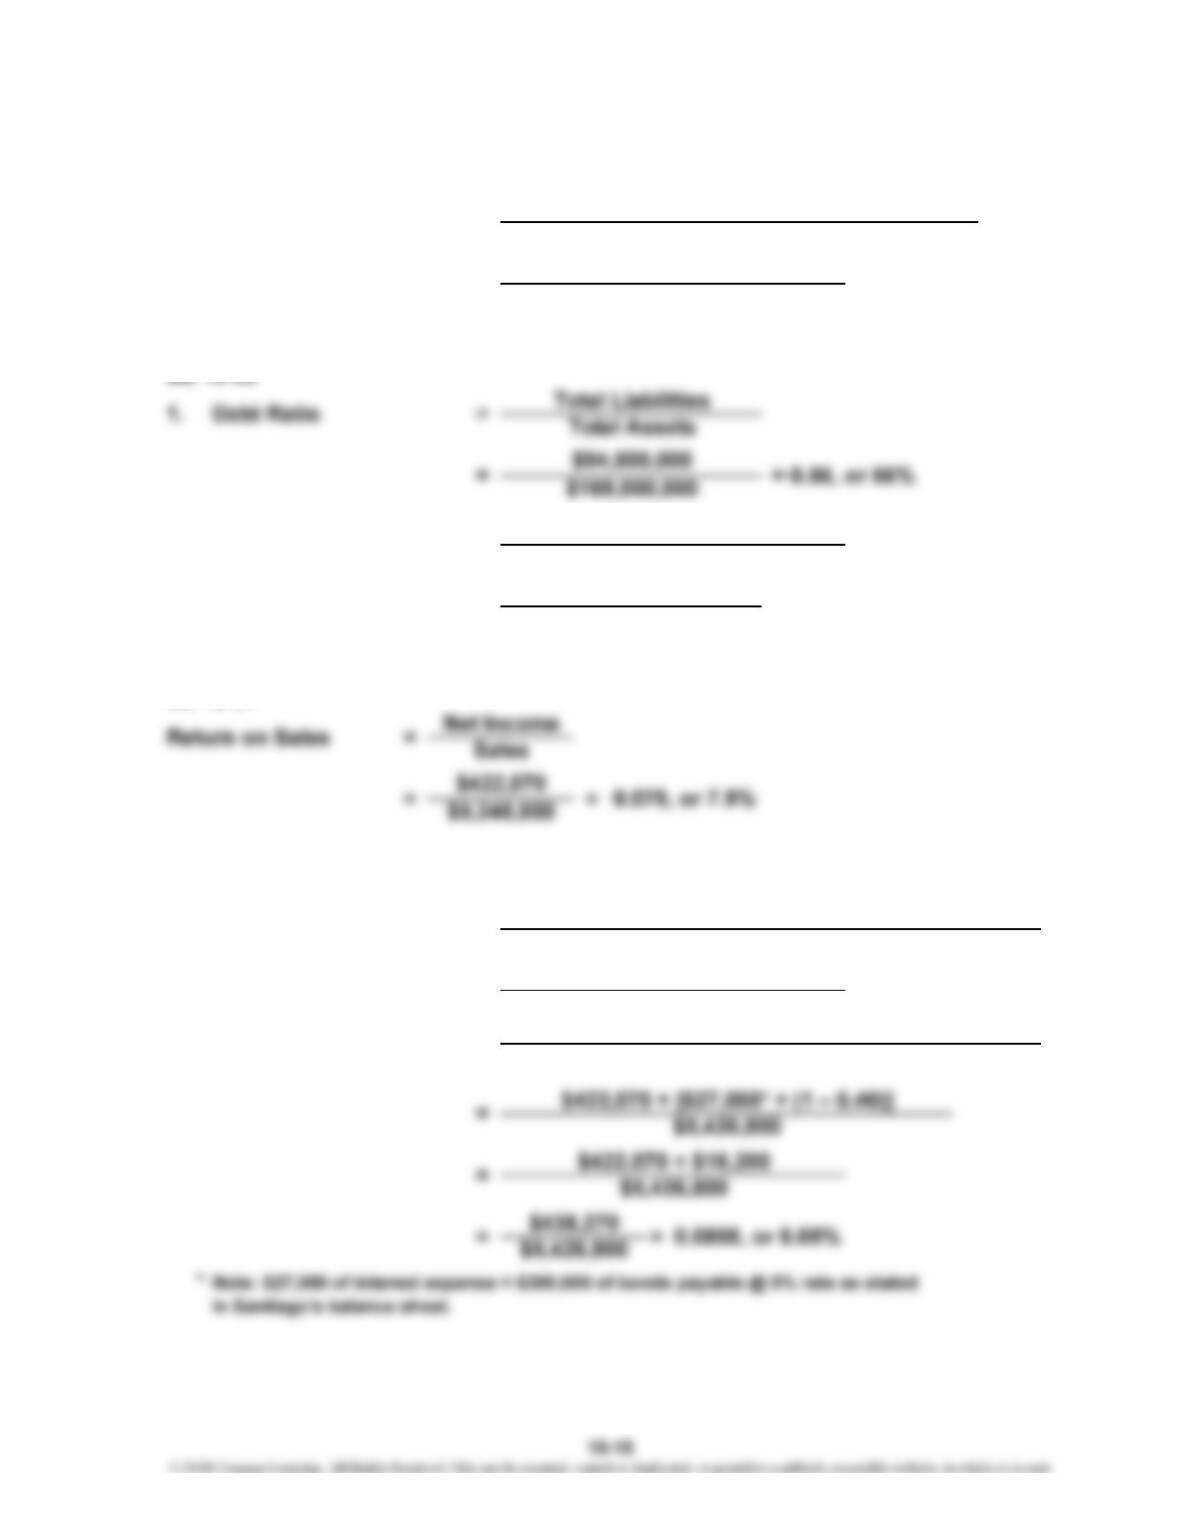
Net Income + [Interest Expense × (1 – Tax Rate*)]
Average Total Assets
=
= = 2.7 times
Times-Interest-Earned Ratio Income Before Taxes + Interest Expense
Interest Expense
$16,400,000 + $9,500,000
$9,500,000
2. =Debt-to-Equity Ratio Total Liabilities
Total Stockholders’ Equity
= = 1.25
$94,000,000
$75,000,000
=$5,295,800 + $5,557,800 = $5,426,800
2
1. Average Total Assets = Beginning Total Assets + Ending Total Assets
2
2. Return on Assets =
CHAPTER 15 Financial Statement Analysis
BE 15-33
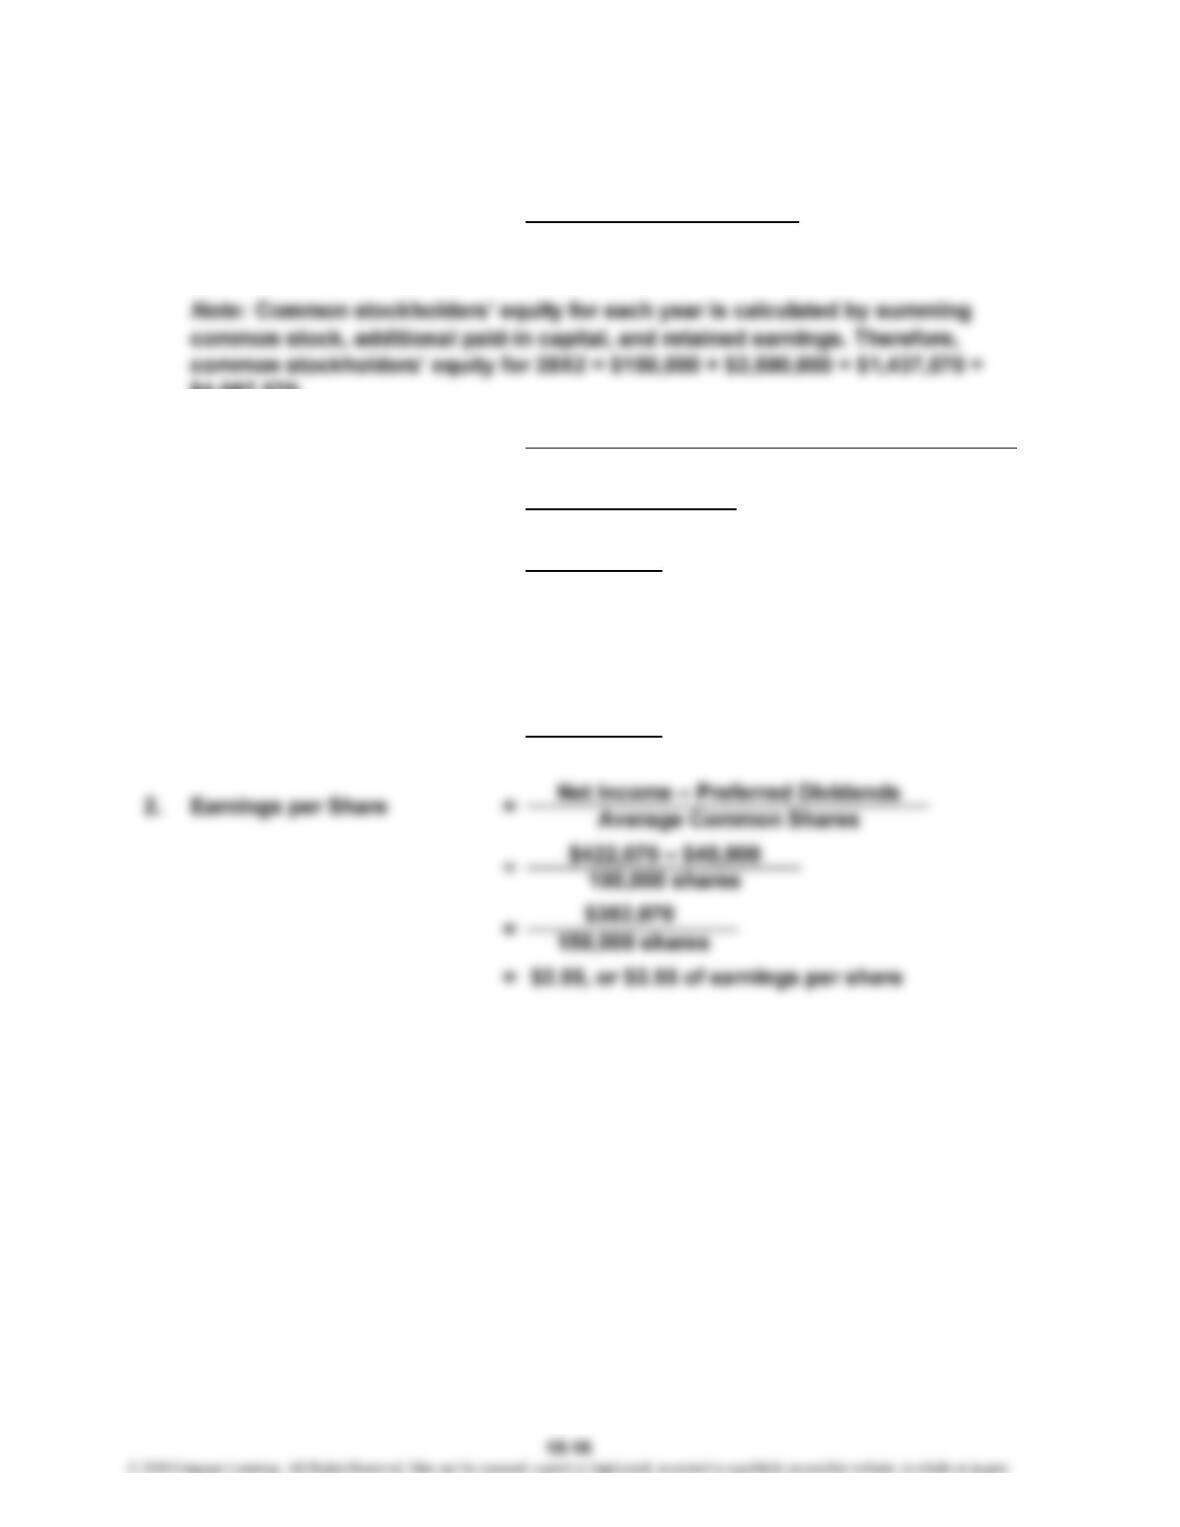
1. Average Common
Stockholders’ Equity
=
2. Return on Stockholders’
Equity
= 0.0962, or 9.62%
BE 15-34
= 150,000 shares
=$3,855,500 + $4,087,570
2
$3,971,535
$4,087,570.
=Net Income – Preferred Dividends
Average Common Stockholders’ Equity
=$422,070 – $40,000
$3,971,535
=$382,070
$3,971,535
$1.00
1. Number of Common Shares = $150,000
CHAPTER 15 Financial Statement Analysis
BE 15-35
Before the price-earnings ratio can be computed, earnings per share must be
calculated for use as the denominator in the price-earnings ratio. Earnings per
share for Santiago equal $2.55. Refer to Brief Exercise 15-34 for
specific guidance on how to calculate earnings per share.
BE 15-36
Note: Number of common shares = $150,000/$1.00 par value per common
= 0.0500, or 5.00%
1. = = $1.0000
Dividends per Share $150,000
150,000 shares
2. =Dividend Yield Dividends per Common Share
Market Price per Common Share
3. =Dividend Payout Ratio Net Income – Preferred Dividends
Common Dividends
=$1.0000
$20.00
CHAPTER 15 Financial Statement Analysis
E 15-37
Sales…………………………………………………
…
$ 1,800,000 90.0%
Less: Cost of goods sold…………………………
…
(1,200,000) 85.7
Gross margin……………………………………
…
$ 600,000 100.0
Less operating expenses:
E 15-38
1.
Sales…………………………………………………
…
$ 2,000,000 100.0%
Less: Cost of goods sold………………..………… (1,400,000) 70.0
Gross margin……………………………………
…
$ 600,000 30.0
Less operating expenses:
2.
Sales…………………………………………………… $ 1,800,000 100.0%
Less: Cost of goods sold…………………………
…
(1,200,000) 66.7
Gross margin……………………………………
…
$ 600,000 33.3
Less operating expenses:
Selling expenses……………………………..…
…
(300,000) 16.7
Y
ear 2
Y
ear 2 Sales
Y
ear 1 Amount
Y
ear 2 Amount
Percent of
EXERCISES
Y
ear 1
Y
ear 1 Sales
Percent of
Percent of
CHAPTER 15 Financial Statement Analysis
E 15-39
1.
Y
ear 2
Sales…………………………………..……………
…
$1,200,000 120.0%
Less: Cost of goods sold………………………
…
(700,000) 100.0
Gross margin…………………………………… $ 500,000 166.7
Less operating expenses:
Selling expenses…………………………..…
…
(220,000) 146.7
2.
Y
ear 3
Sales……………………………………………..…
…
$ 1,700,000 170.0%
Less: Cost of goods sold………………………
…
(1,000,000) 142.9
Gross margin…………………………………… $ 700,000 233.3
Less operating expenses:
…
…
E 15-40
1.
Y
ear 1
Sales…………………………………………..……
…
$1,000,000 100.0%
Less: Cost of goods sold………………………
…
(700,000) 70.0
Gross margin…………………………………… $ 300,000 30.0
Less operating expenses:
Selling expenses………………………………
…
(150,000) 15.0
Administrative expenses……………………
…
(50,000) 5.0
…
Percent of
Sales in Year 1
Percent of
Y
ear 1
Percent of
Y
ear 1
…
CHAPTER 15 Financial Statement Analysis
E 15-40 (Concluded)
2.
Y
ear 2
Sales………………………………….………………
…
$1,200,000 100.0%
Less: Cost of goods sold…………………………
…
(700,000) 58.3
Gross margin…………………………………….. $ 500,000 41.7
Less operating expenses:
3.
Y
ear 3
Sales………………………………….………………
…
$ 1,700,000 100.0%
Less: Cost of goods sold…………………………
…
(1,000,000) 58.8
Gross margin…………………………………….. $ 700,000 41.2
Less operating expenses:
E 15-41
$29,340,000
$16,300,000
=1.8
1.
Current Ratio
Current Assets
Current Liabilities
=
=
Percent of
Sales in Year 2
Percent of
Sales in Year 3