An asterisk (*) will appear to the right of an incorrect entry. The essay answer will not be graded.
1.
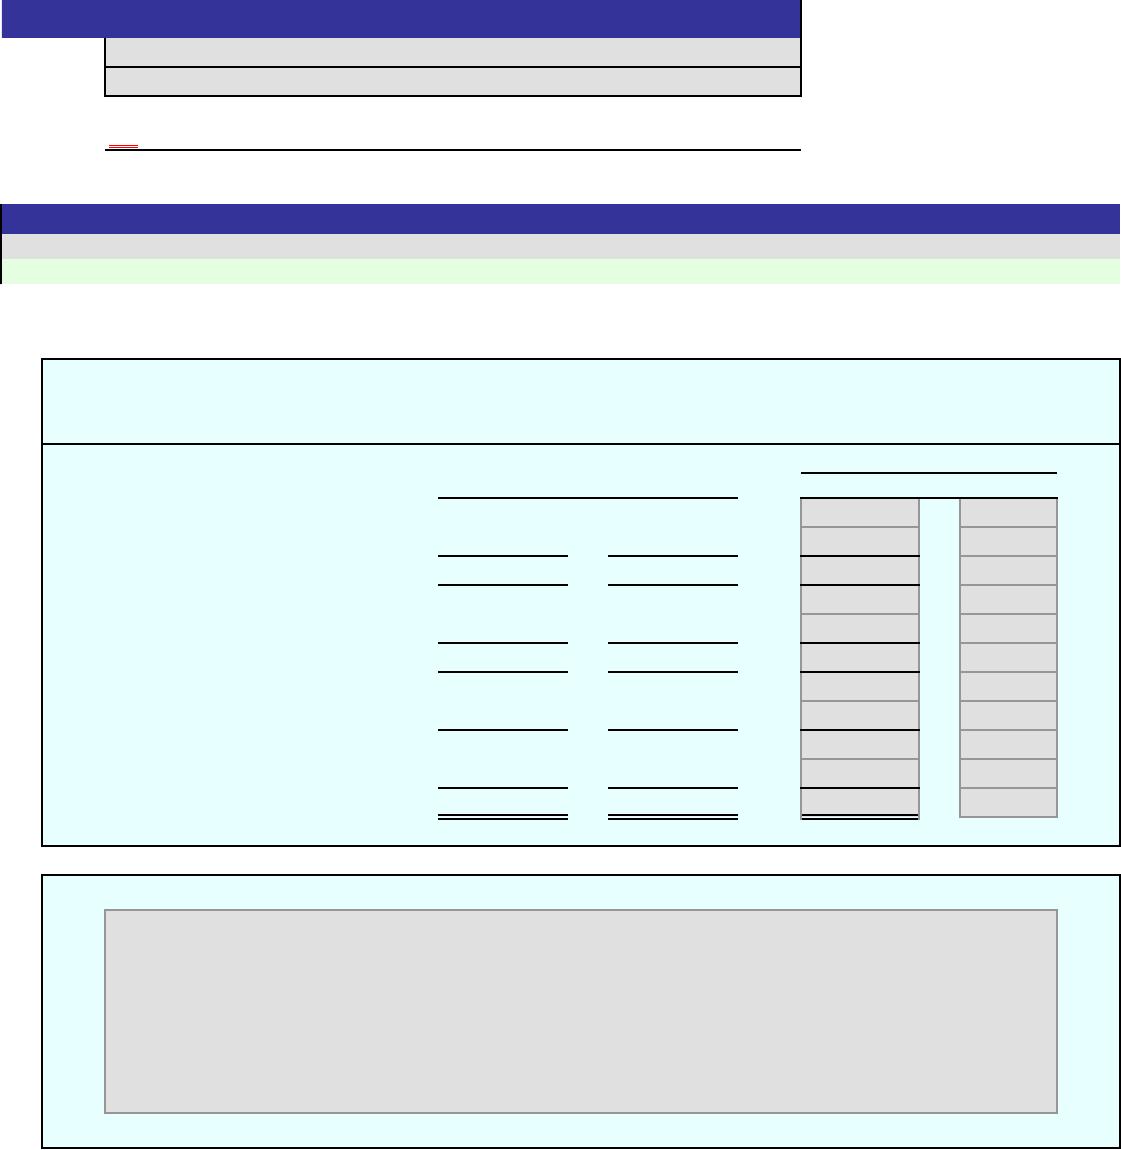
2016 2015
Amount Amount Amount Percent
Sales 6,750,000$ 6,000,000$
Cost of goods sold 2,480,000 2,000,000
Gross profit 4,270,000$ 4,000,000$
Selling expenses 1,260,000$ 1,000,000$
Administrative expenses 625,000 500,000
Total operating expenses 1,885,000$ 1,500,000$
Income from operations 2,385,000$ 2,500,000$
E
Other income 110,000 100,000
Income before income tax 2,495,000$ 2,600,000$
Income tax expense 60,000 50,000
Net income 2,435,000$ 2,550,000$
2.
Score:
Key Code:
Instructions
Problem 15(14)-1A
Name:
Section:
0%
Increase (Decrease)
[Key essay answer here]
[Key code here]
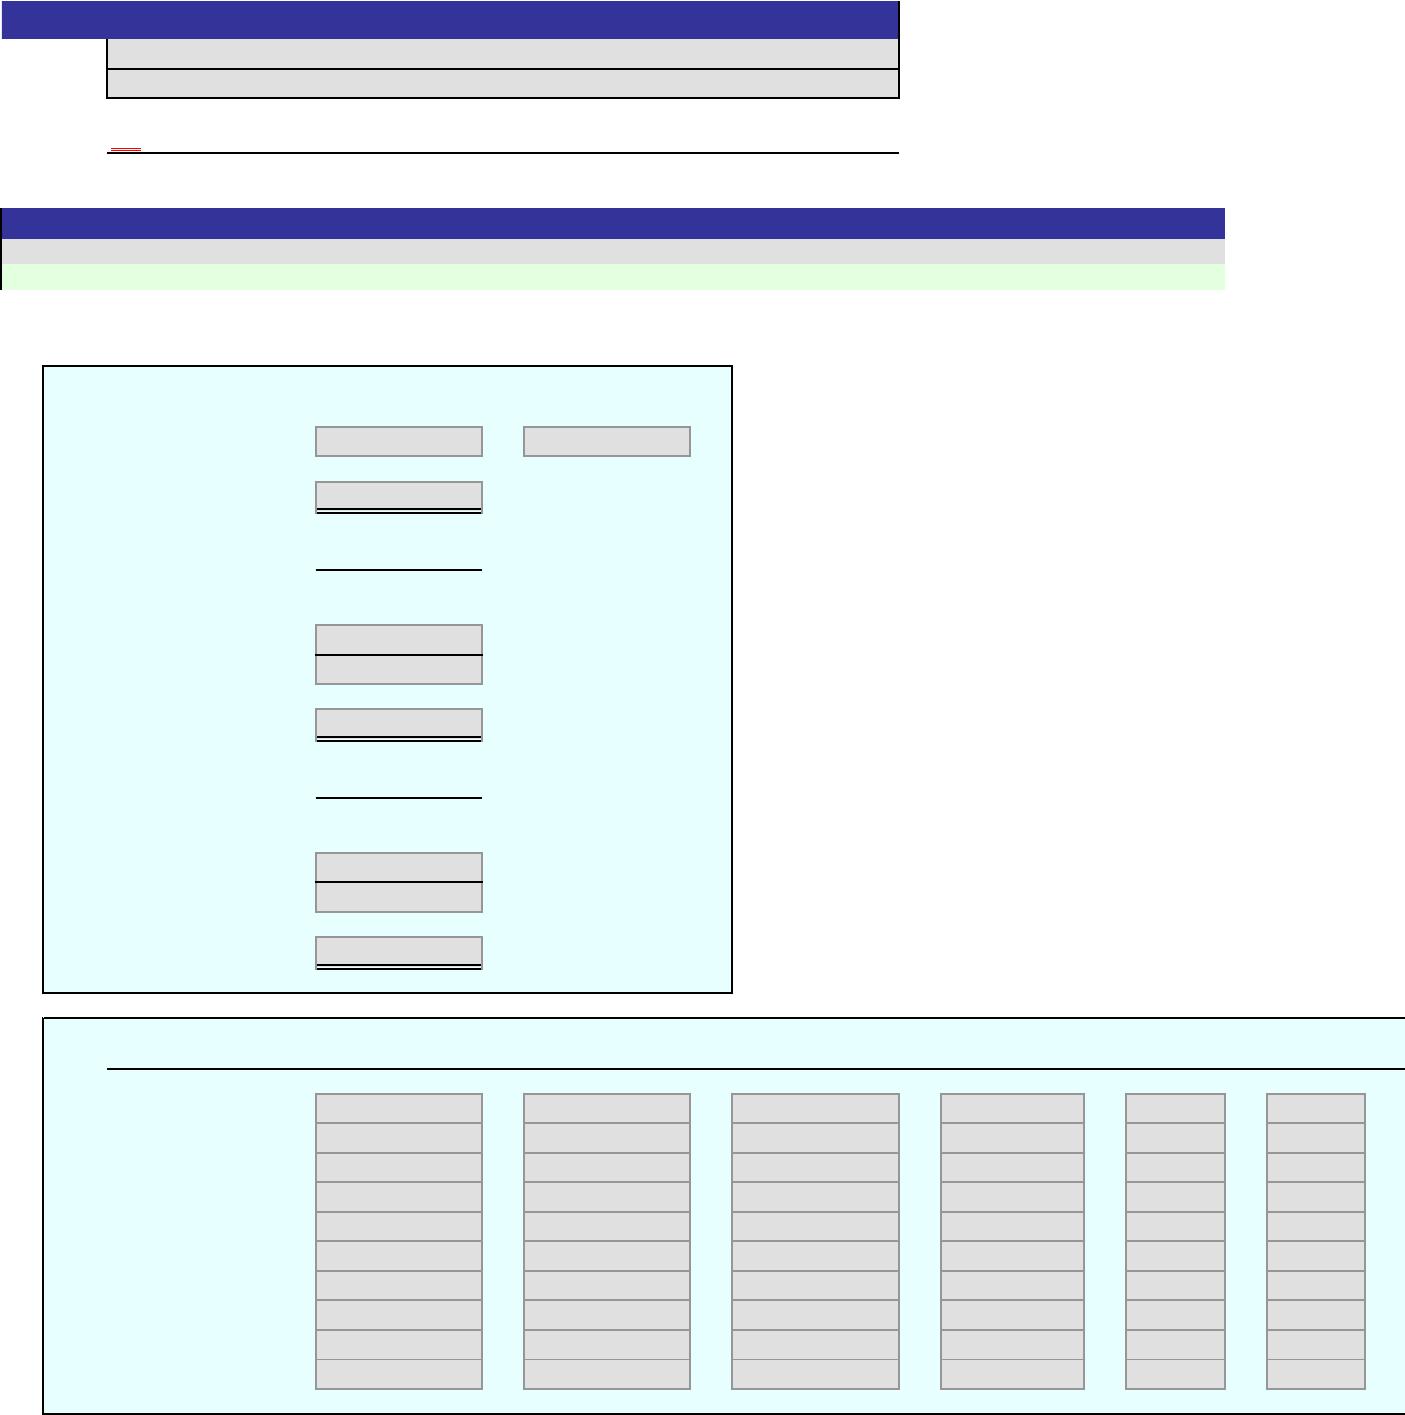
Answers are entered in the cells with gray backgrounds.
Cells with non-gray backgrounds are protected and cannot be edited.
CLAPTON COMPANY
Comparative Income Statement
For the Years Ended December 31, 2016 and 2015
An asterisk (*) will appear to the right of an incorrect entry. The essay answer will not be graded.
1.
2016 2015
Amount Amount Amount Percent
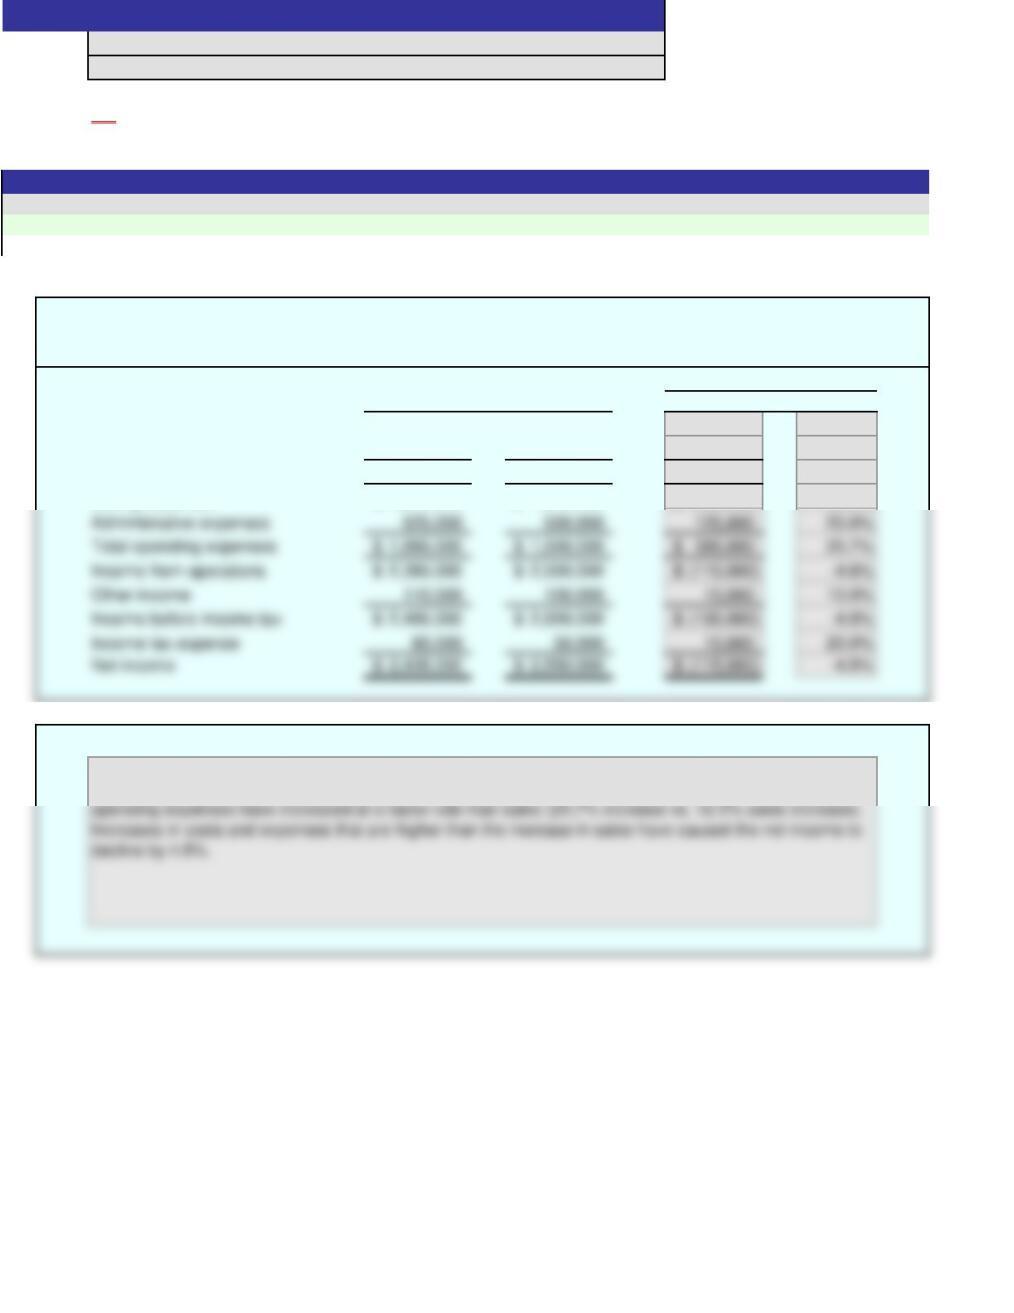
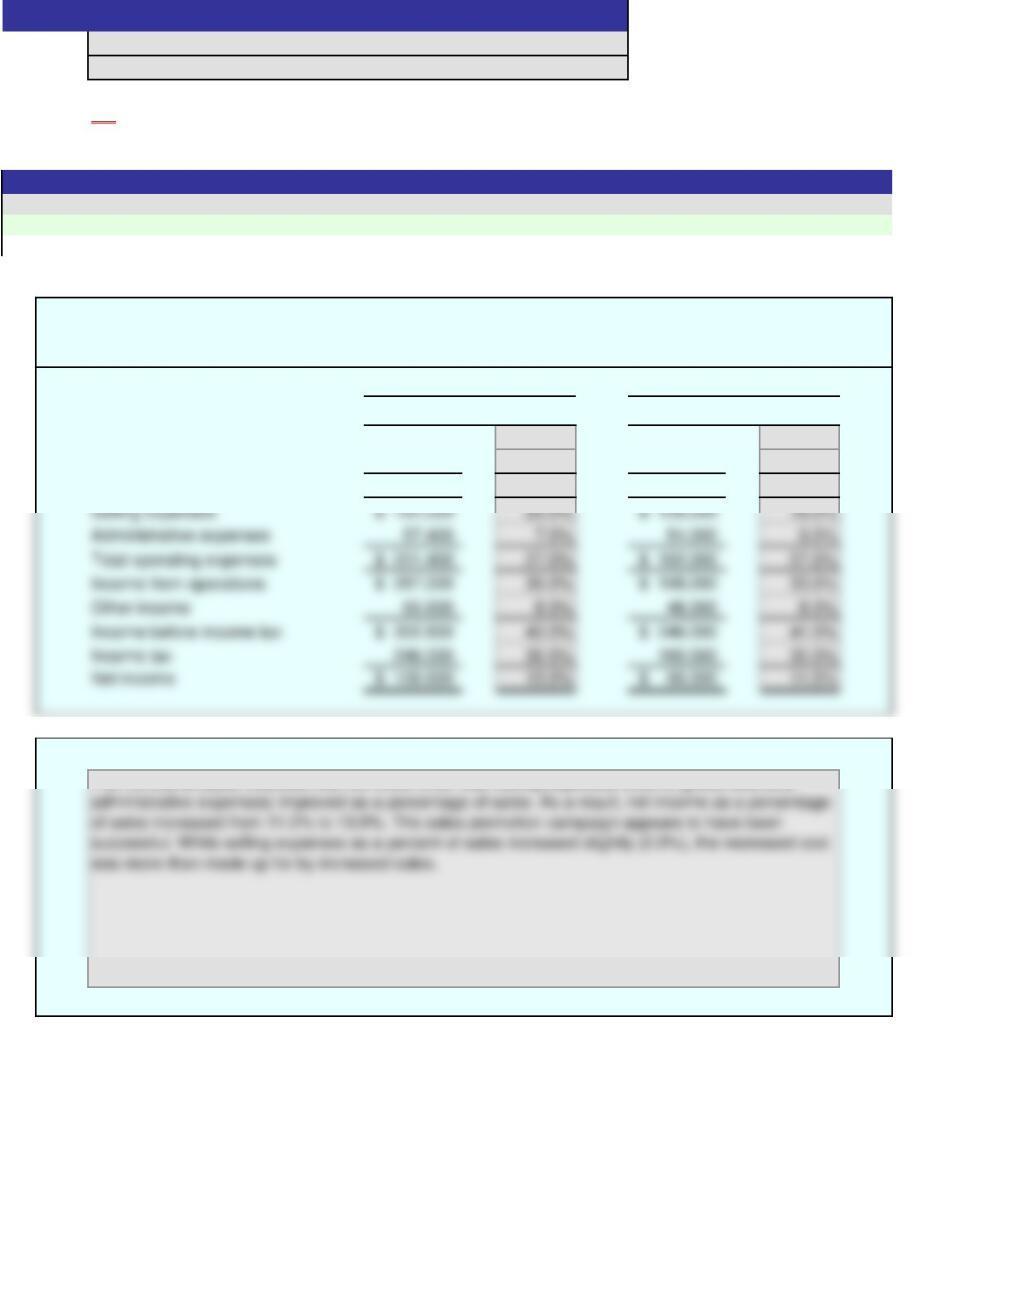
Sales 6,750,000$ 6,000,000$ 750,000$ 12.5%
Cost of goods sold 2,480,000 2,000,000 480,000 24.0%
Gross profit 4,270,000$ 4,000,000$ 270,000$ 6.8%
Selling expenses 1,260,000$ 1,000,000$ 260,000$ 26.0%
2.
Net income has declined from 2015 to 2016. Sales have increased by 12.5%; however, cost of goods sold
has increased by 24.0%, causing the gross profit to increase at a slower pace than sales. In addition, total
For the Years Ended December 31, 2016 and 2015
CLAPTON COMPANY
Comparative Income Statement
Increase (Decrease)
ON
Cells with non-gray backgrounds are protected and cannot be edited.
Score:
Instructions
Answers are entered in the cells with gray backgrounds.
Problem 15(14)-1A
Name:
Solution
Section:

An asterisk (*) will appear to the right of an incorrect entry. The essay answer will not be graded.
1.
2016 2015
Amount Amount Amount Percent
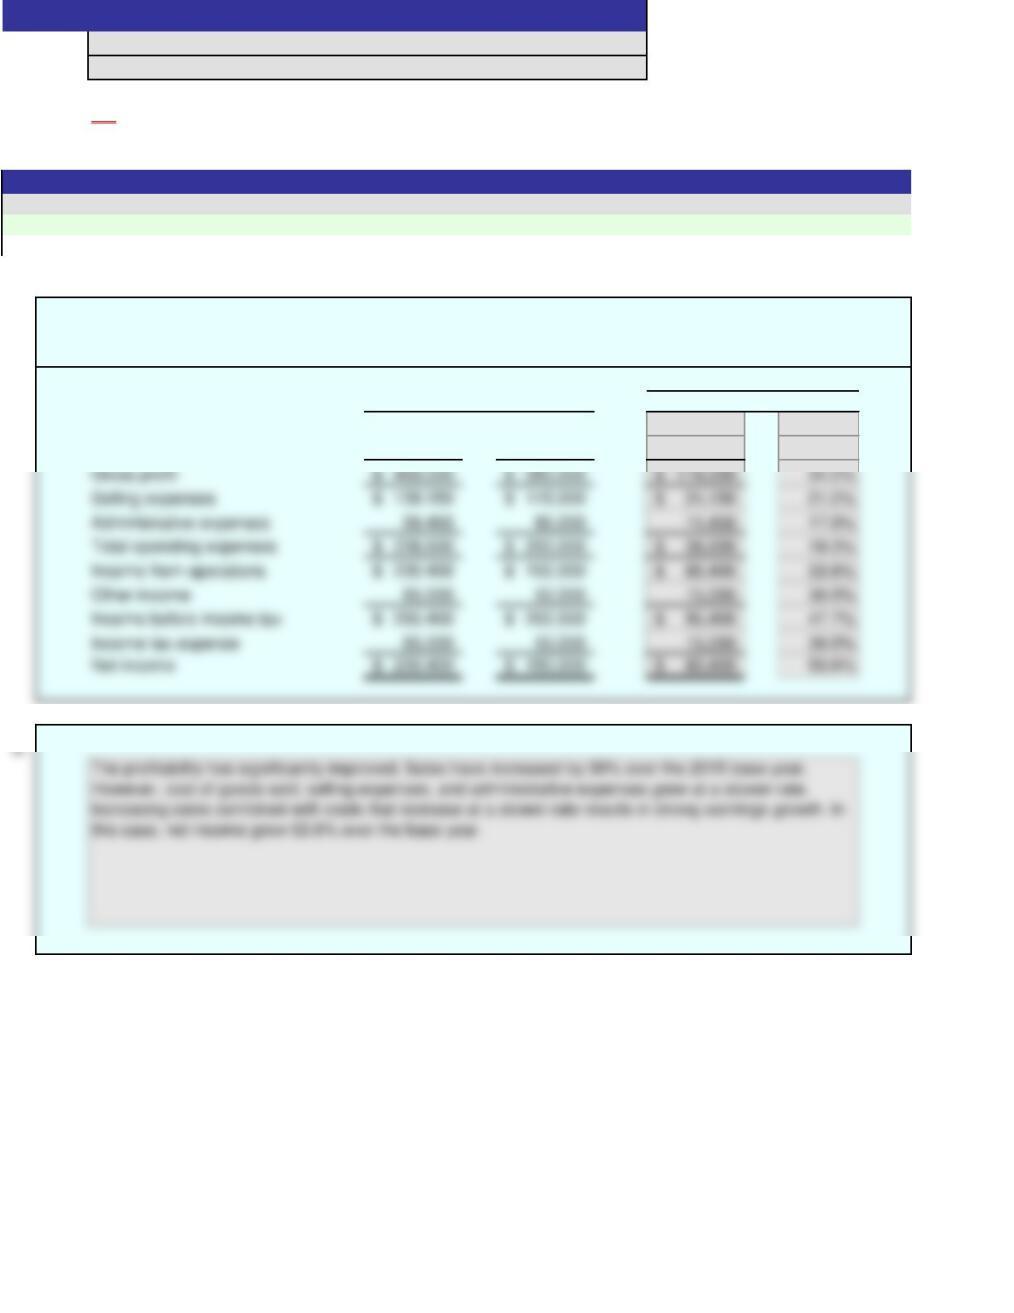
Sales 910,000$ 700,000$
Cost of goods sold 441,000 350,000
Gross profit 469,000$ 350,000$
Selling expenses 139,150$ 115,000$
Administrative expenses 99,450 85,000
Total operating expenses 238,600$ 200,000$
Income from operations 230,400$ 150,000$
E
Other income 65,000 50,000
Income before income tax 295,400$ 200,000$
Income tax expense 65,000 50,000
Net income 230,400$ 150,000$
2.
Score:
Key Code:
Instructions
Problem 15(14)-1B
Name:
Section:
0%
Increase (Decrease)
[Key essay answer here]
[Key code here]
Answers are entered in the cells with gray backgrounds.
Cells with non-gray backgrounds are protected and cannot be edited.
MACKLIN INC.
Comparative Income Statement
For the Years Ended December 31, 2016 and 2015
An asterisk (*) will appear to the right of an incorrect entry. The essay answer will not be graded.
1.
2016 2015
Amount Amount Amount Percent
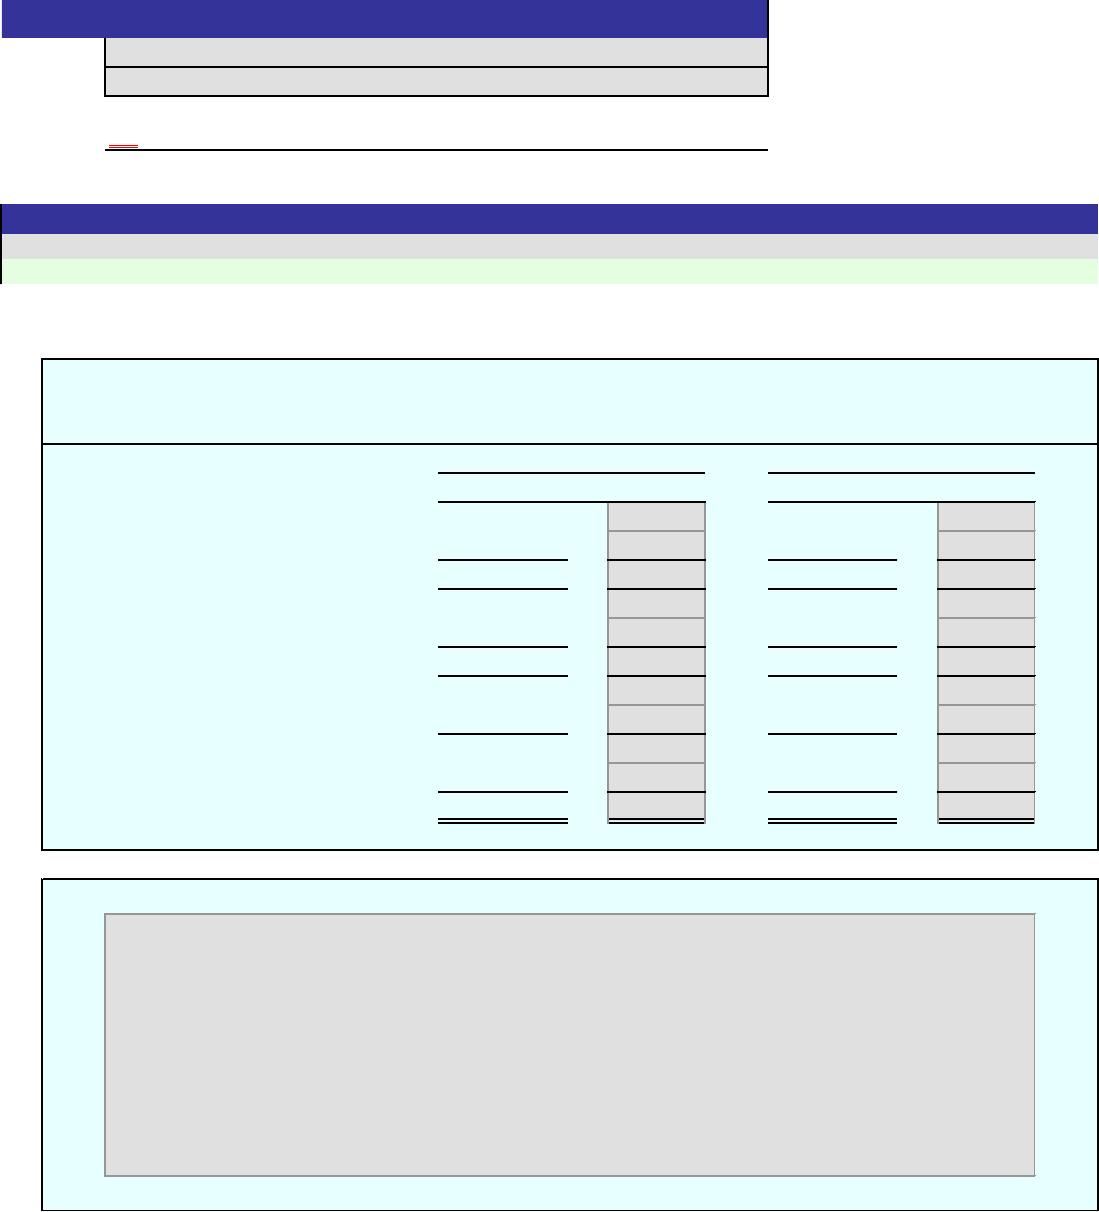
Sales 910,000$ 700,000$ 210,000$ 30.0%
Cost of goods sold 441,000 350,000 91,000 26.0%
For the Years Ended December 31, 2016 and 2015
MACKLIN INC.
Comparative Income Statement
Increase (Decrease)
Instructions
Answers are entered in the cells with gray backgrounds.
Problem 15(14)-1B
Name:
Solution
Section:
Cells with non-gray backgrounds are protected and cannot be edited.
Score:
ON
An asterisk (*) will appear to the right of an incorrect entry. The essay answer will not be graded.
1.
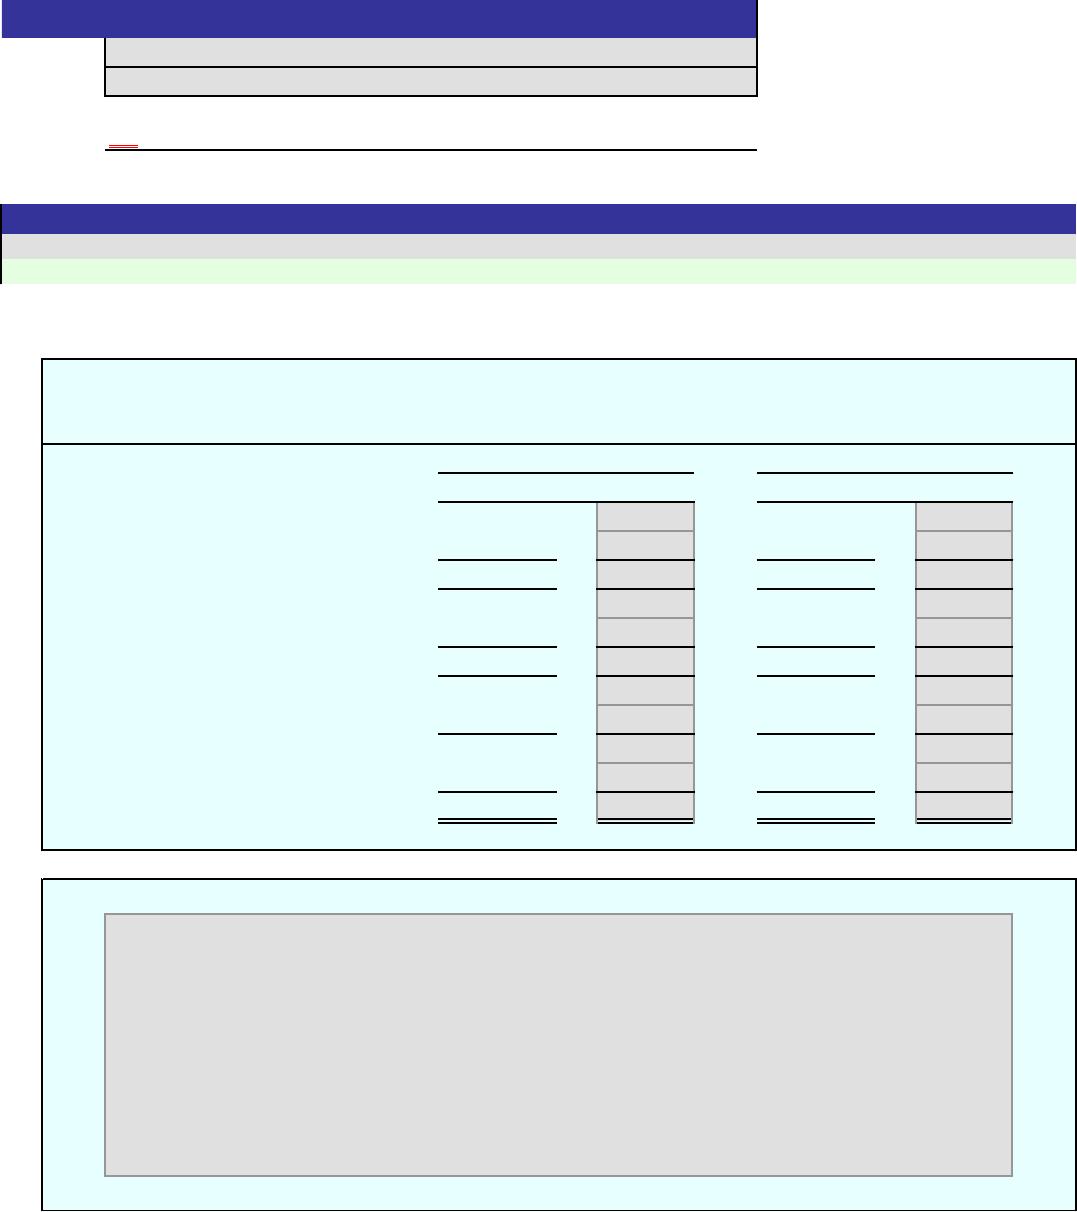
Amount Percent Amount Percent
Sales 820,000$ 600,000$
Cost of goods sold 311,600 240,000
Gross profit 508,400$ 360,000$
Selling expenses 164,000$ 108,000$
Administrative expenses 57,400 54,000
Total operating expenses 221,400$ 162,000$
Income from operations 287,000$ 198,000$
Other income 65,600 48,000
Income before income tax 352,600$ 246,000$
Income tax 246,000 180,000
Net income 106,600$ 66,000$
2.
Score:
Key Code:
Instructions
Problem 15(14)-2A
Name:
Section:
0%
2016
2015
[Key essay answer here]
[Key code here]
Answers are entered in the cells with gray backgrounds.
Cells with non-gray backgrounds are protected and cannot be edited.
INDIGO COMPANY
Comparative Income Statement
For the Years Ended December 31, 2016 and 2015
An asterisk (*) will appear to the right of an incorrect entry. The essay answer will not be graded.
1.
Amount Percent Amount Percent
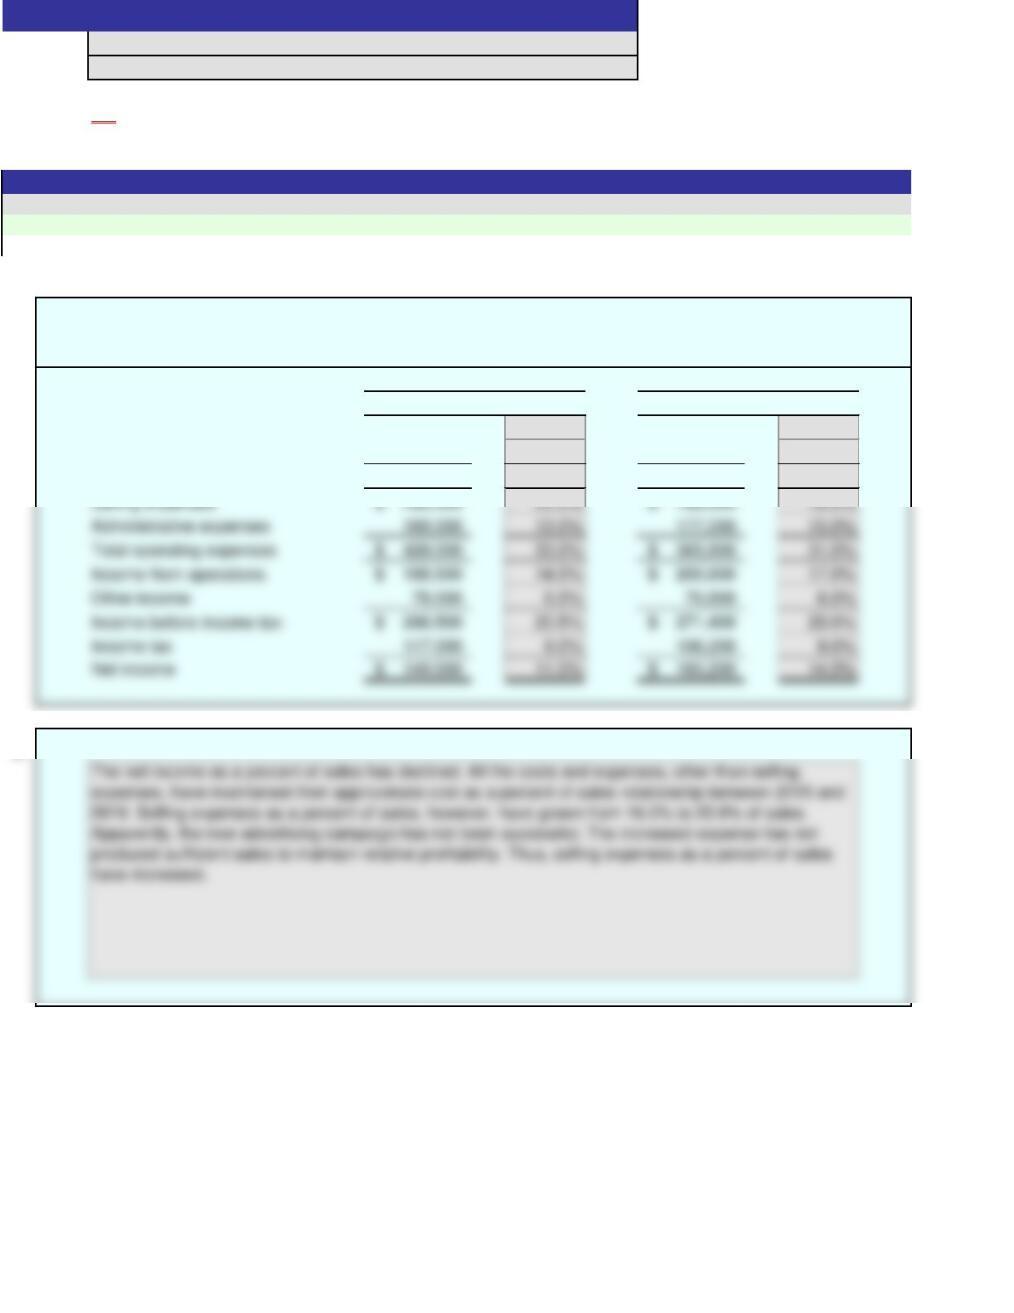
Sales 820,000$ 100.0% 600,000$ 100.0%
Cost of goods sold 311,600 38.0% 240,000 40.0%
Gross profit 508,400$ 62.0% 360,000$ 60.0%
2.
The vertical analysis indicates that the costs other than selling expenses (cost of goods sold and
For the Years Ended December 31, 2016 and 2015
INDIGO COMPANY
Comparative Income Statement
2016
2015
Cells with non-gray backgrounds are protected and cannot be edited.
Score:
Instructions
Answers are entered in the cells with gray backgrounds.
Problem 15(14)-2A
Name:
Solution
Section:
ON
An asterisk (*) will appear to the right of an incorrect entry. The essay answer will not be graded.
1.
Amount Percent Amount Percent
Sales 1,300,000$ 1,180,000$
Cost of goods sold 682,500 613,600
Gross profit 617,500$ 566,400$
Selling expenses 260,000$ 188,800$
Administrative expenses 169,000 177,000
Total operating expenses 429,000$ 365,800$
Income from operations 188,500$ 200,600$
Other income 78,000 70,800
Income before income tax 266,500$ 271,400$
Income tax 117,000 106,200
Net income 149,500$ 165,200$
2.
Score:
Key Code:
Instructions
Problem 15(14)-2B
Name:
Section:
0%
2016
2015
[Key essay answer here]
[Key code here]
Answers are entered in the cells with gray backgrounds.
Cells with non-gray backgrounds are protected and cannot be edited.
FIELDER INDUSTRIES INC.
Comparative Income Statement
For the Years Ended December 31, 2016 and 2015
An asterisk (*) will appear to the right of an incorrect entry. The essay answer will not be graded.
1.
Amount Percent Amount Percent
Sales 1,300,000$ 100.0% 1,180,000$ 100.0%
Cost of goods sold 682,500 52.5% 613,600 52.0%
Gross profit 617,500$ 47.5% 566,400$ 48.0%
2.
2015
Cells with non-gray backgrounds are protected and cannot be edited.
Score:
Instructions
Answers are entered in the cells with gray backgrounds.
ON
For the Years Ended December 31, 2016 and 2015
FIELDER INDUSTRIES INC.
Comparative Income Statement
2016
Problem 15(14)-2B
Name:
Solution
Section:

An asterisk (*) will appear to the right of an incorrect entry.
1.
a. Working Capital = Current Assets
–Current Liabilities
=
Working Capital =
b. Current Assets
Current Liabilities
Current Ratio =
Quick Assets
Current Liabilities
Quick Ratio =
2. Current Quick Current Working Current Quick
Transaction Assets Assets Liabilities Capital Ratio Ratio
a.
b.
c.
d.
e.
f.
g.
h.
i.
j.
Problem 15(14)-3A
Name:
Section:
Quick Ratio
=
Score:
Key Code:
Instructions
0%
=
[Key code here]
Answers are entered in the cells with gray backgrounds.
Cells with non-gray backgrounds are protected and cannot be edited.
Current Ratio
=
=
c.
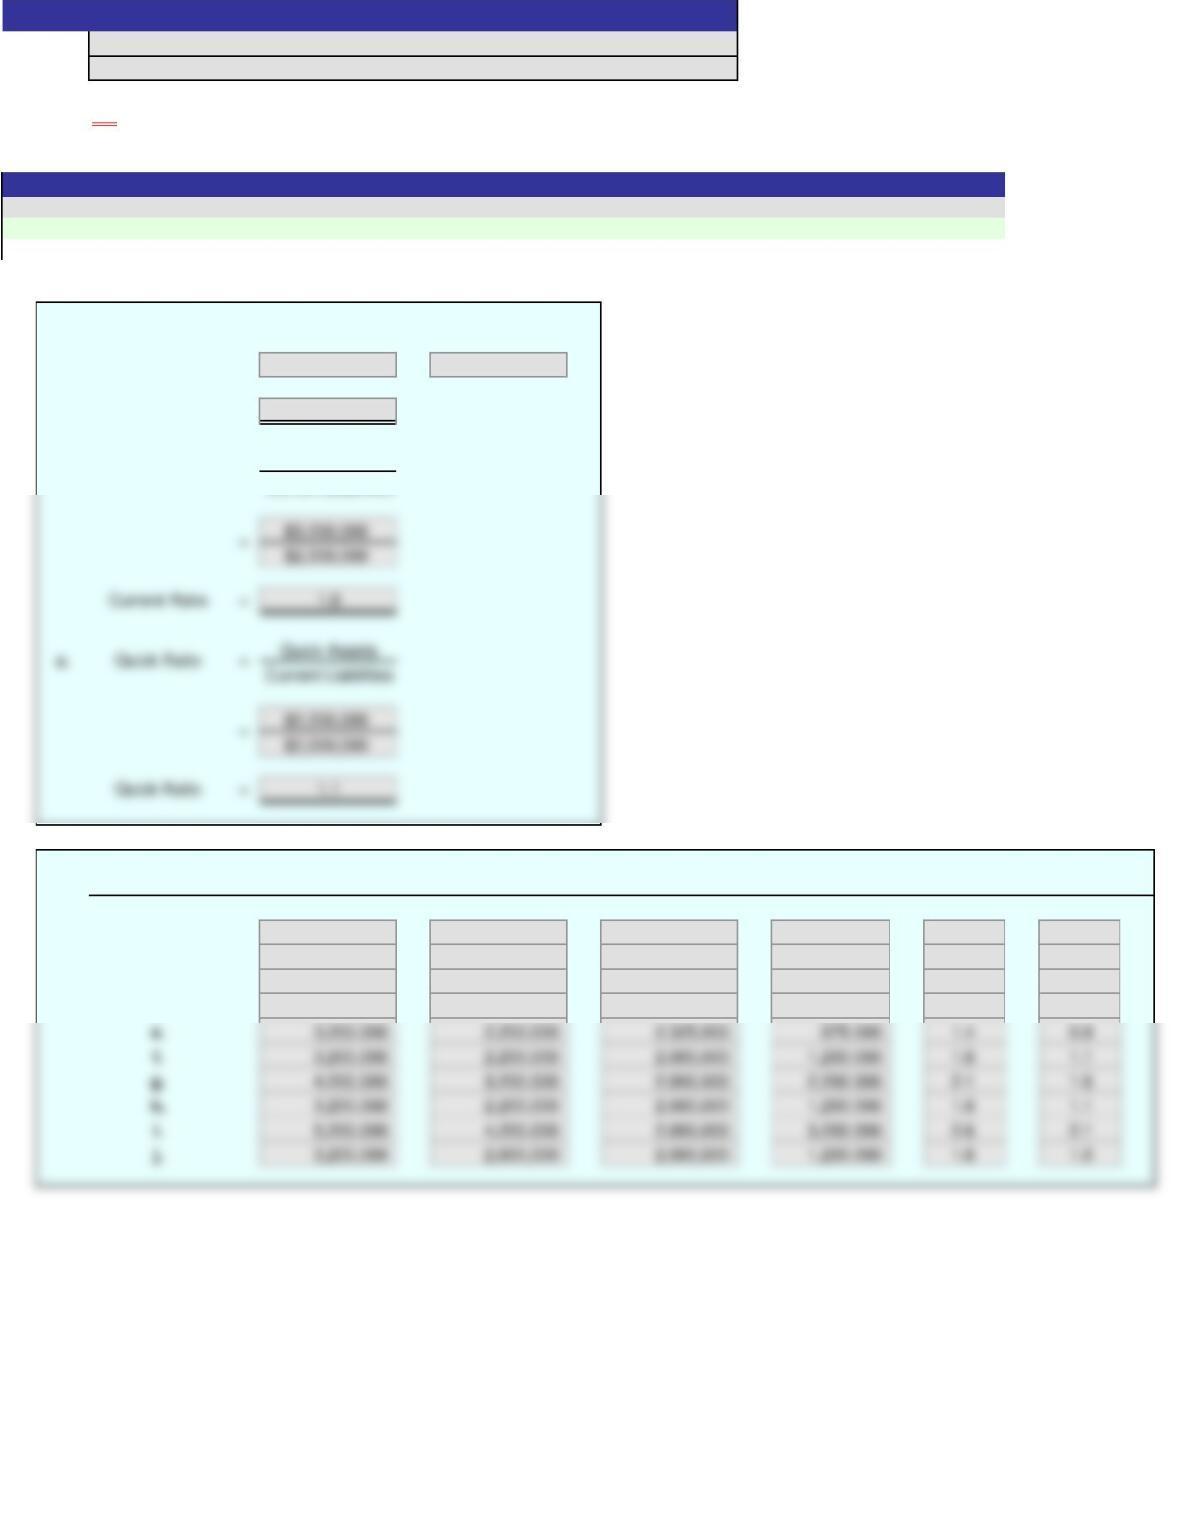
An asterisk (*) will appear to the right of an incorrect entry.
1.
a. Working Capital = Current Assets
–Current Liabilities
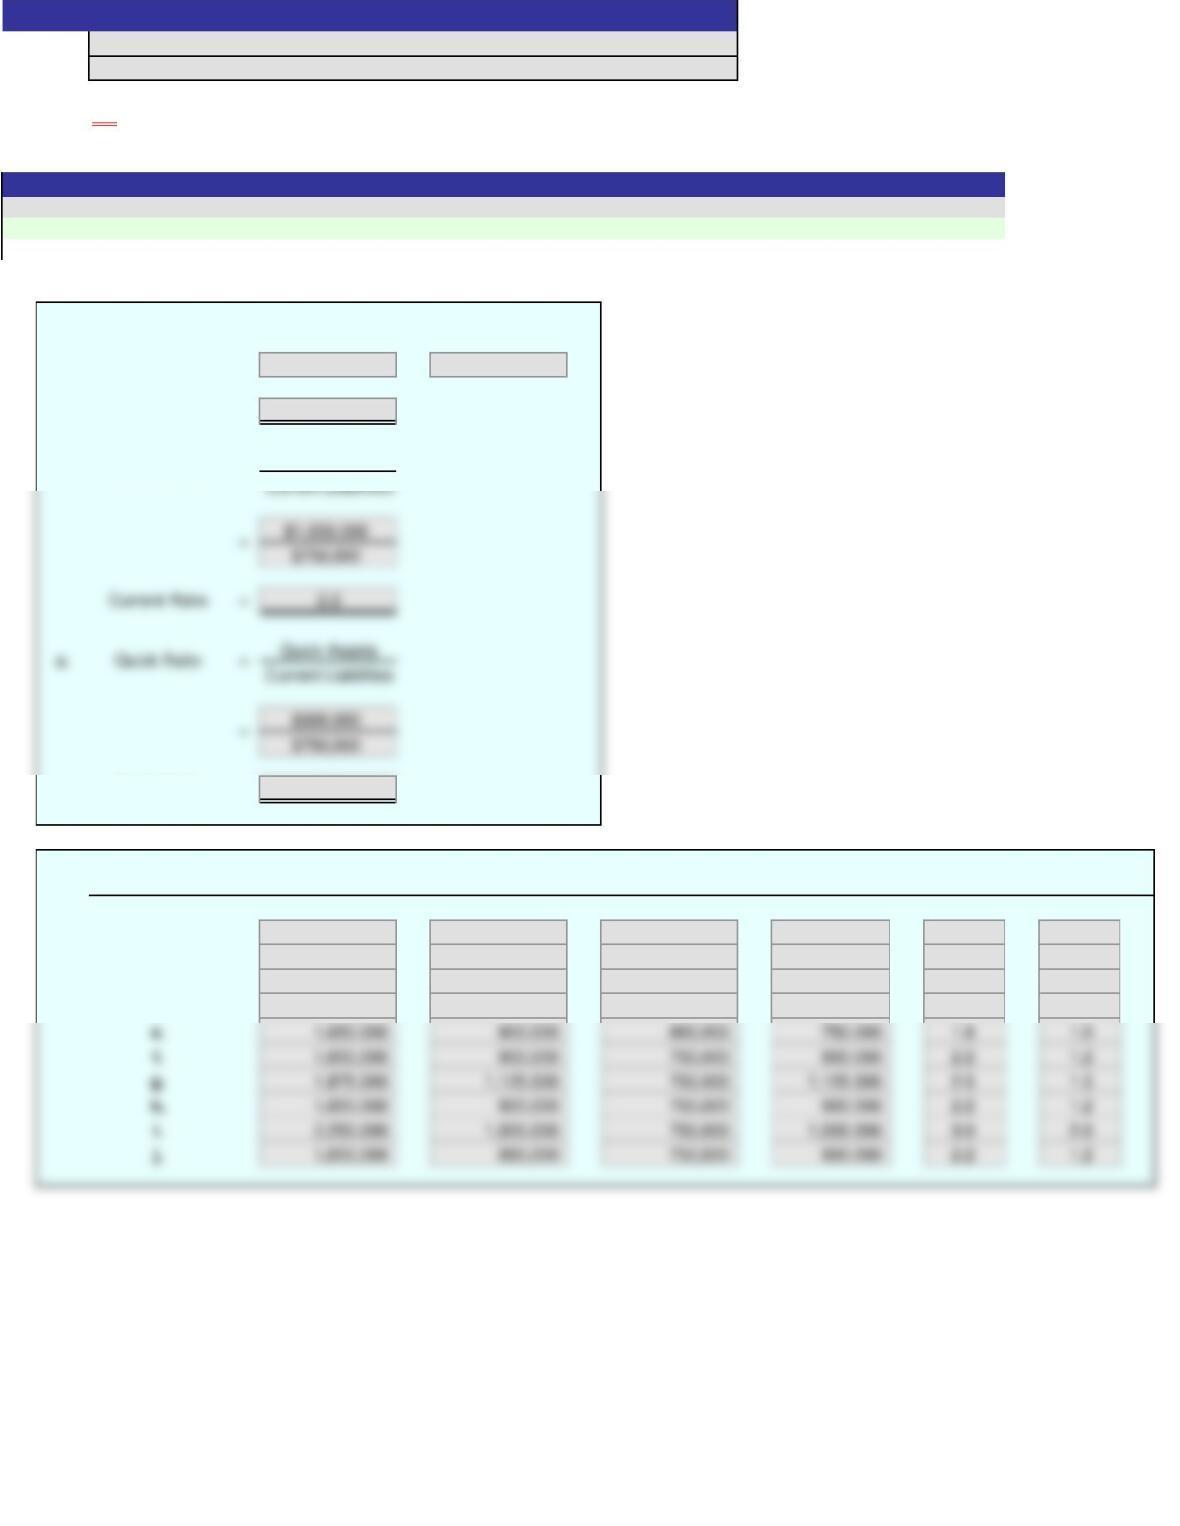
=$1,650,000 $750,000
Working Capital = $900,000
b. Current Assets
Quick Ratio =1.2
2. Current Quick Current Working Current Quick
Transaction Assets Assets Liabilities Capital Ratio Ratio
a. 1,650,000$ 900,000$ 750,000$ 900,000$ 2.2 1.2
b. 1,525,000 775,000 625,000 900,000 2.4 1.2
c. 1,760,000 900,000 860,000 900,000 2.0 1.0
d. 1,550,000 800,000 650,000 900,000 2.4 1.2
Cells with non-gray backgrounds are protected and cannot be edited.
Score:
Instructions
Answers are entered in the cells with gray backgrounds.
Current Ratio
=
Problem 15(14)-3A
Name:
Solution
Section:
ON
=
=
An asterisk (*) will appear to the right of an incorrect entry.
1.
a. Working Capital = Current Assets
–Current Liabilities
=
Working Capital =
b. Current Assets
Current Liabilities
Current Ratio =
Quick Assets
Current Liabilities
Quick Ratio =
2. Current Quick Current Working Current Quick
Transaction Assets Assets Liabilities Capital Ratio Ratio
a.
b.
c.
d.
e.
f.
g.
h.
i.
j.
Score:
Key Code:
Instructions
0%
Problem 15(14)-3B
Name:
Section:
c.
Quick Ratio
=
[Key code here]
Answers are entered in the cells with gray backgrounds.
Cells with non-gray backgrounds are protected and cannot be edited.
=
Current Ratio
=
=
An asterisk (*) will appear to the right of an incorrect entry.
1.
a. Working Capital = Current Assets
–Current Liabilities
=$3,200,000 $2,000,000
Working Capital = $1,200,000
b. Current Assets
Current Liabilities
2. Current Quick Current Working Current Quick
Transaction Assets Assets Liabilities Capital Ratio Ratio
a. 3,200,000$ 2,200,000$ 2,000,000$ 1,200,000$ 1.6 1.1
b. 2,912,500 1,912,500 1,712,500 1,200,000 1.7 1.1
c. 3,600,000 2,200,000 2,400,000 1,200,000 1.5 0.9
d. 3,075,000 2,075,000 1,875,000 1,200,000 1.6 1.1
ON
Score:
Instructions
Answers are entered in the cells with gray backgrounds.
Problem 15(14)-3B
Name:
Solution
Section:
Cells with non-gray backgrounds are protected and cannot be edited.
Current Ratio
=
=
=
An asterisk (*) will appear to the right of an incorrect entry.
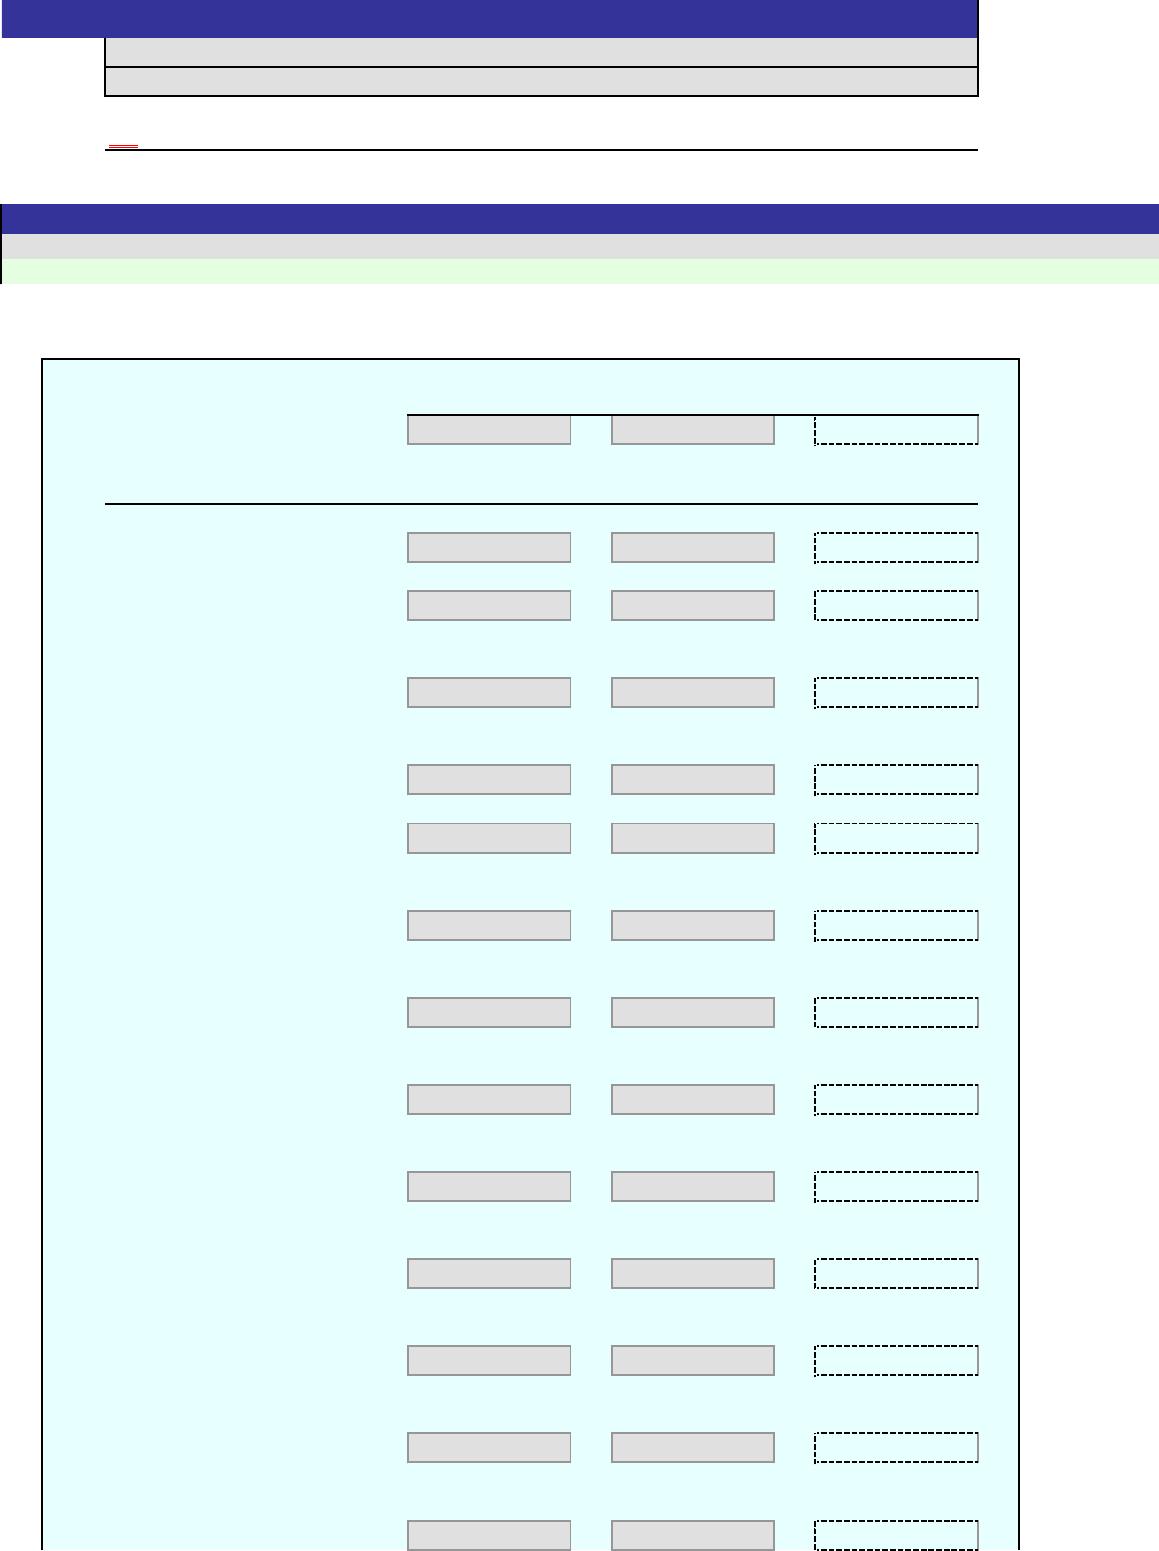
Current Assets –
Current
Liabilities
=
Calculated Value
1. Working capital:
Ratio Numerator ÷ Denominator =
Calculated Value
2. Current ratio
3. Quick ratio
4. Accounts receivable
turnover
5. Number of days’
sales in receivables
6. Inventory turnover
7. Number of days’
sales in inventory
8. Ratio of fixed assets to
long-term liabilities
9. Ratio of liabilities to
stockholders’ equity
10. Number of times
interest charges earned
11. Number of times
preferred dividends earned
12. Ratio of sales to
assets
13. Rate earned on total
assets
14. Rate earned on stock-
holders’ equity
[Key code here]
Answers are entered in the cells with gray backgrounds.
Cells with non-gray backgrounds are protected and cannot be edited.
Score:
Key Code:
Instructions
0%
Problem 15(14)-4A
Name:
Section: