CHAPTER 15 Financial Statement Analysis
Prob. 15–1B
1.
2014 2013 Amount Percent
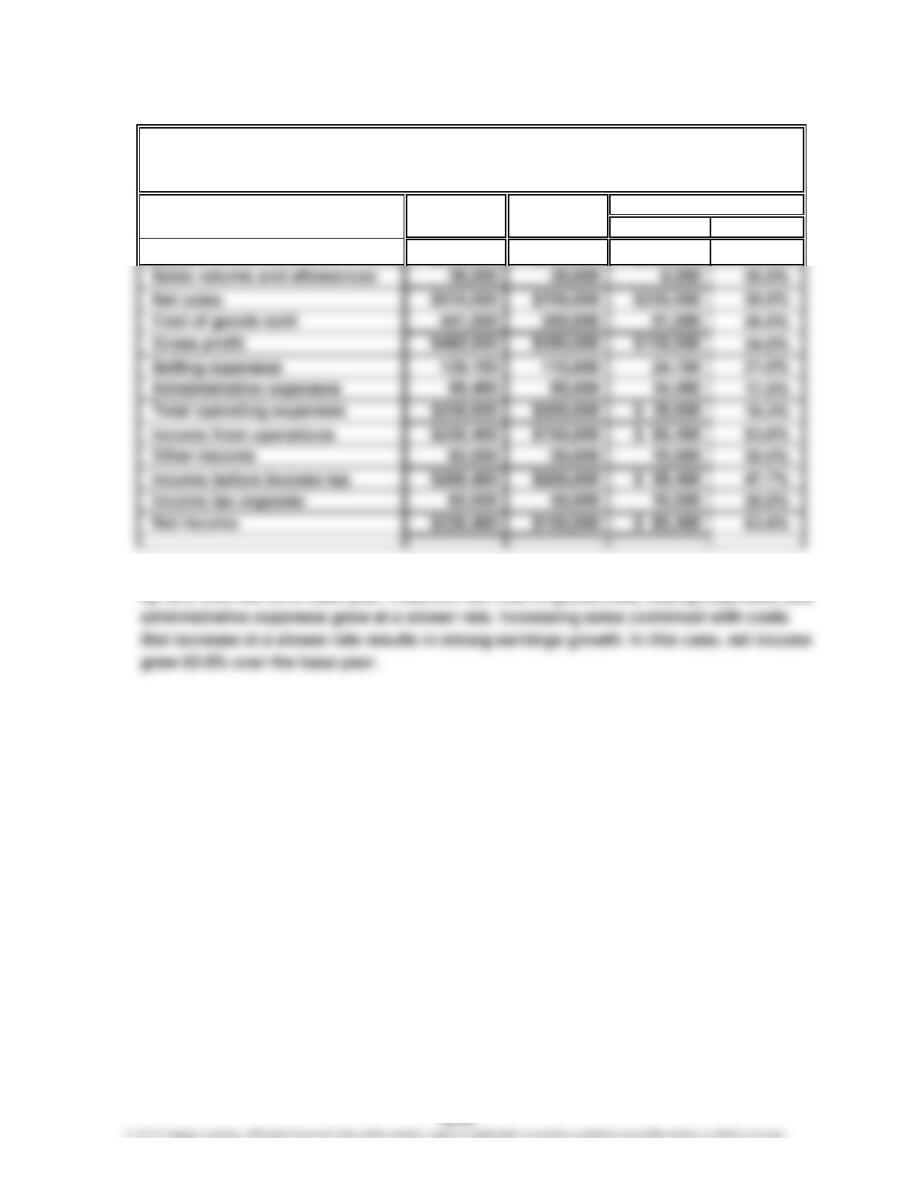
Sales $936,000 $720,000 $216,000 30.0%
2. The profitability has significantly improved from 2013 to 2014. Net sales have increased
Increase (Decrease)
MACKLIN INC.
Comparative Income Statement
For the Years Ended December 31, 2014 and 2013
CHAPTER 15 Financial Statement Analysis
Prob. 15–2B
1.
Amount Percent Amount Percent
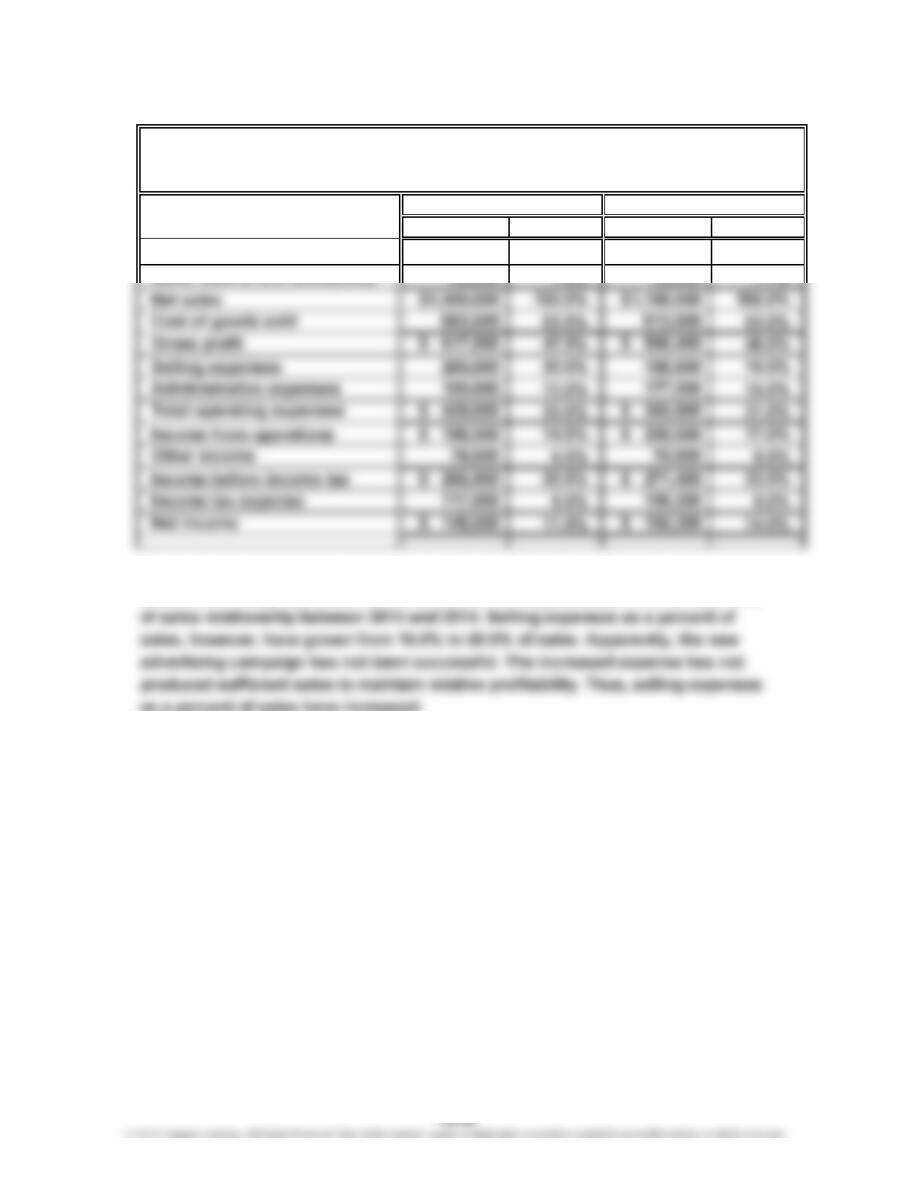
Sales $1,325,000 101.9% $1,200,000 101.7%
Sales returns and allowances 25,000 1.9% 20,000 1.7%
2. The net income as a percent of sales has declined. All the costs and expenses,
other than selling expenses, have maintained their approximate cost as a percent
2014 2013
FIELDER INDUSTRIES INC.
Comparative Income Statement
For the Years Ended December 31, 2014 and 2013

CHAPTER 15 Financial Statement Analysis
Prob. 15–3B
1. a. Working Capital = Current Assets – Current Liabilities
2.
Working Quick Current
Capital Assets Liabilities
$1,200,000 $2,200,000 $2,000,000
AssetsTransaction
Current
Ratio
Quick
Ratio
Current
a. 1.6 1.1 $3,200,000
Supporting Data
CHAPTER 15 Financial Statement Analysis
Prob. 15–4B
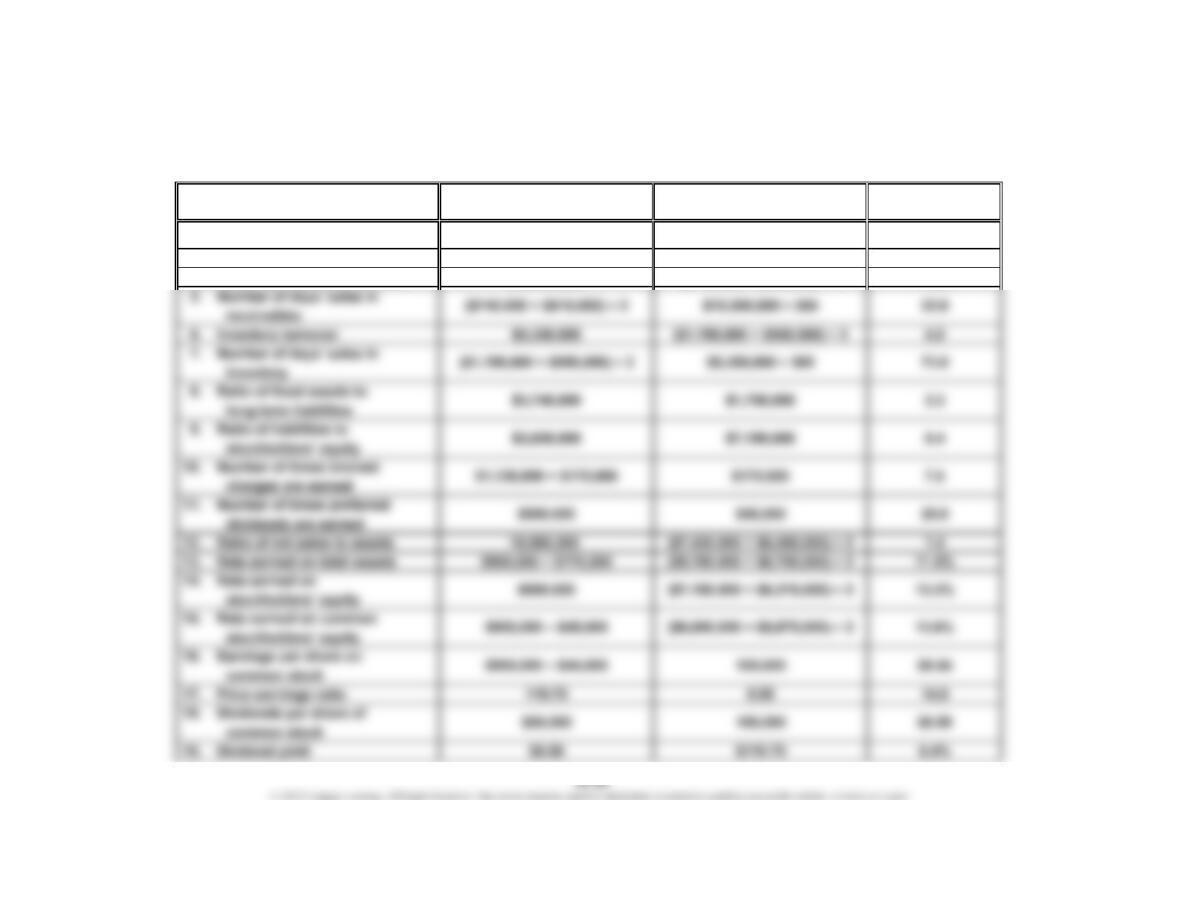
1. Working Capital: $3,690,000 – $900,000 = $2,790,000
Calculated
Numerator Denominator Value
2. Current ratio $3,690,000 $900,000 4.1
3. Quick ratio $2,250,000 $900,000 2.5
4. Accounts receivable turnover $10,000,000 ($740,000 + $510,000) ÷ 2 16.0
Ratio
CHAPTER 15 Financial Statement Analysis
Prob. 15–5B
1. a.
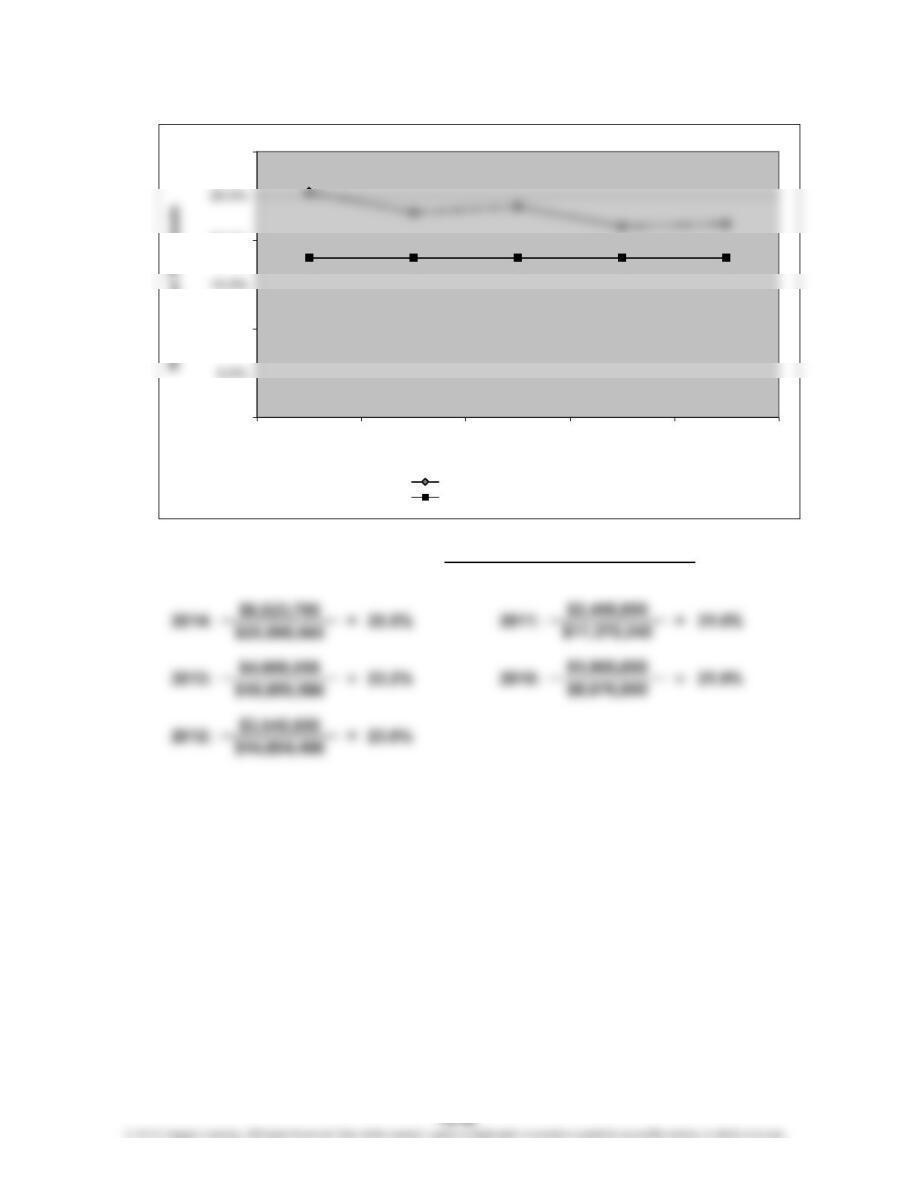
Net Income + Interest Expense
Average Total Assets
Rate Earned on Total Assets =
0.0%
10.0%
20.0%
30.0%
2014 2013 2012 2011 2010
Year
Company’s rate earned on total assets
Industry rate earned on total assets
CHAPTER 15 Financial Statement Analysis
Prob. 15–5B (Continued)
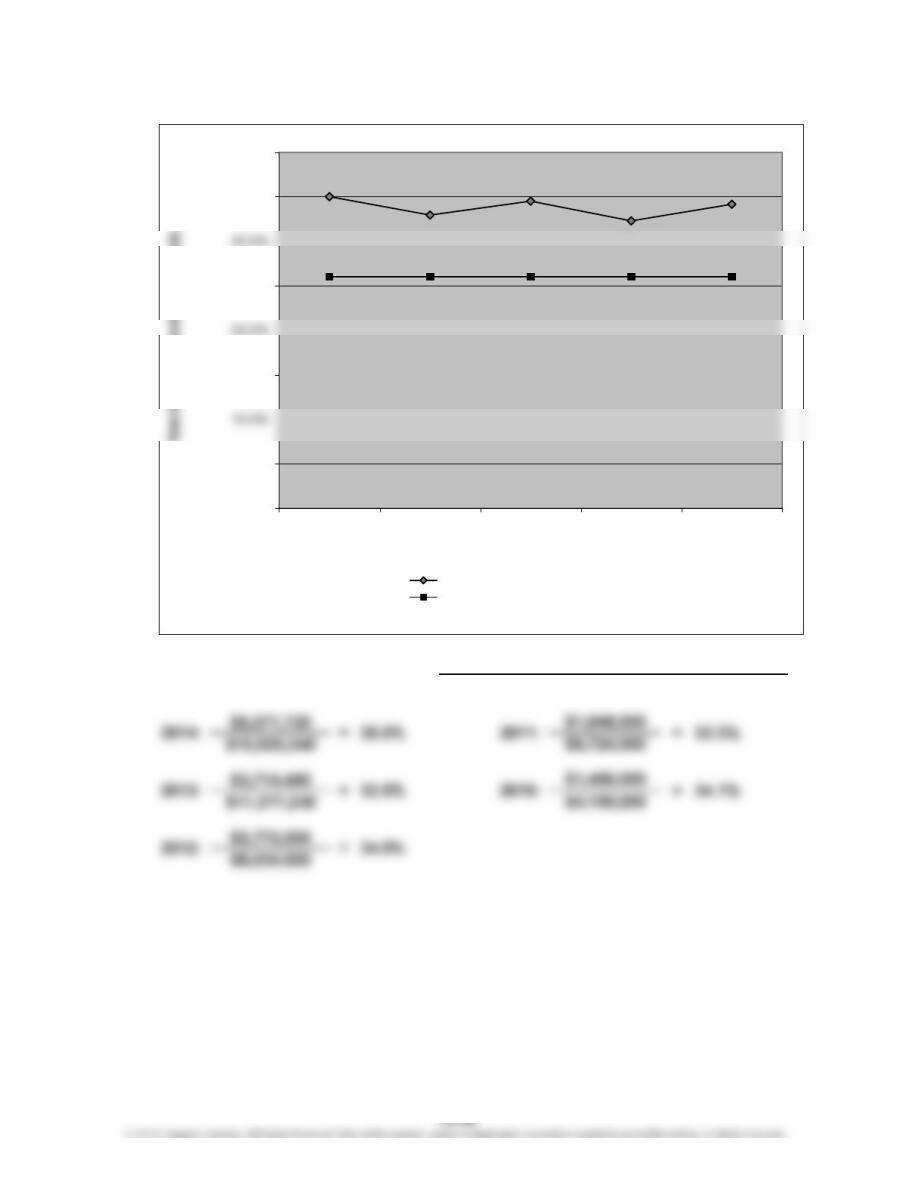
1. b.
Rate Earned on
Stockholders’ Equity
=
Average Total Stockholders’ Equity
Net Income
0.0%
5.0%
15.0%
25.0%
35.0%
40.0%
2014 2013 2012 2011 2010
Year
Company’s rate earned on stockholders’ equity
Industry rate earned on stockholders’ equity
CHAPTER 15 Financial Statement Analysis
Prob. 15–5B (Continued)
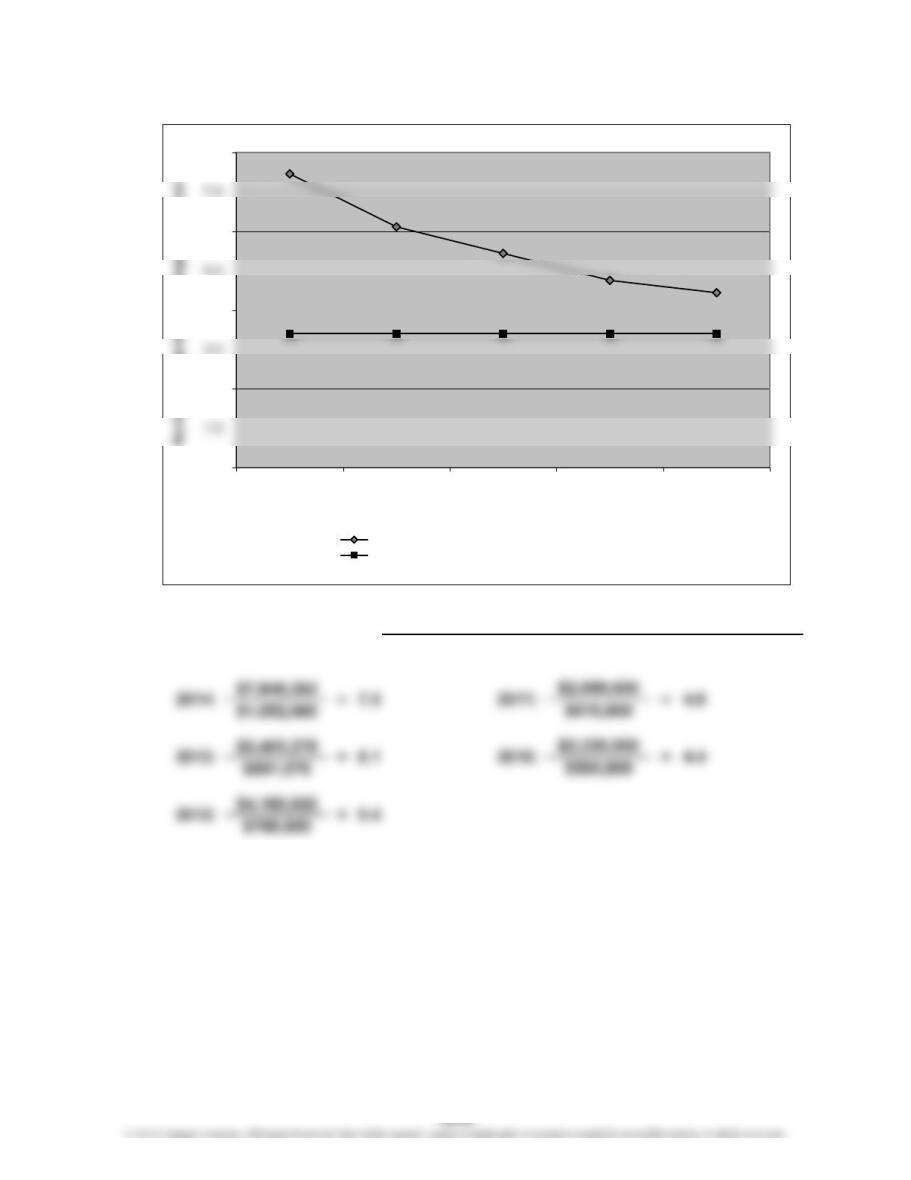
1. c.
Number of Times
Interest Charges Are Earned
Net Income + Income Tax Expense + Interest Expense
Interest Expense
=
0.0
2.0
4.0
6.0
8.0
2014 2013 2012 2011 2010
Year
Company’s number of times interest charges are earned
Industry number of times interest charges are earned
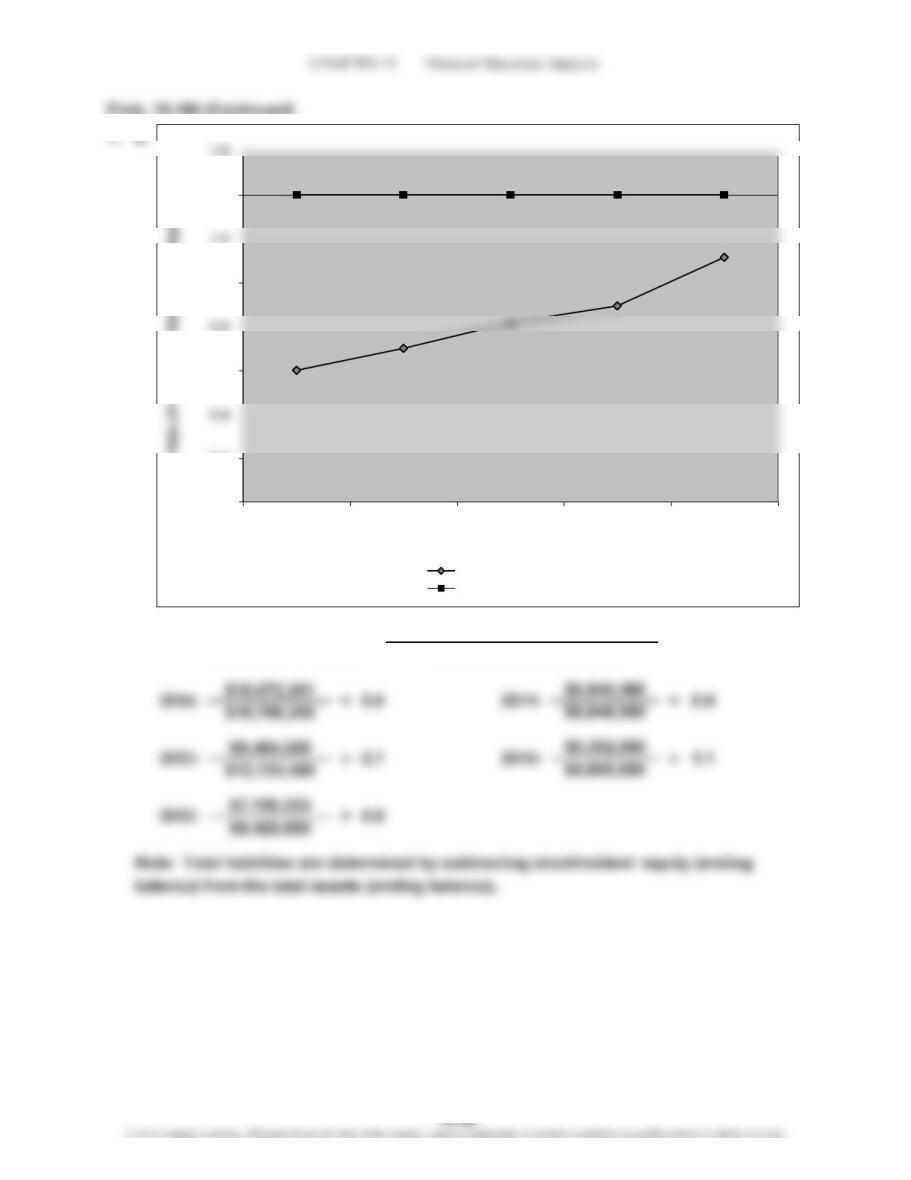
Ratio of Liabilities to
Stockholders’ Equity =
Total Liabilities
Total Stockholders’ Equity
0.0
0.2
0.6
1.0
1.4
2014 2013 2012 2011 2010
Year
Company’s liabilities to equity
Industry liabilities to equity
CHAPTER 15 Financial Statement Analysis
Prob. 15–5B (Concluded)
2. Both the rate earned on total assets and the rate earned on stockholders’ equity
are above the industry average for all five years. The rate earned on total assets is
actually improving gradually. The rate earned on stockholders’ equity exceeds the
CHAPTER 15 Financial Statement Analysis
Fiscal Fiscal
2010 2009
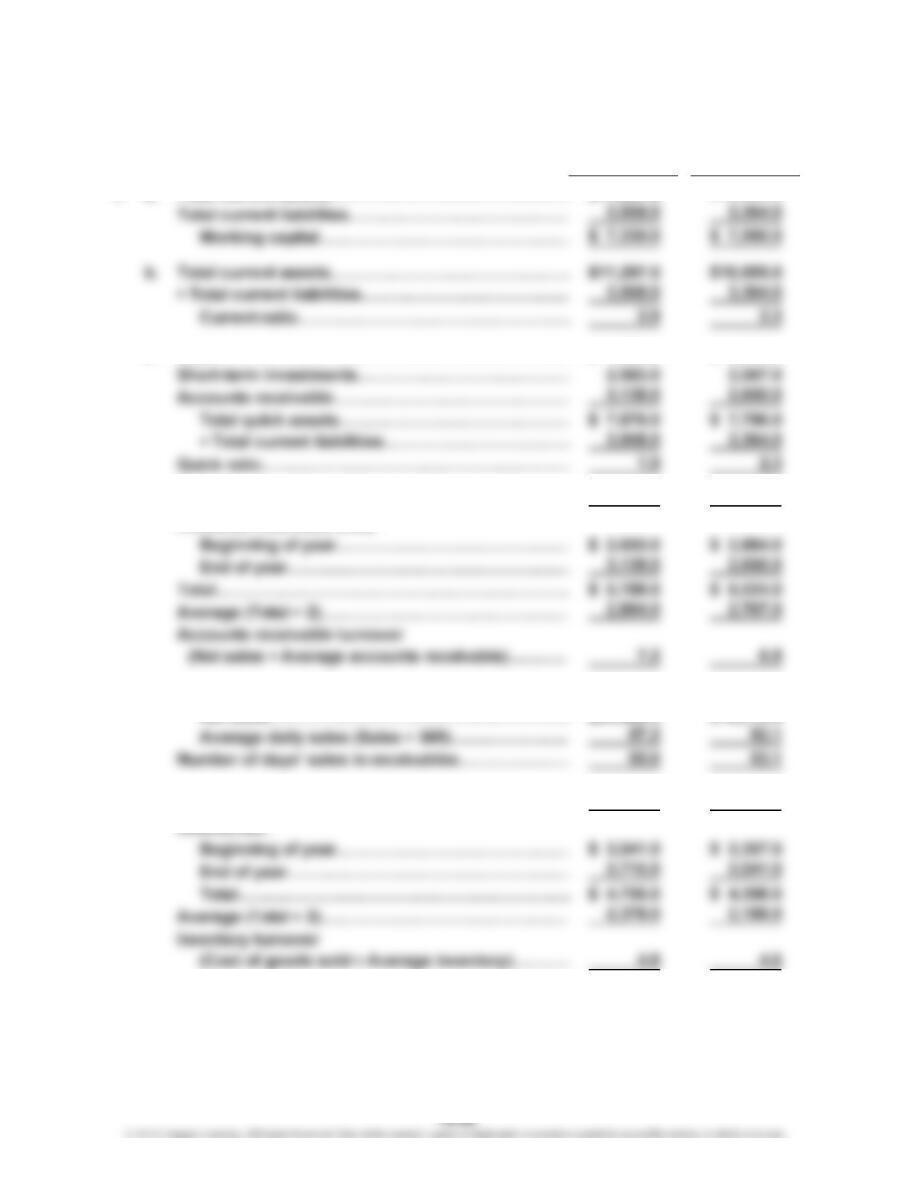
1. a. Total current assets……………………………………
…
$11,297.0 $10,959.0
c. Cash………………………………………………………… $ 1,955.0 $ 3,079.0
d. Net sales…………………………………………………… $20,862.0 $19,014.0
Accounts receivable (net):
e. Accounts receivable (average):
Net sales………………………………………………
…
$20,862.0 $19,014.0
…
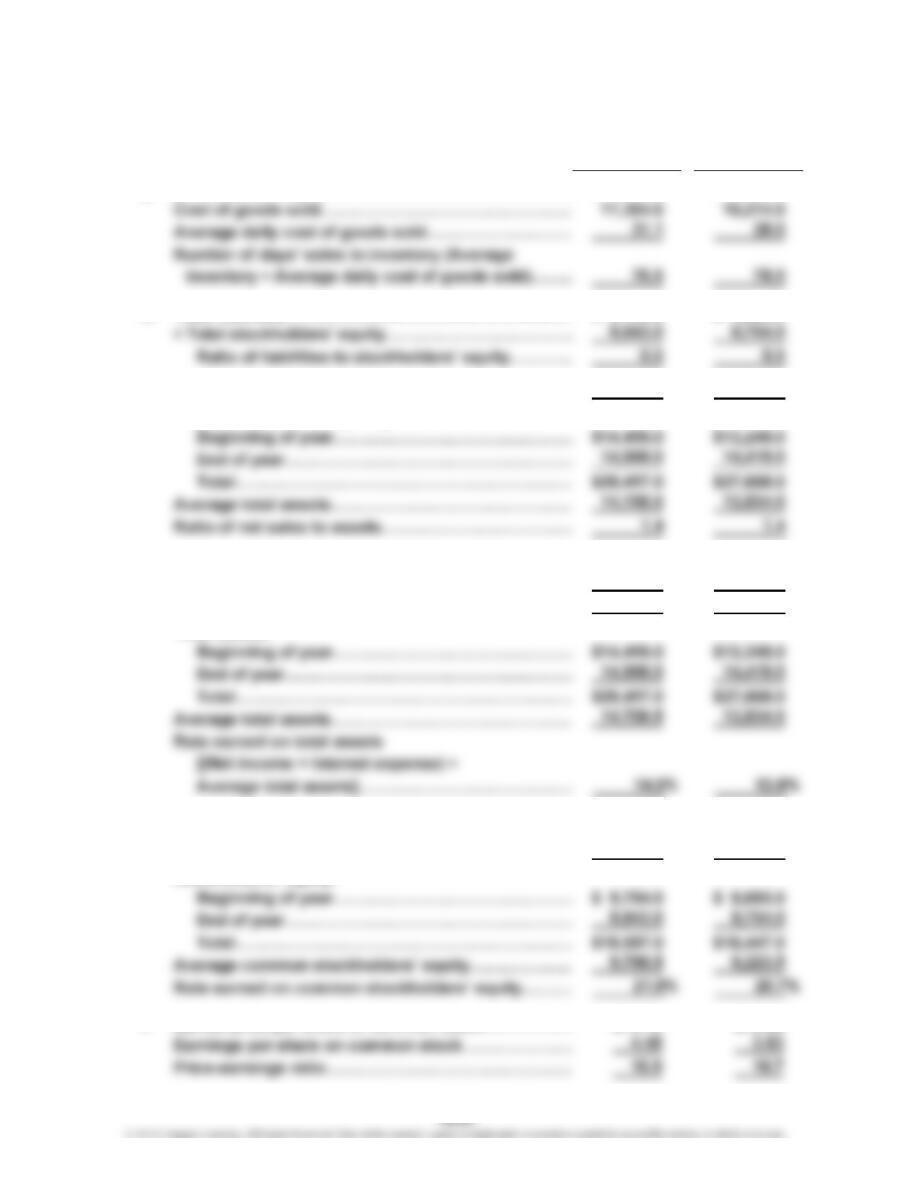
f. Cost of goods sold………………………………………
…
$11,354.0 $10,214.0
…
…
…
NIKE, INC., PROBLEM
…
CHAPTER 15 Financial Statement Analysis
Fiscal Fiscal
2010 2009
g. Inventory (average)………………………………………
…
$ 2,378.0 $ 2,199.0
h. Total liabilities……………………………………………
…
$ 5,155.0 $ 4,665.0
i. Net sales……………………………………………………
…
$20,862.0 $19,014.0
Total assets (excluding long-term investments):
…
j. Net income…………………………………………………
…
$ 2,133.0 $ 1,907.0
Plus interest expense*…………………………………… 4.0 6.0
Total……………………………………………………… $ 2,137.0 $ 1,913.0
Total assets:
*See Nike note 6
k. Net income…………………………………………………
…
$ 2,133.0 $ 1,907.0
Stockholders’ equity:
…
l. Market price per share of common stock……………
…
$75.70 $73.50
NIKE, INC., PROBLEM (Continued)
CHAPTER 15 Financial Statement Analysis
Fiscal Fiscal
2010 2009
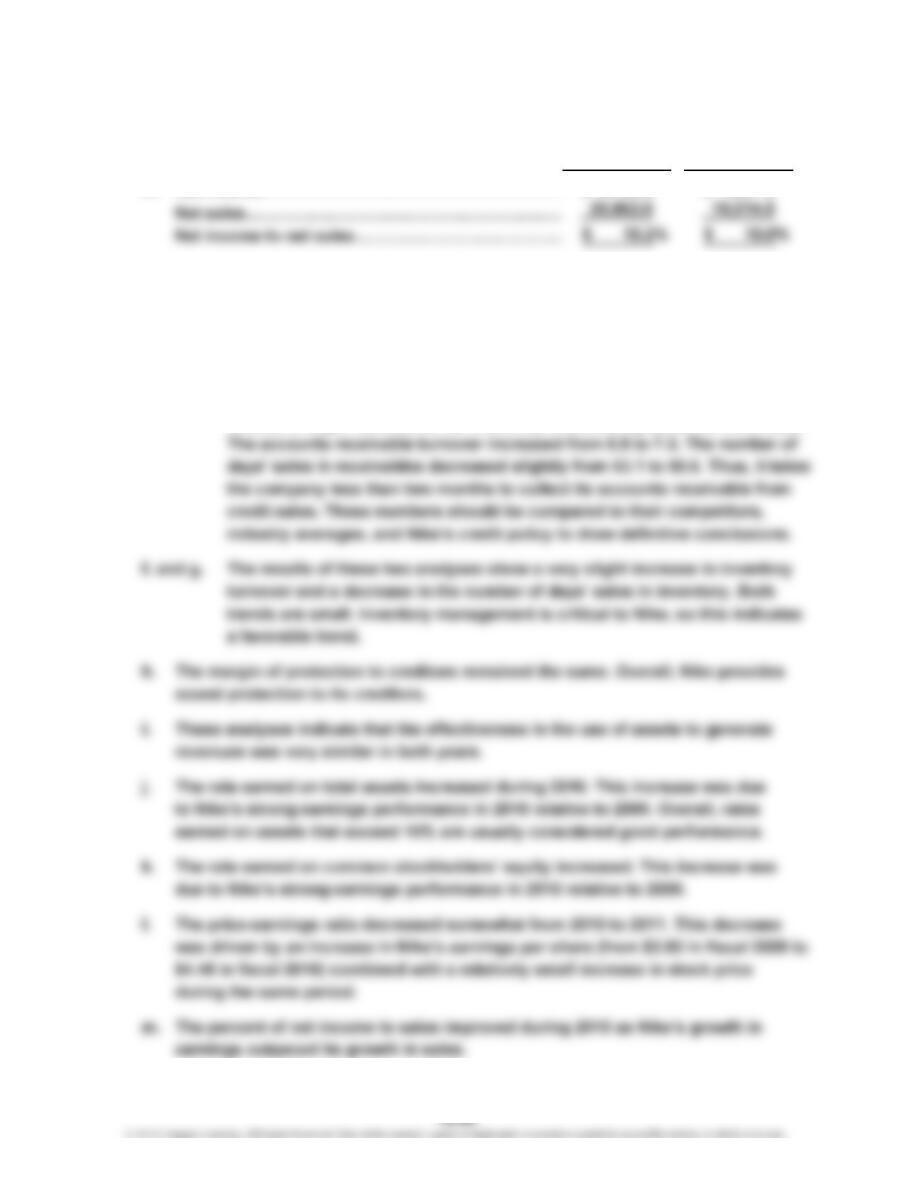
m. Net income………………………………………………
…
$ 2,133.0 $ 1,907.0
2. Before reaching definitive conclusions, each measure should be compared with
past years, industry averages, and similar firms in the industry.
a. The working capital decreased somewhat.
b. and c. The current and quick ratios decreased during 2010.
d. and e. The accounts receivable turnover and the number of days’ sales in receivab
l
indicate a slight increase in the efficiency of collecting accounts receivable.
NIKE, INC., PROBLEM (Concluded)
…
CHAPTER 15 Financial Statement Analysis
CP 15–1
This position does not allow the shareholders to take advantage of leverage. As a
result, the return on shareholders’ equity cannot be improved by using debt. In
CP 15–2
Josh is concerned about the inventory and accounts receivable levels because he must
determine their value. Inventory that cannot be sold (or sold at a large discount) or
accounts receivable that cannot be collected must be written down to reflect their
CASES & PROJECTS
CHAPTER 15 Financial Statement Analysis
CP 15–3
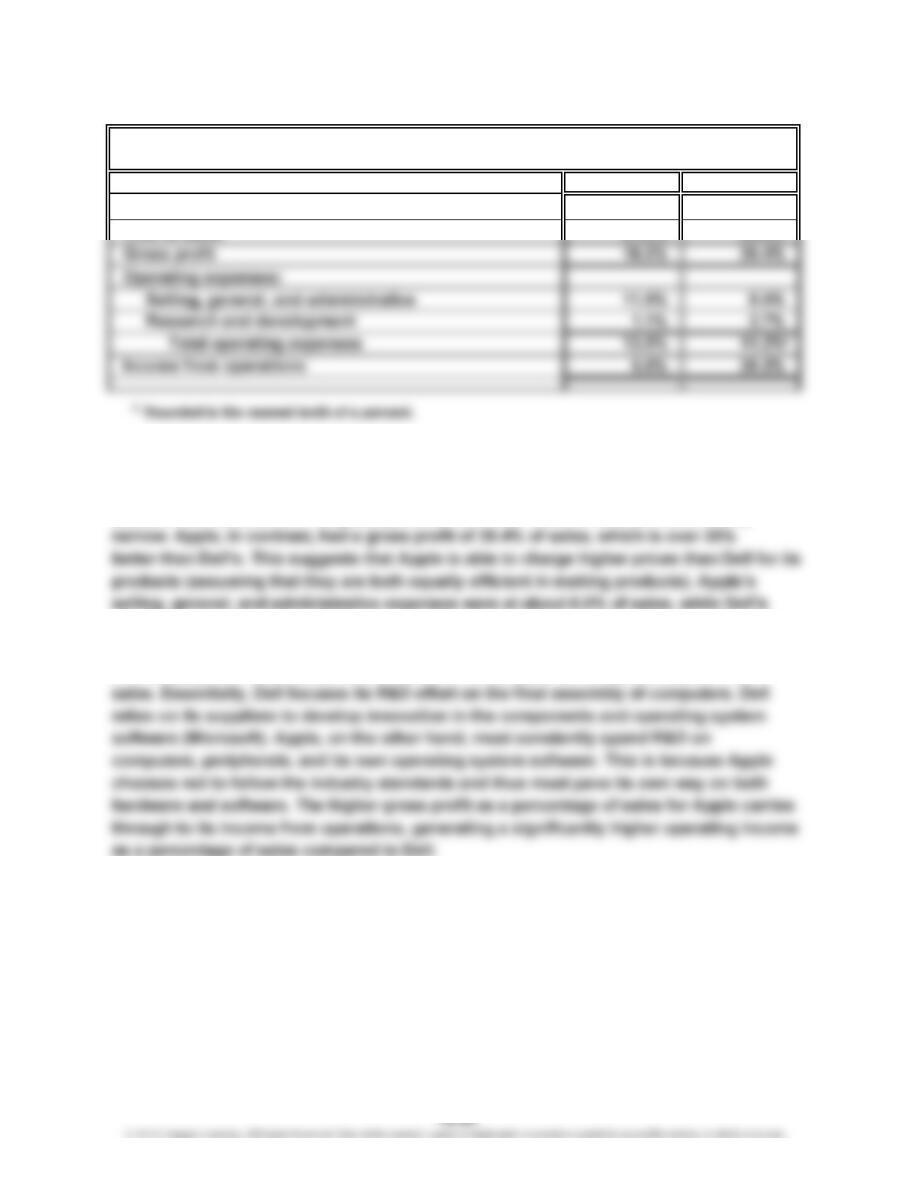
Dell Inc. Apple Inc.
Sales (net) 100.0% 100.0%
Cost of sales 81.5% 60.6%
The common-sized analysis indicates that Dell and Apple are very different computer
companies. Dell’s income from operations was 5.6% of sales, while Apple’s was 28.2% of
sales. There is almost a 23 percentage point difference between the two companies. What
explains this difference? The gross profit for Dell was 18.5% of sales, which is fairly
are 11.9% of sales. Apple has larger research expenses as a percent of sales. It attempts
to sell a unique array of products to a wide audience. This requires significant research
and development. Dell’s R&D was a narrow 1.1% of sales, while Apple’s was 2.7% of
DELL INC. AND APPLE INC.
Common-Sized Statements
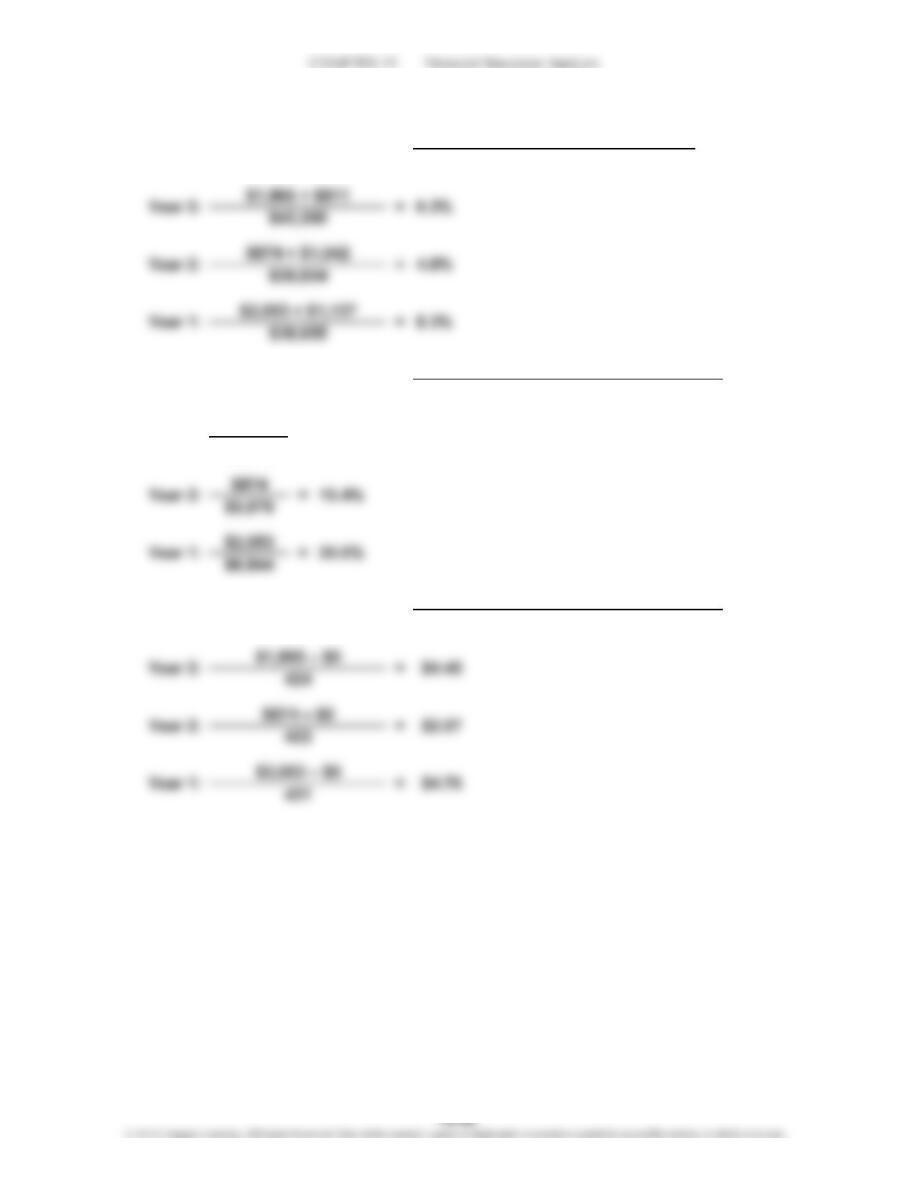
CP 15–4
$1,865
$5,555
Shares of Common Stock Outstanding
33.6%
=
b.
c. Earnings per Share
Year 3: =
Rate Earned on Total
Stockholders’ Equity
Net Income – Preferred Dividends
a.
Rate Earned on Total Assets = Net Income + Interest Expense
Average Total Assets
=Net Income
Average Total Stockholders’ Equity
CHAPTER 15 Financial Statement Analysis
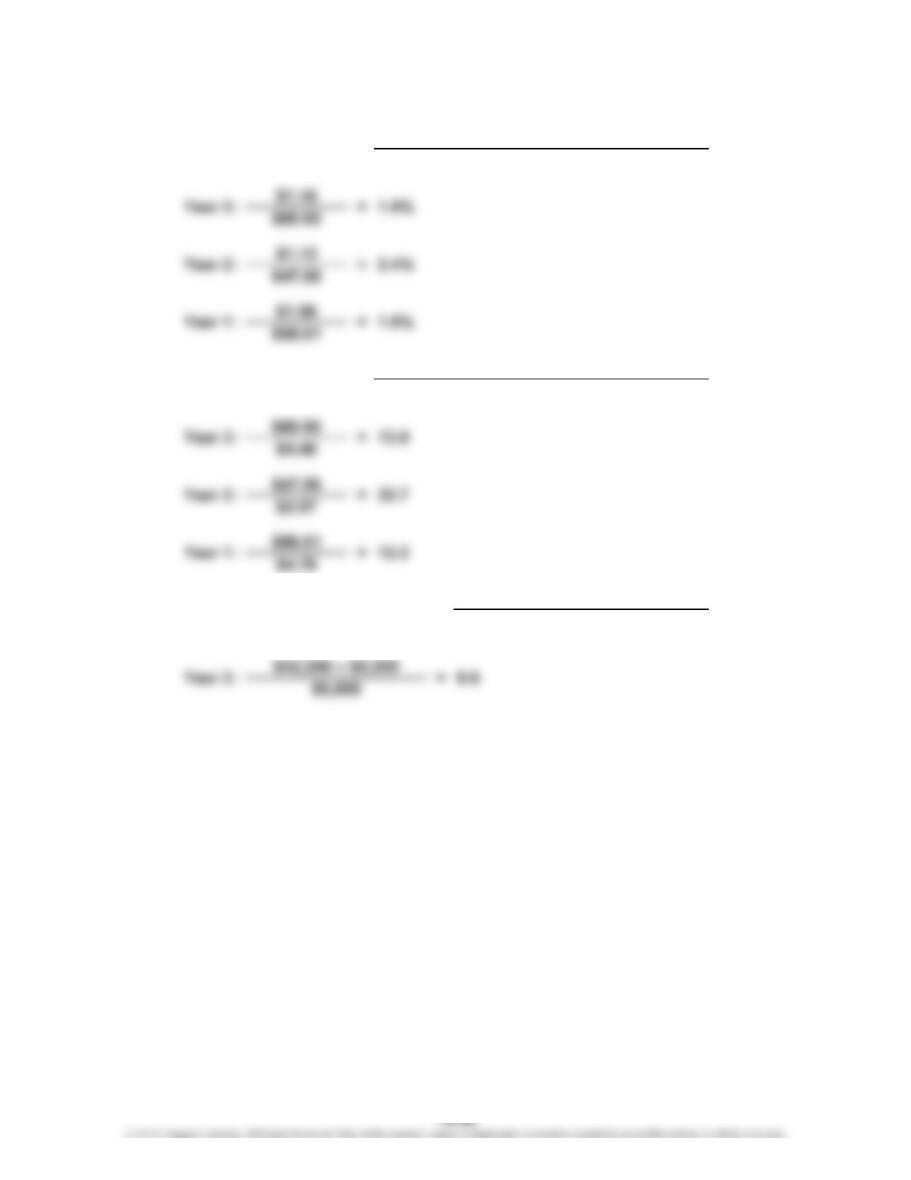
CP 15–4 (Continued)
2.
d. =
Dividend Yield Dividend per Share of Common Stock
Market Price per Share of Common Stock
e.
Price-Earnings Ratio
=
Earnings per Share
Market Price per Share of Common Stock
Average Liabilities
Average Stockholders’ Equity
Ratio of Average Liabilities to Average
Stockholders’ Equity =
CHAPTER 15 Financial Statement Analysis
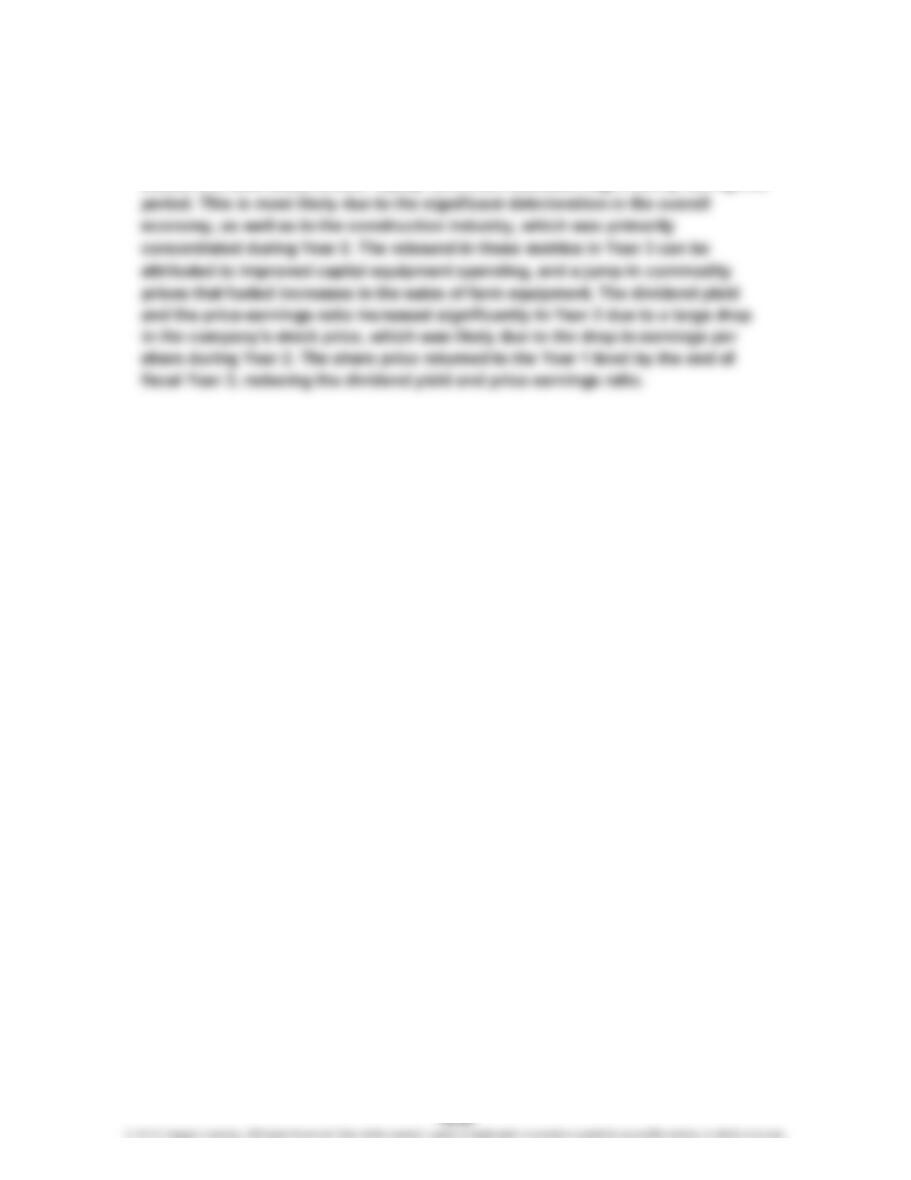
CP 15–4 (Concluded)
3. Deere & Co.’s profitability, as measured by earnings per share, has fluctuated
significantly during the three-year period presented. The rates earned on total
assets and total stockholders’ equity have also fluctuated significantly during this
CHAPTER 15 Financial Statement Analysis
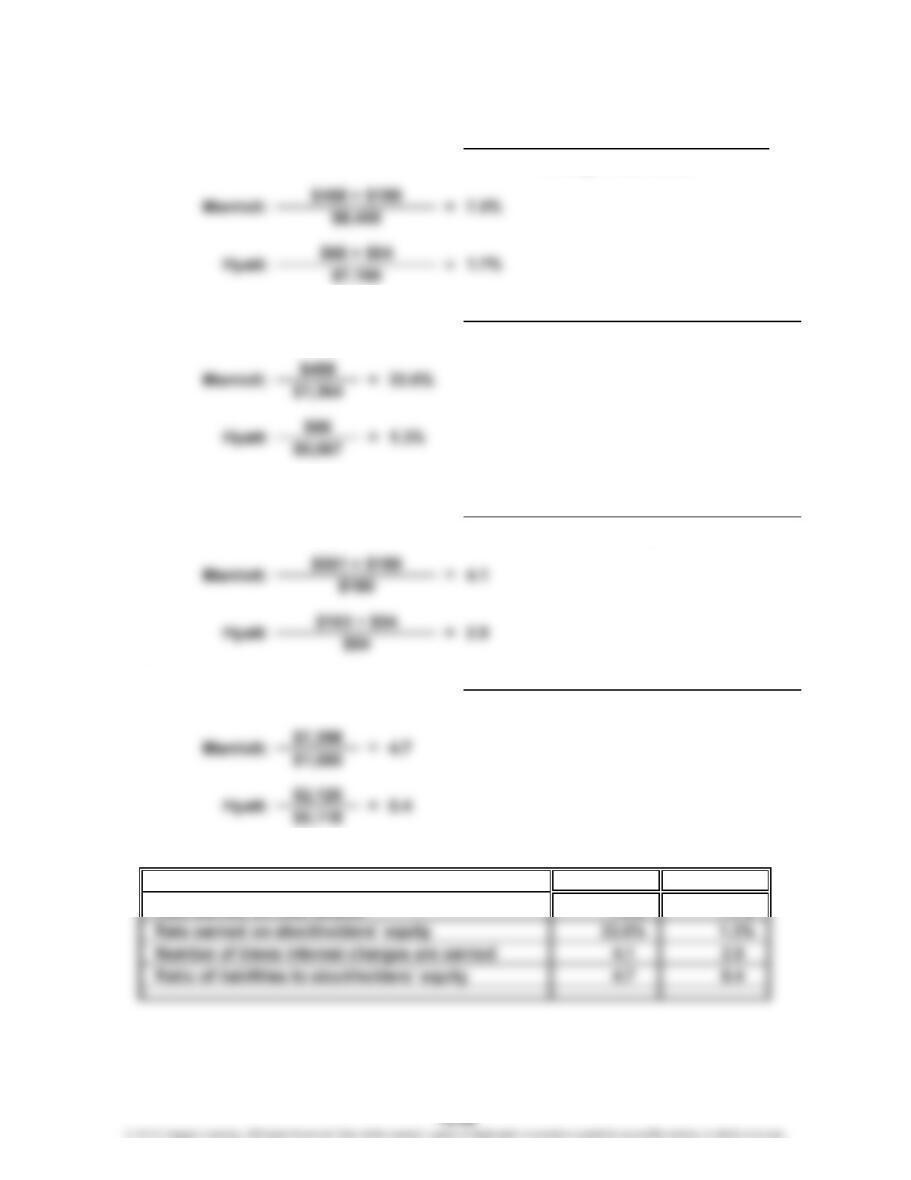
CP 15–5
b.
c.
d.
Summary Table:
Marriott Hyatt
Rate earned on total assets 7.5% 1.7%
Rate Earned on Total Assets
=Total Liabilities
Total Stockholders’ Equity
1.
Ratio of Liabilities to
Stockholders’ Equity
a.
Number of Times Interest
Charges Are Earned
Rate Earned on
Stockholders’ Equity
=Net Income + Interest Expense
Average Total Assets
=Net Income
Average Total Stockholders’ Equity
Interest Expense
=
Income Before Income Tax
+ Interest Expense
CP 15–5 (Concluded)
2. Marriott has a higher rate earned on total assets (7.5% vs. 1.7%), and a higher
rate on stockholders’ equity (33.6% vs. 1.3%), compared to Hyatt. Hyatt’s weaker
performance relative to Marriott appears to be due to its weak earnings relative